ska-sdp.orgska-sdp.org/.../ska-tel-lfaa-0600054-02_aavs1...0.docx · web viewska-sdp.org
TRANSCRIPT

Name
Designation Affiliation Signature
Authored by:
A. MagroSubject Matter Expert
AADCDate:
Owned by:
M. Waterson AA Domain Specialist SKAO
Date:
Approved by:
P. Gibbs Engineering Project
Manager
SKAODate:
Released by:
J. G. Bij de Vaate Consortium Lead AADC
Date:
AAVS1 SOFTWARE DEMONSTRATOR DESIGN REPORTDocument number........................................................................SKA-TEL-LFAA-060054Context...................................................................................................................... DRERevision........................................................................................................................02Author..............................................................................A. Magro, A. DeMarco, J. BorgDate...............................................................................................................2019-02-12Document Classification............................................................FOR PROJECT USE ONLYStatus.................................................................................................................Released

DOCUMENT HISTORYRevision Date Of Issue Engineering Change
NumberComments
A 2018-06-04 - Draft Template version released within consortium
B 2018-10-24 First round of revisions
01 2018-10-31 Formal Release
02 2019-02-12 Implemented CDR panel OARs:
LFAA Element CDR_OAR_MCCS Software Demonstrator Report
OARs: 2, 4, 10
DOCUMENT SOFTWAREPackage Version Filename
Wordprocessor MsWord Word 2016 document.docx
Block diagrams
Other
ORGANISATION DETAILSName Aperture Array Design and Construction Consortium
Registered Address ASTRONOude Hoogeveensedijk 47991 PD DwingelooThe Netherlands+31 (0)521 595100
Fax. +31 (0)521 595101Website www.skatelescope.org/lfaa/
CopyrightDocument owner Aperture Array Design and Construction Consortium
This document is written for internal use in the SKA project
Document No.:Revision:Date:
Error: Reference source not foundError: Reference source not foundError: Reference source not found
Error: Reference source notfound
Author: A. Magro et al.Page 2 of 151

TABLE OF CONTENTS1 INTRODUCTION..........................................................................................10
1.1 Purpose of document..........................................................................................................101.2 Scope of document..............................................................................................................101.3 Intended Audience...............................................................................................................101.4 Document Overview............................................................................................................10
2 REFERENCES..............................................................................................112.1 Reference documents..........................................................................................................11
3 AAVS1 OVERVIEW.....................................................................................123.1 AAVS1 Overview..................................................................................................................123.2 TPM and Firmware Overview..............................................................................................13
3.2.1 UCP..............................................................................................................................133.2.2 TPM Firmware/Software Interface..............................................................................143.2.3 AAVS1 Firmware Overview..........................................................................................16
3.3 Software Overview..............................................................................................................173.4 Prototype Analysis and Decisions........................................................................................18
4 TPM MONITORING AND CONTROL................................................................204.1 Access Layer and PyFABIL....................................................................................................204.2 AAVS1 Plugins......................................................................................................................234.3 AAVS1 Tile............................................................................................................................244.4 AAVS1 Station......................................................................................................................24
5 HARDWARE MONITORING AND CONTROL........................................................255.1 Switches...............................................................................................................................255.2 PDUs....................................................................................................................................255.3 Compute Server...................................................................................................................26
6 DATA ACQUISITION AND CORRELATION...........................................................276.1 SPEAD Formats....................................................................................................................276.2 Data Acquisition...................................................................................................................276.3 Data Consumers...................................................................................................................296.4 Diagnostic Results................................................................................................................306.5 Correlator............................................................................................................................32
7 BANDPASS FLATTENING, CALIBRATION AND POINTING........................................357.1 pyTCPO................................................................................................................................35
7.1.1 Modularity and Message Passing.................................................................................357.1.2 Pipeline and Module Life Cycle....................................................................................367.1.3 Archiving......................................................................................................................377.1.4 Pipeline Abstraction and Parallelisation.......................................................................38
7.2 Calibration...........................................................................................................................387.2.1 pyTCPO Calibration Pipeline.........................................................................................39
7.3 Bandpass Fitting Pipeline.....................................................................................................407.4 Pointing................................................................................................................................41
8 AAVS1 TANGO PROTOTYPE OVERVIEW........................................................42Document No.:Revision:Date:
Error: Reference source not foundError: Reference source not foundError: Reference source not found
Error: Reference source notfound
Author: A. Magro et al.Page 3 of 151

8.1 Overview..............................................................................................................................428.2 LMC Infrastructure...............................................................................................................428.3 Hardware Device Monitoring and Control...........................................................................458.4 Observation Monitoring and Control...................................................................................468.5 Maintenance and Execution Support Tools.........................................................................478.6 LMC Deployment and Management Tools...........................................................................48
9 AAVS1 HARDWARE AND SOFTWARE DEPLOYMENT...........................................499.1 Rack Assembly.....................................................................................................................499.2 Network Configuration........................................................................................................509.3 Server Configuration............................................................................................................51
10 PERFORMANCE BENCHMARKS.....................................................................5210.1 DAQ.....................................................................................................................................5210.2 Correlator............................................................................................................................5210.3 Calibration...........................................................................................................................53
11 SIMULATORS AND EMULATORS...................................................................5411.1 TM Emulator........................................................................................................................5411.2 TPM Simulator.....................................................................................................................56
12 APPENDIX A: TILE API..............................................................................59
13 APPENDIX B: AAVS-1 LMC PROTOTYPE......................................................6513.1 Notation...............................................................................................................................6513.2 LMC Infrastructure View......................................................................................................65
13.2.1 Context Diagram..........................................................................................................6713.2.2 Primary Presentation...................................................................................................68
13.2.2.1 External Interfaces...............................................................................................68
13.2.2.2 Internal Interfaces................................................................................................69
13.2.3 Element Catalog...........................................................................................................7213.2.3.1 AAVSLogger Device Element................................................................................74
13.2.3.2 AAVSDevice Element............................................................................................76
13.2.3.3 AlarmStream Device Element..............................................................................78
13.2.3.4 EventStream Device Element...............................................................................79
13.2.3.5 DiagnosticsStream Device Element......................................................................80
13.2.3.6 GroupDevice Element..........................................................................................83
13.2.3.7 JobDevice Element...............................................................................................84
13.2.4 General Element Behaviour.........................................................................................8513.2.4.1 Reporting Behaviour............................................................................................85
13.2.4.2 Logging Behaviour................................................................................................86
13.2.4.3 Alarm Behaviour..................................................................................................88
13.2.4.4 Event Behaviour...................................................................................................91
13.2.4.5 General Exception Handling Flow........................................................................92
13.3 Hardware Monitoring and Control View..............................................................................94
Document No.:Revision:Date:
Error: Reference source not foundError: Reference source not foundError: Reference source not found
Error: Reference source notfound
Author: A. Magro et al.Page 4 of 151

13.3.1 Context Diagram..........................................................................................................9413.3.2 Primary Presentation...................................................................................................9713.3.3 Element Catalog...........................................................................................................97
13.3.3.1 Antenna...............................................................................................................98
13.3.3.2 PDU......................................................................................................................99
13.3.3.3 Switch.................................................................................................................102
13.3.3.4 Server.................................................................................................................103
13.3.3.5 Rack....................................................................................................................104
13.3.3.6 Tile.....................................................................................................................106
13.4 Observation Monitoring and Control View........................................................................11213.5.1 Context Diagram........................................................................................................11213.5.2 Primary Presentation.................................................................................................11413.5.3 Element Catalog.........................................................................................................115
13.5.3.1 AAVS Master Controller (LMC Device)...............................................................115
13.5.3.2 Observation Configuration.................................................................................119
13.5.3.3 Observation........................................................................................................121
13.5.3.4 Station................................................................................................................123
13.5.3.5 DAQ (Data Acquisition) Job................................................................................125
13.5.3.6 Bandpass Calibration and Pointing Jobs.............................................................127
13.6 Maintenance and Execution Support View........................................................................12813.6.1 Context Diagram........................................................................................................12813.6.2 Primary Presentation.................................................................................................12913.6.3 Element Catalog.........................................................................................................130
13.6.3.1 The LMC API (LMC Backend)..............................................................................130
13.6.3.2 Graphical User Interface (GUI)...........................................................................131
13.6.3.3 Command Line Interface (CLI)............................................................................139
13.7 LMC Deployment and Management View.........................................................................14113.7.1 Context Diagram........................................................................................................14113.7.2 Primary Presentation.................................................................................................14213.7.3 Element Catalogue.....................................................................................................142
13.7.3.2 ALARMCTL (Alarm Control)................................................................................145
13.8 Conclusion.........................................................................................................................146
Document No.:Revision:Date:
Error: Reference source not foundError: Reference source not foundError: Reference source not found
Error: Reference source notfound
Author: A. Magro et al.Page 5 of 151

LIST OF FIGURESFigure 3-1. AAVS1 layout showing the roles of the Signal Processing System and MCCS Server hosting
the software and LMC...............................................................................................................12Figure 3-2. TPM block diagram showing the three main sub units: DAQ Units, Processing Unit and
M&C Unit...................................................................................................................................13Figure 3-3. Outline processing flow for Tile and Station beamforming...............................................16Figure 4-1. Schematic of Access Layer and associated Python interface (PyFABIL).............................21Figure 4-2. Python wrapper plugin pseudo code.................................................................................23Figure 6-1. DAQ Schematic..................................................................................................................28Figure 6-2. Integrated bandpass from one TPM, showing inputs from a single PREADU/polarisation.
RMS level of ADC input is shown in legend...............................................................................30Figure 6-3. Integrated channel data used to check stability of a channel over four days....................31Figure 6-4. Integrated channel data use to generate waterfall plot over four days............................31Figure 6-5. Station beam over 5 hours when galactic centre is close to zenith...................................32Figure 6-6. Full station correlation matrix...........................................................................................33Figure 6-7. Amplitude vs UV plot calculated from correlation matrix.................................................34Figure 7-1. Module fan-in message passing.........................................................................................36Figure 7-2. Pipeline and module life cycle...........................................................................................36Figure 7-3. RFI detection on antenna bandpass..................................................................................41Figure 8-1: Primary presentation of the AAVS LMC top-level devices.................................................43Figure 8-2: Primary presentation component and connector diagram. This shows the main internal
interfaces involved in the AAVS LMC Infrastructure..................................................................44Figure 8-3: Components defined for hardware devices, collectively forming a hierarchy of monitoring
and control functionality all the way up to the AAVS Master device........................................46Figure 8-4: : The primary components involved in the setup and execution of an observation in AAVS.
..................................................................................................................................................47Figure 9-1. AAVS1 rack configuration..................................................................................................49Figure 11-1. TM emulator high-level architecture...............................................................................54Figure 11-2. TM Emulator monitoring page screenshot......................................................................55Figure 11-3. TM emulator observation creation page screenshot.......................................................56Figure 11-4. Simulating TPM FPGA temperature after programming..................................................57Figure 13-1: Colour-coded notation for component and connector diagrams....................................65Figure 13-2: Component and Connector, high level context diagram.................................................66Figure 13-3: Context diagram for the main use cases for LMC infrastructure.....................................68Figure 13-4: Primary presentation component and connector diagram.............................................69Figure 13-5: Primary presentation component and connector diagram. This shows the main internal
interfaces involved in LMC Infrastructure.................................................................................70Figure 13-6: Base classes class diagram...............................................................................................73Figure 13-7: Activity diagram for AAVS device JSON report generation..............................................86Figure 13-8: Log message sequence diagram......................................................................................87Figure 13-9: Abstract attribute-based alarm quality behaviour for TANGO core alarm system..........88Figure 13-10: Alarm activity diagram...................................................................................................89Figure 13-11: Activity diagram for event generation...........................................................................91Figure 13-12: AAVS LMC exception handling flow...............................................................................92Figure 13-13: Monitoring and control elements have a narrow interface defined by the TANGO
framework. Within this framework, there a number of primary use-cases required for monitoring and control.............................................................................................................95
Figure 13-14: Unified activity for TANGO clients during run-time of the AAVS LMC system...............96
Document No.:Revision:Date:
Error: Reference source not foundError: Reference source not foundError: Reference source not found
Error: Reference source notfound
Author: A. Magro et al.Page 6 of 151

Figure 13-15: Components defined for hardware devices, collectively forming a hierarchy of monitoring and control functionality all the way up to the AAVS Master device......................97
Figure 13-16: Antenna device class diagram (inherits from AAVSDevice)...........................................98Figure 13-17: PDU device class diagram (inherits from AAVSDevice)..................................................99Figure 13-18: PDU polled check for port status.................................................................................101Figure 13-19: Switch device class diagram (inherits from AAVSDevice)............................................102Figure 13-20: Class diagram for a server device (inherits from AAVSDevice)....................................103Figure 13-21: Class diagram for a Rack device (inherits from GroupDevice).....................................104Figure 13-22: Tile class diagram, attributes (left) and command (right) - inherits from GroupDevice
................................................................................................................................................106Figure 13-23: Tile ping() health-check...............................................................................................112Figure 13-24: Context diagram for Observation creation and monitoring.........................................113Figure 13-25: The primary components involved in the setup and execution of an observation in
AAVS........................................................................................................................................114Figure 13-26: LMC Master device class diagram (inherits from GroupDevice)..................................115Figure 13-27: Observation configuration device class diagram.........................................................119Figure 13-28: Observation device class diagram (inherits from GroupDevice)..................................121Figure 13-29: Station device class diagram (inherits from GroupDevice)..........................................123Figure 13-30: DAQJob device class diagram (inherits from Job device).............................................125Figure 13-31: Primary use-cases for maintenance and execution support arising from the AAVS LMC
software system......................................................................................................................129Figure 13-32: AAVS local monitoring and control overview..............................................................130Figure 13-33: REST API to TANGO – Request-Reply Flow..................................................................133Figure 13-34: Publish-subscribe from TANGO to HTTP GUI via Websockets.....................................134Figure 13-35:Context diagram for LMC deployment and management............................................141Figure 13-36: Primary presentation for LMC deployment and management....................................142
LIST OF TABLESTable 4-1. Plugins developed for AAVS1..............................................................................................23Table 6-7. Data consumers implemented in the DAQ.........................................................................29Table 9-1. AAVS1 IP assignment..........................................................................................................50Table 10-1. DAQ CPU and memory benchmarks.................................................................................52Table 10-2. Correlator GPU benchmarks.............................................................................................53Table 13-1: TM to AAVS information flow description........................................................................67Table 13-2: Information flow between all major LMC infrastructure components and TM................69Table 13-3: Information flow between all major LMC infrastructure components.............................70Table 13-4: AAVSLoggerDevice base class property descriptions........................................................74Table 13-5: AAVSLoggerDevice base class command descriptions......................................................74Table 13-6: AAVSLoggerDevice base class helper method descriptions..............................................76Table 13-7: AAVSDevice base class property descriptions...................................................................76Table 13-8: AAVSDevice base class command descriptions.................................................................77Table 13-9: AlarmStreamDevice base class property descriptions......................................................78Table 13-10: AlarmStreamDevice base class command descriptions..................................................78Table 13-11: EventStreamDevice base class property descriptions.....................................................79Table 13-12: EventStreamDevice base class command descriptions...................................................79Table 13-13: EventSTreamDevice base class helper method descriptions..........................................80
Document No.:Revision:Date:
Error: Reference source not foundError: Reference source not foundError: Reference source not found
Error: Reference source notfound
Author: A. Magro et al.Page 7 of 151

Table 13-14: DiagnosticsStreamDevice base class property descriptions............................................81Table 13-15: DiagnosticsStreamDevice base class command descriptions..........................................81Table 13-16: GroupDevice base class property descriptions...............................................................83Table 13-17: GroupDevice base class command descriptions.............................................................83Table 13-18: JobDevice base class property descriptions....................................................................84Table 13-19: JobDevice base class command descriptions..................................................................84Table 13-20: A summary of TANGO exception types and their causes................................................93Table 13-21: Helper methods in the AAVSCTL tool............................................................................145
Document No.:Revision:Date:
Error: Reference source not foundError: Reference source not foundError: Reference source not found
Error: Reference source notfound
Author: A. Magro et al.Page 8 of 151

LIST OF ABBREVIATIONS
AADC................................. Aperture Array Design and construction ConsortiumAAVS................................. Aperture Array Verification SystemADC................................... Analog to Digital converterAd-n.................................. nth document in the list of Applicable DocumentsAIV.................................... Assembly Integration and VerificationAPI..................................... Application Programming InterfaceCDR................................... Critical Design ReviewCI....................................... Configuration ItemCOTS................................. Commercial Off The ShelfCPF.................................... Central Processing FacilityCM.................................... Configuration ManagerDMS.................................. Document/Data Management SystemECP.................................... Engineering Change ProposalEMI.................................... Electro Magnetic InterferenceFoV.................................... Field of ViewFPGA................................. Field Programmable Gate ArrayFTR.................................... Full Text RetrievalHW.................................... HardwareICD.................................... Interface Control DocumentINFRAAUS.......................... Infrastructure AustraliaISO.................................... International Organisation for StandardisationLFAA.................................. Low Frequency Aperture ArrayLFAA-DN............................ Low Frequency Aperture Array – Data NetworkLNA................................... Low Noise AmplifierLMC................................... Local monitoring and ControlMCCS................................. Monitor, Control and Calibration serversMRO.................................. Murchison Radio-astronomy ObservatoryMWA................................. Murchison Widefield arrayRD-N.................................. nth document in the list of Reference DocumentsRF...................................... Radio FrequencyRFI..................................... Radio Frequency InterferenceRFoF.................................. Radio Frequency signal over FibreRPF.................................... Remote Processing FacilitySaDT.................................. Signal and Data TransportSDP.................................... Signal Data ProcessingSKA.................................... Square Kilometre ArraySKA-LOW........................... SKA low frequency part of the full telescopeSKAO................................. SKA OfficeS/N.................................... Signal to noiseSW..................................... SoftwareTCP-IP................................ Transmission Control Protocol – Internet ProtocolTBC.................................... To Be ContinuedTBD................................... To Be DoneTM..................................... Telescope ManagementTPM................................... Tile Processor ModuleWBS.................................. Work Breakdown Structure WP.................................... Work Package
Document No.:Revision:Date:
Error: Reference source not foundError: Reference source not foundError: Reference source not found
Error: Reference source notfound
Author: A. Magro et al.Page 9 of 151

1 Introduction1.1 Purpose of document
The purpose of this document is to describe the software implementation and deployment environment of the AAVS1 station deployed at the Murchison Radio Observatory and provide and provide architectural and design rational to the MCCS architecture, software and design documents.
1.2 Scope of document
This document described how several L1 requirements have been addressed and prototyped for testing on the AAVS1 prototype platform and provides support for conformance of the MCCS software architecture to the flowed down L3 requirements. It also acts as a demonstrator for several aspects of the MCCS software architecture and provides design rational for certain decision which were adopted in for this architecture.
1.3 Intended Audience
This document is expected to be used by the LFAA Element Consortium Engineering and Management Team and the SKAO System Engineering Team and SKAO LFAA Project Manager. This document is expected to be read by the external CDR review panel
1.4 Document Overview
This document follows a template that was agreed to between the SKAO and the LFAA Consortium. It covers the key contents called out in the LFAA SOW [RD4].
Detailed information is contained in reference documents.
1.1
Document No.:Revision:Date:
Error: Reference source not foundError: Reference source not foundError: Reference source not found
Error: Reference source notfound
Author: A. Magro et al.Page 10 of 151

2 References2.1 Reference documents
The following documents are referenced in this document. In the event of conflict between the contents of the referenced documents and this document, this document shall take precedence.
[RD1] SKA1 Control System Guidelines, 000-000000-010 Issue 01[RD2] SKA Operational Modes and Health Monitoring, SKA-TEL-SKO-0000267 Issue B[RD3] LFAA Digital System Requirements Specification, SKA-TEL-LFAA-0500034, Issue A[RD4] LFAA Signal Processing System Detailed Design Document, SKA-TEL-LFAA-0500035, Issue
A14[RD5] LFAA Signal Processing System Prototyping Test Report[RD6] SKA1 Element Statement of Work[RD7] SPEAD: Streaming Protocol for Exchanging Astronomical Data, SSA4700-0000-001, Issue 01[RD8] M. A. Clark, P. C. La Plante, and L. J. Greenhill, "Accelerating Radio Astronomy Cross-
Correlation with Graphics Processing units", [arXiv:1107.4264 [astro-ph]].[RD9] LFAA Internal ICD, SKA-TEL-LFAA-0200030, Issue F
Document No.:Revision:Date:
Error: Reference source not foundError: Reference source not foundError: Reference source not found
Error: Reference source notfound
Author: A. Magro et al.Page 11 of 151

3 AAVS1 Overview
This section provides an overview of the AAVS1 architecture and deployment, on which the developed software tools and libraries are based. This includes a general AAVS1 overview, an overview of the TPM, including a description of how monitoring and control is implemented and an overview of the AAVS1 firmware, as well an overview of the software developed for AAVS1.
3.1 AAVS1 Overview
In the architecture of the AAVS, as shown in Figure 3-1, the Radio-Frequency (RF) signals from the antennas are transported over optical fibre to the MRO main building where they are digitized, channelized and beamformed together in order to form logical stations which include 256 double polarization antennas each. The AAVS1 design envisages one full station and three small stations. Within a station the antennas are further grouped in tiles of 16 antennas where each tile is processed in a TPM. The TPMs within a station communicate through a 40GbE network enabling them to transfer data across a station, thus implementing a distributed beamformer which is able to beamform all the 256 antennas belonging to the same station.
Figure 3-1. AAVS1 layout showing the roles of the Signal Processing System and MCCS Server hosting the software and LMC
The MCCS server hosts the software libraries and tools describes in this document, as well as the LMC system implemented in TANGO and the TM emulator. The LMC system and TM emulator are hosted on separate virtual machines so as to isolate them from the actual system. The LMC system makes use of the APIs made available by the software libraries described in this document, however these tools were also installed on the host as well to be used for debugging, testing and verification.
The MCCS contains an NVIDIA Titan X GPU which is used for correlation, a dual 40Gb network adapter to connect it to the 40Gb network,
Document No.:Revision:Date:
Error: Reference source not foundError: Reference source not foundError: Reference source not found
Error: Reference source notfound
Author: A. Magro et al.Page 12 of 151

3.2 TPM and Firmware Overview
The TPM is a custom digital board developed specifically for AAVS1 and LFAA. The main functions which need to be performed by the TPM include:
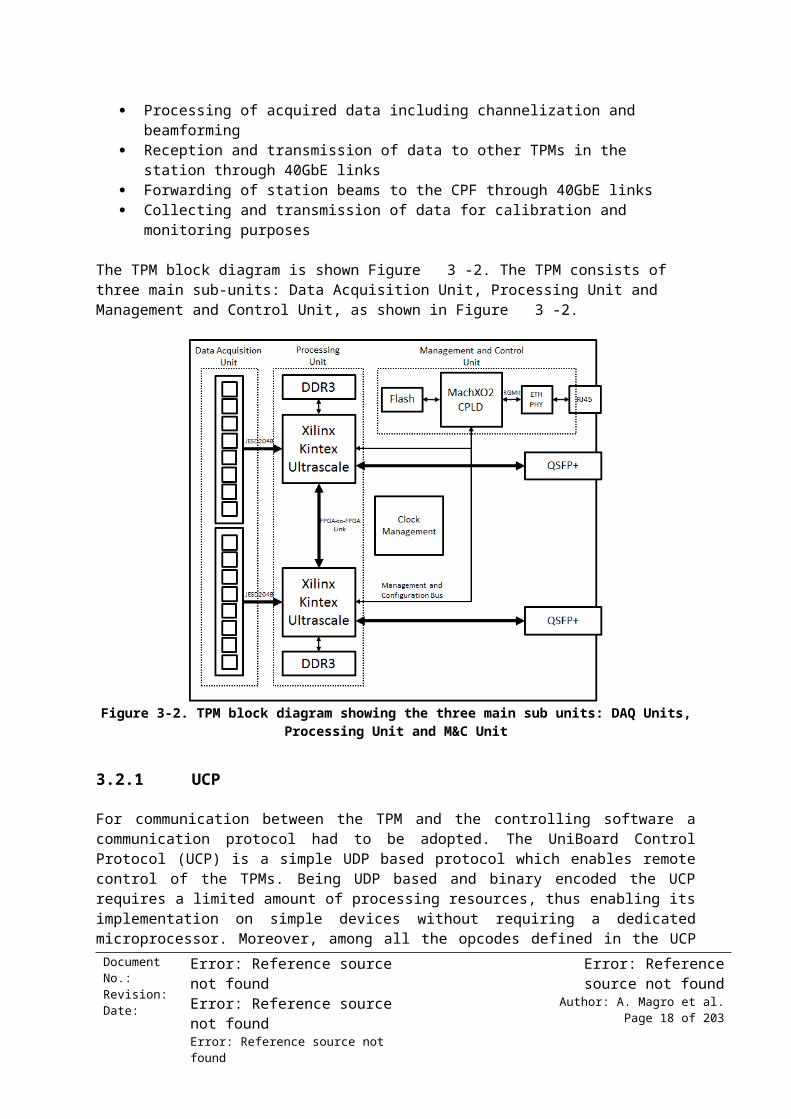
Acquisition of 32 analogue inputs corresponding to 16 double polarization antennas Analog to digital conversion with sampling rate up to 1 GSPS Processing of acquired data including channelization and beamforming Reception and transmission of data to other TPMs in the station through 40GbE links Forwarding of station beams to the CPF through 40GbE links Collecting and transmission of data for calibration and monitoring purposes
The TPM block diagram is shown Figure 3-2. The TPM consists of three main sub-units: Data Acquisition Unit, Processing Unit and Management and Control Unit, as shown in Figure 3-2.
Figure 3-2. TPM block diagram showing the three main sub units: DAQ Units, Processing Unit and M&C Unit
3.2.1 UCP
For communication between the TPM and the controlling software a communication protocol had to be adopted. The UniBoard Control Protocol (UCP) is a simple UDP based protocol which enables remote control of the TPMs. Being UDP based and binary encoded the UCP requires a limited amount of processing resources, thus enabling its implementation on simple devices without requiring a dedicated microprocessor. Moreover, among all the opcodes defined in the UCP specification a subset has been chosen which enables basic read and write access to memory or memory-mapped registers. This choice permits to simplify the hardware requirements for the management of the UCP, delegating more complex functions to the higher-level software where they are more easily and economically implemented. A UCP command starts immediately after the UDP header in a frame. Each packet is represented by a 32-bit Packet Sequence Number (PSN),
Document No.:Revision:Date:
Error: Reference source not foundError: Reference source not foundError: Reference source not found
Error: Reference source notfound
Author: A. Magro et al.Page 13 of 151

which is composed of a client-defined sequence number combined with the sender’s IP address and originating UDP port number, forming a unique triple. A command is uniquely identified with an operation code, OPCODE, representing the requested function. Depending on the requested command, the OPCODE is then followed by a field containing the number of operands after which the actual operands follow. The UCP packet format, as well as the relevant opcodes used by the TPM are shown below.
32-bits Variable length, must be greater than 0 bytesPacket Sequence Number Commands/Replies (depending on command or reply packet)
OPCODE 0x1Command Read Read N consecutive 32-bit locations starting at
START ADDRESSArgument 1 N (32-bits) Number of 32-bit words to readArgument 2 32-bit START ADDRESS Start addressReplies ADDRESS + N*32-bit Data Success. START ADDRESS followed by N*32-bits
NOT ADDRESS Failure
OPCODE 0x2Command Write Write N consecutive 32-bit locations starting at
START ADDRESSArgument 1 N (32-bits) Number of 32-bit words to writeArgument 2 32-bit START ADDRESS Start addressArgument 3 N * 32-bit DATA Data to writeReplies ADDRESS Success
NOT ADDRESS Failure
The CPLD firmware includes a commercial UDP VHDL which supports multi-socket capabilities and is able to process data at wire speed. Incoming UDP packets are decoded, validated and forwarded to the UCP finite state machine (FSM) which is responsible for decoding the UCP packet and performing the corresponding access on a Wishbone local bus. The UCP FSM is also responsible for instructing the UDP core to transmit the UCP reply back to the remote agent. All major interfaces, including SPI, Flash and FPGAs, are memory-mapped on the CPLD Wishbone bus and are available to the remote agent.
3.2.2 TPM Firmware/Software Interface
When developing a complex system where software entities interact with hardware components, it is of primary importance that the relevant information regarding the operation of the hardware is transferred to the controlling software in a consistent way, minimizing the possibility of inconsistency between them. In the TPM development the principles behind the FW/SW interface model have been kept as simple as possible: a VHDL developer designs a firmware component and defines some control/status registers that must be memory mapped in the CPLD memory space. These registers are then accessed by the software by means of UCP commands that are executed by the CPLD. In this simple interface model consistency between firmware and software implementations requires that the former exposes a certain number of memory mapped registers and the latter accesses those registers in the intended way. In the TPM the information regarding the implemented registers in the running firmware is coded in an XML file, which in fact is used in
Document No.:Revision:Date:
Error: Reference source not foundError: Reference source not foundError: Reference source not found
Error: Reference source notfound
Author: A. Magro et al.Page 14 of 151

two ways: firstly, it is the starting point for the automatic generation of VHDL code implementing the registers interface; secondly, it is embedded into the FPGA bitstream by means of a completely automated toolchain. In this way consistency between the XML representation of the memory map and the current bitstream is guaranteed.
Registers in a memory map can be logically split into components or blocks (such as channelizer, beamformer, calibrator and so on), and in turn each register can be composed of multiple bit-fields, where disjoint sets of bits have different interpretations in the firmware. It is natural to handle this type of structures in a hierarchical way using tree structures. Starting from a root node, representing a TPM memory map, the first level child nodes represent components, the second level nodes represent registers and third level nodes represent bit-fields. In the TPM these trees take the form of an XML file. Depending on its role, each XML node can have a number of attributes defined:
id, which is the register, memory or bit-field name/mnemonic address, specifying the registers physical address permission, specifying the access permission for the register or memory block (read, write or
read-write) size, the size in words of the register or memory block, the default being 1 (32-bits) mask, indicating which bits of the register compose a bit-field description which is a textual description for the register.
The above attributes form the essential attribute set that constitutes the information enabling the software to perform basic accesses to memory mapped registers. When a name to physical address translation routine is implemented in the software, register can be transparently displaced within the memory map.
In order to support the generation of VHDL code, the structure above is further expanded both hierarchically and in the number of defined attributes. The hierarchical expansion consists of the possibility of a) grouping together sets of registers by defining deeper structures of nodes and b) embedding a component into the current node by linking an existent XML file, thus enabling the reuse of predefined register interfaces. Within this hierarchical representation, the actual physical address of a node is calculated by traversing the XML tree from the considered node to the root node and accumulating the value of the address attribute. The following firmware specific attributes are also added to the previous ones:
permission, which controls the access type from the firmware user logic for which three modes are available: continuous write, write with enable and no write (the user logic can always read the register)
hw_prio, which controls the priority between user logic and bus when a simultaneous write (at the same clock edge) occurs
hw_rst which specifies the value that the register should assume after reset hw_dp_ram, which in case of a node having size greater than 1, controls the instantiation of
a dual port block RAM having one port connected to the bus logic and the other available to the user logic (the block RAM can be further customized by specific attributes controlling data width, initialization via binary or hexadecimal file and read latency on both ports)
array, which replicates the underlying node structure by the specified number of times (the offset between each array element is specified by the related attribute array_offset)
link, which links the specified XML register specification file to the current node
Document No.:Revision:Date:
Error: Reference source not foundError: Reference source not foundError: Reference source not found
Error: Reference source notfound
Author: A. Magro et al.Page 15 of 151

3.2.3 AAVS1 Firmware Overview
Figure 3-3. Outline processing flow for Tile and Station beamforming.
The firmware developed for AAVS1 is based on the L1 LFAA requirements and is shown in Figure 3-3. Most of the signal processing blocks are implemented as individual components which are then combined when the bitfile is generated. Each component has an associated entry in the XML map, and many require software control so that they can be initialised, monitored, controlled and updated (such as periodic updating of the calibration and pointing coefficients). The signal processing chain performs the following actions, described in greater detail [RD4]:
1. Digitize the analogue signal using 7.8-bit (ENOB) high speed digitizers
2. Correct ① for static delay due to cable mismatch
3. Channelize ② the bandwidth into relatively narrow <1MHz channels for a phase shift-controlled delay approximation in the beamforming
4. Select the frequency channels ③ for each beam being formed (a specific frequency channel can be selected multiple times)
5. Calibrate the signal as a function of frequency to compensate for bandpass errors, gain and phase; and correct the polarisation ④ by each frequency channel and pointing direction with a matrix multiply between polarisation samples using complex correction matrix C(f). This also includes the amplitude for the appropriate beamformer weights to each select frequency channel sample. After this stage samples for both polarizations are treated in parallel
6. Apply appropriate beamformer phase ⑤, derived from specified delay and delay rate, to each select frequency channel sample
7. Sum all 16 antenna signals into a tile beam or beams ⑥
8. The tile beam samples formed above are delayed in a memory buffer ⑦ by the appropriate amount to align with an incoming partial beam. The buffer also performs a corner turner operation grouping consecutive time samples for each channel.
9. A partial station beam formed from the summing of other tile processors is routed to this tile processor ⑨
Document No.:Revision:Date:
Error: Reference source not foundError: Reference source not foundError: Reference source not found
Error: Reference source notfound
Author: A. Magro et al.Page 16 of 151

10. The tile beam(s) formed by this tile processor is summed ⑧ with the incoming partial station beam(s)
11. The partial or complete beam(s) formed is then sent to the data network ⑨ for routing either to receiving node (MCCS server or MWA node)
3.3 Software Overview
The operations required for monitoring, control and management of AAVS1 are a subset of those required for LFAA. The software infrastructure is split into multiple components for which requirements are specified. The primary software components are defined below:
Hardware Monitoring and ControlAAVS1 is composed of several types of hardware, TPMs, network switches, PDUs, compute nodes, and so on. In the case of digital processing boards, firmware registers need to be accessed and updated to control a running observation. A software library, PyFabil, was developed to interact with TPMs, described in Section 4. Interfacing libraries were also developed for the other hardware devices, as described in Section 5. These libraries are then wrapped as TANGO devices and controlled by the TANGO LMC system, as described in Section 14.
Data Acquisition and CorrelationThe TPM can send control data which can be used for correlation, bandpass flattening and general diagnosis. The control software must be capable of acquiring and processing this data. Additionally, the control software should be capable of acquiring short segments of the partial and station beams for diagnosis. A high-performance data acquisition library wrapped with a Python interface was developed for this purpose, described in Section 6. This library also includes the correlator which is required for calibrating the stations.
Calibration and Bandpass FlatteningThe LFAA needs to send calibrated, flattened station beams to CSP. Bandpass flattening occurs on the TPM, however truncation parameters (one per group of 8 channels) must be calculated in software. Calibration is required to compensate for environment and instrument induced noise (gain and phase offsets). The L1 requirements for LFAA state that the calibration cycle must be performed every 10 minutes, such that every usable frequency channel must be calibrated every ~1.5 seconds. To this end, a pipelining library was developed which is used to implement the calibration, bandpass flattening and pointing functionality. This library is introduced in Section 7, where the bandpass flattening and calibration pipelines are also described.
PointingTo point a station beam toward a sky location, phase coefficients have to be applied to each antenna and frequency channel. A delay and delay rate per antenna need to be computed by the pointing software, whilst the delay per channel are then calculated on the TPM. The delays and delay rates need to be updated periodically to observe fixed source on the sky. The pointing pipeline is described in Section 7.4.
System Configuration and ManagementThe AAVS1 deployment at the MRO consists of four cabinet housing TPMs, network switches, PDUs and the LMC server, amongst other equipment which cannot be controlled. The deployment is all managed through software deployed on the LMC server, which also controls the network
Document No.:Revision:Date:
Error: Reference source not foundError: Reference source not foundError: Reference source not found
Error: Reference source notfound
Author: A. Magro et al.Page 17 of 151
configuration. Additionally, the LMC server itself has multiple server modules deployed, some of which run in virtualised environments. The management of AAVS1 hardware and software is described in Section 9.
TANGO LMC and AAV1 BackendThis provides a flattened interface to the telescope, such that external users need not be aware of how the internal components are set up, or what technologies are being used. It also makes it easier to change internal components, if required, without affecting the communication mechanism with external entities. This will also implement the TM-LFAA interface. This is described in Section 8.
Telescope Manager EmulatorThe LFAA software system is regarded as a non-intelligent system managed by TM. TM is responsible for, amongst other operations, scheduling observation, decide what happens when faults arise and archiving LMC data. In order to prototype the interaction between LFAA and TM and TM emulator was developed. It implements a small subset of TM’s functionality, essentially those are required for the proof-of-concept of configurability of the LFAA software system. This is described in Section 11.1.
3.4 Prototype Analysis and Decisions
This section describes some aspects of the system which have been re-designed due to an inefficient or ineffective design, as well as describing how some of the concepts presented in this document where not included in the LFAA design.
Low-Level SoftwareAll the low-level software prototyped for AAVS1, including the access-layer, DAQ and correlator meet the LFAA requirement such that, after they are extended to include new functionality and optimised further, they can be used in LFAA
CalibrationThe AAVS1 prototype uses OSKAR as the model visibility generator. After significant testing an issue with OSKAR was discovered in that the antenna element patterns for the AAVS1 (and LFAA) antennas are too complex, and have too much mutual coupling, to be represented accurately in OSKAR. A custom visibility simulator is currently being prototype which can mitigate these issues. It is also an open question whether the average element patters can be used, rather than having to simulate and store the embedded element pattern for all antennas (for all frequency channels and polarizations).
FPGA Board TANGO devicesOne of the early designs of the AAVS prototype and the TANGO implementation for it included the concept of generic FPGA board, with various implementations of boards that maintain a common interface for the various board types in test (TPMs, UniBoards and ROACHes). This concept was eventually scrapped in favour of a more optimised, efficient, and easily maintainable Tile TANGO device which allowed much quicker development and more robust code, around the TPM board. This design was carried over, and further optimised for the LFAA SAD.
Job Interface and ExecutionAnother major concept of the AAVS prototype was the design of an interface for generic Jobs, and implementations of this interface for the different Jobs required e.g. DAQ and Calibration. In this design, there was no involvement of a resource manager on top of a cluster management system.
Document No.:Revision:Date:
Error: Reference source not foundError: Reference source not foundError: Reference source not found
Error: Reference source notfound
Author: A. Magro et al.Page 18 of 151

The end result turned out to be very convoluted, buggy, and tended to hang a big chunk of the control system occasionally – the reasons for which are still undefined. This concept was scrapped for the LFAA SAD design, and the responsibility for running jobs and services was passed on to a cluster/resource manager stack, with a light interface maintained by the LMC system.
TM Emulator RESTful APIA design decision was made for the TM Emulator GUI to be web-based, with a RESTful API to connect the TANGO LMC system with the web framework of choice. At the time the TANGO RESTful API was not developed yet. The RESTful API developed has many concepts which are similar to the current ideas and implementations of the TANGO RESTful API. The LFAA SAD design changes over ad anticipates that any such emulator work for LFAA would be done using the TANGO API.
AAVS LMC Deployment ToolsA lot of work and effort went into developing the ALARMCT and AAVSCTL tools, and whilst most of what is done by these tools can be done outside of them using a combination of TANGO commands and TANGO tools interaction, we found this to be quite cumbersome and very hard to automate. Various iterations of these tools were developed, and we find that the concept can and should be extended for the LFAA architecture.
Document No.:Revision:Date:
Error: Reference source not foundError: Reference source not foundError: Reference source not found
Error: Reference source notfound
Author: A. Magro et al.Page 19 of 151

4 TPM Monitoring and ControlThe TPMs perform all the signal processing in AAVS, including signal digitization, channelization, beamforming and data transmission. It primarily consists of two FPGAs and additional on-board devices, managed by the CPLD. Firmware needs to be compiled and downloaded to the FPGAs. The CPLD can be monitored and controlled via UCP packets, which allows clients to read from and write to memory areas and memory-mapped registers.
4.1 Access Layer and PyFABIL
A hardware monitoring and control module was developed to communicate with TPMs and other digital boards. It presents a uniform layer through which hardware devices can be accessed. This is primarily required for digital processing boards, since they use custom interfacing protocols for which off-the-shelf software is generally not available. This module is composed of two components: a C-like API for communicating with the FPGA boards and a Python module, PyFABIL, which provides higher level functionality for interactive control, maintenance and integration with higher level control software. Figure 4-4 provides an overview of these two components which will be discussed in this section. The C++ layer, which will be referred to as the access layer throughout this paper, implements the UCP protocol and a subset of the KATCP protocol, such that it can communicate with TPMs, UniBoards and ROACHes. The main features of this software layer include: An interface-based design for implementing new board and protocol classes; a single board manager instance capable of communicating with multiple boards, which could be of different types and use different protocols; translation from register name/mnemonic to memory-mapped address on the board; querying the board's status; programming the FPGAs (load firmware) on the board; reading from and writing to memory addresses and SPI devices; and acquisition of register, firmware and devices lists. This interface was implemented in C++ for performance reasons, such that all network communication can be handled in it.
<?xml version="1.0" encoding="ISO-8859-1"?> <node id="regfile"> <node id="rev" address="0x0" mask="0xFFFFFFFF" permission="r" hw_rst="g_rev" description="Revision register"/> <node id="fpga_id" address="0x4" mask="0x00000001" permission="r" hw_rst="no" hw_permission="w" description="FPGA identifier"/> <node id="reset " address="0x10"> <node id="adc" mask="0x00000001" permission="rw" hw_rst="0x1" description="ADC clock domain reset"/> <node id="dsp" mask="0x00000002" permission="rw" hw_rst="0x1" description="DSP clock domain reset"/> </node></node>
Listing 1. XML memory map description example.
For the TPM, an XML file provides a mapping between register and memory block names/mnemonics to memory addresses on the board. Three XML files are required, one for the CPLD firmware itself, and one for the firmware loaded on each FPGA. The same firmware can be loaded on both FPGAs. The number of mappings is different for different boards, such that a ROACH board only has one map whilst a UniBoard can have up to eight mappings, one per FPGA. The access
Document No.:Revision:Date:
Error: Reference source not foundError: Reference source not foundError: Reference source not found
Error: Reference source notfound
Author: A. Magro et al.Page 20 of 151

layer is compiled as a shared library which can either be used directly or through the Python interface.
A Python interface was developed which interfaces with the access layer and provides higher level functionality. It is especially useful for interactive testing and scripting. This interface is also directly used to implement the TAco Next Generation Objects (TANGO) device for the TPM in AAVS for a description of the software monitoring and control infrastructure developed for AAVS). Each block, or layer, in the Python interface expands on the functionality provided by the underlying ones. The interface block encapsulates the API provided by the access layer shared library, allowing higher level components to call C functions directly. This can be used on its own, allowing software developers to implement their own abstract functionality. For AAVS, this interface is used as an aid to the FPGABoard set of classes.
Figure 4-4. Schematic of Access Layer and associated Python interface (PyFABIL)
The FPGABoard is a base class for implementing custom FPGA boards by way of subclassing. It abstracts the function calls exposed by the access layer and imposes states, modes and a Pythonic access mechanism for on-board devices and firmware registers. It provides significant error checking and logging routines to ensure correct operation of the connected boards. Apart from the functions in the low-level API, additional features are also provided, including: The addition of custom board initialization and status checking routines; automatic handling of register bitfields (all shifting and
Document No.:Revision:Date:
Error: Reference source not foundError: Reference source not foundError: Reference source not found
Error: Reference source notfound
Author: A. Magro et al.Page 21 of 151

masking is performed internally); reading and writing of register, memory and SPI values through instance list accessors; and automatic integration of registers as instance attributes (where applicable). For each board class implemented in the access layer, an associated subclass of FPGABoard is also implemented.
The board classes provide limited functionality by themselves, essentially that provided by the access layer. A TPM is composed of a number of on-board devices, such as ADCs, PLLs, the FPGAs themselves, and the CPLD, amongst others. All these devices need to be controlled as well, for example when initializing the board, since all initialization is performed in software. Device-specific routines need to be developed which enable the library to initialize, turn off, monitor and control these devices when and if needed. Additionally, future iterations of the TPM hardware might add, remove or change some of these devices, resulting in a change of the associated software logic. Implementing this functionality in the TPM class would result in a monolithic class, where a change in one part might need to be propagated along different parts of the class. To make matters even more complex, the operations performed by the FPGAs change whenever a new firmware is loaded. The process of loading a new firmware can be seen as a feature expansion of the FPGAs, features which also need to be accessed by the software. To manage all this in an elegant way, the concept of firmware-specific software plugins was adopted.
When firmware is loaded onto FPGAs the functionality of the board changes. Firmware-specific initialization, checks, monitoring and control have to be performed. Generally, this is accomplished by writing custom scripts which utilise the underlying protocol and board wrappers. These scripts are then usually directly integrated into the set of scripts used during the operational lifetime of the instrument. These scripts are disjoint, can be written by different people, and have no consistency, unless this is explicitly enforced. The latter constraint is of particular concern when designing a general monitoring and control framework with multiple states, modes and status check routines.
To address this issue, PyFABIL includes a firmware block plugin mechanism. When a new firmware block is written, where this block can in effect be the entire design, a plugin associated with this firmware must be implemented. This plugin must: subclass the FirmwareBlock abstract class; implement all abstract methods defined in FirmwareBlock; state with which FPGA board this plugin is compatible; implement any custom functions which the developer might deem necessary for the operation of the firmware, and for each, stating within which telescope states they can be called, if applicable; and define which firmware design the plugin is compatible with, including major and minor version ranges. Plugins for on-board devices can also be written, such that these devices can then be accessed and controlled through their associated software plugin.
These plugins can then be dynamically loaded to any board instance during runtime. The abstract methods make sure that all plugins provide sufficient functionality to be able to perform basic tests, initialise the firmware or device, routinely check the status of the firmware or device and perform tests and diagnostic. Plugin instances are added as list attributes (to support multiple instances of the same plugin) of the instantiated board object such that they can be accessed directly. Figure 4-5 shows an example of how plugins can be used in PyFABIL.
Document No.:Revision:Date:
Error: Reference source not foundError: Reference source not foundError: Reference source not found
Error: Reference source notfound
Author: A. Magro et al.Page 22 of 151

Figure 4-5. Python wrapper plugin pseudo code
4.2 AAVS1 Plugins
Table 4-1 lists the PyFABIL plugins developed to support the TPM hardware and firmware
Table 4-1. Plugins developed for AAVS1Plugin Instances DescriptionAAVSFirmware 2 The top level plugin which represents the AAVS firmwareAda 32 Initialise, disable and set gain on on-board ADA chipsAdc 32 Start on-board ADC chipsadcPowerMeter 32 Measures broadband total power level for the input signalsBeamformer 2 Initialises beamformer, provides functions to download
calibration coefficients, pointing delays, beam angles, antenna tapering, setting of beamforming region (multiple beams)
CPLD 1 Reading and writing CPLD bitstreamF2F 4 Initialises FPGA to FPGA lanesFirmwareInformation 3 Gets download bitstream informationFPGA 2 Starts, resets and synchronises on-board FPGA chipsJESD 4 Starts the JESD coresPatternGenerator 2 Can generate JESD, channelised and beamformed data
patterns for testingPLL 1 Configures and starts the on-board PLLPREADU 2 Switches on and allows setting of channel attenuation for
attached PREADU boardsStationBeamfomer 2 Initialises and starts station beamformer, define beam-
channel mapping, definition of CSP SPEAD headerSysmon 2 Provides access to temperature, voltage and current
sensorsTenGCore 8 Initialises 10 Gb core and set networking parameters
(source and destination MAC, IP and port)TestGenerator 2 Programmable test vector generator for testing
Document No.:Revision:Date:
Error: Reference source not foundError: Reference source not foundError: Reference source not found
Error: Reference source notfound
Author: A. Magro et al.Page 23 of 151

4.3 AAVS1 Tile
The low-level functionality defined in the previous sections exposes all the required functionality of the TPM and running firmware and allows for great flexibility in adding more features. This flexibility is especially useful when the new firmware features are being developed, since additional plugins can be defined through which these features can be exposed, as well as providing a useful testing system for the firmware. This implemented functionality is then used by several software components external to the library:
The Tile TANGO device integrates the monitoring and control capabilities of the TPM and running firmware to the rest of the LMC infrastructure
Standalone scripts used for testing, maintenance, manual configuration and so on
For this reason, it is useful to define a fixed interface through which the AAVS1-specific feature of the library can be exposed, a Tile API. This hides the complexity of the library and exposes all the required functionality in a standard way. Additionally, once an API is defined, the LMC infrastructure against a Tile simulator if the latter implement this API as well. The Tile API is defined in Appendix A (Section 12), whilst a description of the TPM simulator developed for AAVS1 is present in Section 11 The following list provides an overview of the functionality provided by this API:
Connect, program, initialise TPM Read sensor information, such as current, voltage and temperatures Register information, providing access to the internal memory map Network configuration Observation related functionality, such as loading calibration coefficients, pointing delays
and channeliser scaling factors Data functions, which instruct the TPM to send several types of LMC data for calibration and
diagnostics
4.4 AAVS1 Station
The PyFABIL library provides management and control functionality for a single TPM, however AAVS1 is composed of multiple TPMs. A station is composed of at most 16 Tiles, and during initialisation these Tiles must first be configured independently (like configuring on board devices and loading firmware) and then various operations in the Tiles must be synchronised. Station-level management code has been developed to be able to performs these operations, including:
Programming and initialising all the TPMs forming the station in parallel Programming the CPLD of multiple TPMs concurrently Equalizing ADC signals across the station Forming the beamforming chain by configuring the 10Gb interfaces on each TPM such that
each TPM send the partially beamformed data to the next TPM in the chain Synchronize tiles, such the time increments to the same value in all tiles at each PPS Configure LMC traffic Apply calibration coefficients synchronously across TPMs Apply pointing delay and delay rates synchronously across TPMs Transmit data (raw, channelised, beamformed etc…) synchronously from all TPMs
Once features were implemented and tested in the standalone station code they were integrated into the TANGO Station device.
Document No.:Revision:Date:
Error: Reference source not foundError: Reference source not foundError: Reference source not found
Error: Reference source notfound
Author: A. Magro et al.Page 24 of 151

5 Hardware Monitoring and Control
Apart from TPMs additional hardware is required to managed power, transmit data, host hardware components, cool TPMs, and so on. Some of these hardware components need to be monitored and controlled through software rather than accessing each component and setting them up manually. For AAVS1 prototype management code for the following hardware devices was developed:
40G network switches, which interconnect the TPMs (and the server) Power Distribution Units (PDUs) which provide power to the TPMs The LMC server, which hosts all the AAVS1 software
5.1 Switches
AAVS1 has a total of seven 40Gb switches distributed across several racks. These switches transport the beamformed as well as M&C data amongst tiles, from tiles to the LMC server and from tiles to the destination of the station beam, which can be a tile (for testing), the LMC server (for diagnostics and commissioning) or any other device accessible via the network. If a switch is faulty then a station cannot be formed properly, so it is vital that switches are monitored. It is also useful to monitor switch metrics, such as the packet statistics on through particular ports. AAVS1 uses Mellanox SX1012 switches which provide the MLNX-OS XML API (SNMP is also provided however this API was easier to work with) that can be used for M&C. Standalone switch management code was developed that uses the API, which was eventually integrated into the TANGO LMC system. The following operations can be performed on AAVS1 switches through switch management code or TANGO Switch device:
Log into the switch Get the configuration of all switch ports Set switch port configuration (such as MTU) Set switch configuration (such as adding entries to the MAC table) Get switch chassis temperature Read ingress rate (in bps) of a switch port Read egress rate (in bps) of a switch port Read RX errors of a switch port Read TX errors of a switch port
5.2 PDUs
Power is supplied to the TPMs through PDUs, one for each rack. The ICT200DB-12IRC PDU is used for AAVS, which provides an SNMP interface through which the PDU can be monitored and controlled. Standalone PDU management code was developed that uses the provided API, which was eventually integrated into the TANGO LMC system. The following operations can be performed on AAVS1 PDUs through PDU management code or TANGO PDU device:
Get PDU voltage and current Get PDU port information (name, enable, output current) Disable PDU port Enable PDU port
Document No.:Revision:Date:
Error: Reference source not foundError: Reference source not foundError: Reference source not found
Error: Reference source notfound
Author: A. Magro et al.Page 25 of 151

5.3 Compute Server
Compute servers are essential for the operations of both the LMC as well as running functional applications, so they also need to be monitored. AAVS1 has only one server, however a monitoring tool for compute servers was prototyped based on Ganglia. When installed on a compute server, ganglia transmit the required metrics to a central location (in AAVS1 this is the same server) where the gmetad service is installed. A TANGO device server then queries this service for metrics which are made available to the rest of the system.
Document No.:Revision:Date:
Error: Reference source not foundError: Reference source not foundError: Reference source not found
Error: Reference source notfound
Author: A. Magro et al.Page 26 of 151

6 Data Acquisition and CorrelationThe AAVS1 firmware can send snapshots from various data taps in the signal processing chain, including raw antenna data, channelized data and beamformed data (the latter two of which can be integrated). Additionally, snapshots from the generate tile beam and station beams need to be received and processed for testing. The data rate for some of these data transmission exceeds 7 Gbps for a station. This data is transmitted using the SPEAD protocol, which is a UDP-based protocol developed for radio astronomy. See [RD7] for a description of the SPEAD protocol.
6.1 SPEAD Formats
The SPEAD protocol is versioned and within a version allows for multiple flavours, with different numbers of bits for item pointer fields. The TPM uses the SPEAD-64-48 flavour (ItemPointerWidth=16bits, HeapAddressWidth=48bits) to support 48bit immediate values. The following relevant SPEAD definitions serve to describe the SPEAD payload:
Item: A Variable transmitted using SPEAD protocol ItemGroup: A Collection of Items (SPEAD variables) to be transmitted Heap: An ItemGroup packaged for transmission as UDP data packets ItemPointer: metadata in packet header containing information how to unpack received datagram ItemDescriptor: ItemDescriptors are used to provide receiving clients with the metadata
required to decode, interpret and unpack Heaps to form ItemGroups as part of a SPEAD stream.
The SPEAD protocol makes provision for a top-level logical group called a heap (i.e. a portion of a data frame). This can consist of several individual packets (UDP/IP packets), each of which contain the same unique SPEAD ID and an appropriate offset into the overall heap for the specific packet in question. As defined, the SPEAD heap will form the smallest individually routable data unit, i.e. all the packets for a specific heap need to be received by a single receiver. The various data frames (antenna, channel, beamformed data) are divided into heaps. The contents of HEAP packets are defined in the LFAA Internal ICD document [RD9].
6.2 Data Acquisition
A high-performance C++ library was developed which is capable of reading in raw Ethernet frames and process them accordingly, shown in Figure 6-6. To handle the various types of data, a consumer-based approach to packet handling is adopted, where a single producer can distribute packets to several specialized consumers based on the lmc_capture_mode defined in the SPEAD packet. The consumers then assemble the heap and generate HDF5 files. The library is wrapped with a Python layer for ease of use. This section describes the design of this library and provides initial benchmarks.
LMC data from each TPM is streamed to the LMC server in AAVS, where it is received, re-combined and stored in custom HDF5 formats. All data streams are sent from specific taps within the firmware signal chain and have varying throughout, from a few Mbps to about 500 Gbps per TPM, whilst the partial station beam from each TPM has a throughput of about 11 Gbps. The receiver software must be capable of receiving streams from all the TPMs with which it is associated. A high performance, extensible C++ library was developed for receiving these data streams. The receiver uses the packet_mmap socket interface to receive raw frames, which provides a size configurable circular
Document No.:Revision:Date:
Error: Reference source not foundError: Reference source not foundError: Reference source not found
Error: Reference source notfound
Author: A. Magro et al.Page 27 of 151
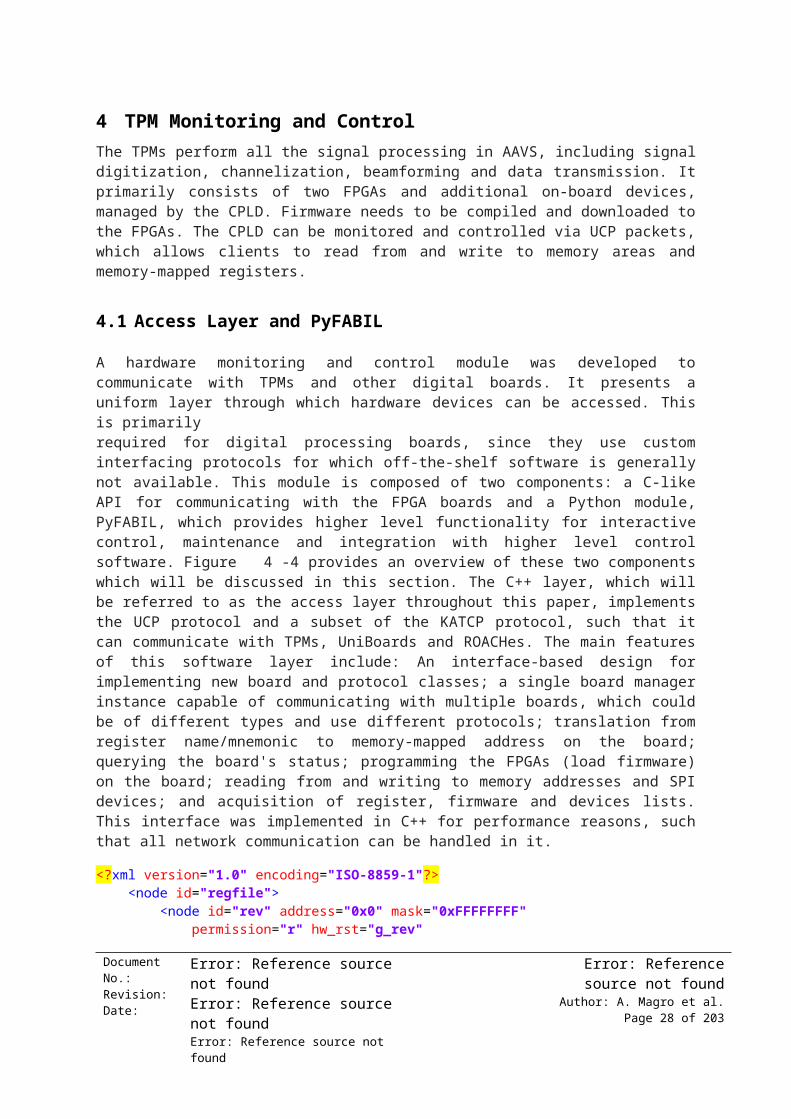
buffer allocated in kernel memory mapped to user memory. This buffer is partitioned in blocks, each containing frames, where each frame is a placeholder for a network packet. With this mechanism, the receiving logic simply waits for a frame to become available in this ring buffer (essentially waiting for a Direct Memory Access (DMA) transfer from the network's internal memory to the circular buffer) with no system calls required. A single receiver instance is mapped to a network interface to which the data will be sent. A packet consumer was written for each data type, each defining a packet filter which is passed to the packet receiver. When a frame arrives, it is passed through all registered consumer filters. If the frame is of interest to a consumer it is placed in a ring buffer associated with the consumer which then acquires data from this buffer and process the packets accordingly. The ring buffer uses atomic memory access primitives to manage concurrent access to its cells, as well as an exponential spin lock for waiting for new packet to arrive without hogging CPU time. Additionally, a Berkeley Packet Filter (BPF) filter was implemented such that raw packet filtering on the socket if performed by the kernel, greatly increasing performance.
Figure 6-6. DAQ Schematic
Document No.:Revision:Date:
Error: Reference source not foundError: Reference source not foundError: Reference source not found
Error: Reference source notfound
Author: A. Magro et al.Page 28 of 151

6.3 Data Consumers
For each LMC data type a consumer was implemented in the DAQ library which knows how to interpret the associated SPEAD payload. Each consumer creates an internal buffer which is big enough to fit the entire SPEAD heap. SPEAD packets (excluding all Ethernet, IP and UDP headers) are read one by one from the associated ring buffer, interpreted, and placed in this internal buffer. When all the SPEAD heap is received (or a timeout occurs), a user-defined callback is called to which a pointer to the data and some additional meta data, most often the timestamp of the first sample in the buffer, is provided. In AAVS1 these callbacks are implemented in Python. A custom HDF5 format was created for antenna, channel, beam, correlated and station data, and the Python callbacks convert the contents of the buffer to an HDF5 file. The Python wrapper also provide an easy way to configure the DAQ and consumers and provide a simple interface which allows external Python libraries and scripts to use the DAQ directly. The list of implemented consumers is listed in Table 6-2.
Table 6-2. Data consumers implemented in the DAQConsumer LMC
ModeDescription
AntennaData 0x0, 0x1 Receives synchronised or non-synchronised raw antenna data from each antenna/pol from all configured TPMs.
ChannelisedData 0x4 Receives several samples from each frequency channel, one at a time (so not synchronised across channels) from all antennas/pols from all configured TPMs. This is the mode used for correlating all the channels within a fixed amount of time, where the number of samples per channel translate to the required correlator integration time
ContinuousChannelisedData 0x5 Continually receives samples from a single frequency channel for all antennas/pol from all configured TPMs until data transmission is stopped
IntegratedChannelisedData 0x6 Configured TPMs integrated the channelised data over the set integration time and transmit the integrated channelised data for all antennas/pols
BeamformedData 0x8 Receives a pre-set (hardcoded in firmware) number tile of beamformed spectra from all configure TPMs
IntegratedBeamformedData 0x9 Configured TPMs integrated the tile beam data over the set integration time and transmit the integrated channelised data for all pols and is received by this consumer
Correlator 0x4, 0x5 Receives channelised or continuous channelised data from all configured TPMs and run the correlator to generate correlation matrices. See Section 6.5
IntegratedStationData CSP Receives the full station beam and integrates this over a user-defined integration time, generating an integrated station beam for each pol
Due to the high data rate of ContinuousChannelisedData, IntegratedStationBeam and Correlator consumer, a double buffering mechanism is employed in the consumer, which is primarily used to
Document No.:Revision:Date:
Error: Reference source not foundError: Reference source not foundError: Reference source not found
Error: Reference source notfound
Author: A. Magro et al.Page 29 of 151

allow for out-of-order packet reception and allows for enough time for writing full buffers to disk (while on buffer is being written to disk the second buffer is being filled in by the consumer).
6.4 Diagnostic Results
The following figure show some diagnostic results obtained through the DAQ system developed for AAVS1 on the deployed AAVS1 station, together with some supporting scripts to generate the plots. Figure 6-7 show the integrated bandpass for one TPM, showing inputs from a single PREADU/polarization along with the RMS for each ADC channel, obtained by acquiring raw antenna and channelised data. Figure 6-8 show stability of a single frequency channel over four days for a single TPM, obtained by acquiring integrated channel data. Figure 6-9 shows the waterfall plot for a single antenna/polarisation over four days, obtained by acquiring channelised data. Figure 6-10 shows the integrated station beam composed of 15 TPMs over hours, with the peak corresponding to the time when the galactic centre was closest to zenith (about 89 degrees), obtained through the IntegratedStationBeam consumer. Although calibration coefficients were applied to the antenna to generate this plot, they were calculate on an older observation so SNR is low.
Figure 6-7. Integrated bandpass from one TPM, showing inputs from a single PREADU/polarisation. RMS level of ADC input is shown in legend
Document No.:Revision:Date:
Error: Reference source not foundError: Reference source not foundError: Reference source not found
Error: Reference source notfound
Author: A. Magro et al.Page 30 of 151
Figure 6-8. Integrated channel data used to check stability of a channel over four days
Figure 6-9. Integrated channel data use to generate waterfall plot over four days
Document No.:Revision:Date:
Error: Reference source not foundError: Reference source not foundError: Reference source not found
Error: Reference source notfound
Author: A. Magro et al.Page 31 of 151

Figure 6-10. Station beam over 5 hours when galactic centre is close to zenith
6.5 Correlator
AAVS1 needs to be calibrated to correct for antenna-dependent gain and phase differences. Each coarse frequency channel must be calibrated in ~1.5 seconds to meet the 10 minute calibration cycle defined in the SKA L1 requirements. In these 1.5 seconds, data from a single coarse channel has to be transmitted from all TPMs, acquired by the DAQ, correlated (using GPUs) to generate the cross-correlation matrix, and passed on to the calibration pipeline which calculates gain and phase solutions. The generated coefficients are then given to the TPMs, which apply them synchronously across all stations. For AAVS1 (and LFAA), the following defines the computational requirements for correlating a 256-element station:
Input data rate 800 MB/sCompute ~820 GFLOPS
Output data rate ~1 MB
The output data is composed of 32-bit floating point values. The correlator in AAVS1 is based on the xGPU GPU correlator [RD8], which was configured for 256 antennas, 2 polarizations, 1 frequency channels (since each frequency channel is processed separately) and a number of samples representing ~1.5 seconds’ worth. The LMC server is equipped with an NVIDIA TITAN X GPU, which takes ~650s MB/s to copy data to GPU memory (performed implicitly by the correlation kernel when accessing the input data), correlate the data and copy the output to CPU memory (performed implicitly as well). When a correlation is performed, the correlator callback is called, which results in an HD5F file containing the correlation matrices being written to disk. This file can then be used for calibrating the station. When this process is complete the calibration application can load the ACM
Document No.:Revision:Date:
Error: Reference source not foundError: Reference source not foundError: Reference source not found
Error: Reference source notfound
Author: A. Magro et al.Page 32 of 151

and perform the computation required to generate the gain and phase coefficients for each antenna/channel. These coefficients need to be delivered to the respective TPMs. Note that RFI flagged channels are excluded from the calibration input data.
The correlation routine (excluding data acquisition and double buffering) was also testing on an NVIDIA P100 connected with NVLink to the main board. Using an integration time of ~1.5 second, which is the minimum time required for LFAA, four concurrent correlation threads were created and run indefinitely, simulating the case where four stations are being correlated concurrently on the same GPU. Each correlation cycle takes ~300ms for a single station, whilst for all station combined the total adds up to ~1.4s due to scheduling and synchronisation overhead on the GPU. This suggests that a single P100 GPU is enough for correlating four stations, assuming that no other processing is being performed on the GPU.
The following two figures show a snapshot of a correlation matrix taken at around 12:00 AWST when the sun is closest to zenith (Figure 6-11) and the resulting amplitude vs UV plot for the same correlation matrix (Figure 6-12). The vertical and horizontal “blue” lines in the correlation matrix represent antenna which are either switched off or have very low power. Note that even if the antenna is switched off there will still be a weak signal, representing the noise response of the PREADU. The antennas can be switched off in firmware, but this wasn’t done for this plot.
Figure 6-11. Full station correlation matrix
Document No.:Revision:Date:
Error: Reference source not foundError: Reference source not foundError: Reference source not found
Error: Reference source notfound
Author: A. Magro et al.Page 33 of 151

Figure 6-12. Amplitude vs UV plot calculated from correlation matrix
Document No.:Revision:Date:
Error: Reference source not foundError: Reference source not foundError: Reference source not found
Error: Reference source notfound
Author: A. Magro et al.Page 34 of 151
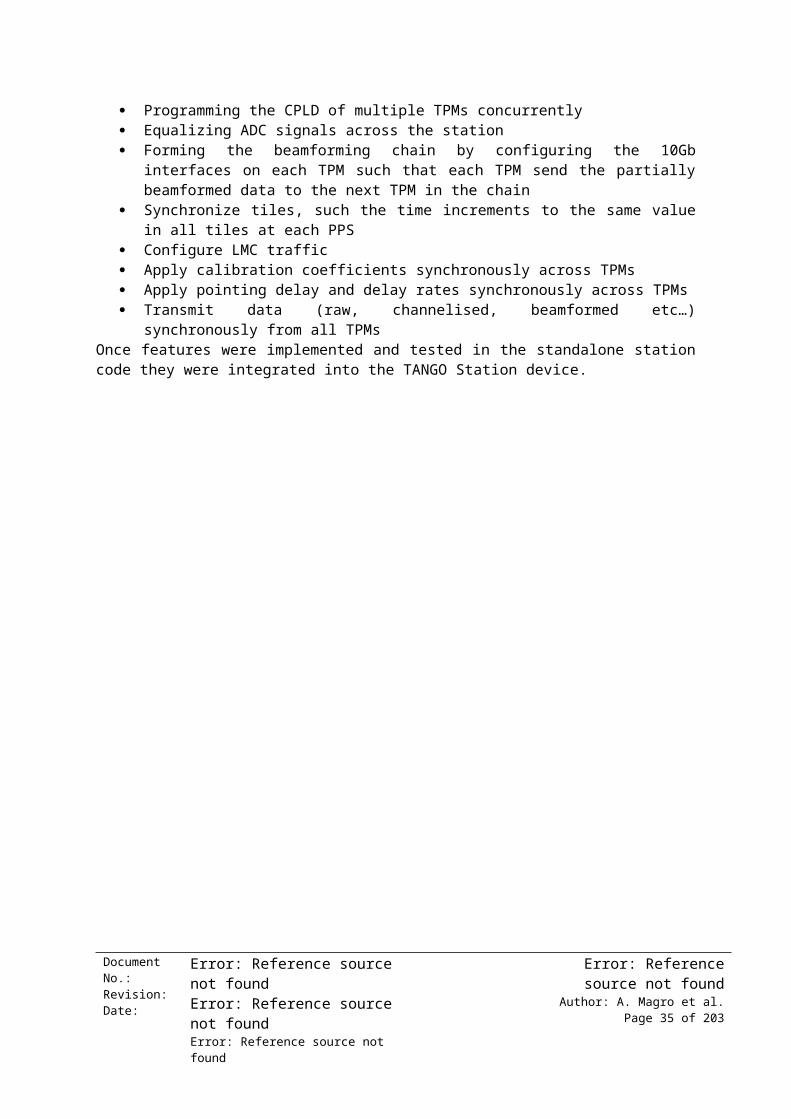
7 Bandpass Flattening, Calibration and PointingThe LFAA needs to send a flattened station beam to CSP. Bandpass flattening occurs on the TPM, however scaling factors (one factors per group of 8 channels for the version on which this prototype was tested) have to be calculated in software. To calculate these parameters, integrated channelised data is continuously transmitted by the TPM and received by the DAQ. These integrated spectra are analysed by a bandpass flattening pipeline, which generates the parameters. This pipeline can also detect anomalous bandpasses and malfunctioning antennas. Additionally, the station needs to be calibrated and pointed. On-line calibration for an aperture array telescope requires a sky model to which the observed visibilities can be compared. This section will describe the design of a general pipelining framework, pyTCPO, which facilitates the creation of processing pipelines. Standalone pipelines for bandpass flattening, calibration and pointing are then described.
7.1 pyTCPO
The pyTCPO (Tessella Calibration and Pointing) package was implemented to define a framework within which data processing pipelines and their constituent modules are built, as well as providing a set of abstract pipelines, ready to use modules, and providing a framework for de/archiving. Core features of this package include: the ability to define abstract and concrete pipeline implementations incorporating modules, using a plug-and-play methodology; managing the initialisation, processes and termination of a pipeline during runtime; handling of archival data from each module within a pipeline; representation of data flowing between modules as a universally recognised unit within pipelines; provides a series of ready-made modules and pipelines for bandpass processing, calibration, and beam pointing.
7.1.1 Modularity and Message Passing
Pipelines are built from a collection of modules, which can be divided into two families: generator modules serving as the root module of a pipeline, and processing modules. Both types of modules are represented by respective abstract base classes within the pyTCPO package. These abstract classes provide necessary core functionality, such as consumer registration, module specific archival handling, and error handling.
The abstract base class for generator modules is intended to serve as a base class for modules which generate data encompassed within messages. Such modules are characterised by having no parents, and typically run their own data generation loop. It is worth noting that each pipeline must implement strictly one root module. On the other hand, the abstract base class for processing modules is intended to serve as a base class for processing modules, having at least one parent module, and typically one or more child modules.
Any data to be exchanged between modules is encapsulated within a universally recognised Python object, which provides a means of storing metadata and the data to be exchanged - all while providing a level of abstraction. The metadata of these units of data does not change, and includes a timestamp, index and a selector mask (which allow the selection of a subset of data units from a larger collection, for example, selection of beam pointing data units from a collection of data units which also includes bandpass data), and so on. As data units are passed
Document No.:Revision:Date:
Error: Reference source not foundError: Reference source not foundError: Reference source not found
Error: Reference source notfound
Author: A. Magro et al.Page 35 of 151

around, the encapsulated data may be changed from one module to another, thus one must ensure that the data units consumed by some module are compatible with what the module expects.With the plug-and-play and pipeline methodology employed, two particular scenarios may arise: module fan-in and fan-out, the former illustrated in . Fan-in scenarios represent an issue in that data units from multiple modules need to be aggregated into a single data unit, while allowing the distinction of the separate data items. The framework handles the unique naming of modules during run-time, thus when data units are to be consolidated the unique name of each fan-in module is used as an index to a dictionary storing the aggregated data units.
Figure 7-13. Module fan-in message passing
Document No.:Revision:Date:
Error: Reference source not foundError: Reference source not foundError: Reference source not found
Error: Reference source notfound
Author: A. Magro et al.Page 36 of 151

Figure 7-14. Pipeline and module life cycle
7.1.2 Pipeline and Module Life Cycle
The package provides the core framework for pipeline management, through a manager, which takes care of the pipeline and module life cycle amongst other things. The following is an overview of the pipeline life cycle, supplemented by Figure 7-14:
1. The pipeline is first built, advancing the pipeline to a ‘built’ state
2. The pipeline is then started by the manager, where each module is started depending on the logical structure of the pipeline. It is guaranteed that child modules of a parent will start before their parent module. The relative order in which the children modules of a parent will be started cannot be however cannot be guaranteed. This the root module is the last module to be started
3. If the pipelines status is updated to ‘active’, the pipeline is executed until completion
4. Termination after completion is signalled
Parallel to the pipeline life cycle is the module life cycle
1. As the manager start each module, the module first undergoes initialisation and setup (as per the parameters assed onto the respective setup methods)
2. If setup is successfully completed for a module, it is started and is ready to carry out its respective tasks
3. The module may then generate new samples or process received sampled (depending on the module type)
4. Module clean-up may be carried out as necessary for termination, to allow the module to be setup/started as necessary
Document No.:Revision:Date:
Error: Reference source not foundError: Reference source not foundError: Reference source not found
Error: Reference source notfound
Author: A. Magro et al.Page 37 of 151

7.1.3 Archiving
Data archiving within the package was implemented to allow the sharing of pipeline data with external software packages and/or persistence for offline processing. For flexibility, archiving with the framework was implemented as a three-step process. The first step in the archiving scheme is the definition of which parts of the sample object need to be stored. The package provides the ASerialiseable class, an interface for serialisation.
Any data item to be archived should inherit from this class to specify which member attributes need to be stored. The ASerialisable class also provides a means to recursively serialise hierarchical data objects, including other ASerialisable instances, thus preserving the defined data structure.
The next step in the archiving scheme is the flattening of composite objects and representing them in some serial form (typically a string). The ASerialiser base class defines the serialisation of ASerialiseable objects, which typically includes the conversion of objects into a string format or binary, which can then be acted upon by an archiver class. Any concrete implementation of this base class is expected to support all primitive data types, all numeric numpy data types, ASerialisable instances and n-dimensional numpy arrays of combination of the aforementioned data types. The package includes JSON and CSV based ASerialisable concurrent implementations. The final step of the archiving scheme is the actual persisting of serial data to some storage/transmission medium, carried out by concrete implementations of the APersistor base class. Persistence needs to maintain a level of indexing. At the same time, in the interest of efficiency, a single archiver is used for the entire pipeline. Data originating from different modules (and hence generally of different types) is identified through unique keys. Within the same key, samples are further indexed by a time-stamp. Handling both is the responsibility of the concrete implementations. The package includes a Text File Archive and a Redis based persistor as concrete implementations.
7.1.4 Pipeline Abstraction and Parallelisation
The package allows for the abstraction of pipelines, in that a pipeline may be abstractly defined structurally with all its modules and its own manager, and then be called and built within any script. Such abstract pipelines are termed as pipeline builders, which are defined using the AbstractPipelineBuilder class. The definition of such builders also requires the definition of any options for the initialisation of the pipeline and its modules, which can be set in any script making use of the builder. The package includes several such builders, which shall be outlined later – applications include bandpass fitting and calibration
Manager instances of pipelines in a built state may be easily parallelised using the PipelineParallelisation convenience class. Since both pipelines and pipeline builders (once defined in a script) must have a pipeline manager, any pairwise combination from the two may be parallelised. This is achieved by encapsulating the built manager instances as processes, parallelising these processes from there on.
Document No.:Revision:Date:
Error: Reference source not foundError: Reference source not foundError: Reference source not found
Error: Reference source notfound
Author: A. Magro et al.Page 38 of 151
7.2 Calibration
The generation of sky model visibilities provides the backbone for sky dependent calibration. The visibilities are computed via OSKAR-2.7, an interferometer simulation tool which makes use of the measurement equation. To obtain the correct model visibilities to calibrate with, accurate information about the interferometer’s antenna positions and beam response need to be known. OSKAR requires such a telescope model to be presented in a hierarchical directory structure, with each station represented by a separate subfolder in the telescope model parent folder. Since with AAVS1 calibration is on a per-station basis, each antenna within the AAVS station is assigned a separate subfolder in the hierarchical model.
Prior knowledge of the sky to be observed from the telescope’s location is essential. A global sky model, containing a description of all possible known sources (to a selected limiting magnitude at the observing frequency range) visible from the telescope’s location is thus required. Since this is a global sky model, sources included can always be either visible above the horizon, or else only visible during a particular period. A description of source parameters included within the sky model can be retrieved from OSKAR-2.7’s sky model documentation.
From this global sky model, the local sky model is computed within the pipeline itself, which is updated in real-time to include sources rising above the horizon during the observation and also to remove those setting during the observation. Therefore, the updated local sky model contains the subset of sources included in the global sky model which are above the horizon at the observation time being simulated. This local sky model, updated for every observation timestep, is provided to OSKAR-2.7 accordingly as the sky model for which it should generate model visibilities.
In addition, the interferometry simulation also requires the definition of observation parameters, which will mirror the real observation as closely as possible. A complete description of these configurable parameters can be found within OSKAR-2.7’s settings documentation. Apart from defining the telescope and sky model paths, the configuration file required to affect an interferometer simulation run also defines the observation’s date and time, the frequency range over which the observation is carried out, and the observation total duration, amongst several others.
To improve the efficiency of the model visibilities generation procedure OSKAR is provided with a separate configuration file for every observation timestep, which corresponds to the timestep of incoming true visibilities in real time. Since a separate frequency channel will be received at every observation timestep, a channel will only be calibrated once every n number of timesteps, where n is the number of channels being observed.
Since OSKAR-2.7 would, by default, generate model visibilities for every channel at every observation timestep, this would constitute in a tremendous waste of computation time, with n-1 extra frequency channels being computed per individual observation timestep. Providing OSKAR-2.7 with separate configuration files for every timestep, with the single frequency channel to be calibrated at that time indicated ensures that only the required model visibilities are generated and thus reduces the time necessary to compute the model visibilities necessary for real-time calibration.
Document No.:Revision:Date:
Error: Reference source not foundError: Reference source not foundError: Reference source not found
Error: Reference source notfound
Author: A. Magro et al.Page 39 of 151

To calibrate in real time as required, the model visibilities generated by OSKAR-2.7 are each assigned a timestamp and frequency channel indicator accordingly. The frequency channel indicator is used to match incoming true visibilities from the telescope itself, which are also tagged with a frequency channel indicator and timestamp, to their corresponding model visibilities, selecting the model visibilities for the same frequency channel with the closest timestamp. This ensures that the best, updated matching of model and true visibilities is obtained.
Once the closest matching model visibilities are retrieved, these are fed to the calibration modules accordingly. Appropriate conversions of both the uncalibrated real visibilities and the model visibilities are carried out, such that the correct format of both inputs is input to StEFCal accordingly. The obtained correlated visibilities from both the real telescope and from OSKAR-2.7’s interferometer simulation will be in upper triangular format, with the autocorrelations included. Since StEFCal requires the full correlation matrix, the lower triangle of the correlation matrix needs to be computed, effected by simple calculation of the conjugate of the upper triangular visibilities.
Once provided with the full correlation matrices, StEFCal computes per-antenna coefficients which best reduce the differences between the model and uncalibrated visibilities, such that the uncalibrated baseline visibilities are brought to match their corresponding model baseline visibilities as much as possible. Upon convergence to an acceptable solution, the resultant complex coefficients are used to calibrate the station for that frequency channel until the next batch of uncalibrated visibilities for the same frequency channel in obtained, in n timesteps.
7.2.1 pyTCPO Calibration Pipeline
Model visibilities generation is invoked once the parameters for an observation are fully known. Hence, model visibilities generation needs to be fast and starts just prior to the observation itself. The efficiency improvement described in the previous section is therefore a necessity and reduces unnecessary requirements for the large data files generated otherwise.
In order to be able to run model visibilities generation in tandem with the reception of real visibilities, two separate sub-pipelines were designed for the calibration pipeline. The first of the two sub-pipelines deal strictly with the generation of model visibilities. Particularly, it receives a set of observation parameters, the array antenna configuration as well as the global sky model. Consequently, it generates the telescope model in OSKAR-2.7’s required format, a settings file for running an interferometer simulation and a localised sky model. From within the model visibilities generation sub-pipeline, an OSKAR-2.7 interferometer simulation run is carried out and the resulting correlated visibilities are dumped to a measurement set in a specified file path and timestamped.
Running in parallel will be the second sub-pipeline, which is responsible for the reception of real visibilities, the selection of corresponding model visibilities and subsequent calibration. A consumer module within this second sub-pipeline requests reading of correlated visibility files per channel, using the DAQ reader. If the specified channel has no visibility data, the pipeline will persist requests until the required data is found. Once found, the pipeline will match the obtained real visibility channel and timestamp with the closest corresponding model visibilities.
Document No.:Revision:Date:
Error: Reference source not foundError: Reference source not foundError: Reference source not found
Error: Reference source notfound
Author: A. Magro et al.Page 40 of 151

The consumer proceeds to submit the model and real visibilities to a calibration manager module, which makes necessary conversions to the data and then submits the converted datasets to the calibration algorithm, StEFCal. The calibration coefficients computed are then either dumped to file or can be accessed directly from the coefficient manager module. These calibration coefficients will be generated per frequency channel, per polarisation at every sample timestep of the observation, and are updated when the same channel is re-sampled.
These per-antenna coefficients will be applied to all incoming raw data from the separate antennas, such that the next batch of incoming data for a channel will be calibrated with the previously computed coefficients for that same channel. It must therefore be stressed that the next calibration coefficient computed for that channel will be to slightly improve upon the previous coefficient and should therefore be treated and consequently applied as an improvement to the previous coefficient and not as its replacement.
7.3 Bandpass Fitting Pipeline
The package included the AAVSBandpassPipelineBuilder, which defines a structure of module for the retrieval of data, its processing, piecewise polynomial fitting on the data, outlying channel detection, and anomalous antenna detection. The builder specified uses the Redis persistor, however it allows flexibility in the choice of serialiser.
For integrated channel data sample, a model polynomial fit is generated using piecewise polynomials. The number of pieces is specified along with the channel range each piece occupies. The piecewise polynomials are then combined using Lagrangian interpolation on the overlapping data points between the polynomial pieces.
Outlying channel detection is carried out using two primary techniques, the results of which are then aggregated together. The first technique is based on the relative number of standard deviations (in magnitude) from the piecewise polynomial model fit. Channels whose number of standard deviations exceeds the specified upper bound are flagged as anomalous. On the other hand, the second technique is based on first derivative variations, making it optimised for RFI spike detection. Given a frequency channel, an anomalous spike on that channel is detected by first calculating the relative gradient in magnitude with its two adjacent channels. If the derivative signs differ and the absolute values of the derivatives exceed a specified upper bound, then the channel is flagged as anomalous. The pipeline also provides the option to identify permanent RFI regions which are always flagged as anomalous beforehand, so as not to affect the overall model fit. Figure 7-15 show two antenna bandpasses with their corresponding fit. Frequency channels marked with a green tick have been detected as anomalous (RFI).
Document No.:Revision:Date:
Error: Reference source not foundError: Reference source not foundError: Reference source not found
Error: Reference source notfound
Author: A. Magro et al.Page 41 of 151

Figure 7-15. RFI detection on antenna bandpass
Anomalous antennas are detected using two independent based detectors (i.e. those that establish if an antenna is anomalous without comparing it to the others), with the results aggregated to establish which antennas are anomalous and which are not. Two techniques are employed - the first is based on a threshold of the number of outlier channels to the total number of channels. The second technique implements a historical overlap-based anomaly detector, where the moving average computation in the case of an anomalous sample is weighted according to the number of outlying channels detected in that sample.
7.4 Pointing
The beamforming coefficients need to be updated every few seconds. This is performed by the pointing algorithm, which given a pointing direction, the position of every antenna and additional beamforming parameters, will generate the updated coefficients, which in turn need to be downloaded to the respective TPMs. The coefficients of each TPM can be processed in parallel, which means that the parameter space can be partitioned into at most the number of TPMs subsets.
Provided with a target (RA, DEC) or (Az, Alt) and the antenna coordinates relative to a geodetic reference (the station centre for AAVS1), the delay and delay rate per antenna are calculated after appropriate unit and reference frame conversions are performed. The delay and delay rate are then transmitted to the TPMs and applied synchronously across the station. The firmware calculates the per-channel pointing coefficients from the delay and delay rates.
Document No.:Revision:Date:
Error: Reference source not foundError: Reference source not foundError: Reference source not found
Error: Reference source notfound
Author: A. Magro et al.Page 42 of 151

8 AAVS1 TANGO Prototype Overview
8.1 Overview
A prototype LMC system, based on TANGO version 8 was developed for AAVS1. In particular, a number of base classes lie at the foundation of the TANGO-based LMC system, on top of which all other hardware and software TANGO devices are built. TANGO devices were developed both for hardware monitoring and control, as well as software components for observation setup and execution. A number of additional tools that interact with this TANGO-based LMC system were created to aid deployment and management. Full details of the architecture of this system can be found in Appendix B: AAVS-1 LMC Prototype.
8.2 LMC Infrastructure
The infrastructure of the LMC system assumes that every form of control of the AAVS LMC system is done via a single device, the AAVS LMC Master device. This includes all communication related to:
Commands and requests Logging configuration Alarms and events Telescope model upload/download
In addition to the LMC Master device, a number of other components exist at the highest level of the TANGO LMC hierarchy for AAVS, namely:
AlarmStream Device EventStream Device File-based Logging Database
The Telescope Manager emulator (TM emulator), developed outside of the TANGO AAVS LMC system acts as the largest client of the LMC system. Commands and attribute info, alarm messages, event messages and log messages are all consumed/operated on by the TM emulator.
An overview of these interfaces is given in the primary presentation diagram in Figure 8-16. On the other hand, control and monitoring with the AAVS LMC system is unified by having all devices behave within a basic set of functionalities provided by an AAVS base class, whether the device is for a hardware unit, or a software process. The internal interfaces are shown in the primary presentation diagram in Figure 8-17.
The device hierarchy employed for the AAVS LMC system is as follows: An AAVSLogger device, which inherits from the standard TangoDevice, and implements a
log() method. An AAVSDevice, which inherits from the standard TangoDevice, and which forms the basis of
all other devices in AAVS LMC. This particular device implements functionality for creating/deleting alarms within the system, emit events, defines generic callback methods for alarms, defines container methods for various bookkeeping procedures (which can be overridden by individual devices), etc.
A GroupDevice, which is a rich representation of a group of AAVSDevice-compatible members.
AlarmStream, EventStream and DiagnosticStream devices (which are responsible for acting as queues for alarms, events, and diagnostic/metric information across the system)
Document No.:Revision:Date:
Error: Reference source not foundError: Reference source not foundError: Reference source not found
Error: Reference source notfound
Author: A. Magro et al.Page 43 of 151

A JobDevice, which represents an interface between a TANGO device and an external process (with a defined interface) that needs to be monitored and interacted with via the LMC system.
Figure 8-16: Primary presentation of the AAVS LMC top-level devices.
Document No.:Revision:Date:
Error: Reference source not foundError: Reference source not foundError: Reference source not found
Error: Reference source notfound
Author: A. Magro et al.Page 44 of 151

Figure 8-17: Primary presentation component and connector diagram. This shows the main internal interfaces involved in the AAVS LMC Infrastructure.
Document No.:Revision:Date:
Error: Reference source not foundError: Reference source not foundError: Reference source not found
Error: Reference source notfound
Author: A. Magro et al.Page 45 of 151

The main infrastructural elements, which are catered for in the AAVSDevice are related to common functionality for:
Device reporting – all devices can receive a request to generate a JSON report. The report has a dictionary structure, with a list of attributes and their values, a list of commands the device supports, and in the case of group devices, a list of TANGO addresses of the members currently in the group.
Logging behaviour – All devices in the AAVS system utilize a single logger device, the AAVSLogger, which is a file based log. The logger uses Python logging to add onto the standard log information provided by TANGO and to define a custom log file format.
Alarm behaviour – AAVS alarms are designed to be richer than standard TANGO core attribute alarms. Alarms are defined, with conditions/formulae (more on this later). Attributes related to these conditions are monitored by the Elettra alarm device, and when a threshold of a particular condition is crossed, the alarm_on() callback is called. An alarm information message is composed, and this information is pushed in the form of an event, which is received by the AlarmStream device. By default, this device can subscribe to any events from any device. Conversely, when an alarm condition goes back to normal, the alarm_off() callback is called instead.
Event behaviour - Events in TANGO are based on subscription to changes in attributes. AAVS requires the use of both attribute events, but also generic device events. For device level events, a special string attribute exists in all AAVS devices, and the event stream device can subscribe to changes to this particular attribute. Device level event messages are stored in this special string attribute, and upon changing the message details, the event stream receives a notification.
General exception handling – When an exception occurs, the exception information is passed to the FATAL_STREAM log. If a callback is defined for the particular try/catch code segment where an exception has been caught, this callback is executed e.g. some devices reset themselves.
8.3 Hardware Device Monitoring and Control
The composition of TANGO devices for hardware elements, and their physical hierarchy in the AAVS LMC system is shown in Figure 8-18. The hardware devices being monitored and controlled via TANGO are:
Antenna device (an AAVSDevice) PDU device (an AAVSDevice) Switch device (an AAVSDevice) Server device (an AAVSDevice) Rack (a GroupDevice) – A collection of TPMs, servers, switches, PDUs Tile (a GroupDevice) – a group of Antennas
Document No.:Revision:Date:
Error: Reference source not foundError: Reference source not foundError: Reference source not found
Error: Reference source notfound
Author: A. Magro et al.Page 46 of 151

Figure 8-18: Components defined for hardware devices, collectively forming a hierarchy of monitoring and control functionality all the way up to the AAVS Master device.
8.4 Observation Monitoring and Control
Observation monitoring and control in AAVS is composed of a number of devices that work together to satisfy station configuration submission, receive RMS beam values, monitor an observation status, define the firmware and algorithms to use for an observation during configuration, update pointing direction, control various stations, receive and apply calibration and pointing coefficients and downloading sky model values.
In order to do all this a number of software TANGO devices were developed and their hierarchy is shown in Figure 8-19. AAVS only allows for a single observation to be running at any one time. The observation configuration (in the form of a JSON document) is passed down to the AAVS Master from TM. The observation configuration parameters are stored as attributes in the observation configuration device, which serves as a configuration reference for the entire AAVS LMC. The basic observation descriptor involves a station configuration with the respective tile members in each station, a list of jobs to run for the observation (one or more of DAQ/Calibration/Pointing), and respective configuration parameters for the Jobs themselves e.g. the kind of data acquisition to be performed by the DAQ job.
Document No.:Revision:Date:
Error: Reference source not foundError: Reference source not foundError: Reference source not found
Error: Reference source notfound
Author: A. Magro et al.Page 47 of 151

Figure 8-19: : The primary components involved in the setup and execution of an observation in AAVS.
The devices required for observation monitoring and control are: The AAVS LMC Master device (a GroupDevice) – holding an observation configuration and an
observation instance The Observation Configuration device (an AAVSDevice) – a sort of database device holding
all parameters required for the particular configuration. The Observation Device (a GroupDevice) – the primary executor of an observation,
responsible for observation initialization once a configuration has been set up. This device can start and stop the single observation instance, extract data being gathered by the observation etc. Stations and jobs to run on stations etc. are all given as part of the observation script (a JSON formatted file).
The Station Device (a GroupDevice) – this is essentially a collection of Tile devices Specific Job devices e.g. DAQ (data acquisition) job device - The DAQJob device is a device
that essentially serves as a data acquisition wrapper for a station. It utilizes the AAVS LMC DAQ library and keeps track of job progress in a station. Jobs may have a particular cycle – for example different data types (raw, channelized, beamformed) can be cycled through, with one or more captures per type. The attributes of this device are mostly populated through what is given in the observation configuration.
8.5 Maintenance and Execution Support Tools
A number of maintenance and execution support tools were designed and developed for AAVS. . These use-cases can be split into rough categories:
1. Remote operations
Document No.:Revision:Date:
Error: Reference source not foundError: Reference source not foundError: Reference source not found
Error: Reference source notfound
Author: A. Magro et al.Page 48 of 151

a. Remote diagnosticsb. Remote powering up/down and restarting of hardware/software elementsc. Observation execution
2. Metadata for diagnosisa. A log of all software behaviour in the system
3. Maintenance Operationsa. Fault diagnosisb. Error detectionsc. Remote debuggingd. Default actions on errors
Three particular components were built for these purposes:
1. An LMC API (or LMC backend) – This API lies in between the REST HTTP Application, and the TANGO LMC system. The TM Emulator has to have REST requests routed via this backend API, which receives the requests and then acts as a client to the AAVS LMC Master device. This section will give an overview of the structure of this Backend API.
2. A Graphical User Interface (or GUI) - Users interact with a web-based GUI via browser (TM Emulator). The front-end will be responsible for accepting user requests, interpreting them, and routing them to the AAVS LMC Master device, via a service layer that translates GUI requests to TANGO requests. Replies from the TANGO subsystem are then passed back to the user via a service layer that passes on output from the AAVS LMC system to the web interface.
3. A Command Line Interface (or CLI) - The maintenance and execution support CLI interfaces will run on user computers that have access to TANGO-based control system. CLI interfaces for AAVS are provided in the form of:
a. The iTANGO toolb. Engineering scripts for system setup/configuration, alarm management, debugging
and diagnostics collection, tunnelling for TPM access layer operation, CLI-based tests for REST API functionality e.g. via CURL
8.6 LMC Deployment and Management Tools
A number of tools were developed for aiding the deployment and management of the AAVS LMC system. In particular, two tools created for AAVS, one to deploy and manage the control system and another to deploy and manage the pre-defined alarm rules of the LMC system.
These two modules are implemented as Python applications that accept a number of limited commands, and a configuration script that goes with these commands. The configuration scripts are JSON documents. For AAVSCTL, the JSON configuration script contains a list of all devices which must be configured and set up in the TANGO database, with the required property values and defaults. This script also contains the association of device servers to particular devices, and the order in which device servers need to start. This configuration can be cleaned up and reconfigured from the CLI.
For ALARMCTL, a list of alarm triggers is written in a specified format, which is then passed over to the ALARMCTL tool in the CLI, which acts as a client to a started TANGO LMC system, and adds the required alarms to the system via calls to the AAVS Master device.
Document No.:Revision:Date:
Error: Reference source not foundError: Reference source not foundError: Reference source not found
Error: Reference source notfound
Author: A. Magro et al.Page 49 of 151

9 AAVS1 Hardware and Software DeploymentThis section describes the current hardware deployment and required network and software configuration for this deployment, including remote power-down and power-up procedures, switch configuration, server network configuration, among others.
9.1 Rack Assembly
Figure 9-20 shows a schematics representation of the rack assembly at the MRO. There is a total of four rack, three hosting two sub-racks of 4 TPMs each (show on the left) and one containing one sub-rack and the LMC server (show on the right). Each sub-rack is surrounded by a ventilation system comprising of fans above and below the sub-rack, and air guides above the top fan and below the bottom fan. Each sub-rack has an associated 40Gb switch used to transport beam and LMC data (if enabled). There is also a single 1G switch for the monitoring and control network. Each 1Gb switch has a 10Gb which is connected to one end of a 40Gb patch cable, the 40Gb end in turn connected to the 40Gb switch in the rack containing the LMC server. The LMC server therefore communicates with all the hardware through this link. Each rack also contains an OctoClock which distributes 1PPS and 10MHz to all TPMs, as well as a DC-PSU-3Phase component for rack power.
Document No.:Revision:Date:
Error: Reference source not foundError: Reference source not foundError: Reference source not found
Error: Reference source notfound
Author: A. Magro et al.Page 50 of 151

Figure 9-20. AAVS1 rack configuration
9.2 Network Configuration
Each 40Gb switch has 12 40Gb ports. 8 of the ports are used to connect the switch to the TPMs (2 per TPM, one for each 40GbE port), and another 2 are used to connect the switch to another switch in the same rack
or in a different rack. The MAC and IP address are assigned to these 40Gb ports on the TPMs programmatically when a station is configured. The 1 Gb port on the TPM, 40Gb switches and PDUs are connected to the 1Gb switch in every rack. The IP address of these devices are defined in a DHCP server
running on the LMC server. This IP assignment is static and defined in . Since the number of components is small, only a single subnet is required, with no routing or topology building protocol required.
Table 9-3. AAVS1 IP assignmentMAC Address Alias IP address
D8:80:39:92:6B:B0 tpm-1 10.0.10.1D8:80:39:92:5A:90 tpm-2 10.0.10.2D8:80:39:92:57:A8 tpm-3 10.0.10.3D8:80:39:92:7A:43 tpm-4 10.0.10.4D8:80:39:92:44:FC tpm-5 10.0.10.5D8:80:39:92:7B:26 tpm-6 10.0.10.6
Document No.:Revision:Date:
Error: Reference source not foundError: Reference source not foundError: Reference source not found
Error: Reference source notfound
Author: A. Magro et al.Page 51 of 151

D8:80:39:92:79:A2 tpm-7 10.0.10.7D8:80:39:92:0E:A8 tpm-8 10.0.10.8D8:80:39:92:1E:F7 tpm-9 10.0.10.9D8:80:39:92:0F:07 tpm-10 10.0.10.10D8:80:39:92:2F:02 tpm-11 10.0.10.11D8:80:39:92:45:C3 tpm-12 10.0.10.12D8:80:39:92:45:7A tpm-13 10.0.10.13D8:80:39:92:6A:1F tpm-14 10.0.10.14D8:80:39:92:6A:DB tpm-15 10.0.10.15D8:80:39:92:69:3F tpm-16 10.0.10.1600:19:F9:10:12:99 psu-1 10.0.10.10100:19:F9:10:12:97 psu-2 10.0.10.10200:19:F9:10:12:98 psu-3 10.0.10.10300:19:F9:10:12:85 psu-4 10.0.10.104D8:80:39:18:83:90 pdu-1 10.0.10.111D8:80:39:B2:CC:12 pdu-2 10.0.10.112D8:80:39:B2:CC:13 pdu-3 10.0.10.113D8:80:39:8B:D8:CF pdu-4 10.0.10.11424:8A:07:53:3D:C6 sw40g-1 10.0.10.12124:8A:07:3F:48:04 sw40g-1 10.0.10.12224:8A:07:5A:B7:2C sw40g-1 10.0.10.12324:8A:07:28:4B:E2 sw40g-1 10.0.10.12424:8A:07:44:A3:0E sw40g-1 10.0.10.12524:8A:07:3F:48:3C sw40g-1 10.0.10.12624:8A:07:3F:4A:1C sw40g-1 10.0.10.12708:BD:43:74:28:1D sw1g-1 10.0.10.13108:BD:43:74:29:BD sw1g-1 10.0.10.13208:BD:43:74:29:B5 sw1g-1 10.0.10.13308:BD:43:74:2A:E5 sw1g-1 10.0.10.134
Since the TPMs deployed in AAVS1 do not support ARP the TPM MAC address have to be included in the MAC tables in the respective network switches, otherwise TPMs can flood the network, making it unreachable. Additionally, the MTU of all network ports is set to 9000 to allow JUMBO frames.
9.3 Server Configuration
Since there is a single LMC server in AAVS1, all required software is installed on it. The server is set up with Ubuntu 14.04. The access layer and DAQ libraries are installed on the system itself for rapid access and prototyping. Since they are isolated libraries and do not require complex system configuration, no containment was deemed necessary. The server contains two 4 TB disks which are used for storing observational data generated by the DAQ. A directory, /opt/aavs, was set up where libraries and executables are installed. The following standard executables/scripts are provided:
aavs_powerup: Run after reboot or when server is switched on. Configure server network interfaces, enables PSU power output, resets PDUs and generates antenna spectra to make sure that the station is performing well
aavs_shutdown: Run before AAVS is shutdown, switch off all hardware and shuts down the server
Document No.:Revision:Date:
Error: Reference source not foundError: Reference source not foundError: Reference source not found
Error: Reference source notfound
Author: A. Magro et al.Page 52 of 151
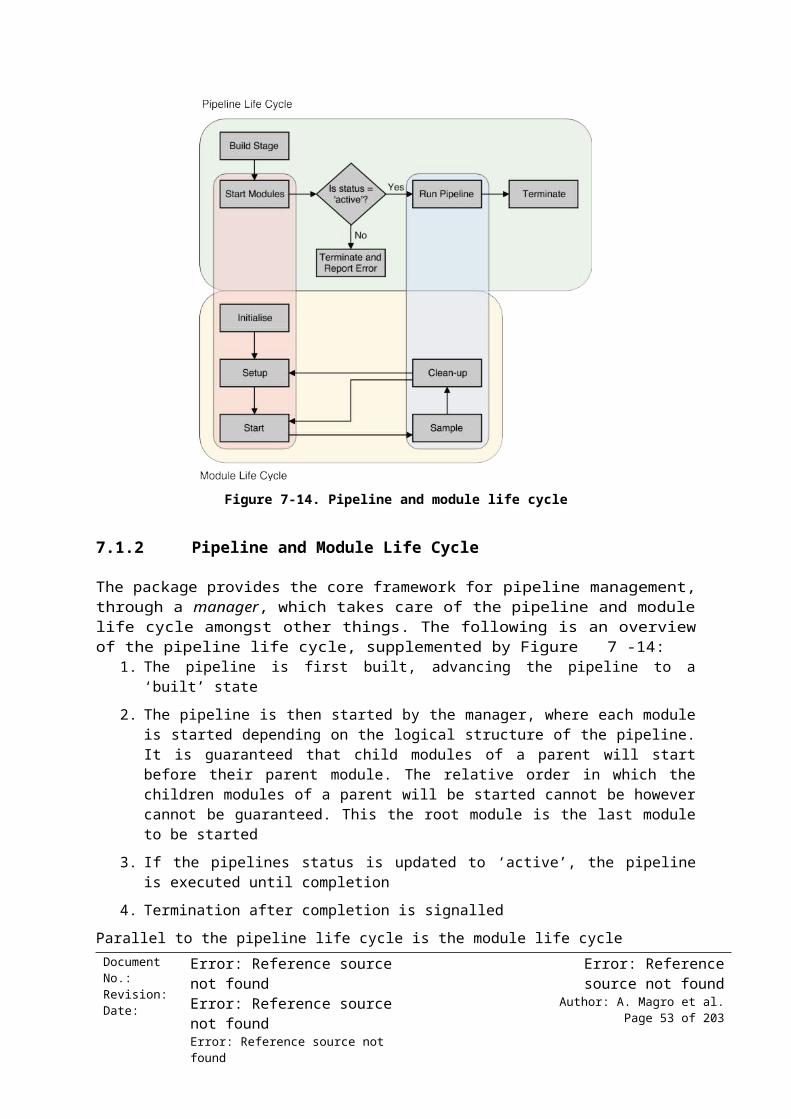
pdu: A helper script for enabling and disabling PDU port power and reading current usage psu: A helper script for enabling and disabling PSU port power switch_halt: Runs to reset network switches aavs_station: A helper script for generating and configuring a station, launching an
IPython interpreter which can be used for issuing command to the station (such as for transmitting data)
daq_receiver: A helper script for creating and configuring a DAQ instance for receiving data from the station
source_observation: A helper script for scheduling observations with the AAVS station
The LMC software system and TM emulator are deployed in a vagrant box to avoid conflicts with the running system. Each vagrant box can be re-deployed and re-configured with simple commands for rapid testing of new features and deployment scripts. Since the TM emulator communicates with the LMC system, and this in turn communicates with the AAVS1 hardware, appropriate configuration of port forwarding in the vagrant boxes is required.
Document No.:Revision:Date:
Error: Reference source not foundError: Reference source not foundError: Reference source not found
Error: Reference source notfound
Author: A. Magro et al.Page 53 of 151

10 Performance Benchmarks
This section presents some performance benchmarks performed on some of the implemented libraries and system described in this document. These are estimated benchmarks, since rigorous benchmarks were not performed, however this suffices to perform a scaling analysis of the MCCS cluster for LFAA.
10.1 DAQ
The data acquisition process is responsible for receiving the calibration spigots and integrated data from TPMs. The total date rate which must be processed is ~7.6 Gb/s, largely dominated by the calibration spigots. Table 10-4 presents performance benchmarks for the DAQ implementation presented in this document. The memory bandwidth is generally directly related to the incoming data bandwidth. Note that this implementation can be improved to limit the amount of compute resources required to filter packets at the kernel level.
Table 10-4. DAQ CPU and memory benchmarksThread Description Memory
UtilizationMemory
bandwidth% Core
UtilizationPacket receiver Receives and filters packets,
placing UDP payloads in ring buffers
< 1 MB 8 Gb/s 60%
Calibration spigots consumer
Process the calibration spigots and places data in a
buffering system for the correlator to process
~10 GB 8 Gb/s 100%
Integrated channel consumer
Processes integrated channel data packets and
writes them to storage
~ 1 MB ~ 16 Mbps 10%
Integrated beam consumer
Processes integrated beam data packets and writes
them to storage
< 1 MB < 8 Mbps 10%
10.2 Correlator
The correlator process waits for the calibration spigot consumer in the data acquisition process to fill a buffer, then copies this buffer to the allocated GPU’s memory, runs the correlation kernel, then copies the result back to system memory and writes the correlation matrix to storage. Based on the prototype implementation presented in this document, a single CPU thread is required for copying data into and out of GPU memory, while several GPU kernels are required to perform the correlation. The GPU kernels can perform the computation in about 25% of real-time, whilst the CPU thread minimally uses a CPU core. Table 10-5 presents GPU benchmarks for the correlator for increasing number of stations, including memory utilization and power consumption. A single NVIDIA P100 with NVLINK (16 GB GPU memory) was used for these tests.
Document No.:Revision:Date:
Error: Reference source not foundError: Reference source not foundError: Reference source not found
Error: Reference source notfound
Author: A. Magro et al.Page 54 of 151

Table 10-5. Correlator GPU benchmarks# Stations Manage real time? Memory used Power consumed
1 Yes 680 MB 145 W2 Yes 1 GB 145 W3 Yes 1.5 GB 180 W4 Yes 1.8 GB 190 W
10.3 Calibration
The calibration process is logically split into two functions: the generation of the model sky visibilities, and the calibration itself. Generation of model sky visibilities using OSKAR takes approximately 10% of real-time on a NVIDIA P100 to generate the visibility for a single frequency channel. The Python implementation of SetCal takes approximately 100% of real-time on a single CPU core to generate the calibration coefficients.
Document No.:Revision:Date:
Error: Reference source not foundError: Reference source not foundError: Reference source not found
Error: Reference source notfound
Author: A. Magro et al.Page 55 of 151

11 Simulators and Emulators
This section describes the TM emulator and TPM simulator which were developed to test the systems without the need for hardware (TPM) and to prototype the interaction between LFAA and TM.
11.1 TM Emulator
The TM emulator emulates a subset of the functionality which TM will perform, essentially those which are required for the proof-of-concept and commissioning of AAVS. It provides a web-based interface which interfaces with the LMC system, providing it with monitoring and control capability for AAVS1. Since development on the TM emulator started before the SKA decision to adopt TANGO, a custom interfacing API was developed between the TM emulator and the LMC Master. This API is implemented in what’s referred to as the AAVS1 Backend, which converts REST URLs to TANGO commands. The TM Emulator backend performs HTTP REST queries on exposed URI in the backend, whose implementation results in an operation being performed on the LMC. This is shown in the left-hand side of the TM emulator architecture shown in Figure 11-21. There is also socketIO server in AAVS1 backend for transmitting metrics, alarms and events to the emulator. This provides an asynchronous publish-subscribe mechanism for transmitting information without having to poll the backend.
Figure 11-21. TM emulator high-level architecture
The TM Emulator is implemented using the Django web framework. Django implements a version of the Model-View-Controller pattern in the form of Model-Template-View. The view is HTML5 code using Bootstrap for layout and Jquery for responsiveness. Each component within the View (Controller) is a separate Django app, with all apps within the same Django web project. The principle components are:
Document No.:Revision:Date:
Error: Reference source not foundError: Reference source not foundError: Reference source not found
Error: Reference source notfound
Author: A. Magro et al.Page 56 of 151

Administration: General site admin and user management, including configuration, user registration and roles
Monitoring: handles the monitoring of the equipment status by an operator
Observer: handles the setting up of an observation via a telescope model, as well as the monitoring of an on-going observation
Scheduler: generic task scheduler service
Property and Event recorders: components to keep track of property and event registrations, and record values for later retrieval
Reporting and Export: handles generation of data for reporting, including plotting, as well as generation of data for exporting
Email sender: handles the sending of automated email notifications
Caching interface: sits between any REST GET requests to the LMC REST API to cache data that doesn’t change too often
Alarm listener: actively listens out for alarm notifications from the LMC and reports them to the connected users
The model is Object Relational Mapping (ORM) code which defines the database for the TM Emulator. Each app has its own model code and Django handles the generation of the database from this code.
The TM Emulator can record property values that users wish to monitor. For the most part the LMC only supplies real-time data, the TM Emulator implements this monitoring capability. Having said that, the LMC does create events for certain metrics that the TM Emulator can subscribe to and read from the event stream, such metrics need to be handled differently to the way described here. Both values (e.g. status) and metrics (e.g. temperature or voltage) properties can be monitored. All "single-valued" properties, including registers, can be monitored.
Document No.:Revision:Date:
Error: Reference source not foundError: Reference source not foundError: Reference source not found
Error: Reference source notfound
Author: A. Magro et al.Page 57 of 151

Figure 11-22. TM Emulator monitoring page screenshot
Figure 11-22 presents a screenshot of the operator view, showing a single deployed AAVS rack. The rack is show on the left hand side, highlighted in status colours. Green signifies that the hardware is online and functioning properly, orange signifies that there is an alarm set on the component, read signifies that the component is in a faulty state while grey signifies that the component state is unknown. The temperature history of all the TPMs in the rack is shown in the main portion of the page. Figure 11-23 presents a screenshot of the observation creation page, which allows observers to form stations from a selection of tiles, each of which can have an antenna mask applied. An observation settings page is the shown in which the user can specify observation-related parameters, such as pointing direction and frequency channels to use. Once an observation configuration is submitted the LMC will create the station and, if no errors arise, the emulator can then issue the start command which will start the observation. An observation monitoring page then provides the observer with plots showing antenna bandpasses, beam bandpasses, waterfall plots and other useful diagnostic plots. This functionality was not tested on AAVS1 due to lack of time.
Document No.:Revision:Date:
Error: Reference source not foundError: Reference source not foundError: Reference source not found
Error: Reference source notfound
Author: A. Magro et al.Page 58 of 151

Figure 11-23. TM emulator observation creation page screenshot
For a more detailed description of the TM emulator please see the documentation in the online repository hosting the TM emulator code1.
11.2 TPM Simulator
The TPM is the processing backbone of AAVS (and LFAA) and is the primary focus of most of the monitoring and control functionality developed in the prototype. However, the TPM and its firmware was also in development and not always readily available, therefore a simulator was required to be able to performance testing, especially scaling tests, of the TANGO system without the need for the physical hardware.
The TPM simulator implements the Tile API in Appendix A (since it must provide the same interface as that provided by AAVS Tile). All API functions were implemented with the appropriate signatures and return value types and ranges. Additionally, a state machine was defined within the simulator such that the order of execution of commands could be checked. For instance, calling connect would set the simulator state to CONNECTED, and initialise would set it to INITIALISED. initialise must be called after calling connect, so if connect was not called before initialise then the simulator will raise and exception. The internal state machine simplifies checking command execution order.
For the simulator to have a true representation of running TPM firmware, the XML memory maps described in 3.2.2 is also parsed by the simulator and presented using the same enumerations and structure as listed in the API. The simulator implements a dictionary which represents TPM memory and write and read operations can be performed. The simulator will simply remember what was written in each cell and does not implement register-specific functionality as would be the case for a low-level simulator of TPM hardware and firmware.1 https://bitbucket.org/aavslmc/aavs-tm/src/development/
Document No.:Revision:Date:
Error: Reference source not foundError: Reference source not foundError: Reference source not found
Error: Reference source notfound
Author: A. Magro et al.Page 59 of 151

The simulator also keeps track of the time elapsed since it was initialised (which on the TPM would set the time synchronised to a PPS). An internal thread updates the set time every second elapsed. Synchronisation across simulators forming a station was not implemented in the current version of the simulator, however this can be achieved by continually checking the time (system time or through and NTP server) to detect when a second has elapsed. This can form the basis of synchronised operations between simulators, such as simulating data transmission, application of coefficients or station configuration.
TPMs have internal sensors and registers which need to be monitored which are exposed in the API through function calls. The values returned by the sensors will change depending on state transitions, for example, FPGA temperature will rise slowly when programmed until an average peak temperature is reached. This behaviour is different for all sensors also implemented in the simulator. Figure 11-24 show the generated temperature value for a simulator instance after it enter the PROGRAMMED state.
Figure 11-24. Simulating TPM FPGA temperature after programming
The LMC monitors sensor values and may raise alarms when a threshold is reached. To provide tests cases for alarms, the simulator can be instructed to randomly alter sensor value to within a pre-defined range, based on a provided probability. For example, the simulator current can randomly jump up to 20 amps with a probability of 0.01. This allows for stress testing of the LMC system. This mechanism is also employed for all API functions, such that they might randomly raise exceptions or return an error.
TPMs can be instructed to transmit LMC data to be used for a variety of purposes, such as calibration, bandpass flattening and diagnostics. The simulator can also simulate this by implementing a SPEAD packet simulator for each data type, with the generated packet containing a test vector which can be used to test both the DAQ (since it must capture and interpret the packets) and in-observation processes, therefore providing the ability to simulate observation by using the TPM simulator. Note that this cannot be used to test performance since the output data rate will be much lower than from the TPM, but it can be used to test correctness and the LMC system.
Document No.:Revision:Date:
Error: Reference source not foundError: Reference source not foundError: Reference source not found
Error: Reference source notfound
Author: A. Magro et al.Page 60 of 151

12 Reusable Software Tools
This section lists the AAVS1 prototype software which can be adapted and reused for LFAA:
UCP had been adopted as the communication protocol between MCCS and TPMs. Therefore, the relevant parts of PyFABIL can be reused as is
The PyFABIL package can be reused. A refactoring effort has been performed on the package, removing all the C++ code and implementing all functionality in Python, thus reducing the complexity and software required for using this package. The TPM firmware plugins might need some re-implementation depending on the requirements for the LFAA firmware, however it is assumed that most of the plugins can be reused as they are
The core of the data acquisition library, most notable the network receiver and buffering system, can be adapted for LFAA. This will need further optimisation to meet the data rate requirements. Additionally, since the SPEAD packet formats used for AAVS have been adapted for LFAA, most of the data consumer implemented for AAVS can be re-used as well
The TPM simulator needs to be updated to match the iteration of the TPM which will be used for LFAA
The LMC system needs to be re-written to use the latest available TANGO version. The prototype has been to mature the LMC design for LFAA
The deploy and configuration tools need to be adapted to use a suitable DevOps tool
It should be noted that all software tools and libraries need to have a good number of units and integration tests with good coverage. The number of existing tests is very limited
Document No.:Revision:Date:
Error: Reference source not foundError: Reference source not foundError: Reference source not found
Error: Reference source notfound
Author: A. Magro et al.Page 61 of 151

13 Appendix A: Tile API
This section describes the high-level API which was defined for interfacing with the low-level software which interacts with TPMs.
General functionsconnect(initialise)Creates “connection” to board. When is True the initialise function is called immediately after connection (board must be programmed).
initialise()Performs all required initialisation (switches on on-board devices, locks PLL, performs synchronisation and other operations required to start configuring the signal processing functions of the firmware, such as channelisation and beamforming)
disconnect() Disconnects from board, internal state needs to be reset
get_firmware_list()Return a list containing the following information for each firmware stored on the board (such as in Flash memory). For each firmware, a dictionary containing the following keys with their respective values should be provided: ‘design’, which is a textual name for the firmware, ‘major’, which is the major version number, and ‘minor’.
download_firmware(bitfile)Downloads the firmware contained in bitfile to all FPGAs on the board. This should also update the internal register mapping, such that registers become available for use. bitfile can either be the ‘design’ name return from get_firmware_list(), or a path to a file.
program_cpld(bitfile)If the TPM has a CPLD (or other management chip which need firmware), this function program it with the provided bitfile. bitfile is the path to a file containing the required CPLD firmware.
is_programmed() Return True if the all FPGAs are programmed, False otherwise.
set_station_id(id)Set the station ID to which the tile belongs. Id is a numeric value
get_station_id(id)Return station ID
set_tile_id(id)Set the tile ID within the station to which the tile belongs. Id is a numeric value
Document No.:Revision:Date:
Error: Reference source not foundError: Reference source not foundError: Reference source not found
Error: Reference source notfound
Author: A. Magro et al.Page 62 of 151

get_tile_id(id)Return the tile ID within the station to which the tile belongs
Sensor
get_temperature()Get board temperature.
get_fpga_temperature(device) Get temperature for required device (FPGA). device is a value from the Device enumeration.
get_voltage()Get voltage consumption
get_current()Get current consumption.
get_adc_power()Return the RMS power of every ADC signal (so a TPM processes 16 antennas, this should return 32 RMS values)
set_fpga_time(device, device_time)Set tile time. device is the FPGA (from the Device enumeration) to set the time to while devie_time is the time being set.
get_fpga_time(device)Return FPGA time for specified device (from the Device enumeration).
wait_pps_event()Block until a PPS edge is detected, then return from function.
Register functions
Firmware registers and memory areas can be exposed for debugging from underlying layers.
get_register_list()Return a list containing description of the exposed firmware (and CPLD) registers. See RegisterInfo
read_register(register_name, n, offset, device)Return the value of the specified register. register_name is the string representation of the register, n is the number of 32-bit words to read, offset is the address offset within the register to read from and device is the FPGA to read from (from Device enumeration). Returns a list of values (unsigned 32-bit)
write_register(register_name, values, offset, device)Document No.:Revision:Date:
Error: Reference source not foundError: Reference source not foundError: Reference source not found
Error: Reference source notfound
Author: A. Magro et al.Page 63 of 151

Write values to the specified register. register_name is the string representation of the register, values is a list containing the 32-bit values to write, offset is the address offset within the register to write to and device is the FPGA to write to (from Device enumeration). Returns a list of values (unsigned 32-bit)
read_address(address, n)Read n 32-bit values from address
write_address(address, values)Write list of values at address
Network functions
configure_10g_core(core_id, src_mac, src_ip, dst_mac, dst_ip, src_port, dst_port)Configure 10g core_id with specified parametersAll parameters are numeric values
get_10g_core_configuration(core_id)Get 10g core configuration for core_id. This is required to chain up TPMs to form a station.
set_lmc_download(mode, payload_length, src_ip, lmc_mac)Specify whether control data will be transmitted over 1G or 40G networks
mode: ‘1G’ or ‘40G’payload_length: Size in bytes in UDP packetsrc_ip: Set 40g lane source IP (required only for 40G mode)lmc_mac: Set destination MAC for 40G lane (required only for 40G mode)
Observation functions
set_channeliser_truncation(truncation)Set the coefficients to modify (flatten) the bandpass. truncation is a N x M array, where N is the number of input channels and M is the number of frequency channels
set_beamformer_regions(region_array)Set the frequency regions which are going to be beamformed into a single beam. region_array is defined as a 2D array, for a maximum of 16 regions. Each element in the array defines a region, with:
start_channel: region starting channelnof_channels: size of the region, must be a multiple of 8beam_index: beam used for this region with range [0:8)
Total number of channels must be <= 384
configure_station_beamformer(nof_tiles, first_tile=False, start=False)
Document No.:Revision:Date:
Error: Reference source not foundError: Reference source not foundError: Reference source not found
Error: Reference source notfound
Author: A. Magro et al.Page 64 of 151

Initialise and start the station beamformer. nof_tiles is the number of tiles in the station, first_tile specifies whether the tile is the first one in the station, and start, when True, starts the beamformer
load_calibration_coefficients(antenna, calibration_coefficients)
Loads calibration coefficients (but does not apply them, this is performed by switch_calibration_bank). antenna is the antenna to which the coefficients will be applied. calibration_coefficients is a bidimensional complex array of the form calibration_coefficients[channel, polarization], with each element representing a normalized coefficient, with (1.0, 0.0) being the normal, expected response for an ideal antenna.
channel is the index specifying the channels at the beamformer output, i.e. considering only those channels actually processed and beam assignments.
The polarization index ranges from 0 to 3. 0: X polarization direct element 1: X->Y polarization cross element 2: Y->X polarization cross element 3: Y polarization direct element
The calibration coefficients may include any rotation matrix (e.g. the parallactic angle), but do not include the geometric delay.
load_beam_angle(angle_coeffs)angle_coefs is an array of one element per beam, specifying a rotation angle, in radians, for the specified beam. The rotation is the same for all antennas. Default is 0 (no rotation). A positive pi/4 value transfers the X polarization to the Y polarization. The rotation is applied after regular calibration.
load_antenna_tapering(tapering_coeffs)tapering_coeffs is a vector contains a value for each antenna the TPM processes. Default is 1.0
switch_calibration_bank(switch_time=0)Load the calibration coefficients at the specified time delay
set_pointing_delay(delay_array, beam_index)Specifies the delay in seconds and the delay rate in seconds/seconds. The delay_array specifies the delay and delay rate for each antenna. beam_index specifies which beam is desired (range 0-7).
load_pointing_delay(load_time=0)Loads the pointing delays at the specified time delay
start_beamformer(start_time=0)Start the beamformer at the specified time delay
stop_beamformer()Document No.:Revision:Date:
Error: Reference source not foundError: Reference source not foundError: Reference source not found
Error: Reference source notfound
Author: A. Magro et al.Page 65 of 151
Stop the beamformer
Data functions
The following function are used to control and transmit control data to the LMC server. Data transfer needs to be synchronised across tiles in a station, and appropriate functions would need to be implemented.
configure_integrated_channel_data(integration_time)Configure the transmission of integrated channel data with the provided integration time
configure_integrated_beam_data(integration_time)Configure the transmission of integrated beam data with the provided integration time
send_raw_data()Transmit a snapshot containing raw antenna data.
send_channelised_data(number_of_samples)Transmit a snapshot containing channelized data totalling number_of_samples spectra.
send_channelised_data_continuous(channel)Send data from channel channel continuously (until stopped).
send_beam_data()Transmit a snapshot containing beamformed data.
stop_data_transmission()Stop data transmission from board.
Support Structures
Enumeration Device: FPGA_1 = 1 FPGA_2 = 2 FPGA_3 = 4 FPGA_4 = 8 FPGA_5 = 16 FPGA_6 = 32 FPGA_7 = 64 FPGA_8 = 128 Board = 65536
Enumeration RegisterType: Sensor = 1 BoardRegister = 2 FirmwareRegister = 3 SPIDevice = 4 Component = 5 FifoRegister = 6
Document No.:Revision:Date:
Error: Reference source not foundError: Reference source not foundError: Reference source not found
Error: Reference source notfound
Author: A. Magro et al.Page 66 of 151

Enumeration Permission: Read = 1 Write = 2 ReadWrite = 3
Enumeration RegisterType: Sensor = 1 BoardRegister = 2 FirmwareRegister = 3 SPIDevice = 4 Component = 5 FifoRegister = 6
Enumeration Error: Success = 0 Failure = -1 NotImplemented = -2
Structure RegisterInfo: string name uint32 address RegisterType type Device device Permission permission uint32 bitmask uint32 bits uint32 size string desc
Structure SPIInfo: string name uint32 spi_sclk uint32 spi_en uint32 size string desc
Document No.:Revision:Date:
Error: Reference source not foundError: Reference source not foundError: Reference source not found
Error: Reference source notfound
Author: A. Magro et al.Page 67 of 151

14 Appendix B: AAVS-1 LMC PrototypeThis appendix describes the software architecture and implementation for the AAVS-1 TANGO LMC prototype.
What is included in this appendix?o Essentials on software architecture for the AAVS-1 TANGO LMC softwareo API level description of most commands/attributeso Interaction between various components
What is not included in this document?o Software implementation specifics
14.1 Notation
Throughout this appendix, the UML standard is used for notation. Some modifications have been made to help clarity, in particular to component and connector views. These modifications, related to colour-coding of ports, are explained in Figure 13-25.
Figure 13-25: Colour-coded notation for component and connector diagrams.
14.2 LMC Infrastructure View
This view will describe the details of the LMC infrastructure, sometimes in with some divergences in reference to the standards set in the LMC Guidelines document [RD1]. An effort has been made to comply as much as possible with the vision set in the LMC Guidelines whilst AAVS-1 LMC was in development. However, in most cases, the architecture is only a subset of the what the LMC Guidelines state, or differ in some aspects.
Document No.:Revision:Date:
Error: Reference source not foundError: Reference source not foundError: Reference source not found
Error: Reference source notfound
Author: A. Magro et al.Page 68 of 151

This view will describe a number of items in relation to the LMC infrastructure of AAVS LMC, mainly: States and modes of the AAVS LMC devices The alarms mechanism and procedure The events mechanism and procedure The logging mechanism and data flow The archiving mechanism and data flow Hierarchical reporting structure Control and monitoring interfaces Data generation and data flow
Figure 13-26: Component and Connector, high level context diagram.
The component and connector layout in Figure 13-26 shows the main interface points between the Telescope Manager Emulator (TM) and the AAVS LMC system. Communication across these two major elements happens on the basis of:
1. Telescope Model download2. Telescope State updates3. AAVS master control4. Logging functionality and forwarding5. Event functionality and forwarding6. Alarm handling and forwarding
The information flow is summarized in Table 13-6.
Document No.:Revision:Date:
Error: Reference source not foundError: Reference source not foundError: Reference source not found
Error: Reference source notfound
Author: A. Magro et al.Page 69 of 151

Table 13-6: TM to AAVS information flow description# From To Information Flow Description1 TM AAVS Telescope model
download2 AAVS TM Telescope state updates3 TM AAVS Commands and
requests/repliesThe AAVS master is the single point of control of an element by TM.
4 TM AAVS Logs configuration TM can request to setup the logging redirections required and what type of logging should be done
5 AAVS TM Alarms and events AAVS generates alarms and events based on pre-defined/post-defined rules and subscriptions, and feeds this information to TM when alarms are triggered.
6 AAVS TM Raw log data Based on a log configuration requested, AAVS sends off logs generated within the system to the central logging interface at TM.
14.2.1 Context Diagram
Figure 13-27 shows the primary use cases of the LMC infrastructure. The uses cases are limited by the LMC framework itself, and as such reflect the basic functionality provided by the Tango framework, on which the LMC system is constructed. Most of the LMC functionality can be considered in reference to a Tango device server providing functionality to different Tango clients.
Document No.:Revision:Date:
Error: Reference source not foundError: Reference source not foundError: Reference source not found
Error: Reference source notfound
Author: A. Magro et al.Page 70 of 151

Figure 13-27: Context diagram for the main use cases for LMC infrastructure.
14.2.2 Primary Presentation
The primary presentation is split to detail external interfaces from AAVS to TM, and internal interfaces within AAVS LMC.
14.2.2.1 External Interfaces
The main interfaces for the LMC Infrastructure view can be opened up into a primary presentation showing the main ports of communication across the interfaces between TM and AAVS. This is shown in Figure 13-28. In particular, this figure shows the main external interfaces involved in LMC Infrastructure. AAVS has 4 primary external components: a master device, an alarm stream device, an event stream device, and a file-based log store. A breakdown of the information flow for this primary presentation is given in
.
Document No.:Revision:Date:
Error: Reference source not foundError: Reference source not foundError: Reference source not found
Error: Reference source notfound
Author: A. Magro et al.Page 71 of 151

Figure 13-28: Primary presentation component and connector diagram.
Table 13-7: Information flow between all major LMC infrastructure components and TM.# From To Information Flow Description1 TM AAVS
MasterCommand and attribute read/write requests.
A request is made by the TM TANGO client and the response is sent back. All requests, reports, subscriptions etc. are sent as commands to the AAVS Master device.
2 AAVS Master
TM Alarms Any alarms generated by AAVS, and which are subscribed to by the TM are sent over.
3 AAVS Master
TM Events Any events generated by AAVS, and which are subscribed to by the TM are sent over.
4 Log Store TM Logs Logs generated by LMC can be viewed/filtered by TM via protocols like syslog.
14.2.2.2 Internal Interfaces
In order to satisfy the requests and data flow towards the external interfaces, all elements within the AAVS LMC system will need a unified way of providing the execution and data requests. Although the TANGO-based infrastructure provides a fully peer-to-peer form of communication, the salient connections for internal interfaces within the AAVS LMC element are highlighted in Figure 13-29.
Document No.:Revision:Date:
Error: Reference source not foundError: Reference source not foundError: Reference source not found
Error: Reference source notfound
Author: A. Magro et al.Page 72 of 151

Figure 13-29: Primary presentation component and connector diagram. This shows the main internal interfaces involved in LMC Infrastructure.
Information flow between the various internal LMC infrastructure components is detailed in .
Document No.:Revision:Date:
Error: Reference source not foundError: Reference source not foundError: Reference source not found
Error: Reference source notfound
Author: A. Magro et al.Page 73 of 151

Table 13-8: Information flow between all major LMC infrastructure components.# From To Information Flow Description1 AAVS Master AAVS Config
DeviceCommand and attribute read/write requests
The AAVS master is the only internal device that should control the AAVS Config Device.
2 AAVS Master AlarmStream Command and attribute read/write requests
The AAVS master is the only internal device that should control the AAVS alarm stream.
3 AAVS Master EventStream Command and attribute read/write requests
The AAVS master is the only internal device that should control the AAVS event stream
4 AAVS Master AAVS Logger Command and attribute read/write requests
The AAVS master is the only internal device that should control the AAVS logger.
5 AAVS Master Component devices
Command and attribute read/write requests
The AAVS master can directly control all other component devices in the LMC system.
6 AAVS Master AlarmStream Alarm messages Alarm messages are passed from the AAVS master alarm callback to the AlarmStream
7 Component devices
AlarmStream Alarm messages Alarm messages are passed from all component device alarm callbacks to the AlarmStream
8 AAVS Master EventStream Event messages Event messages are passed from the AAVS master to the EventStream, either as device events or attribute events.
9 Component devices
EventStream Event messages Event messages are passed from all component devices to the EventStream, either as device events or attribute events.
10 AAVS Master AAVS Logger Log events Log messages from AAVS Master are processed by the AAVS Logger.
11 Component devices
AAVS Logger Log events Log messages from all component devices are processed by the AAVS Logger.
12 AlarmStream AAVS Logger Log event Log messages from the AlarmStream are processed by the AAVS Logger.
13 EventStream AAVS Logger Log event Log messages from the EventStream are processed by the AAVS Logger.
14 AAVS Logger Log Store Log messages Logs proceesed by the AAVS Logger are then passed on the appropriate log store, in this case a file-based log system.
Document No.:Revision:Date:
Error: Reference source not foundError: Reference source not foundError: Reference source not found
Error: Reference source notfound
Author: A. Magro et al.Page 74 of 151

14.2.3 Element Catalog
All elements for LMC infrastructure have a direct connection to the TANGO framework and are all mostly representable as TANGO elements. The elements are based on an inheritance model of base class behaviour. An overview of these base classes is shown in Figure 13-30.
Document No.:Revision:Date:
Error: Reference source not foundError: Reference source not foundError: Reference source not found
Error: Reference source notfound
Author: A. Magro et al.Page 75 of 151

Document No.:Revision:Date:
Error: Reference source not foundError: Reference source not foundError: Reference source not found
Error: Reference source notfound
Author: A. Magro et al.Page 76 of 151

Figure 13-30: Base classes class diagram.
A brief summary of these LMC Infrastructure base classes is as follows:1. TANGODevice: The lower-most class and what the TANGO framework provides as a base for
all devices. The attributes for this device are defined in the TANGO documentation.2. AAVSLoggerDevice: a device that implements the TANGO logging interface. The TANGO
logging interface defines a logger device that has a log() method, which is used to define custom logging behaviour. This class inherits from the TangoDevice class.
3. AAVSDevice: an AAVS-wide base class. All devices developed for AAVS must be built by inheriting from this class. This device defines LMC infrastructure behaviour that is shared across all AAVS devices.
4. AlarmStreamDevice: a class which takes wraps around the Elettra alarm device mechanism, to provide a centralised stream of alarm messages in the AAVS LMC system.
5. EventStreamDevice: a class which is responsible for managing device or attribute event subscriptions, and for providing a centralised stream of event messages in the AAVS LMC system.
6. DiagnosticsStreamDevice: a class which is responsible for centrally collecting diagnostic information messages and streaming this data on request in the AAVS LMC system.
7. GroupDevice: a class which serves as a base device for a composition of devices in some meaningful group. The TANGO proxy provides ad-hoc creation of Group device proxies. However, this proxy is only available within the scope of its creation and is therefore stateless. The idea of a group device is to have an actual TANGO device representing a group of devices, or possibly an aggregation of devices. This class is expected to harmonize the way groups of devices are interacted with within the AAVS system.
8. JobDevice: a device that provide abstract behaviour for starting/stopping system jobs/scripts from within the AAVS LMC system. This is essentially an interface to a long-running system call/executing service/program.
14.2.3.1 AAVSLogger Device Element
A full description of properties, commands and important helper methods for the AAVSLoggerDevice base classes is provided in Table 13-9,Table 13-9 and Table 13-11 respectively.
Table 13-9: AAVSLoggerDevice base class property descriptions.Property Descriptionlog_path: string A string containing the root directory of all logs for the TANGO LMC
system e.g. “opt/aavs/log/tango”.
Table 13-10: AAVSLoggerDevice base class command descriptions.Command Descriptionping() This is a command a client can use to test connectivity with the
logger device. In return the logger will output its current state to the TANGO info_stream and return.
log() A method that processes a log request from any device which has this logger as its logging target. This method will extract the log level, source device, and log message from the log event.
A timestamp upon receiving the log is formed. The logger device will
Document No.:Revision:Date:
Error: Reference source not foundError: Reference source not foundError: Reference source not found
Error: Reference source notfound
Author: A. Magro et al.Page 77 of 151

check if a python logger exists for the source device type in question, and if not create one.
The logger for the device type in question is then passed on with the log timestamp, message and level, and the details are logged on the respective file.
Document No.:Revision:Date:
Error: Reference source not foundError: Reference source not foundError: Reference source not found
Error: Reference source notfound
Author: A. Magro et al.Page 78 of 151

Table 13-11: AAVSLoggerDevice base class helper method descriptions.Helper Method Descriptionsetup_logger(logger_name: string, log_file: string, level: enum)
A helper to create a python logger based on the supplied logger name, the path of the rotating file handler to be created for this log (one rotating log per individual device in the LMC system), and the log level. The log format is defined in this method.
14.2.3.2 AAVSDevice Element
A full description of properties and commands for the AAVSDevice base class is provided in Table 13-9Table 13-14 and Table 13-15 respectively.
Table 13-12: AAVSDevice base class property descriptions.Property Descriptiondomain: string Property: string with the domain of this device, default is
“test”.elettra_alarm_device_address: string Property: string with the TANGO device address of the alarm
device (Elettra alarm device)central_alarmstream_device_address: string
Property: string with the TANGO device address of the central alarm stream associated with this device.
metric_list: vector of string Property: vector with the list of attributes to be exposed as “metrics”.
register_list: vector of string Property: vector with the list of attributes to be exposed as “registers”.
command_list: vector of string Property: vector with the list of “commands” that should be exposed to clients. Other commands may be available, but are generally not used in normal execution of the LMC system.
default_poll_period: int Property: integer with the default poll period for polling a new attribute/command, in case no poll period is defined by the client.
central_diagstream_device_address Property: string with the TANGO device address of the central diagnostics stream associated with this device.
active_alarms: int The number of alarms active for this device.device_event_counter: int The number of events emitted by the device since the last
reset.device_event_info: string A string holding the device-level event information.visual_state: enum The visual state for a device. The TANGO states of
FAULT/ALARM/ON need to be visualized by TM emulator for every device. This state encapsulates this information based on the following rules:
1. If the TANGO state is FAUL, visual state is FAULT.2. If there are 1 or more active alarms, visual state is
ALARM.3. If the device is ON, visual state is ON.
alarms_set: boolean Deprecateddiagnosis_mode: boolean A flag indicating whether the device is running with
diagnostics on/off.rack_id: int The ID of the rack device where this device is encased in.
Document No.:Revision:Date:
Error: Reference source not foundError: Reference source not foundError: Reference source not found
Error: Reference source notfound
Author: A. Magro et al.Page 79 of 151

Table 13-13: AAVSDevice base class command descriptions.Command Descriptionstart_poll_command(argin: string)
A command to start polling on a command. The idea of this is to allow any device in the system to initiate polling on any other device. The input parameter is a JSON dictionary, with 3 parameters:
poll_command: the command to be polled period: the polling period, default of 1000ms device_proxy: the device on which command polling is to
startIf the command to be polled is already polled, current polling settings are overwritten.
to_json(argin: string) Returns a JSON representation/report of this device. stop_polling_command(argin: string)
A command to stop polling on a command. The idea of this is to allow any device in the system to terminate polling on any other device. The input parameter is a JSON dictionary, with 2 parameters:
poll_command: the command to terminate polling for proxy: the device on which command polling is to
terminatecommands_to_json(argin: string)
A command that returns a JSON report with a list of all commands in the device. The input parameter is a JSON string with key “with_context”, of type Boolean, with a default value of “True”. This is the default setting and adds context of the command to the report (device type and id of the device hosting the command).
attributes_to_json(argin: string)
A command that returns a JSON report with a list of attributes in the device. The input parameter is a JSON string with the dictionary keys:
with_value: if True, the current value of the attribute is included in the report
with_context: if True, context information is provided with this list (device type and ID)
alarm_on(argin: string) The callback to run when an alarm is detected for this device. Usually overridden by most devices, but the default behavior which should be present in all devices is to push alarm information to the central alarm stream. The value passed to the command by the Elettra Alarm Server is made by concatenating the alarm rule name and the values of the attributes involved in the formula in the form attr_name=value. The separator character is ‘;’.
alarm_off() The callback to run when an alarm is turned back off for this device. Usually overridden by most devices, but the default behavior which should be present in all devoice is to push alarm information to the central alarm stream. The value passed to the command by the Elettra Alarm Server is made by concatenating the alarm rule name and the values of the attributes involved in the formula in the form attr_name=value. The separator character is ‘;’.
Document No.:Revision:Date:
Error: Reference source not foundError: Reference source not foundError: Reference source not found
Error: Reference source notfound
Author: A. Magro et al.Page 80 of 151

create_alarm(argin: string) A command for any device to create an alarm rule/trigger. Any device can be instructed to create any form of alarm, on any device. The JSON input parameter defines the alarm to be created, which is parsed and configured.
remove_alarm(argin: string) A command to remove an alarm rule/trigger. Any device can be instructed to remove an alarm rule, on any device. The JSON input parameter defines a dictionary with the key “alarm_name”. This is the ID of the alarm to be removed.
get_device_alarms() This command will return a list of alarm names (in a JSON string) which are configured for this device.
emit_event(argin: string) Emits a device level event with a custom message passed as input parameter. Each device emits events based on changing a string attribute “device_event_info”, with a string containing the following fields:
EventID in the form of a counter, per device Event message Device state
All fields are placed in a dictionary, encoded in a JSON string, and placed in the “device_event_info” attribute. The command then pushes an event (user_event) for this attribute. All subscribed clients (e.g. EventStream device) will receive this event notification.
get_metrics() Returns a list of attributes marked as metrics for the device.on_exported_hook() This is an auxiliary hook for code to run after the TANGO device
has been successfully exported. Any code placed here will be run by a thread upon device export.
reset() Code placed in this command will run when the device should be reset to a default state.
ping() A command for a device to do its own state book-keeping. This ping command is run periodically, for periodic device state book-keeping and updates.
14.2.3.3 AlarmStream Device Element
A full description of properties and commands for the AlarmStreamDevice base class is provided in Table 13-14 and Table 13-15 respectively.
Table 13-14: AlarmStreamDevice base class property descriptions.Property Descriptionqueue_length: int The central alarm stream is a FIFO queue, with a length defined by this
parameter. Every time a client pops alarm messages from the queue, the oldest entries are popped first, making space for other entries. If no pops are made and the queue limit is reached, the oldest alarm messages are overwritten circularly.
Table 13-15: AlarmStreamDevice base class command descriptions.Command Descriptionpush(argin: string) Push is a command that accepts an alarm notification. The input is a
``;`` delimited string, as follows:
Document No.:Revision:Date:
Error: Reference source not foundError: Reference source not foundError: Reference source not found
Error: Reference source notfound
Author: A. Magro et al.Page 81 of 151

Field [0]: Alarm name Field [1]: Timestamp for when the message to this stream
was sent Field [2]: One of ``ALARM`` or ``NORMAL`` indicating
whether an alarm was triggered, or whether a previously triggered alarm is back to normal.
Field [3:end]: address/values of attributes that triggered the alarm
pop() Retrieves the next Alarm notification from the system, returned as a JSON string.
popx(argin: int) Pops X alarms from the stream – the number of alarms to pop is passed as a parameter. Returns a JSON string with a list of alarm messages.
14.2.3.4 EventStream Device Element
A full description of properties, commands and helper methods for the EventStreamDevice base class is provided in Table 13-16,Table 13-17 and Table 13-18 respectively.
Table 13-16: EventStreamDevice base class property descriptions.Property Descriptionqueue_length: int The central event stream is a FIFO queue, with a length defined by this
parameter. Every time a client pops event messages from the queue, the oldest entries are popped first, making space for other entries. If no pops are made and the queue limit is reached, the oldest event messages are overwritten circularly.
Table 13-17: EventStreamDevice base class command descriptions.Command Descriptionpush(argin: string) Push is a command that accepts an event notification. The input is a
JSON string with a dictionary, that has a number of key and value pairs as follows:
timestamp: the timestamp of when the event occurred source: the name of the device that emitted the event description: any event message information device_state: the state of the device at the time the event was
emittedpop() Retrieves the next event notification from the system, returned as a
JSON string.popx(argin: int) Pops X alarms from the stream – the number of events to pop is
passed as a parameter. Returns a JSON string with a list of event messages.
subscribe_to_device(argin: string)
Subscribes to device event. Input parameter is a JSON string with the key/value element ‘device_name’. The value for this is a string with the TANGO device address of the device to be subscribed to for device-level events. If there is no current subscription to this particular device, then the event stream will subscribe to the “device_event_info” attribute of the device (which will store device event information). This attribute subscription is a USER_EVENT type. When this event is
Document No.:Revision:Date:
Error: Reference source not foundError: Reference source not foundError: Reference source not found
Error: Reference source notfound
Author: A. Magro et al.Page 82 of 151

detected, the “device_event_push_callback” of the EventStreamDevice is called.
If the device being subscribed to is a group device, then this method automatically subscribes to device events of all members.
unsubscribe_to_device(argin: string)
Unsubscribes from device events. Input parameter is a JSON string with the key/value element ‘device_name’. The value for this is a string with the TANGO device address of the device to be unsubscribed from for device-level events.
If the device being subscribed to is a group device, then this method automatically unsubscribes from device events of all members.
get_device_subscriptions() This command will return a list of device names to which this event stream is subscribed to for device level events.
subscribe_to_attribute(argin: string)
Subscribes to attribute events. Input parameter is a JSON encoded dictionary with the elements:
attribute_name: string with attribute addressAttribute is verified to be of numeric type only, otherwise no subscription can be made.
Unsubscribe_from_attribute(argin: string)
Unsubscibes from attribute events. Input parameter is a JSON encoded dictionary with the elements:
attribute_name: string with attribute addressget_attribute_subscriptions()
This command returns a list of attribute names to which this event stream is subscribed to for attribute level events.
get_subscriptions(argin: string)
Returns a list of subscriptions (device or attribute level), based on a filter. This filter is supplied as a JSON string input argument, which has one or more of the following keys:
event_type: the type of event to filter for component_type: the type of component to filter for component_id: the individual device id to filter for attribute: the particular attribute to filter for
This command returns a JSON string with a list of subscriptions in this stream matching the filtered search.
Table 13-18: EventSTreamDevice base class helper method descriptions.Helper Method Descriptiondevice_event_callback(event_info: event)
This callback function will format event information and append the event to the internal event queue. This event info is a TANGO
event_info object, containing, amongst other things: event errors event reception date and time device firing event
14.2.3.5 DiagnosticsStream Device Element
A full description of properties and commands for the DiagnosticsStreamDevice base class is provided in Table 13-19 and Table 13-20 respectively.
Document No.:Revision:Date:
Error: Reference source not foundError: Reference source not foundError: Reference source not found
Error: Reference source notfound
Author: A. Magro et al.Page 83 of 151
Table 13-19: DiagnosticsStreamDevice base class property descriptions.Property Descriptionqueue_length: int The central diagnostics stream is a FIFO queue, with a length defined by
this parameter. Every time a client pops diagnostic messages from the queue, the oldest entries are popped first, making space for other entries. If no pops are made and the queue limit is reached, the oldest diagnostics messages are overwritten circularly.
metric_report: string A string with a JSON structure containing the latest metric report of all metrics in the system, for every device that collects metric data.
alarm_notifications: int Keeps a record of how many alarm notifications the running system has generated. Essentially, when diagnostics is turned on, alarms that usually travel to the central alarm stream are also mirror in the diagnostics stream.
event_notifications: int Keeps a record of how many event notifications the running system has generated. Essentially, when diagnostics is turned on, events that usually travel to the central event stream are also mirror in the diagnostics stream.
Table 13-20: DiagnosticsStreamDevice base class command descriptions.Command Descriptionpush_event(argin: string) Push is a command that accepts an event notification. The input is a
JSON string with a dictionary, that has a number of key and value pairs as follows:
timestamp: the timestamp of when the event occurred source: the name of the device that emitted the event description: any event message information device_state: the state of the device at the time the event
was emittedpop_event() Retrieves the next event notification from the system, returned as a
JSON string.popx_events(argin: int) Pops X alarms from the stream – the number of events to pop is
passed as a parameter. Returns a JSON string with a list of event messages.
push_alarm(argin: string) Push is a command that accepts an event notification. The input is a JSON string with a dictionary, that has a number of key and value pairs as follows:
timestamp: the timestamp of when the event occurred source: the name of the device that emitted the event description: any event message information
device_state: the state of the device at the time the event was emitted
pop_alarm() Retrieves the next event notification from the system, returned as a JSON string.
popx_alarms(argin: int) Pops X alarms from the stream – the number of events to pop is passed as a parameter. Returns a JSON string with a list of event messages.
get_metric_report() A command that gathers a metric report from all active devices. This command populates the metric_report attribute.
get_device_tree() A command that outputs the entire list of active devices in the LMC
Document No.:Revision:Date:
Error: Reference source not foundError: Reference source not foundError: Reference source not found
Error: Reference source notfound
Author: A. Magro et al.Page 84 of 151

system.start_state_monitoring() A command that instructs the central event stream to subscribe to
state attribute changes in all devices.stop_state_monitoring() A command that instructs the central event stream to unsubscribe
from state attribute changes in all devices.
Document No.:Revision:Date:
Error: Reference source not foundError: Reference source not foundError: Reference source not found
Error: Reference source notfound
Author: A. Magro et al.Page 85 of 151

14.2.3.6 GroupDevice Element
A full description of properties and commands for the GroupDevice base class is provided in Table13-19 and Table 13-20 respectively.
Table 13-21: GroupDevice base class property descriptions.Property Descriptionmember_list: vector of string
This is a list of TANGO device addresses of the members forming this group.
members_state: vector of enum
This is a list of TANGO states for each device of the members forming this group.
Table 13-22: GroupDevice base class command descriptions.Command Descriptionadd_member(argin: string) Adds a member to this group. The input argument is a JSON string
with a dictionary containing the key “device_name”. This parameter must contain the TANGO address of the device to add to this group. Future subscriptions/alarms made to the group will apply to this new member.
remove_member(argin: string)
Removes a member from this group. The input argument is a JSON string with a dictionary containing the key “device_name”. This parameter must contain the TANGO address of the device to remove from this group. Member subscriptions/alarms are left untouched.
run_command(argin: string)
Runs a command, common to members of the group. The input parameter is a JSON string encoding a dictionary with the keys:
cmd_name: the command to run cmd_args: the arguments to pass to the command
This command is deprecated.get_attribute_list(argin: string)
Returns a list of attributes matching “attribute_name” if specified, or all attributes if no attribute_names are specified. The returned information is collected from all devices in the group. The input parameter is a dictionary encoded as a JSON string with the keys:
attribute_name: name of attribute to report for all device device_name: by default attributes are reported for all
devices. If required, the individual device name can be specified. This is as if querying for a particular/all attribute/s of a particular device
with_value: indicates if the report should contain current attribute values or not
get_member_names(argin: string)
Returns a JSON list of member names in this group, optionally filtered by the “component_type” input parameter – supplied as a key in a JSON encoded dictionary.
Document No.:Revision:Date:
Error: Reference source not foundError: Reference source not foundError: Reference source not found
Error: Reference source notfound
Author: A. Magro et al.Page 86 of 151

14.2.3.7 JobDevice Element
A full description of properties and commands for the JobDevice base class is provided in Table 13-21 and Table 13-22 respectively.
Table 13-23: JobDevice base class property descriptions.Property Descriptioncwd: string Property – contains the cdw (current working directory) from where to
start executing the job.cmd: string Property – contains the cmd (system command) to execute from this
device. Commands are run as processes.
Table 13-24: JobDevice base class command descriptions.Command Descriptionstart() Starts the job. An operating system process is created to run the
“cmd”. This device will be able to internally track the process with a unique process ID (given by the operating system). Calling this command when process is already started will have no effect (no additional process is started). Internally, polling to check the running status of the process is initiated – with a check occurring every 3 seconds.
stop() Terminates the job. The process is sent a KILL signal at an operating system level. Polling on this process is stopped.
check_running() A command that checks if a process is still running. Returns TRUE or FALSE.
Document No.:Revision:Date:
Error: Reference source not foundError: Reference source not foundError: Reference source not found
Error: Reference source notfound
Author: A. Magro et al.Page 87 of 151

14.2.4 General Element Behaviour
This section details the behavioural aspect of the various elements involved in LMC infrastructure for AAVS.
13.2.4.1 Reporting Behaviour
The activity diagram in Figure 13-31 describes the process that any LMC device performs to generate a self-report. The generation of a main report involves creating a JSON document with the component ID, component type, any firmware listing, properties, commands, and in case of a Group device, the list of members forming the group. However, there is no recursive call to generate reports from all subcomponents in the group. To generate a full report of a particular device, the to_json() method of that device must be called individually.
Document No.:Revision:Date:
Error: Reference source not foundError: Reference source not foundError: Reference source not found
Error: Reference source notfound
Author: A. Magro et al.Page 88 of 151

Figure 13-31: Activity diagram for AAVS device JSON report generation.
13.2.4.2 Logging Behaviour
The flow of information for log messages is demonstrated in Figure 13-32. All TANGO devices can log their behaviour at various log levels. The logs are sent to the designated log target within the element. At the very least, each element will have an element log target. This element log target is configured directly at system initialization.
Document No.:Revision:Date:
Error: Reference source not foundError: Reference source not foundError: Reference source not found
Error: Reference source notfound
Author: A. Magro et al.Page 89 of 151
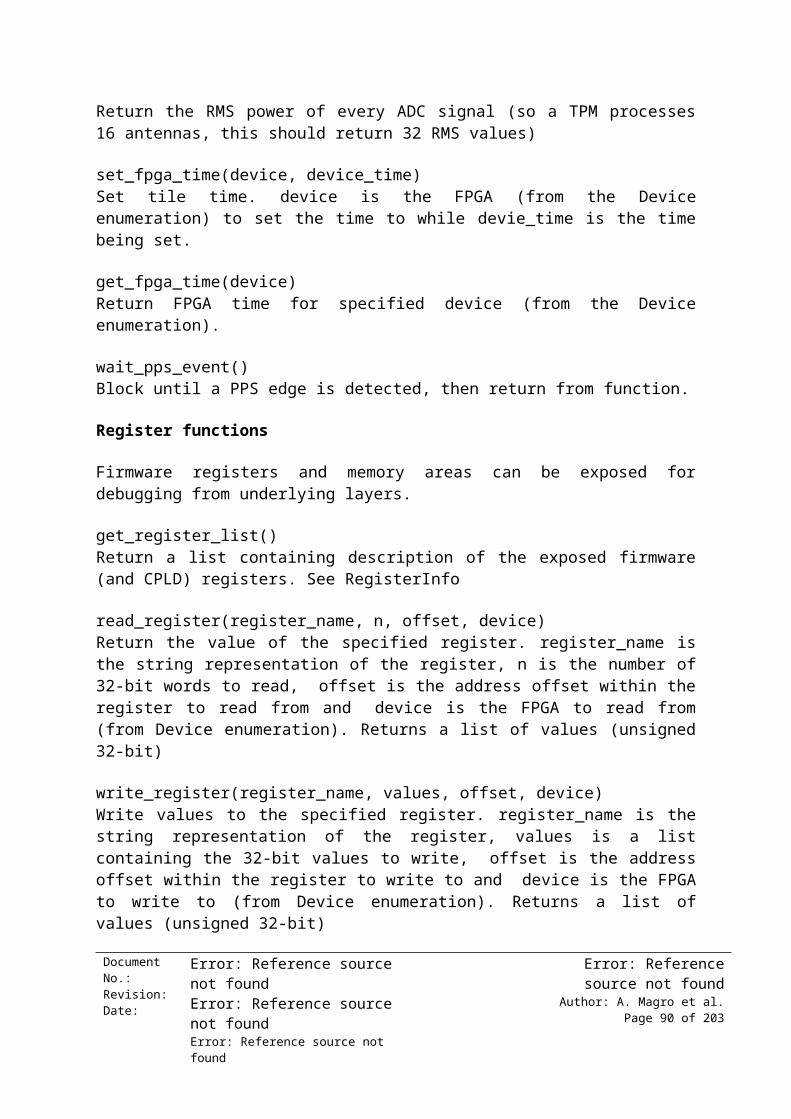
The AAVS logger implements the TANGO logging interface, which will have the log information sent to the file log storage in a predetermined format. Log viewers, if implemented can analyse/filter/view content directly from the files.
Figure 13-32: Log message sequence diagram.
Document No.:Revision:Date:
Error: Reference source not foundError: Reference source not foundError: Reference source not found
Error: Reference source notfound
Author: A. Magro et al.Page 90 of 151

Optionally, the central logger at TM will be interested in any or all logs generated by the various elements. In this case, log messages are also forwarded to the central logger:
1. either by the element logger itself2. the component device generating the log3. syslog forwarding from the element log store to the central log store.
Generally, it is expected that element log stores do not keep a full history of logs, but only a specified time window. The central log store however, will have much longer term log storage.
13.2.4.3 Alarm Behaviour
Figure 13-33 shows the basic activity TANGO devices have on the quality property of attributes which cross predefined alarm thresholds. All attributes in all devices can follow this activity, however the AAVS LMC implementation does not make use of this TANGO core alarm system. Instead, all alarms are configured via the Elettra alarm system, whether they are simple attribute alarms, or more complex rule-based alarms.
Figure 13-33: Abstract attribute-based alarm quality behaviour for TANGO core alarm system.
Document No.:Revision:Date:
Error: Reference source not foundError: Reference source not foundError: Reference source not found
Error: Reference source notfound
Author: A. Magro et al.Page 91 of 151

At a higher/element level, alarm conditions can be represented as rules in the Elettra alarm device. For alarm rules, attributes involved in an alarm must have polling enabled, and the Alarm device is able to subscribe to change events over the attributes. When those events occur, alarm rules are evaluated to check if the alarm rule has been trigger ON or OFF. In both cases, an alarm_on() or alarm_off() callback on the device owning the attribute is called. This alarm callback, amongst other things (dependent on the individual device implementation) will send an alarm notification to the AAVS alarm stream device. This process is shown in the activity diagram in Figure 13-34.
Document No.:Revision:Date:
Error: Reference source not foundError: Reference source not foundError: Reference source not found
Error: Reference source notfound
Author: A. Magro et al.Page 92 of 151

Figure 13-34: Alarm activity diagram.
Document No.:Revision:Date:
Error: Reference source not foundError: Reference source not foundError: Reference source not found
Error: Reference source notfound
Author: A. Magro et al.Page 93 of 151
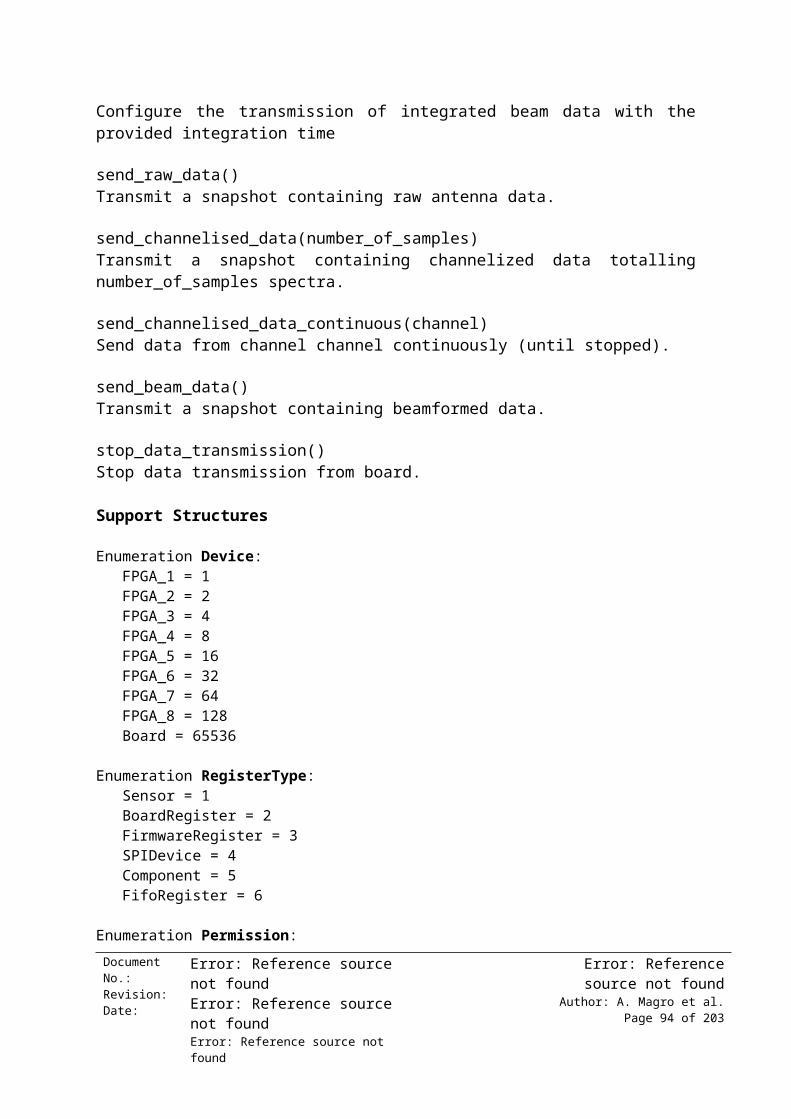
13.2.4.4 Event Behaviour
Events in TANGO are based on subscription to changes in attributes. AAVS requires the use of both attribute events, but also generic device events. For device level events, a special string attribute exists in all AAVS devices, and the event stream device can subscribe to changes to this particular attribute. Device level event messages are stored in this special string attribute, and upon changing the message details, the event stream receives a notification. Figure 13-35 shows an activity diagram for event information generation across the LMC infrastructure.
Figure 13-35: Activity diagram for event generation.
Document No.:Revision:Date:
Error: Reference source not foundError: Reference source not foundError: Reference source not found
Error: Reference source notfound
Author: A. Magro et al.Page 94 of 151

13.2.4.5 General Exception Handling Flow
The general procedure for handling exceptions in AAVS LMC is shown in Figure 13-36. The list of exception types thrown by the TANGO framework are:
1. DevFailed2. ConnectionFailed3. CommunicationFailed4. WrongNameSyntax5. NonDbDevice6. WrongData7. NonSupportedFeature8. AsynCall9. AsynReplyNotArrived10. EventSystemFailed11. NamedDevFailedList12. DeviceUnlocked
Figure 13-36: AAVS LMC exception handling flow
Document No.:Revision:Date:
Error: Reference source not foundError: Reference source not foundError: Reference source not found
Error: Reference source notfound
Author: A. Magro et al.Page 95 of 151

All TANGO core exceptions are wrapped in a DevFailed exception type. AAVS implements an exception manager, and this exception manager wraps around most command calls with a “with” context. When exceptions occur, the stack trace is filtered out for the exception, wrapped into a log message and passed to the FATAL_STREAM log. The exception manager supports a parameter for a callback function to be called in exception management. If this callback is defined, then it is executed after the exception has been logged. If the exception caught is not a TANGO exception, but a generic Python exception, this is also handled in a similar manner, except that the stack trace will show different information about the source of the exception.
TANGO defines a number of exceptions types, despite all being presented as a DevFailed exception. A tuple of three values gives information about the exception that is currently being handled. By logging this information, it is possible to analyse the cause of why the exception has occurred. The values returned are (type, value, traceback). When one of the Tango exceptions is caught, the type will be class name of the exception (DevFailed, etc.) and the value a tuple of dictionary objects all of which containing the following kind of key-value pairs:
1. reason: a string describing the error type (more readable than the associated error code)2. desc: a string describing in plain text the reason of the error3. origin: a string giving the name of the (C++ API) method which thrown the exception4. severity: one of the strings WARN, ERR, PANIC giving severity level of the error
Depending on the exception type, there are a possible list of combinations and causes for the exception, and this is determined by the TANGO system. These are summarized in Table 13-25.
Table 13-25: A summary of TANGO exception types and their causes.Exception Type Error Type DevError Info AvailableConnectionFailed DB_DeviceNotDefined The name of the device not defined in
the databaseAPI_CommandFailed The device and command nameAPI_CantConnectToDevice The device nameAPI_CorbaException The name of the CORBA exception, its
reason, its locality, its completed flag and its minor code
API_CantConnectToDatabase The database server host and its port number
API_DeviceNotExported The device nameCommunicationFailed API_DeviceTimedOut The time-out value and device name
API_CommunicationFailed The device and command nameAsynCall API_BadAsynPollId
API_BadAsynAPI_BadAsynReqType
AsynReplyNotArrivedEventSystemFailed API_NotificationServiceFailed
API_EventNotFoundAPI_InvalidArgsAPI_MethodArgumentAPI_DSFailedRegisteringEvent
Document No.:Revision:Date:
Error: Reference source not foundError: Reference source not foundError: Reference source not found
Error: Reference source notfound
Author: A. Magro et al.Page 96 of 151

13.3 Hardware Monitoring and Control View
13.3.1 Context Diagram
Most of the interaction required for monitoring and controlling any device wrapped in a TANGO framework can be summarized by the context diagram in Figure 13-37, based on the stakeholders of the system during three phases: system design and development, system running, and system maintenance. This context diagram maps primary use cases of monitoring and control that are essential to various stakeholders. Based on these, this view will define a number of major elements involved in the monitoring and control functionality of the system (aside from observation running, which is defined as a separate view), and detail the behaviour of these elements.
Document No.:Revision:Date:
Error: Reference source not foundError: Reference source not foundError: Reference source not found
Error: Reference source notfound
Author: A. Magro et al.Page 97 of 151

Figure 13-37: Monitoring and control elements have a narrow interface defined by the TANGO framework. Within this framework, there a number of primary use-cases required for monitoring and control.
Furthermore, within the context of having most monitoring and control functionality wrapped in a TANGO server, the activity of a client of the monitoring and control system is unified. This unified activity is summarized in Figure 13-38.
Document No.:Revision:Date:
Error: Reference source not foundError: Reference source not foundError: Reference source not found
Error: Reference source notfound
Author: A. Magro et al.Page 98 of 151

Figure 13-38: Unified activity for TANGO clients during run-time of the AAVS LMC system.
Document No.:Revision:Date:
Error: Reference source not foundError: Reference source not foundError: Reference source not found
Error: Reference source notfound
Author: A. Magro et al.Page 99 of 151

13.3.2 Primary Presentation
In order to be able to provide the essential monitoring and control functionality of the hardware devices in the system, which then bubble up to more complex monitoring and control functionality at an observation/instrument level, this view will define the composition of TANGO device elements, which map directly to hardware elements. This is shown in Figure 13-39.
Figure 13-39: Components defined for hardware devices, collectively forming a hierarchy of monitoring and control functionality all the way up to the AAVS Master device.
13.3.3 Element Catalog
This subsection will present all the hardware TANGO devices of the system which provide the basis upon which monitoring, and control behaves for the AAVS LMC system to run according to requirements. For every TANGO device, there are defined:
A class diagram with attributes and commands States of the device and meaning A description of element behaviour with one or more of:
o Suggested alarms pertaining to the deviceo An explanation of all essential attributes and commands for the device
Document No.:Revision:Date:
Error: Reference source not foundError: Reference source not foundError: Reference source not found
Error: Reference source notfound
Author: A. Magro et al.Page 100 of 151

o Activity diagrams to define special flows required to be implemented for the particular device, where necessary
13.3.3.1 Antenna
Class Diagram
Figure 13-40: Antenna device class diagram (inherits from AAVSDevice)
Element Behaviour
StatesValue Description and comments
ON Device is powered on.ALARM Device is in ALARM state. One or more attributes involved in an alarm rule has
crossed the alarm threshold.UNKNOWN Unreachable or unknown state.
FAULT Device is faulty, or an unrecoverable exception occurred.INIT Device is initializing.OFF Device is powered off.
RUNNING A device command is running, used in an observation.STANDBY Device is in standby, waiting for a command to be issued to it.
Alarms# Alarm Condition Description1 State = FAULT An unrecoverable fault occurred, and operator needs to be notified
CommandsThere are currently no device commands at antenna level.
Document No.:Revision:Date:
Error: Reference source not foundError: Reference source not foundError: Reference source not found
Error: Reference source notfound
Author: A. Magro et al.Page 101 of 151

13.3.3.2 PDU
Class Diagram
Figure 13-41: PDU device class diagram (inherits from AAVSDevice)
Element Behaviour
States
Range Description and comments ON Device is powered on.
ALARM Device is in ALARM state. One or more attributes involved in an alarm rule has crossed the alarm threshold.
UNKNOWN Unreachable or unknown state.FAULT Device is faulty, or an unrecoverable exception occurred.
INIT Device is initializing.
Alarms
# Alarm Condition Description1 State = FAULT An unrecoverable error that requires operator
intervention has been detected.
Commands
There are currently no device commands at PDU level. However, this TANGO PDU driver works by interacting with a python PDU driver for the particular device. This driver is currently exposing a number of commands, which will be integrated in the TANGO driver.
# PDU Driver Commands Description1 port_info(port: int, field:
string)Retrieves port information, based on port number and query field (“enabled”, “name” or “current”)
2 disable_port(port: int) Disables a port.3 enable_port(port: int) Enables a port.4 system_voltage() Get system voltage.
Document No.:Revision:Date:
Error: Reference source not foundError: Reference source not foundError: Reference source not found
Error: Reference source notfound
Author: A. Magro et al.Page 102 of 151

5 system_current() Get system current.
The current TANGO driver supports some of the read operations which utilize these commands. These are shown in the following activities.
Document No.:Revision:Date:
Error: Reference source not foundError: Reference source not foundError: Reference source not found
Error: Reference source notfound
Author: A. Magro et al.Page 103 of 151

Activity – Port Enabled/Disabled StatusThe activity in Figure 13-42 describes how a TANGO PDU driver is able to interact with the Python PDU driver, and call the methods available to it in order to populate monitoring points. In this particular example, a user sets attribute polling on a port status, and the polling mechanism calls the Python PDU driver periodically for a port status update.
Figure 13-42: PDU polled check for port status
Document No.:Revision:Date:
Error: Reference source not foundError: Reference source not foundError: Reference source not found
Error: Reference source notfound
Author: A. Magro et al.Page 104 of 151

13.3.3.3 Switch
Class Diagram
Figure 13-43: Switch device class diagram (inherits from AAVSDevice)
A set of switches are responsible for routing most of the data transfers occurring in/out of AAVS. To this end, the device representing a switch will have attributes to reflect the various ports. It is envisioned that once functionality in the low level Python driver is available, attributes will be added for ingress/outgress packet statistics. Therefore, for every port housed by the switch, monitoring points will include the number of packets coming into the port (ingress), the number of packets moving out from the port (outgress), and the number of packet errors per port. These are however not currently available.
Element Behaviour
States
Range Description and comments ON Device is powered on.
ALARM Device is in ALARM state. One or more attributes involved in an alarm rule has crossed the alarm threshold.
UNKNOWN Unreachable or unknown state.FAULT Device is faulty, or an unrecoverable exception occurred.
INIT Device is initializing.
Commands
Similarly to the PDU device, there are currently no device commands at Switch level. However, this TANGO Switch driver works by interacting with a python Switch driver for the particular switch in use in AAVS. This driver is currently exposing a number of commands, which can be integrated in the TANGO driver in future.
# Switch Driver Commands Description1 request_root() Get request root.2 login() Log into switch.3 query(xml_request: string) Send XML query to switch.4 get_module_information() Get list of module names.Document No.:Revision:Date:
Error: Reference source not foundError: Reference source not foundError: Reference source not found
Error: Reference source notfound
Author: A. Magro et al.Page 105 of 151

5 update_module_status() Check the status of each module.6 get_interface_information() Get interface list.7 update_interface_information(interface:
string)Update information of a particular interface.
8 check_status() Get the status for each module on device.
Alarms# Alarm Condition Description1 State = FAULT2 X_temperature > MAX Max temperature TBD
13.3.3.4 Server
Class Diagram
Figure 13-44: Class diagram for a server device (inherits from AAVSDevice)
Element Behaviour
States
Range Description and comments ON Device is powered on.
ALARM Device is in ALARM state. One or more attributes involved in an alarm rule has crossed the alarm threshold.
UNKNOWN Unreachable or unknown state.FAULT Device is faulty, or an unrecoverable exception occurred.
INIT Device is initializing.
Commands
Similarly to the PDU device, this TANGO Server driver works by interacting with a python Server driver for the particular servers used in AAVS, which are monitored by a Ganglia service. This driver is currently exposing a number of commands, which can be integrated in the TANGO driver in future.
# TANGO Server Commands
Description
1 update_ganglia_data() This command will interact with the python Ganglia monitor driver, Document No.:Revision:Date:
Error: Reference source not foundError: Reference source not foundError: Reference source not found
Error: Reference source notfound
Author: A. Magro et al.Page 106 of 151

and read the metrics from the Ganglia server. The metrics are given back to the TANGO server device.
# Ganglia Driver Commands
Description
1 read_data_from_port() Reads data from a particular port.2 read_xml_data() Reads XML data - calls read_data_from_port()3 read_metrics() Reads XML metric data from Ganglia service4 Initialize_monitor() Initialise ganglia monitor for the metrics specified5 get_metric_value(host:
string, metric: string)Get a metric value for a particular host
6 check_host(host: string) Check if a host exists in Ganglia data7 update_monitor() Update monitor data
Alarms
Alarms can be defined for attributes which are created dynamically after the TANGO device has been initialized. These alarms are created for metrics such as server core temperature, CPU usage etc. These alarms cannot be defined on LMC startup.
# Alarm Condition Description1 State = Fault
13.3.3.5 Rack
Class Diagram
Figure 13-45: Class diagram for a Rack device (inherits from GroupDevice)
A rack is a collection of devices stored in the various rack units, and this is reflected in the form of a class of type GroupDevice. The rack is defined by addresses to devices for PDUs, Switches, Servers and Tiles which are encased in the rack.
Document No.:Revision:Date:
Error: Reference source not foundError: Reference source not foundError: Reference source not found
Error: Reference source notfound
Author: A. Magro et al.Page 107 of 151

Element Behaviour
States
Range Description and comments ON Device is powered on.
ALARM Device is in ALARM state. One or more attributes involved in an alarm rule has crossed the alarm threshold.
UNKNOWN Unreachable or unknown state.FAULT Device is faulty, or an unrecoverable exception occurred.
INIT Device is initializing.
Commands
There are no particular commands implemented for the Rack device, except that the functionality for Group management described earlier in this document applies to all the members of a rack.
Alarms
Alarms can be defined on the individual states of the devices concerned. This can be done at the device level. At a group level, it is important to set an alarm for the visual_state attribute, which summarizes its value depending on the states of member devices. Therefore, locality of faults and alarms can be signalled at Rack level.
# Alarm Condition Description1 State = FAULT2 visual_state = FAULT, ALARM
Document No.:Revision:Date:
Error: Reference source not foundError: Reference source not foundError: Reference source not found
Error: Reference source notfound
Author: A. Magro et al.Page 108 of 151

13.3.3.6 Tile
Class Diagram
Figure 13-46: Tile class diagram, attributes (left) and command (right) - inherits from GroupDevice
The TANGO Tile device wraps around the TPM Access Layer (see REF). However, there is a lot of TANGO specific functionality taken care of at the TANGO level, and the commands will be described in some detail below.
Document No.:Revision:Date:
Error: Reference source not foundError: Reference source not foundError: Reference source not found
Error: Reference source notfound
Author: A. Magro et al.Page 109 of 151

Element Behaviour
States
Range Description and comments ON Device is powered on.
ALARM Device is in ALARM state. One or more attributes involved in an alarm rule has crossed the alarm threshold.
UNKNOWN Unreachable or unknown state.FAULT Device is faulty, or an unrecoverable exception occurred.
INIT Device is initializing.RUNNING A tile command is being executed.STANDBY Tile is waiting for any command to be called.
OFF Device is powered off.
Commands
# TANGO Tile Commands Description1 delete_device() Overrides the default TANGO call, to disconnect the tile. First any
data transmission is haled, then the register set is cleared, all dynamic attributes are flushed, the device state is set to OFF, and the is_connected attribute is set to FALSE.
2 init_device() Sets up a tile instance based on an IP/port (connection to a particular tile object in the Access Layer), defines metrics, exportable registers are set up as dynamic attributes.
3 basic_connect_tile() If a tile instance is present, a connection to the device is established. The instance is not initialized/re-initialized, simulation mode is off, and no ADAs are enabled.
4 download_weights() Instructs the tile instance to download beamforming weights.5 initialize_tile() Connects to the tile, and performs initialization on it.6 on_exported_hook() When the Tile device is exported, this hook will in turn initialize
and export all Antenna members of this Tile.7 ping() This ping performs a number of health checks on the Tile:
Checks if a tile instance object exists, and creates it if not. Checks that the tile can be connected to Checks if registers on the TPM board can be read Checks if the Tile has the correct value for the
is_programmed flag Makes sure the Tile device state is not changed if there is
an Alarm present8 program_tile(argin: string) Programs tile with a specified bitfile. The input is a JSON
parameter set of the form: [{`name`: `bitfile`, `type`: `str`}]9 reset() Resets tile.10 send_beam_data() Send beam data from TPM. Previous transmissions are stopped,
data transmission is ensure to be synchronized across FPGAs and the data is sent, based on timestamp and beam_seconds attributes.
11 send_channelised_data() Send channelised data from TPM. Previous transmissions are
Document No.:Revision:Date:
Error: Reference source not foundError: Reference source not foundError: Reference source not found
Error: Reference source notfound
Author: A. Magro et al.Page 110 of 151
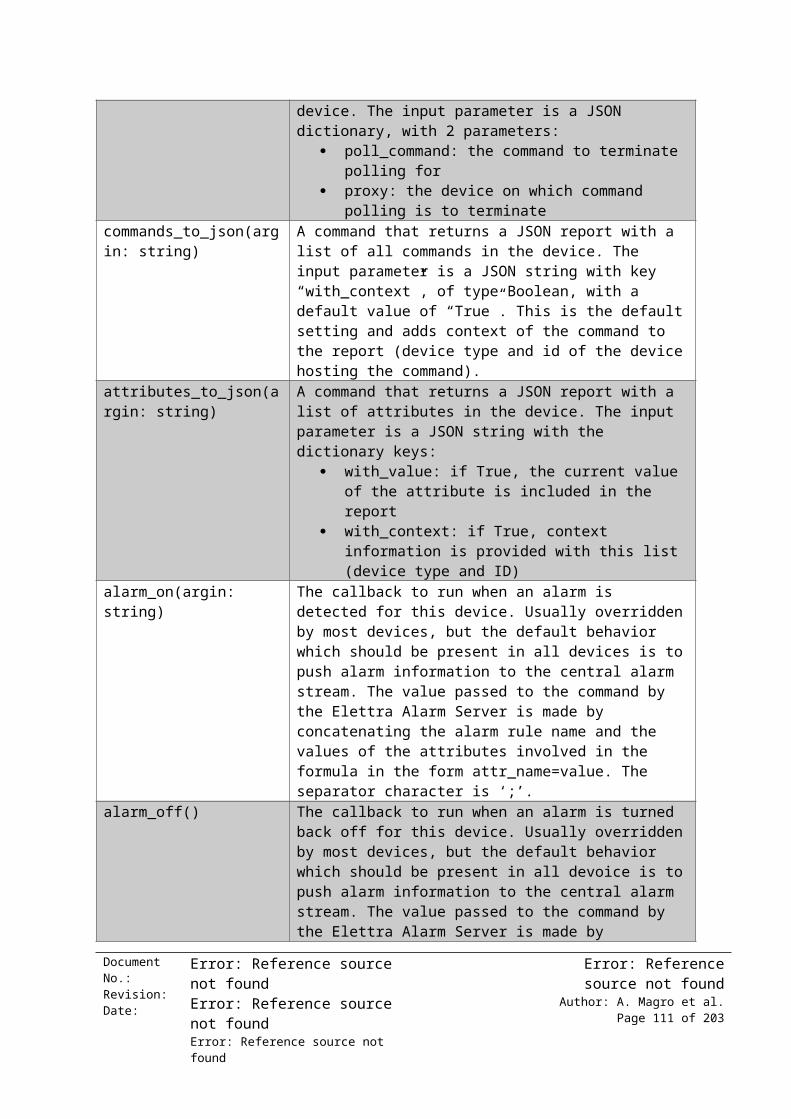
stopped, data transmission is ensure to be synchronized across FPGAs and the data is sent, based on timestamp, channelised_seconds, and channelized_samples attributes.
12 send_csp_data() Send CSP data. Any other data streams are stopped prior to data being sent. Data transmission is based on timestamp, seconds, samples_per_packet and number_of_samples attributes.
13 send_raw_data() Send raw data from TPM. Previous transmissions are stopped, data transmission is ensure to be synchronized across FPGAs and the data is sent, based on sync, timestamp and seconds attributes.
14 set_antenna_fault(argin: string)
This command marks a particular antenna polarization to faulty or not. The input is a JSON parameter set of the form:[{`name`: `antenna_idx`, `type`: `int`}, {`name`: `polarization_idx`, `type`: `int`}, {`name`: `fault_state`, `type`: `bool`}]
15 set_antenna_used(argin: string)
This commands marks a particular antenna polarization to used or not. The input is a JSON parameter set of the form: [{`name`: `antenna_idx`, `type`: `int`}, {`name`: `polarization_idx`, `type`: `int`}, {`name`: `used_state`, `type`: `bool`}]
16 start_acquisition(argin: string)
This commands starts data acquisition. The input is a JSON parameter set of the form:[{`name`: `start_time`, `type`: `str`}, {`name`: `delay`, `type`: `str`}]
17 stop_beam_data() Stops transmission of beam data.18 stop_channelised_data() Stops transmission of channelized data.19 stop_csp_data() Stops transmission of CSP data.20 stop_data_transmission() Stops all active data transmissions.21 stop_raw_data() Stops transmission of raw data.22 synchronized_beamformer_
coefficients(argin: string)Synchronises beamformer coefficients download. Input is a JSON parameter set of the form:[{`name`: `timestamp`, `type`: `int`}, {`name`: `seconds`, `type`: `int`}]
23 temp_alarm_on(argin: string)
Callback for temperature alarm ON. Input is a string sent by the Elettra alarm device when triggering this callback.
24 temp_alarm_off(argin: string)
Callback for temperature alarm OFF. Input is a string sent by the Elettra alarm device when triggering this callback.
25 board_temp_alarm_on(argin: string)
Callback for board temperature alarm ON. Input is a string sent by the Elettra alarm device when triggering this callback.
26 board_temp_alarm_off(argin: string)
Callback for board temperature alarm OFF. Input is a string sent by the Elettra alarm device when triggering this callback.
27 voltage_alarm_on(argin: string)
Callback for board voltage alarm ON. Input is a string sent by the Elettra alarm device when triggering this callback.
28 voltage_alarm_off(argin: string)
Callback for board voltage alarm OFF. Input is a string sent by the Elettra alarm device when triggering this callback.
29 current_alarm_on(argin: string)
Callback for board current alarm ON. Input is a string sent by the Elettra alarm device when triggering this callback.
30 current_alarm_off(argin: string)
Callback for board current alarm OFF. Input is a string sent by the Elettra alarm device when triggering this callback.
Document No.:Revision:Date:
Error: Reference source not foundError: Reference source not foundError: Reference source not found
Error: Reference source notfound
Author: A. Magro et al.Page 111 of 151

31 switch_off() A placeholder for operations to perform to turn off a tile. Currently not implemented, but it is envisaged that this will send a request to the respective PDU device to turn off power to this Tile.
32 switch_on() A placeholder for operations to perform to turn on a tile. A test implementation is available, which communicates with the respective PDU and sends a request to turn power on for this Tile.
33 config_cores() Configures core source/destination paths.34 config_last_tile(argin: string) Configure source and destination address for a tile when it is the
last tile in a station chain. Input is a JSON parameter set of the form:[{`name`: `config`, `type`: `str`}, {`name`: `core_id`, `type`: `int`}]
35 send_channelised_data_continuous()
Starts continuous sending of channelized data, based on the channel_id, number_of_samples, wait_seconds, timestamp and seconds attributes.
36 stop_integarated_data() Stops transmission of integrated data.37 set_lmc_download(argin:
string)Sets lmc download on a particular bus path. Input is a JSON parameter set of the form:[{`name`: `bus_path`, `type`: `str`}]
38 set_lmc_integrated_download(argin: string)
Sets lmc integrated download parameters. Input is a JSON parameter set of the form:[{`name`: `v1`, `type`: `str`}, {`name`: `v2`, `type`: `int`}, {`name`: `v3`, `type`: `int`}]
39 tweak_transceivers() Command to tweak tile transceivers.40 get_10g_configuration(argin
: int)Return 10g core configuration for a particular core_id. This is required to chain up TPMs to form a station.
41 configure_10g_core(argin: string)
Configures 10g cores. Input is a JSON parameter set of the form: [{`name`: `tile_config`, `type`: `str`}, {`name`: `next_tile_config`, `type`: `str`} {`name`: `core_id`, `type`: `int`}]The tile_config will contain: src_mac, src_ip, dst_mac, dst_ip, src_port, dst_port
42 configure_station_beamformer(argin: string)
Configures station beamformer. Input is a JSON parameter set of the form:[{`name`: `n_tiles`, `type`: `int`}, {`name`: `first_tile`, `type`: `bool`} {`name`: `start`, `type`: `bool`}]
43 wait_pps_event() Waits for PPS event.44 delay_calc(argin: string) Calls delay_calc. Input is a JSON parameter set of the form:
[{`name`: `current_delay`, `type`: `int`, `name`:`current_tc`, `type`:`int`, `name`: `ref_low`, `type`: `int`, `name`: `ref_hi`, `type`: `int`}]
45 set_channeliser_truncation(argin: string)
Sets channeliser truncation scale. Input is a JSON parameter set of the form:[{`name`: ` channel_truncation `, `type`: `str`}]
46 configure_integrated_chann Configures continuous integrated channel data. Input is a JSON
Document No.:Revision:Date:
Error: Reference source not foundError: Reference source not foundError: Reference source not found
Error: Reference source notfound
Author: A. Magro et al.Page 112 of 151

el_data(argin: string) parameter set of the form:[{`name`: `integration_time`, `type`: `int`}]
47 configure_integrated_beam_data(argin: string)
Configures continuous integrated beam data. Input is a JSON parameter set of the form:[{`name`: `integration_time`, `type`: `int`}]
48 configure_integrated_station_beam_data(argin: string)
Configures continuous integrated station beam data. Input is a JSON parameter set of the form:[{`name`: `integration_time`, `type`: `int`}]
49 stop_integrated_beam_data()
Stops transmission of integrated beam data.
50 stop_integrated_station_beam_data()
Stops transmission of integrated station beam data.
51 stop_integrated_channel_data()
Stops transmission of integrated channel data.
Document No.:Revision:Date:
Error: Reference source not foundError: Reference source not foundError: Reference source not found
Error: Reference source notfound
Author: A. Magro et al.Page 113 of 151

Alarms
# Alarm Condition Description1 State = FAULT2 temperature_board > MAX Max temperature TBD3 temperature_fpga1 > MAX Max temperature TBD4 temperature_fpga2 > MAX Max temperature TBD5 voltage > MAX Max voltage TBD6 current > MAX Max current TBD8 State = UNKNOWN Tile connectivity lost
Activity - Tile Ping Checks
The activity in Figure 13-47 describes the Tile device ping() operation which runs a number of health and connectivity checks.
Document No.:Revision:Date:
Error: Reference source not foundError: Reference source not foundError: Reference source not found
Error: Reference source notfound
Author: A. Magro et al.Page 114 of 151
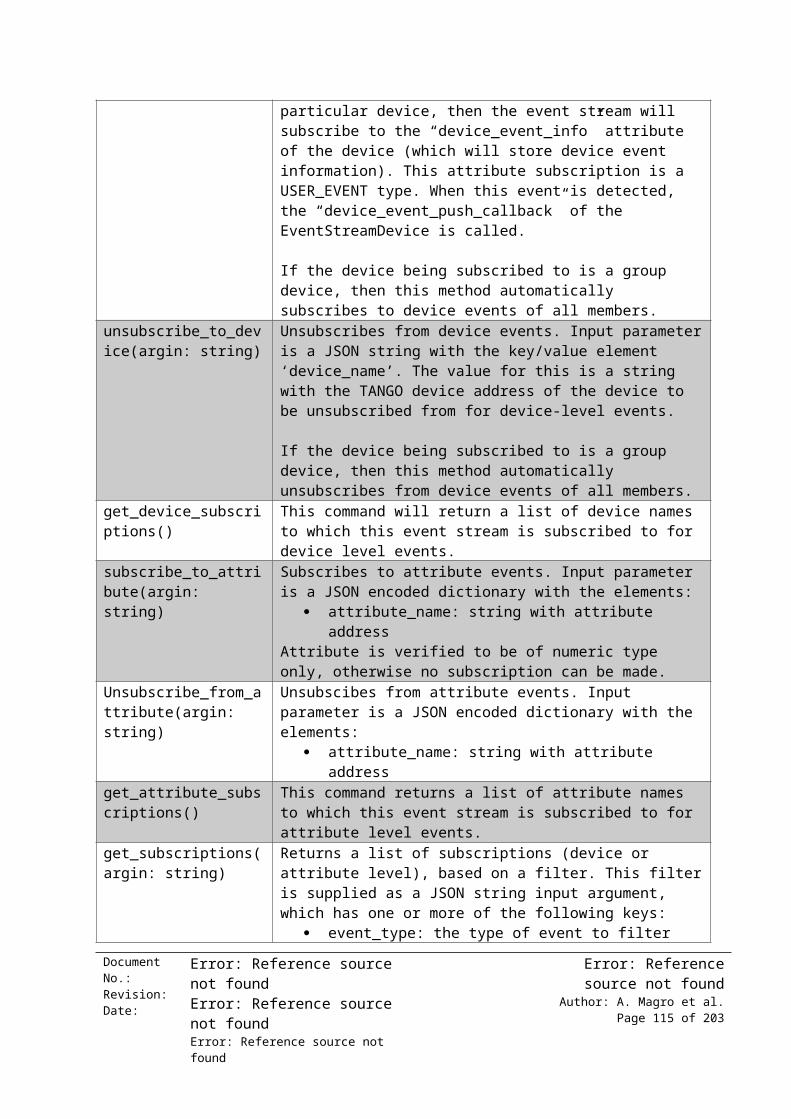
Figure 13-47: Tile ping() health-check.
13.4 Observation Monitoring and Control View
13.5.1 Context Diagram
The primary uses cases for observation monitoring and control in AAVS LMC are shown in Figure 13-48. The main points are related to the setup of station configurations, the submission of the required Tile firmware and sky model data required for calibration, and the monitoring of the observation and the various jobs/pipelines running in an observation.
Document No.:Revision:Date:
Error: Reference source not foundError: Reference source not foundError: Reference source not found
Error: Reference source notfound
Author: A. Magro et al.Page 115 of 151

Figure 13-48: Context diagram for Observation creation and monitoring.
Document No.:Revision:Date:
Error: Reference source not foundError: Reference source not foundError: Reference source not found
Error: Reference source notfound
Author: A. Magro et al.Page 116 of 151
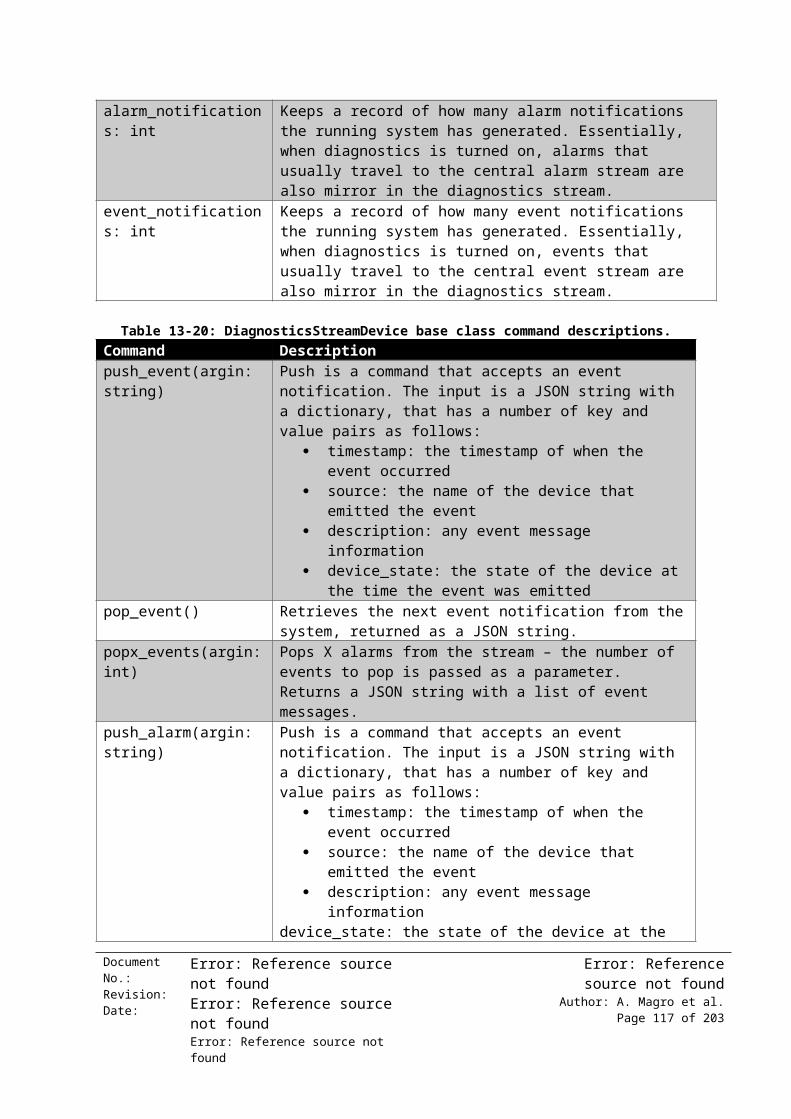
13.5.2 Primary Presentation
The primary components for observation configuration and execution is shown in Figure 13-49. AAVS only allows for a single observation to be running at any one time. The observation configuration (in the form of a JSON document) is passed down to the AAVS Master from TM. The observation configuration parameters are stored as attributes in the observation configuration device, which serves as a configuration reference for the entire AAVS LMC. The basic observation descriptor involves a station configuration with the respective tile members in each station, a list of jobs to run for the observation (one or more of DAQ/Calibration/Pointing), and respective configuration parameters for the Jobs themselves e.g. the kind of data acquisition to be performed by the DAQ job.
Figure 13-49: The primary components involved in the setup and execution of an observation in AAVS.
Document No.:Revision:Date:
Error: Reference source not foundError: Reference source not foundError: Reference source not found
Error: Reference source notfound
Author: A. Magro et al.Page 117 of 151

13.5.3 Element Catalog
13.5.3.1 AAVS Master Controller (LMC Device)
Class Diagram
Figure 13-50: LMC Master device class diagram (inherits from GroupDevice).
The LMC device is the top level device in the AAVS LMC system. All calls coming from the TM Emulator described earlier are routed to this single device, despite the possibility of every TANGO client being able to connect directly to any device (such as the CLI tools). However, this narrow interface in the AAVS design allows for a single point of access, and a unified way of sending and receiving command requests and replies. Most of the commands allows by this device allow for a rich JSON parameter set which notify the system of which particular device or attribute in the entire LMC hierarchy must be controlled.
Element Behaviour
States
Value Description and comments ON LMC is ON.
ALARM Something within LMC, or the LMC master itself is in Alarm state.UNKNOWN LMC is in an unknown state.
Document No.:Revision:Date:
Error: Reference source not foundError: Reference source not foundError: Reference source not found
Error: Reference source notfound
Author: A. Magro et al.Page 118 of 151

Alarms
No alarms are yet set for this device.
Commands
# LMC Master Driver Commands
Description
1 init() For initialization, the LMC master will:1. Create an observation configuration device instance2. Create an observation device instance (only one is
allowed in AAVS)3. Configure logging for itself
2 Get_attributes(argin: string) Returns attribute/s information based on the query criteria provided. Input is a JSON parameter set of the form: [{`name`: `device_id`, `type`:`str`}, {`name`:`device_type`, `type`:`str`} {`name`:`attribute`, `type`:`str`}
3 Set_attributes(argin: string) Sets attribute/s value/s based on the query criteria provided. Input is a JSON parameter set of the form: [{`name`:`device_type`, `type`: `str`}, {`name`:`device_attributes`, `type`: [[{`name`: `attribute_name`, `type`:`str`, `default`: `*`}, {`name`: `device_name`, `type`:`str`, `default`: `*`}, {`name`: `polling_frequency`, `type`:`int`}, {`name`: `alarm_values`, `type`:`list`, `default`: `[]`}, {`name`: `min_value`, `type`:`int`}, {`name`: `max_value`, `type`:`int`}, {`name`: `value`, `type`:`str`}, ]]} ]
4 Get_commands(argin: string) Returns command information based on the query criteria provided. Input is a JSON parameter set of the form: [{`name`: `device_id`, `type`:`string`}, {`name`:`device_type`, `type`:`string`} {`name`:`command_name`, `type`:`string`} ]
5 get(argin: string) Returns a JSON device report based on the query criteria provided. Input is a JSON parameter set of the form: [{`name`: `device_id`, `type`:`str`}, {`name`:`device_type`, `type`:`str`} ]
6 Filter(argin: string) Returns a set of paged and filtered device reports based on a complex filter. Input is a JSON parameter set of the form: [{`type`:`str`, `name`: `domain`}, {`type`:`str`, `name`: `device_type`}, {`type`:`list`, `name`: `rack_ids`, `default`: null}, {`type`:`list`, `name`: `station_ids`, `default`: null}, {`type`:`int`, `name`: `skip`, `default`:0}, {`type`:`int`, `name`: `limit`, `default`: 10} ]
Document No.:Revision:Date:
Error: Reference source not foundError: Reference source not foundError: Reference source not found
Error: Reference source notfound
Author: A. Magro et al.Page 119 of 151
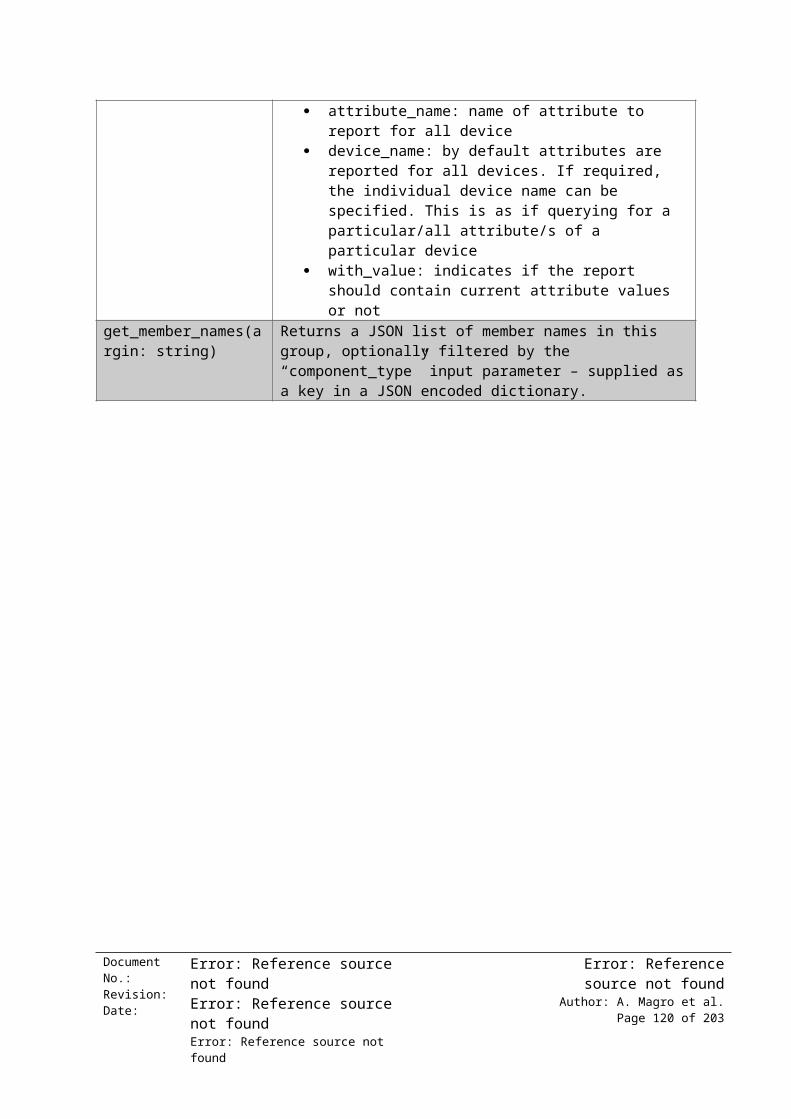
7 set_attribute(argin: string) Sets attribute values or attribute configuration. Input is a JSON parameter set of the form: [{`name`:`device_type`, `type`: `str`}, {`name`:`device_attribute`, `type`: [{`name`: `attribute_name`, `type`:`str`, `default`: `*`}, {`name`: `device_name`, `type`:`str`, `default`: `*`}, {`name`: `polling_frequency`, `type`:`int`}, {`name`: `alarm_values`, `type`:`list`, `default`: `[]`}, {`name`: `min_value`, `type`:`int`}, {`name`: `max_value`, `type`:`int`}, {`name`: `value`, `type`:`str`}, ]} ]
8 Init_observation(argin: string) Initialize the observation with a given telescope model/observation configuration. Input is a string with a JSON observation configuration.
9 start_observation(argin: string)
Starts initialized observation. Input is deprecated.
10 stop_observation(argin: string)
Stops running observation. Input is deprecated.
11 get_data_file(argin: string) Returns the data file path for the specified tile id and data type. Input is a JSON parameter set of the form:[{`name`: `tile_id`, `type`: `str`}, {`name`: `datatype`, `type`: `str`}]
12 Set_skymodel(argin: string) Sets the LMC skymodel to the one supplied.13 Get_skymodel() Returns a copy of the current LMC sky model.14 Set_antenna_locations(argin:
string)Set the LMC antenna locations to the one supplied.
15 Get_antenna_locations() Returns a copy of the current antenna locations.16 filter_tiles(argin: string) Same as filter(), but specializes in tiles. Input is a JSON
parameter set of the form: [{`type`:`str`, `name`: `domain`}, {`type`:`str`, `name`: `device_type`}, {`type`:`list`, `name`: `rack_ids`, `default`: null}, {`type`:`list`, `name`: `station_ids`, `default`: null}, {`type`:`int`, `name`: `skip`, `default`:0}, {`type`:`int`, `name`: `limit`, `default`: 10}]
17 add_alarm_subscription(argin: string)
Creates an alarm on the specified device. Input is a JSON parameter set with all alarm fields required specified: component_type, component_id, attribute, alarm_on_callback, alarm_off_callback, absolute, min, max.
18 remove_alarm_subscription(argin: string)
Removes an alarm on the specified device. Input is a JSON parameter set with all alarm fields required specified: componenty_type, component_id, attribute.
19 Get_configured_alarms(argin: string)
Returns a list of configured alarms for the supplied component_type and component_id.
20 Get_active_alarms(argin: string)
Returns a list of active alarms for the supplied component_type and component_id.
21 Get_rack_id(argin: string) Returns the rack_id for the rack that is hosting a particular
Document No.:Revision:Date:
Error: Reference source not foundError: Reference source not foundError: Reference source not found
Error: Reference source notfound
Author: A. Magro et al.Page 120 of 151

device/id combination. Input is a JSON parameter set of the form:[{`name`: `component_type`, `type`: `str`}, {`name`: `component_id`, `type`: `int`}]
22 Get_observation_datatypes() Returns the DAQ data types available for this observation.
Document No.:Revision:Date:
Error: Reference source not foundError: Reference source not foundError: Reference source not found
Error: Reference source notfound
Author: A. Magro et al.Page 121 of 151

13.5.3.2 Observation Configuration
Class Diagram
Figure 13-51: Observation configuration device class diagram.
Document No.:Revision:Date:
Error: Reference source not foundError: Reference source not foundError: Reference source not found
Error: Reference source notfound
Author: A. Magro et al.Page 122 of 151

Element Behaviour
The observation configuration device acts as an internal database of all parameters required for the particular configuration. Values are passed on from TM to this device and stored in attributes. The device also has a number of helper commands related to the mapping of LMC IDs to device serials. Conceptually this can be extended to contain an entire hardware configuration database, but this was not fully implemented for AAVS.
States
Value Description and comments ON Device is powered on.INIT Device is initializing.OFF Device is powered off.
STANDBY Device is in standby, waiting for a command to be issued to it.
Alarms
No alarms are yet set for this device.
Commands
# ObservationConfiguration Driver Commands
Description
1 Sm_setup_skymodel() A command that sets up the internal representation of the sky model based on the JSON description provided by the scalar attribute: sm_sky_model
2 Sm_get_source_by_id(argin: string)
Returns sky model source information for a given source ID. This ID is probably going to be the source name. Input is a JSON parameter set of the form: [{`name`: `source_id`, `type`: `str`}]
3 Sm_get_source_ids() Returns a list of IDs, which will be names of Sky Model sources.4 Tm_setup_telescopemodel() A command that sets up the internal representation of the
telescope model and antenna locations based on the JSON description provided by the scalar attribute: tm_telescope_model
5 tm_get_antenna_ids() Returns a list of antenna IDs, which will be names antennas supplied in the telescope model upload.
6 tm_get_tile_serial_for_antenna_id(argin: string)
Returns tile serial for a given antenna ID. This ID is probably going to be the antenna name. Input is a JSON parameter set of the form: [{`name`: `antenna_id`, `type`: `str`}]
7 tm_get_antenna_ids_for_tile_serial(argin: string)
Returns list of antenna IDs for given tile serial. Input is a JSON parameter set of the form: [{`name`: `tile_serial`, `type`: `str`}]
8 tm_get_antenna_info_for_antenna_id(argin: string)
Returns antenna information for an antenna ID. Input is a JSON parameter set of the form: [{`name`: `antenna_id`, `type`: `str`}]
9 tm_map_tile_serial_to_tile_address(argin: string)
This command will map an arbitrary tile serial ID for this telescope with the respective TANGO tile address. In order to sync tile serials with internal TANGOTile addresses, it is important for the initialization of the Tile devices to call this method to register the mapping between themselves and the
Document No.:Revision:Date:
Error: Reference source not foundError: Reference source not foundError: Reference source not found
Error: Reference source notfound
Author: A. Magro et al.Page 123 of 151

tile serials. Tile serials should therefore be provided to the Tile device as device properties as part of their configuration. Input is a JSON parameter set of the form: [{`name`: `tile_serial`, `type`: `str`}, {`name`: `tile_address`, `type`: `str`}]
10 tm_get_tile_serial_for_tile_address(argin: string)
This command returns a corresponding telescope tile serial for a provided TANGO Tile address. Input is a JSON parameter set of the form: [{`name`: `tile_address`, `type`: `str`}]
11 tm_get_tile_address_for_tile_serial(argin: string)
This command returns a corresponding TANGO tile address for a provided telescope tile serial. Input is a JSON parameter set of the form: [{`name`: `tile_serial`, `type`: `str`}]
13.5.3.3 Observation
Class Diagram
Figure 13-52: Observation device class diagram (inherits from GroupDevice)
Element Behaviour
The observation device is the primary manager of an observation. It is responsible primarily for initializing a configuration upon receiving a configuration script, as well as starting and stopping the observation when commanded to do so. It also provides an interface to extract data being gathered by the running observation. The most important aspect of the behaviour of this device is related to the configuration script required by this device to initialize the configuration. A sample of this JSON document is shown below:
{ "observation": { "mode": "mwa", "jobs": { "daq": { "task_noncycle": "integrated_channel", "task_cycle": "burst_raw,1", "receiver_ports": "4660", "receiver_interface": "lo" }, "bandpass_calibration": { } },
Document No.:Revision:Date:
Error: Reference source not foundError: Reference source not foundError: Reference source not found
Error: Reference source notfound
Author: A. Magro et al.Page 124 of 151
"stations": [ { "id": 1, "channel_integration_time": 0.5, "beam_integration_time": 0.5, "bitfile": "itpm_v1_1_tpm_test_wrap_net02.bit", "tiles": [ 1 ] } ] }}
This JSON document contains the observation mode, the list of jobs to run in the observation, together with a configuration of the job, as well as the telescope model to form stations with tile members. Each station has its own configuration (TPM bitfile to use for programming, DAQ parameters etc.).
States
Range Description and comments ALARM Device is in ALARM state. One or more attributes involved in an alarm rule has
crossed the alarm threshold.INIT Observation is being initialized.
RUNNING The observation is running.STANDBY Observation is waiting for any command to be called.
OFF Observation has been turned off.
Alarms
No alarms are yet set for this device.
Commands
# Observation Driver Commands
Description
1 init_observation(argin: string) Initializes the observation, including bootstrapping all necessary sub-devices (stations and jobs) required by the configuration. The input is a JSON document with the observation configuration. This call will:
1. Populate attributes in Observation Configuration device2. Create the necessary job devices and configuration3. Create and configure Station devices dynamically4. Start the Station device server
2 start_observation() Starts the observation, essentially by calling all stations to start their own particular observation run.
3 stop_observation() Stops the running observation, deletes all configured stations.4 get_observation_data(argin:
string)A query command to return data based on station_id, tile_id, and data type. Input is a JSON parameter set of the form: [{`name`: `station_id`, `type`: `int`},
Document No.:Revision:Date:
Error: Reference source not foundError: Reference source not foundError: Reference source not found
Error: Reference source notfound
Author: A. Magro et al.Page 125 of 151

{`name`: `tile_id`, `type`: `int`}, {`name`: `data_type`, `type`: `str`}]
13.5.3.4 Station
Class Diagram
Figure 13-53: Station device class diagram (inherits from GroupDevice).
States
Range Description and comments ALARM Device is in ALARM state. One or more attributes involved in an alarm rule has
crossed the alarm threshold.INIT Station is being initialized.
RUNNING The station is running as part of an observation.STANDBY Station is waiting for any command to be called.
OFF Station has been turned off.ON Station has been turned on.
Alarms
No alarms are yet set for this device.
Commands
# Station Driver Commands Description1 Initialise(argin: string) Initializes the station with its tiles and the tiles themselves.
Input is a station configuration JSON document with entries for the station itself and the jobs to be managed by the station.
2 connect_tiles(argin: string) Connects tiles in station. Input is a JSON parameter set of the form:
Document No.:Revision:Date:
Error: Reference source not foundError: Reference source not foundError: Reference source not found
Error: Reference source notfound
Author: A. Magro et al.Page 126 of 151

[{`name`: `initialise`, `type`:`bool`}, {`name`: `program`, `type`:`bool`}, {`name`: `bitfile`, `type`:`str`}]
3 send_raw_data(argin: string) Send raw data from all tiles. Input is a JSON parameter set of the form:[{`name`: `sync`, `type`:`bool`, `default`: `False`}]
4 send_raw_data_synchronised(argin: string)
Send synchronized raw data from all tiles. Input is a JSON parameter set of the form:[{`name`: `timeout`, `type`:`int`, `default`: 0}]
5 Send_channelised_data(argin: string)
Send channelized data from all tiles. Input is a JSON parameter set of the form:[{`name`: `number_of_samples`, `type`:`int`, `default`: 128}]
6 Send_beam_data(argin: string)
Send beam data from all tiles.
7 Send_csp_data(argin: string) Send CSP data from all tiles. Input is a JSON parameter set of the form:[{`name`: `samples_per_packet`, `type`:`int`}, {`name`: `number_of_samples`, `type`:`int`}]
8 send_channelised_data_continuous(argin: string)
Send continuous channelised data from all Tiles. Input is a JSON parameter set of the form:[{`name`: `channel_id`, `type`:`int`},{`name`: `number_of_samples`, `type`:`int`, `default`: 128},{`name`: `timeout`, `type`:`int`, `default`: 0}]
9 stop_data_transmission() Stops data transmission from all tiles.10 update_daq_task_progress() This command will let the station know that a certain DAQ job
has registered progress.11 start() Starts all jobs managed by the station.12 create_station() Create and setup station.13 get_data(argin: string) Returns DAQ data requested. Input is a JSON parameter type of
the form: [{`name`: `source`, `type`:`str`}, {`name`: `data_type`, `type`:`str`}, {`name`: `data_level`, `type`:`str`}, {`name`: `id`, `type`:`int`}]
14 stop_integrated_data() Command to stop transmission of integrated data.
Document No.:Revision:Date:
Error: Reference source not foundError: Reference source not foundError: Reference source not found
Error: Reference source notfound
Author: A. Magro et al.Page 127 of 151

13.5.3.5 DAQ (Data Acquisition) Job
Class Diagram
Figure 13-54: DAQJob device class diagram (inherits from Job device)
The DAQJob device is a device that essentially serves as a data acquisition wrapper for a station. It utilizes the AAVS LMC DAQ library and keeps track of job progress in a station. Jobs may have a particular cycle – for example different data types (raw, channelized, beamformed) can be cycled through, with one or more captures per type. The attributes of this device are mostly populated through what is given in the observation configuration. Default values are however defined in the TANGO properties of this class, mapping directly to the attributes. The attributes of type “operation_read_” are flags indicating which kind of DAQ operation will be performed if the start()
Document No.:Revision:Date:
Error: Reference source not foundError: Reference source not foundError: Reference source not found
Error: Reference source notfound
Author: A. Magro et al.Page 128 of 151

command is called. The station device is able to monitor progress of DAQ, proceeding to the next task on the job cycle, by instructing the DAQ device to start() again with a different flag for a different task type.
States
Range Description and comments ALARM Device is in ALARM state. One or more attributes involved in an alarm rule has
crossed the alarm threshold.INIT DAQ manager is initialized.
Alarms
No alarms are yet set for this device.
Commands
# DAQJob Driver Commands
Description
1 start() This commands start a DAQ task. The sequence of operations for this call is:
1. Attribute information is encapsulated in a DAQ configuration dictionary compatible with the AAVS DAQ interface class (daq.py).
2. This configuration is setup in the DAQ library interface instance.
3. A call for the DAQ library instance to start is sent.The DAQ library interface (a python file) sits in between the TANGO device DAQJob, and the actual low-level data acquisition module. This interface acts as a client to the low-level data acquisition module, and also as a client to the TANGO DAQJob device.
2 stop() This commands stops a DAQ task. The DAQ library interface terminates the low-level data acquisition module.
Document No.:Revision:Date:
Error: Reference source not foundError: Reference source not foundError: Reference source not found
Error: Reference source notfound
Author: A. Magro et al.Page 129 of 151

13.5.3.6 Bandpass Calibration and Pointing Jobs
Class Diagram
Calibration and pointing procedures are written in a specific interface form. These interfaces are accessed by respective job devices for the various blocks of a pipeline. The class itself, in similar form to a DAQ device, defines a number of properties, the values of which are required by the actual job. These must be populated prior to the job device being created. Upon device initialization, an instance of the pipeline (for calibration or pointing) is created. These pipelines are standalone libraries that are executed outside of the TANGO framework. The job devices only serve as an interface to start/stop the pipeline process, and to feed in the respective configuration required.
States
Range Description and comments ALARM Device is in ALARM state. One or more attributes involved in an alarm rule has
crossed the alarm threshold.INIT Pipeline manager is initialized.
Alarms
No alarms are yet set for these devices.
Commands
# DAQJob Driver Description
Document No.:Revision:Date:
Error: Reference source not foundError: Reference source not foundError: Reference source not found
Error: Reference source notfound
Author: A. Magro et al.Page 130 of 151

Commands1 start() Pipeline is started.2 stop() Pipeline is stopped.
13.6 Maintenance and Execution Support View
13.6.1 Context Diagram
Figure 13-55 shows the primary use cases for requirements for maintenance and execution support functionality in the AAVS MCCS software system. These use-cases can be split into rough categories:
4. Remote operationsa. Remote diagnosticsb. Remote powering up/down and restarting of hardware/software elementsc. Observation execution
5. Metadata for diagnosisa. A log of all software behaviour in the system
6. Maintenance Operationsa. Fault diagnosisb. Error detectionsc. Remote debuggingd. Default actions on error
Document No.:Revision:Date:
Error: Reference source not foundError: Reference source not foundError: Reference source not found
Error: Reference source notfound
Author: A. Magro et al.Page 131 of 151

Figure 13-55: Primary use-cases for maintenance and execution support arising from the AAVS LMC software system.
13.6.2 Primary Presentation
In the architectural overview of this software architecture document, the high level presentation in Figure 13-56 was given. This primary presentation defines all the logical components which make up the interfaces required for maintenance and execution support.
Document No.:Revision:Date:
Error: Reference source not foundError: Reference source not foundError: Reference source not found
Error: Reference source notfound
Author: A. Magro et al.Page 132 of 151

Figure 13-56: AAVS local monitoring and control overview
At a low level, every component wrapped as a TANGO device will be able to provide detailed logs of all operations as required. These logs can also be split into various log levels, and it is assumed that detailed logs for maintenance purposes will be setup with a “DEBUG” log level. This would mean that errors and faults are also logged, given the logging level hierarchy provided by the TANGO control system.
The metadata required for diagnosis can be collected from all monitoring points/attributes defined in all devices. Moreover, these values can be archived internally in order to provide a trace of all attribute behaviour over a required timescale.
With regards to maintenance and execution operations, all operations required on particular hardware/software devices should be available as attribute/commands on the TANGO driver for the element in question. If, for example, a particular device supports a power-restart, then this functionality should be wrapped into a TANGO command for the particular device to perform that power-restart. Once that wrapper is available, remote operations for the command is also available. This is handled by the TANGO framework.
13.6.3 Element Catalog
13.6.3.1 The LMC API (LMC Backend)
The LMC Backend API lies in between the REST HTTP Application, and the TANGO LMC system. The TM Emulator has to have REST requests routed via this backend API, which receives the requests and then acts as a client to the AAVS LMC Master device. This section will give an overview of the structure of this Backend API.
Document No.:Revision:Date:
Error: Reference source not foundError: Reference source not foundError: Reference source not found
Error: Reference source notfound
Author: A. Magro et al.Page 133 of 151

Request/Reply Communication
In the backend module, the __init__.py creates the Flask application, and creates the endpoints in do_post_fork(). The endpoints are defined in endpoints.py which contains the mapping between the url of the API, and the resource used to handle it.
In the folder Resources there are all the resources which contain the logic to handle the API call. A resource can have a schema used for its input - defined with the @use_kwargs decorator and a schema for its output, defined with the @marshal_with decorator. Both can be optional. In some cases where we do not use marshal_with decorator, there will be the resource function returning the output of a make_response() function. The resources call component managers which are in the library folder. These will implement the client calls to the TANGO LMC.
Metrics, Alarms and Events
In each TANGO device, there is a variable metric_set which is a list of attribute names which are metrics. This is used:
1. to generate the attribute type in (metric, register, property) when getting the properties for a device
2. there is a command on each device get_metrics - which is called by the websocket server. The websocket server will get the metrics and their values, ands emit them over the socketio connection.
Alarms, metrics and events are sent over websockets using a flask-socketio application running in a separate gunicorn process. The application uses the socketIO protocol over websockets. Each one of the events/alarms/metrics is sent on a separate socketIO namespace.
13.6.3.2 Graphical User Interface (GUI)
Users will interact with a web-based GUI via browser (TM Emulator). The front end will be responsible for accepting user requests, interpreting them, and routing them to the AAVS LMC Master device, via a service layer that translates GUI requests to TANGO requests. Replies from the TANGO susbsystem are then passed back to the user via a service layer that passes on output from the AAVS LMC system to the web interface.
The main idea compared to other more traditional server-side architectures is to buildthe server as a set of stateless reusable REST services, and from a Model-View-Controller (MVC)perspective to take the controller out of the back-end and move it into the browser. The TANGO consortium is currently developing a REST API for development of web applications to control a TANGO subsystem, and it is envisioned that the AAVS LMC GUI system could, in future, make use of this framework. Requests and replies can inherently be passed on as messages, for instance in JavaScript Object Notation (JSON), between client and server. Whilst a formally correct and exhaustive REST API cannot be defined until the architecture of the TANGO REST framework is fully known (see http://tango-rest-api.readthedocs.io/en/latest/), some general concepts of how this GUI framework will work is known. AAVS does not make use of the REST API currently being built for TANGO, but has implemented its own REST API, and it transpires that some of the work being carried out by the TANGO community is very similar architecturally.
Document No.:Revision:Date:
Error: Reference source not foundError: Reference source not foundError: Reference source not found
Error: Reference source notfound
Author: A. Magro et al.Page 134 of 151

13.6.3.2.1 Element Interface
The dynamicity of the TANGO framework must be reflected in the interfacing layer, which exposes all the available functionality to third party clients, in this case the AAVS LMC GUI. The TANGO REST API will be hosted in a webserver which exposes a number of URLs, each of which result in an action being performed on the TANGO framework. REST over HTTP is used to communicate with the web server. The list of URLs is assumed to be generated dynamically based on the devices/commands/attributes available in the AAVS LMC system. Some early access code from the REST API TANGO work demonstrates that the URLs are designed in such a way as to make it easy to drill down, or filter, components and capabilities by specifying IDs, types other filtering options. This emulates the nature of TANGO as representing a control system by a hierarchy of devices.
REST stands for Representational State Transfer. It relies on a stateless, client-server, cacheable communication protocol (primarily HTTP). It is an architecture style for designing network applications. The primary aim is that instead of using complex mechanisms such as CORBA, RPC or SOAP to connect between machines, simple HTTP is used to make calls instead. RESTful applications use HTTP requests to post data (create and/or update) read data (for example, to make queries) and delete data. Thus, REST uses HTTP for all four CRUD (Create/Read/Update/Write) operations. These operations are performed through the following HTTP requests:
GET – Query an entity for information or data POST – Issue a command which changes the state of an entity (for example, to create an
observation or write an attribute value) PATCH – Update the state of a created entity (for example, to stop an observation) DELETE – Delete an entity (for example, unsubscribe from receiving an event, which will
delete the appropriate entry)
The base path each URL is: /aavs_lmc/vN, where vN specifies the version of the API being used. Three main URL types are currently defined:
Title Url DescriptionObservations / aavs_lmc /vN/observations Used to start and monitor the status of an
observation. Components / aavs_lmc /vN/components Used to get a list of available components,
together with their capabilities and perform actions on these components
Events / aavs_lmc /vN/events Used to get an ordered list of eventsAlarms / aavs_lmc /vN/alarms Used to get a list of alarmsEvent Subscriptions
/ aavs_lmc /vN/event_subscriptions
Determines which types of event will be available under /aavs/vN/events
Types / aavs_lmc /vN/types Lists the types available for querying under various groups eg component_types, event_types
The following sections will describe the ways in which these URLs can be used. Details of the form of URL will be defined by the TANGO consortium, but the general concept should still apply. URL parts enclosed in curly brackets specify variable substitution entries. URL parts after a “?” perform filtering. For example:
Document No.:Revision:Date:
Error: Reference source not foundError: Reference source not foundError: Reference source not found
Error: Reference source notfound
Author: A. Magro et al.Page 135 of 151
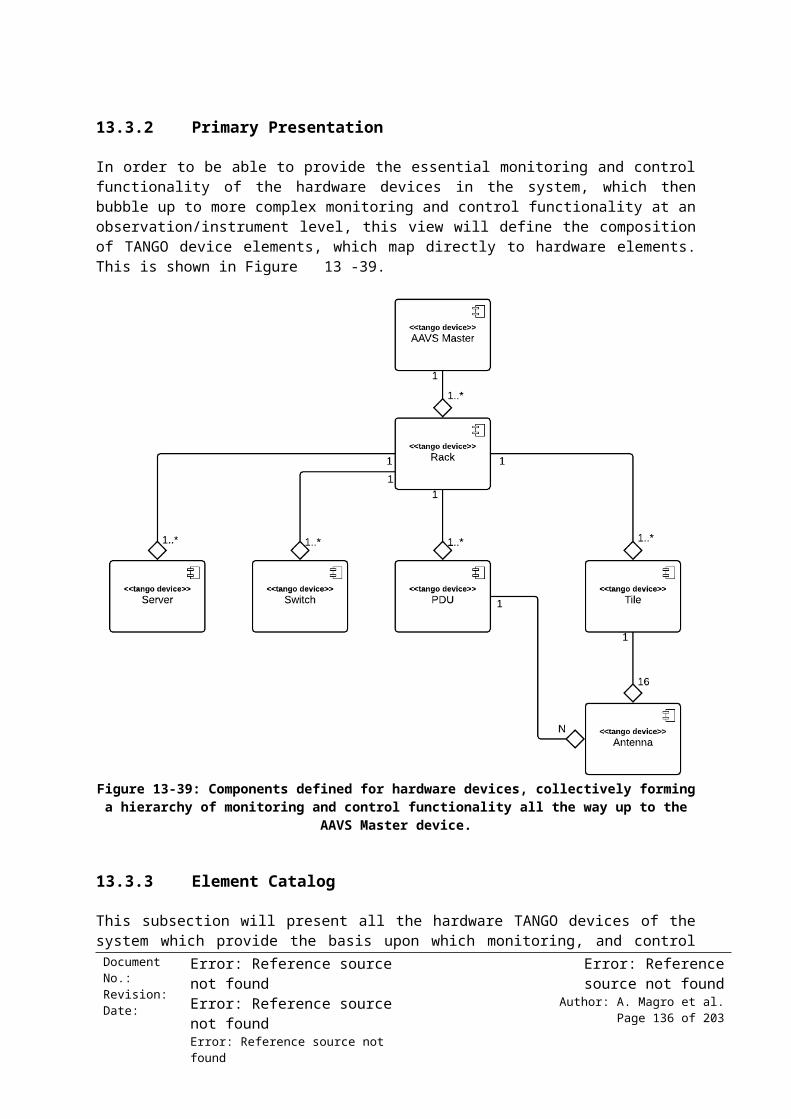
/components/station Points to all stations/components/station/1 Points to station 1/alarms?source_type=station Get alarms generated by all stations/alarms?source_type=station&source_id=1 Get alarms generated by station 1
13.6.3.2.2 Element Behaviour
It is important to highlight the two main message exchange patterns from the GUI client to the AAVS LMC control system. There will be two main patterns in a client/server architecture:
1. Request-Response: the most RESTful approach, a CRUD interface to access/create/modify/delete control operations (commands and attributes) in TANGO servers. This process is described in the activity diagram in Figure 13-57.
2. Publish-Subscribe: functionality offered by the TANGO ecosystem, but not directly by a REST API (unless using locking calls). The control system should be able to send asynchronous notifications to the client as soon as possible. This is done via a Websockets interface over HTTP. This process is described in the sequence diagram in Figure 13-58.
Activity - REST API Request-Reply Activity Diagram
Document No.:Revision:Date:
Error: Reference source not foundError: Reference source not foundError: Reference source not found
Error: Reference source notfound
Author: A. Magro et al.Page 136 of 151
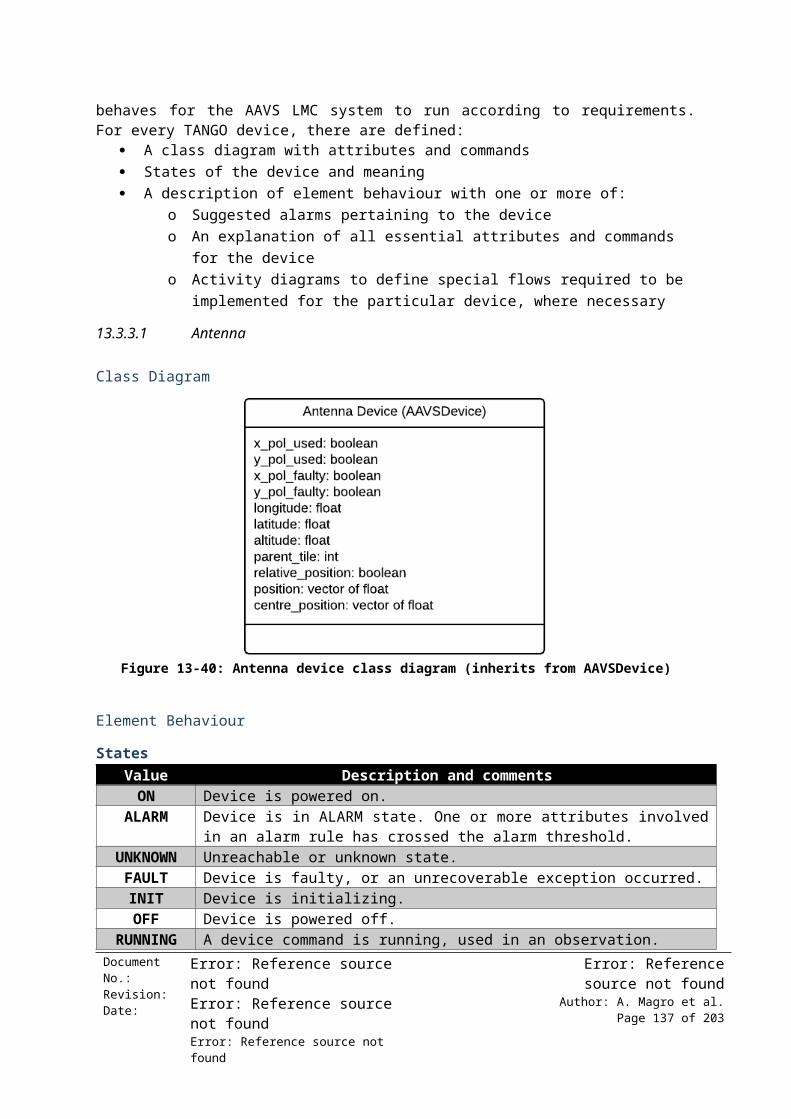
Figure 13-57: REST API to TANGO – Request-Reply Flow
Activity - Publish-Subscribe Sequence Diagram
Document No.:Revision:Date:
Error: Reference source not foundError: Reference source not foundError: Reference source not found
Error: Reference source notfound
Author: A. Magro et al.Page 137 of 151

Figure 13-58: Publish-subscribe from TANGO to HTTP GUI via Websockets
13.6.3.2.3 Element Properties
13.6.3.2.3.1 Observations
URL /observations
GET Lists the number of observations in progress or completed within PostTimeout
POST Creates a new observation by submitting an observation configuration. This will return an observation ID which can be used to monitor and update the observation. This will set up the observation but not start it, the URL has to be used to star the observation. The configuration will be posted as a multipart form in JSON containing for instance, which binary files required for firmware, what station configuration is needed, details pertaining to calibration, beamforming and other processes.
URL /observations/{observation_id}/run
GET Gets the status of the current run
Document No.:Revision:Date:
Error: Reference source not foundError: Reference source not foundError: Reference source not found
Error: Reference source notfound
Author: A. Magro et al.Page 138 of 151

PATCH Updates the current run, can be used to start and stop the observation
13.6.3.2.3.2 Components
URL /components/{component_type}
GET Gets a collection of components of type component_type. For each component display summary and links to respective attributes, commands and events. Components cannot be added through this URL (stations can be added through the observation config, or by using the device controller commands directly through its URL)
URL /components/{component_type}/{component_id}/
GET Gets a dynamically generated subset of attributes which summarises the component, and links to respective attributes, commands and events
Links to attributes, commands, events and alarms can be found as follows:/components/{component_type}/{component_id}/attributes/components/{component_type}/{component_id}/commands
Events, event_subscriptions, and alarms have unique references across all components, not within individual components such as attributes and commands above. Their URLs below will redirect to their respective top level url, and are made available for consistency and ease of use:/components/{component_type}/{component_id}/events-> /events?source_id={component_id}&source_type={component_type}
/components/{component_type}/{component_id}/event_subscriptions-> /event_subscriptions?source_id={component_id}&source_type={component_type}
/components/{component_type}/{component_id}/alarms -> /alarms?source_id={component_id}&source_type={component_type}
13.6.3.2.3.3 Stations
URL /components/stations
GET Lists all stations and the link to all tiles in the station /components/tiles?station_id=station_id
URL /components/stations/{station_id}
GET Gets the attributes and commands which are common to all tiles in the station
13.6.3.2.3.4 General Components by Component ID
URL /components/{component_type}/{component_id}/attributes?with_value=true
Document No.:Revision:Date:
Error: Reference source not foundError: Reference source not foundError: Reference source not found
Error: Reference source notfound
Author: A. Magro et al.Page 139 of 151

GET Gets all attributes for component_type with component_id. If with_value=true is supplied as querystring, the values of the attributes requested will be populated in realtime
URL /components/{component_type}/{component_id}/attributes/{attribute_name}?with_value=true
GET Request attribute value. If with_value=true is supplied as querystring, the value of the attribute requested will be populated in realtime
PATCH
Update attribute value
URL /components/{component_type}/{component_id}/events
GET Gets all events which were sent within the last PostTimeout for component_type with component_id
URL /components/{component_type}/{component_id}/alarms
GET Gets all alarms fired for component_type with component_id within PostTimeout
URL /components/{component_type}/{component_id}/commands
GET Gets all commands for component_type with component_id
URL /components/{component_type}/{component_id}/commands/{command_name}
GET Gets a description of the command and the required parameters
URL /components/{component_type}/{component_id}/commands/{command_name}/runs
GET Gets all runs of command_name executed for component_type with component_id, or for component type with no component_id specified
PATCH
POST runs the command with parameters in bodyReturns 201 Created with Location: /components/{component_type}/{component_id}/commands/{command_name}/runs/{run_id}
URL
/components/{component_type}/{component_id}/commands/{command_name}/runs/{run_id}
GET
Returns Run Parameters supplied to command
URL /components/{component_type}/firmwareGET For component types supporting firmware, such as tiles and stations, this lists the
currently installed firmwares. The first version will only use one firmware per tile, thus
Document No.:Revision:Date:
Error: Reference source not foundError: Reference source not foundError: Reference source not found
Error: Reference source notfound
Author: A. Magro et al.Page 140 of 151
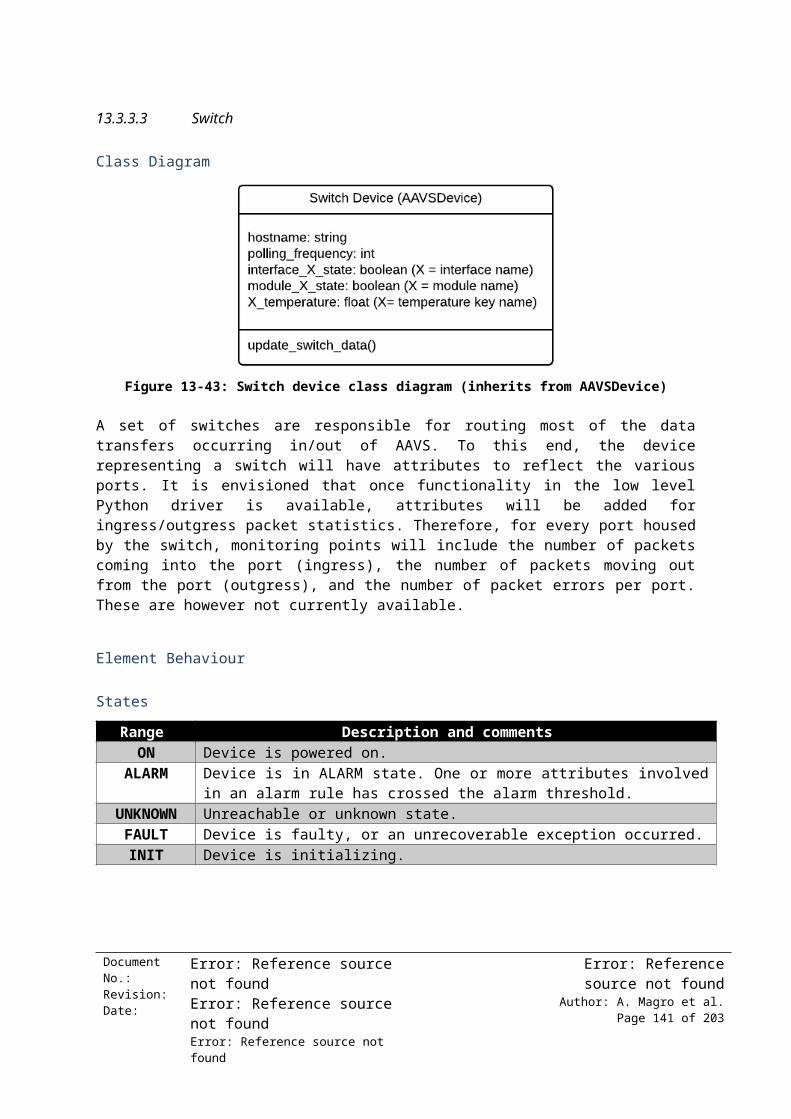
the firmware will be identified by the name default as shown below.
URL /components/{component_type}/{component_id}/firmware/defaultGET For component types supporting firmware, such as tiles and stations, this lists the first
installed firmware
URL /components/{component_type}/{component_id}/firmware/default/uploadsGET For component types supporting firmware, such as tiles and stations, this lists the first
installed firmware
POST Post firmware_binary file and a firmware_info json file. Since firmware upload on destination component may take time, a response of 201 Created will be received, with the location set to /components/{component_type}/firmware/default/uploads/<GUID>
URL /components/{component_type}/{component_id}/firmware/default/{upload_id}GET Shows the status of the firmware upload as a json document
13.6.3.2.3.5 Generic Components by Component Type
URL /components/{component_type}/attributes
GET Gets all attributes for component_type.
URL /components/{component_type}/attributes/{attribute_type}?with_value=true
GET Gets all attribute_types for every component in component_type. If with_value=true is supplied as querystring, the values of the attributes requested will be populated in realtime
URL /components/{component_type}/attributes/{attribute_name}?with_value=true
GET Request attribute valueIf with_value=true is supplied as querystring, the value of the attribute requested will be populated in realtime
PATCH Update attribute value
URL /components/{component_type}/events
GET Gets all events happening within the last PostTimeout for component_type
URL /components/{component_type}/alarms
GET Gets all alarms applicable to for component_type with component_id
POST Creates an alarm for component_type with component_id
Document No.:Revision:Date:
Error: Reference source not foundError: Reference source not foundError: Reference source not found
Error: Reference source notfound
Author: A. Magro et al.Page 141 of 151

DELETE
Deletes an alarm for component_type with component_id
URL /components/{component_type}/commands
GET Gets all commands for all components of component_type
URL /components/{component_type}/commands/{command_name}
GET Gets a description of the command and the required parameters
URL /components/{component_type}/commands/{command_name}/runs
GET Gets all runs of command_name executed for component_type
POST Runs the command with parameters in bodyReturns 201 Created with Location: /components/{component_type}/commands/{command_name}/runs/{run_id}
URL /components/{component_type}/commands/{command_name}/runs/{run_id}
GET Returns Run Parameters supplied to command
URL /components/{component_type}/firmwareGET For component types supporting firmware, such as tiles and stations, this lists the
currently installed firmwares. The first version will only use one firmware per tile, thus the firmware will be identified by the name default as shown below.
URL /components/{component_type}/firmware/defaultGET For component types supporting firmware, such as tiles and stations, this lists the first
installed firmware
URL /components/{component_type}/firmware/default/uploadsGET For component types supporting firmware, such as tiles and stations, this lists the first
installed firmware
POST Post firmware_binary file and a firmware_info json file. Since firmware upload on destination component may take time, a response of 201 Created will be received, with the location set to /components/{component_type}/firmware/default/uploads/{upload_id}
URL /components/{component_type}/firmware/default/{upload_id}GET Shows the status of the firmware upload as a json document
Document No.:Revision:Date:
Error: Reference source not foundError: Reference source not foundError: Reference source not found
Error: Reference source notfound
Author: A. Magro et al.Page 142 of 151

13.6.3.2.3.6 Events
URL /events?source_type=&source_id=
GET Gets events the cient is subscribed to for the current observation within the last PostTimeout. Events will be filtered by for source_type, source_id and event_type if supplied, where source can refer to a component or observation respectively.
URL /events/{event_type}?source_type=&source_id=
GET Gets specified event_type client is subscribed to for the current observation within the last PostTimeout. Events will be filtered by for source_type, source_id if supplied, where source can refer to a component or observation respectively.
13.6.3.2.3.7 Alarms
URL /alarms?source_type=&source_id=
GET Gets alarms for the current observation within the last PostTimeout. Alarms will be filtered by for source_type, and source_id if supplied, where source can refer to a component or observation respectively.
13.6.3.2.3.8 API Usage Examples
This section provides a number of examples describing how the REST API should be used to perform specific actions.
Event Subscription
1. Check out the types of events available for a componenta. GET /types/events/{component_type}
2. Subscribe to the event by including any of event_type, severity, component_type and component_id in POST request.
a. POST /event_subscriptions/ 3. The event subscription is created at /event_subscriptions/{event_subscription_id}. This
location will be provided in the response. This URL will then allow for PATCH or DELETE operations./event_subscriptions/{event_subscription_id}
4. Check out events generated for your subscriptiona. GET /events?event_type=
{event_type}&component_type={component_type}&component_id={component_id}
Alarm Creation
1. Check out types of alarms which can be created at a. GET /types/alarm
2. Choose the attribute you want to apply the alarm to, e.g. /{component_type}/attributes/temperature, to set the alarm temperature on all components of type component_type. A component_id can also be specified e.g.
Document No.:Revision:Date:
Error: Reference source not foundError: Reference source not foundError: Reference source not found
Error: Reference source notfound
Author: A. Magro et al.Page 143 of 151
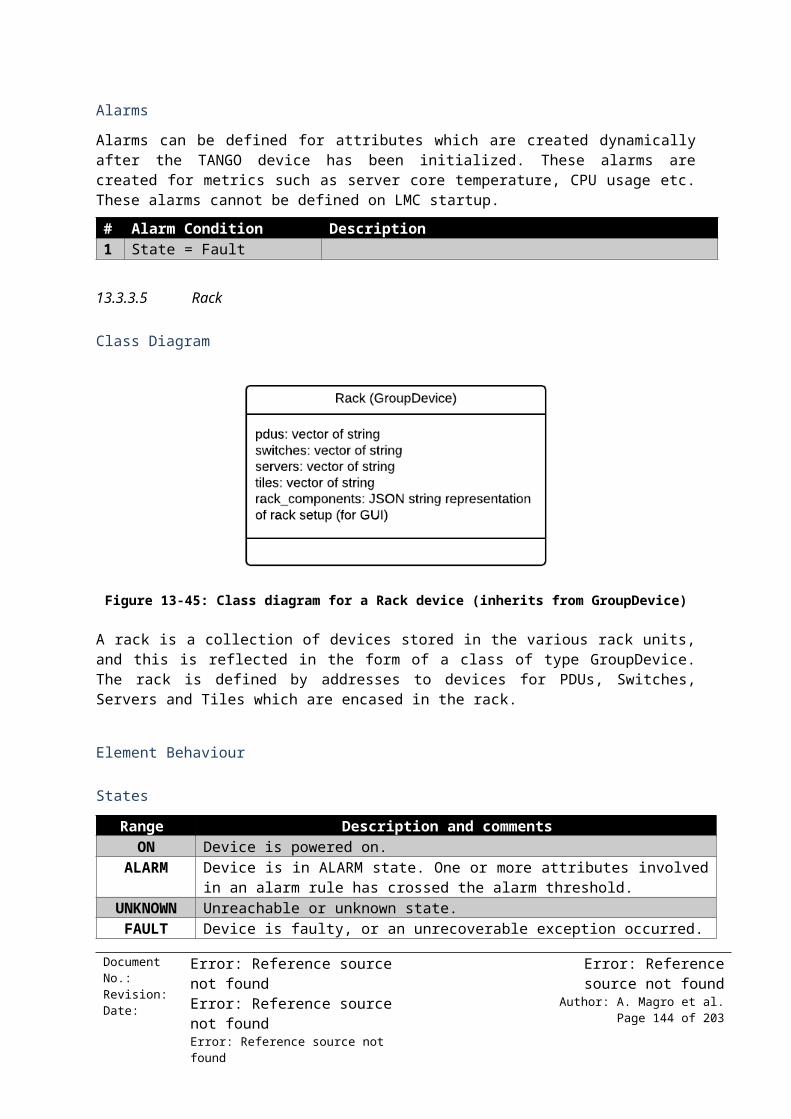
/{component_type}/{component_id}/attributes/temperature
3. Update the min_value, max_value or alarm_values on the attribute to set the alarm. You may also set a polling frequency
a. PATCH /{component_type}/{component_id}/attributes/temperature4. Check out whether the alarm has been triggered
a. GET /alarms?attribute_name =temperature&source_type={component_type}&source_id={component_id}
Check State
1. Check the current state of all tiles: GET /components/tile/attributes/state2. Check the current state of tile 10: GET /components/tile/10/attributes/state3. Check the state of the station_beam 1: GET
/components/station_beam/1/attributes/state
13.6.3.3 Command Line Interface (CLI)
The maintenance and execution support CLI interfaces will run on user computers that have access to TANGO-based control system. CLI interfaces should in general provide for the following functionality:
1. Basic control & monitoring2. AAVS-specific tools for setup and configuration3. Debugging, testing and diagnostics4. Health monitoring5. Alarm management6. Direct access to monitoring data by external operators (engineers) in case of TM failure7. Interfaces for non-TANGO components possibly via a tunneling mechanism
13.6.3.3.1 TANGO Framework
As far as the TANGO subsystem is concerned, AAVS LMC will be making use of a ready-developed CLI to all TANGO functionality via the iTANGO tool (see http://pythonhosted.org/itango/). In essence iTANGO is a layer on top of the standard iPython environment, providing TANGO-specific functionality. This tool can cater for:
1. Basic monitoring and control2. Health monitoring3. Direct access to monitoring data by external operators (engineers) in case of TM failure4. Partial alarm management
13.6.3.3.2 Engineering Scripts
A number of scripts, to help automate a number of processes are devised for:1. System setup and configuration2. Alarm management3. Debugging and diagnostics4. Interfaces for non-TANGO components possibly via a tunnelling mechanism e.g. TPM access
layer operation5. CLI-based tests for REST API functionality
Document No.:Revision:Date:
Error: Reference source not foundError: Reference source not foundError: Reference source not found
Error: Reference source notfound
Author: A. Magro et al.Page 144 of 151

13.6.3.3.2.1 System Setup and Configuration
The initial setting up of TANGO devices for the system, their configuration in a database, with the appropriate default attribute values etc. can be setup by an automated engineering script which can:
1. Tear down current LMC configuration, clearing TANGO database2. Create a new LMC configuration from scratch3. Update a current LMC configuration
The prototype developed for AAVS does the above by parsing a JSON configuration file, which contains entries for all the device servers that need to be loaded, the devices that need to be created, and bootstraps the execution of the device servers. Devices are populated with predefined property values. This tool allows for very easy modification and automation of the TANGO components within the LMC system.
13.6.3.3.2.2 Alarm Management
AAVS will make use of the auxiliary functionality currently being added to the Alarm systems proposed as extensions to the Elettra alarm handler. In essence, the system will allow for the definition of complex alarm formulae to be devised in a text/JSON file, which is then parsed by the LMC alarm system. For each alarm condition/rule, attributes are polled and change event subscriptions initiated.
13.6.3.3.2.3 Debugging and Diagnostics
The diagnostics stream queue can be consumed by simple TANGO clients, to extract alarm, event, and metric information.
13.6.3.3.2.4 Interfaces for non-TANGO Components Possibly via a Tunnelling Mechanism
Most identified hardware and software components have accessible APIs which are wrapped in TANGO. However, direct access to TPM control and the access layer developed for it is available. The TANGO driver for a Tile wraps around this access layer. No other special mechanisms have been implemented.
13.6.3.3.2.5 CLI-based Tests for REST API Functionality
Calls to the REST API can be bypassed and run via scripts e.g. CURL. This allows for testing and verification of a suite of calls and parameters in an automated fashion, without requiring active users from the GUI. These tests have not yet been implemented.
13.7 LMC Deployment and Management View
13.7.1 Context Diagram
This view will describe the details related to the deployment and management of the AAVS LMC system. In particular, this view will look at two particular tools created for AAVS, one to deploy and manage the control system and another to deploy and manage the pre-defined alarm rules of the LMC system. These uses are shown in Figure 13-59.
Document No.:Revision:Date:
Error: Reference source not foundError: Reference source not foundError: Reference source not found
Error: Reference source notfound
Author: A. Magro et al.Page 145 of 151

Figure 13-59:Context diagram for LMC deployment and management.
13.7.2 Primary Presentation
Figure 13-60 shows the primary presentation for this view. Essentially deployment is handled by two separate modules, one for TANGO device configuration and running (AAVSCTL) and another for alarm configuration (ALARMCTL).
Document No.:Revision:Date:
Error: Reference source not foundError: Reference source not foundError: Reference source not found
Error: Reference source notfound
Author: A. Magro et al.Page 146 of 151

Figure 13-60: Primary presentation for LMC deployment and management.
These two modules are implemented as Python applications that take accept a number of limited commands, and a configuration script that goes with these commands. The configuration scripts are JSON documents. For AAVSCTL, the JSON configuration script contains a list of all devices which must be configured and set up in the TANGO database, with the required property values and defaults. This script also contains the association of device servers to particular devices, and the order in which device servers need to start. This configuration can be cleaned up and reconfigured from the CLI.
For ALARMCTL, a list of alarm triggers is written in a specified format, which is then passed over to the ALARMCTL tool in the CLI, which acts as a client to a started TANGO LMC system, and adds the required alarms to the system via calls to the AAVS Master device.
13.7.3 Element Catalogue
13.7.3.1 AAVSCTL (AAVS Control)
AAVSCTL is a tool that can run from the CLI with the following modes:1. aavsctl –config (configures the devices and device server association in the TANGO system)2. aavsctl – run (same as –config, but then starts the system in the order defined in the JSON
configuration)3. aavsctl –stop (stops a running configuration and clears the TANGO database)4. aavsctl –status (reports on whether there is a configuration or not, and whether it is
running)
A sample JSON configuration, written in the “servers_config.py” files is as follows:rack_config = { "test/tile/1": {"width": 1, "height": 4, "row": 2, "column": 1}, "test/pdu/1": {"width": 4, "height": 1, "row": 8, "column": 1}, "test/switch/1": {"width": 4, "height": 1, "row": 16, "column": 1}, "test/server/1": {"width": 4, "height": 2, "row": 17, "column": 1},}
config = { "use_simple_logger": True, "domain": "test", "default_logging_target": ["device::test/logger/1"], "default_logging_level": "DEBUG", "alarms_config_file": "aavslmc.config.alarms_config", "server_priorities": { "Logger_DS": 1,
Document No.:Revision:Date:
Error: Reference source not foundError: Reference source not foundError: Reference source not found
Error: Reference source notfound
Author: A. Magro et al.Page 147 of 151

"Alarm": 2, "AlarmStream": 3, "EventStream": 3, "DiagnosticsStream": 4, "LMC_DS": 5, "Server_DS": 6, "Switch_DS": 6, "Tile_DS": 6, "Rack_DS": 7 }, "devices": { "logger": { "1": { "properties": { "log_path": "/opt/aavs/log/tango" }, "class": "Logger_DS", "server": "Logger_DS" } }, "Alarm": { "1": { "properties": { "DbHost": "localhost", "DbName": "alarm", "DbPasswd": "alarm_pswd", "DbPort": "3306", "DbUser": "alarm_usr", "InstanceName": "1", "elettra_alarm_device_address": "{domain}/Alarm/1", "central_alarmstream_device_address": "{domain}/AlarmStream/1", "central_eventstream_device_address": "{domain}/EventStream/1", "central_diagstream_device_address": "{domain}/DiagnosticsStream/1" }, "class": "Alarm", "server": "Alarm", "python_server": False } }, "AlarmStream": { "1": { "properties": { "elettra_alarm_device_address": "{domain}/Alarm/1", "central_alarmstream_device_address": "{domain}/AlarmStream/1", "central_eventstream_device_address": "{domain}/EventStream/1", "central_diagstream_device_address": "{domain}/DiagnosticsStream/1", "diag_mode": "True" }, "class": "AlarmStream", "server": "AlarmStream" } }, "EventStream": { "1": { "properties": { "elettra_alarm_device_address": "{domain}/Alarm/1", "central_alarmstream_device_address": "{domain}/AlarmStream/1", "central_eventstream_device_address": "{domain}/EventStream/1", "central_diagstream_device_address": "{domain}/DiagnosticsStream/1", "diag_mode": "True" }, "class": "EventStream", "server": "EventStream" } }, "DiagnosticsStream": { "1": { "properties": { "elettra_alarm_device_address": "{domain}/Alarm/1", "central_alarmstream_device_address": "{domain}/AlarmStream/1", "central_eventstream_device_address": "{domain}/EventStream/1", "central_diagstream_device_address": "{domain}/DiagnosticsStream/1", "diag_mode": "True" }, "class": "DiagnosticsStream", "server": "DiagnosticsStream" } }, "lmc": { "1": { "properties": { # "member_list": ["tiles", "racks"], # "tiles": ["{domain}/tile/1"], # "racks": ["{domain}/rack/1"], #"data_path": "/home/andrea/data",
Document No.:Revision:Date:
Error: Reference source not foundError: Reference source not foundError: Reference source not found
Error: Reference source notfound
Author: A. Magro et al.Page 148 of 151

"data_path": "/opt/aavs/data", "elettra_alarm_device_address": "{domain}/Alarm/1", "central_alarmstream_device_address": "{domain}/AlarmStream/1", "central_eventstream_device_address": "{domain}/EventStream/1", "central_diagstream_device_address": "{domain}/DiagnosticsStream/1", # "logging_target": ["device::test/logger/1"], # "logging_level": "DEBUG", "diag_mode": "True", "rack_id": "1" }, "class": "LMC_DS", "server": "LMC_DS" } }, "rack": { "1": { "properties": { "tiles": ["{domain}/tile/1"], #"tiles": ["{domain}/tile/1", "{domain}/tile/2", "{domain}/tile/3"], # "tiles": ["{domain}/tile/1", "{domain}/tile/2", "{domain}/tile/3", "{domain}/tile/4", # "{domain}/tile/5", "{domain}/tile/6", "{domain}/tile/7", "{domain}/tile/8"], "servers": ["{domain}/server/1"], "pdus": ["{domain}/pdu/1"], "switches": ["{domain}/switch/1"], "member_list": ["tiles", "servers", "switches", "pdus", ], "elettra_alarm_device_address": "{domain}/Alarm/1", "central_alarmstream_device_address": "{domain}/AlarmStream/1", "central_eventstream_device_address": "{domain}/EventStream/1", "central_diagstream_device_address": "{domain}/DiagnosticsStream/1", "diag_mode": "True", "rack_id": "1" }, "class": "Rack_DS", "server": "Rack_DS", "components": rack_config } }, "tile": { "1": { "properties": { "member_list": ["antennas"], "enable_test": "False", "enable_ada": "False", "ip": "10.62.14.102", #"ip": "10.0.10.2", "port": "10000", "lmc_ip": "10.0.10.1", "lmc_port": "4660", "elettra_alarm_device_address": "{domain}/Alarm/1", "central_alarmstream_device_address": "{domain}/AlarmStream/1", "central_eventstream_device_address": "{domain}/EventStream/1", "central_diagstream_device_address": "{domain}/DiagnosticsStream/1", "pdu_id": "{domain}/pdu/1", "pdu_interface": "0", "ingest_ip": "10.10.10.10", "ingest_mac": "0x620000000002", "ingest_port": "4000", "data_switch_id": "{domain}/switch/1", "data_switch_port": "1/4/1", "diag_mode": "True", "rack_id": "1" }, "class": "Tile_DS", "server": "Tile_DS" } }, "server": { "1": { "properties": { "ganglia_ip": "127.0.0.1", "host": "127.0.0.1", "monitored_metrics": "cpu_user,cpu_system", "polling_frequency": "60000", "elettra_alarm_device_address": "{domain}/Alarm/1", "central_alarmstream_device_address": "{domain}/AlarmStream/1", "central_eventstream_device_address": "{domain}/EventStream/1", "central_diagstream_device_address": "{domain}/DiagnosticsStream/1", "diag_mode": "True", "rack_id": "1" }, "class": "Server_DS", "server": "Server_DS"
Document No.:Revision:Date:
Error: Reference source not foundError: Reference source not foundError: Reference source not found
Error: Reference source notfound
Author: A. Magro et al.Page 149 of 151
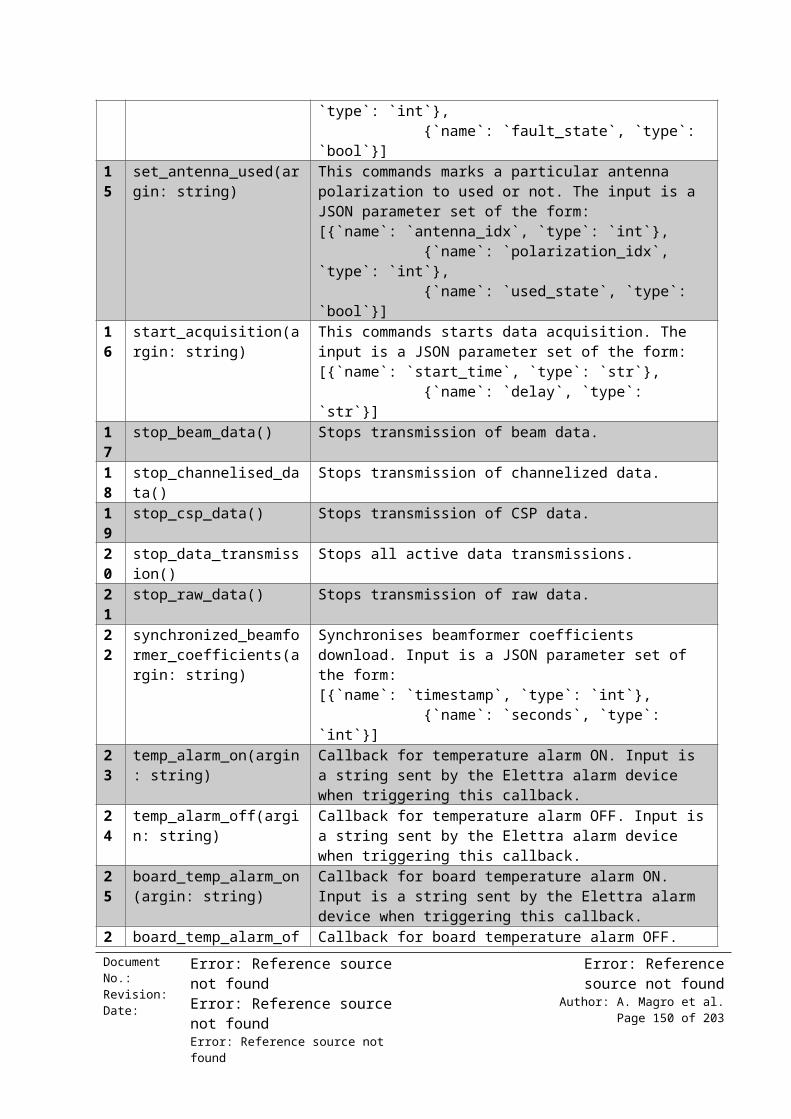
}, }, "switch": { "1": { "properties": { "hostname": "10.0.10.100", "polling_frequency": "600000", "elettra_alarm_device_address": "{domain}/Alarm/1", "central_alarmstream_device_address": "{domain}/AlarmStream/1", "central_eventstream_device_address": "{domain}/EventStream/1", "central_diagstream_device_address": "{domain}/DiagnosticsStream/1", "diag_mode": "True", "rack_id": "1" }, "class": "Switch_DS", "server": "Switch_DS" }, }, "pdu": { "1": { "properties": { "ip": "10.0.10.201", "elettra_alarm_device_address": "{domain}/Alarm/1", "central_alarmstream_device_address": "{domain}/AlarmStream/1", "central_eventstream_device_address": "{domain}/EventStream/1", "central_diagstream_device_address": "{domain}/DiagnosticsStream/1", "diag_mode": "True", "rack_id": "1" }, "class": "PDU_DS", "server": "PDU_DS" }, }, }}
Essentially, this configuration file contains a configuration, in sequence of:1. Devices in a rack layout (useful information for representing rack in the web GUI), stored as
part of the LMC system attributes.2. A default logging target address to be referred to by all devices3. An alarm configuration file name (used by ALARMCTL)4. TANGO device server bootstrapping in order of how they should be initialized5. A dictionary of devices, with device type and IDs in nested form. Each device ID will have
property key and value pairs, which are passed on to the TANGO database device configuration.
The AAVSCTL tool contains the internal methods described in Table 13-26.
Table 13-26: Helper methods in the AAVSCTL tool.Method Descriptionconfig_alarms() A wrapper method to invoke ALARMCTL from within AAVSCTLsetup_tango_config() Use the JSON configuration file to setup the TANGO LMC database with
the appropriate devices and properties._get_servers() Gets the list of TANGO device servers for the current configuration.status() Check server configuration and report the status back.kill_tango_servers() Kill all running TANGO servers.
13.7.3.2 ALARMCTL (Alarm Control)
ALARMCTL is a tool that can run from the CLI with the following modes:1. alarmctl –clear (clears the current alarms from the system)
Document No.:Revision:Date:
Error: Reference source not foundError: Reference source not foundError: Reference source not found
Error: Reference source notfound
Author: A. Magro et al.Page 150 of 151

2. alarmctl –config (sets up the alarms on a running LMC system with alarms defined in the JSON configuration)
A sample JSON configuration, written in the “alarms_config.py” files is as follows:
alarms_config = { "domain" : "test", "devices": { "tile": [ { "attribute": "temperature_board", "poll_period": 5000, "change_event_resolution": 0.1, "alarm_on_callback": "temp_alarm_on", "alarm_off_callback": "temp_alarm_off", "checks": { "maximum": 45 } }, { "ids": [1], "attribute": "State", "poll_period": 5000, "change_event_resolution": 0.5, "alarm_on_callback": "alarm_on", "alarm_off_callback": "alarm_off", "checks": { "absolute": "FAULT" } }, ] }}
Essentially, this configuration file is a dictionary of alarms nested by device type. For every device type the alarm configuration contains the following fields:
1. ids – list of device IDs to which to apply the alarm rule. This is optional (applied to entire group if not supplied)
2. attribute – the name of the attribute on which the alarm applies. The alarm name created will then be of the form “[device_type]_[id]_[attribute]_alarm”
3. poll_period – the number of milliseconds for attribute polling4. change_event_resolution – the absolute change of value that will trigger an event for an
alarm check to be made by the Elettra alarm device5. alarm_on_callback - the name of the callback function to call when an alarm is triggered ON6. alarm_off_callback - the name of the callback function to call when an alarm is triggered OFF7. checks - a list of checks on the value for the attribute. Three checks are available: maximum,
minimum, absolute and combinations of these together
13.8 Conclusion
This appendix gave an overview of the various software modules as designed and implemented for AAVS-1. It started off with a view describing the LMC infrastructure, which both services and provides structured constraints for the AAVS development patterns. It then describes, in sequence, the monitoring and control of specific hardware devices, and moves on to describing the definition and implementation of software TANGO devices for observation management. A number of client modules that interact with the AAVS system such as the TM emulator API, the LMC Backend, the CLI/GUI tools are then described as the final end-clients of the AAVS LMC system.
Document No.:Revision:Date:
Error: Reference source not foundError: Reference source not foundError: Reference source not found
Error: Reference source notfound
Author: A. Magro et al.Page 151 of 151