skills at work, 1986 to 2006 - cardiff university
TRANSCRIPT

Skills at Work, 1986 to 2006
Alan Felstead Duncan Gallie Francis Green
Ying Zhou
© Alan Felstead, Duncan Gallie, Francis Green and Ying Zhou, 2007.
First published in 2007 by the ESRC Centre on Skills, Knowledge and Organisational Performance based at the Universities of Oxford and Cardiff.
ISBN-978-0-9555799-0-5

ABOUT THE AUTHORS
Alan Felstead is Research Professor at the Cardiff School of Social Sciences, Cardiff University. His research focuses on non-standard forms of employment, the spaces and places of work, training, skills and learning. He has given expert advice on these matters to policy-makers, including DfES, EOC, RDAs, CEDEFOP and several private sector organisations. Duncan Gallie is an Official Fellow of Nuffield College, Oxford, and Professor of Sociology, University of Oxford. His research has focused on developments in work quality and work organisation in Britain and in Europe, as well as on the implications of welfare regimes for the social consequences of unemployment. He is a Fellow and Vice-President of the British Academy. He was a member of the Advisory Committee for the Social Sciences and Humanities for the EU’s 6th Framework Programme. Francis Green is Professor of Economics at the University of Kent. His publications focus on labour economics, especially on skills, training, job quality and employment relations; and he provides periodic advice on these issues to the UK Government, to the European Commission and to the OECD. Ying Zhou is a Research Officer at Nuffield College, Oxford. She received her doctoral degree from Oxford in 2006. Her research focuses on employees’ organisational participation, skills and the quality of working life.
ii

EXECUTIVE SUMMARY
viii
LIST OF FIGURES
xiii
LIST OF TABLES
xiv
ACKNOWLEDGEMENTS
xvii
CHAPTER 1: INTRODUCTION 1.1 Issues to be Addressed 1.2 The 2006 Skills Survey in the Context of the Skills Survey Series 1.3 Objectives of the 2006 Skills Survey 1.4 Objectives of the Report
1 1 2 3 4
CHAPTER 2: METHODOLOGY 2.1 Approaches to Skills Measurement 2.2 A Brief Comparison of the British Skills Surveys and ONET Measures of Job Skill 2.2.1 Conceptual Approach
2.2.2 Skills Assessed
2.2.3 Unit of Analysis 2.2.4 The Range and the Level of Generic Skills 2.2.5 Response Scales for the Importance of Skills
2.3 Innovations in the 2006 Skills Survey 2.4 Questionnaire Content 2.5 Survey Methods and Outcomes
5 5 10 10 10 11 12 12 13 14 14
CHAPTER 3: THE DISTRIBUTION OF WORK SKILLS IN BRITAIN 3.1 Introduction 3.2 Broad Skills
3.2.1 Measurement of Broad Skills 3.2.2 Findings on the Distribution of Broad Skills
16 16 16 17 19
iii

3.3 Generic Skills
3.3.1 Measurement of Generic Skills
3.3.1.1 Factor Analysis 3.3.1.2 Skills Indices
3.3.2 Findings on the Distribution of Generic Skills
3.4 Generic Management Skills 3.5 The Links Between Broad and Generic Skills 3.6 Foreign Language Skills 3.7 Summary of Main Findings Tables for Chapter 3
26 26 27 28 29 32 33 34 35 37
CHAPTER 4: SKILL TRENDS 4.1 Introduction 4.2 Broad Skills Trends, 1986-2006 4.3 Trends in Qualifications Held and Required, 1986-2006
4.3.1 Qualifications Required and Supplied: Aggregate Imbalances 4.3.2 Workers Who are ‘‘Over-Qualified’’ or ‘‘Under-Qualified’’ 4.3.3 Credentialism 4.3.4 Qualifications ‘Used’
4.4 Changes in Generic Skills, 1997-2006 4.5 Changes in Particular Skills, 1997-2006 4.6 Changes in Factors Needed to Get Jobs and Sources of Learning, 1992-2006 4.7 Summary of Main Findings Tables for Chapter 4
53 53 53 58 59 61 64 65 66 69 69 70 72
CHAPTER 5: COMPUTING SKILLS 5.1 Introduction
95 95
iv

5.2 The Growth of Use of Advanced Technology 5.3 The Increasing Centrality of Computing to Job Tasks 5.4 The Complexity of Computer Use at Work 5.5 Summary of Main Findings Tables for Chapter 5
95 97 98 102 104
CHAPTER 6: EMPLOYEE TASK DISCRETION 6.1 Introduction 6.2 Change in Task Direction 6.3 Sex, Contract Status and Control 6.4 Occupation and Industry 6.5 External Control Over Work Performance 6.6 Summary of Main Findings Tables for Chapter 6
120 120 120 122 122 123 124 126
CHAPTER 7: THE VALUE OF SKILLS 7.1 Introduction 7.2 Measurement and Method 7.3 Findings on the Value of Skills
7.3.1 The Value of Skills in 2006 7.3.2 Changes in the Value of Generic Skills, 1997 to 2006
7.4 Changes in the Value of Broad Skills, 1997 to 2006
7.5 Summary of Main Findings Tables for Chapter 7
133 133 133 134 134 137 138 139 141
CHAPTER 8: EMPLOYEE ATTITUDES TO SKILL USE AND TRAINING 8.1 Introduction 8.2 Job Orientations
145 145 145
v

8.3 Choice and Opportunity in Training Participation 8.4 The Costs and Benefits of Training 8.5 Future Perspectives 8.6 Summary of Main Findings Tables for Chapter 8
149 151 152 154 156
CHAPTER 9: CONCLUSION 9.1 Introduction 9.2 Themes and Further Research
9.2.1 Upskilling and the Sources of Learning 9.2.2 Aspects of Improvement 9.2.3 Further Planned Research
166 166 166 166 167 168
REFERENCES
171
TECHNICAL ANNEXE A1 Sample Design A2 Data Collection and Fieldwork Management
A2.1 Interviewer Briefings A2.2 Dates of Fieldwork A2.3 Re-issued Addresses A2.4 Household Letter and Leaflet A2.5 Selected Respondent Letter
A2.6 Refusal Conversion Letter A2.7 Introducing the Survey and Incentives A2.8 Self-completion Questionnaires A2.9 Length of Interview A2.10 Supervision and Quality Control
175 175 176 176 177 178 179 179 180 180 180 180 182
vi

A3 Survey Outcomes
A3.1 Response Rate A3.2 Comparisons with Other Surveys A3.3 Survey Representativeness
182 182 186 187
vii

EXECUTIVE SUMMARY
Raising work skills in Britain continues to attract the interest of policy makers and researchers alike. This Report presents the latest evidence on work skills in Britain drawn from data collected for the 2006 Skills Survey. The source of the data presented is a high quality representative survey of working individuals living in Britain aged 20-65. Its aim was to gather information on the skills used at work via survey questions directed at workers themselves.
This Report explains how several different aspects of work skill can be measured using the information gathered and examines the distribution of job skills among those in work. The Report also describes changes that have taken place over the last two decades, by making comparisons across five separate, but comparable, surveys carried out in 1986, 1992, 1997, 2001 and 2006.
The Report focuses on the distribution and trends in the following:
• broad skill measures including the qualification level required on entry into jobs, the training time for the type of work individuals carry out and the learning time needed to do jobs well (Chapters 3 and 4);
• the use of computer skills and their level of sophistication (Chapter 5);
• the use of other generic skills, such as problem-solving and communication skills (Chapters 3 and 4);
• employee task discretion, that is the level of control employees have over the detailed execution of work tasks and hence the extent to which employees’ judgement and skill is required (Chapter 6);
• the values attached by the labour market to the broad and generic skills (Chapter 7);
• employee attitudes to work, skill use and development, and the consequences this may have for employee demand for training and development opportunities (Chapter 8).
The main findings are as follows:
The Skills Trend
• Over the last two decades, job skills have risen significantly according to almost all items and indices derived from the data series.
• One measure of skill that the survey measures is the qualification level that would now be required to get the jobs that respondents held, as perceived by the jobholder. Using this measure the proportion of jobs requiring level 4 qualifications and above has risen from 20% in 1986 to 30% in 2006. The proportion of jobs not requiring qualifications fell by eleven percentage points over the same period. However, qualifications are just one measure of skill, and are often only an approximation to the level of skill used at work.
• Our other complementary measures of broad skill requirements also show skills rising substantially over the same period. On average, jobs in 2006 are associated with
viii

longer periods of training – training periods lasting two years or more now account for 30% of jobs in Britain compared to 22% of jobs in 1986. Rising levels of complexity are also indicated by the falling proportion of jobs requiring under one month ‘to learn to do well’ with such jobs accounting for 27% of the total in 1986 compared to 19% twenty years later.
• Between 1997 and 2006 there have also been significant increases in skill usage in all the generic skill domains except physical skills, with the use of ‘‘influence skills’’ and literacy skills rising most. ‘‘Influence skills’’ are a closely correlated set of activities associated with communicating, analysing and persuading.
• Nevertheless, the upward movement in skills has not been so pronounced over the last five years. Both the Required Qualification and Learning Time Indices (summary measures of the highest qualification level required on entry to job and the time it takes someone to learn to do a job well) have stagnated over the last five years. Only the Training Time Index (a summary measure of the training time for jobs) has risen significantly between 2001 and 2006.
• Similarly, the rises in generic skills have become more muted and less pronounced than previously. In three out of ten domains – number skills, technical know-how and problem-solving skills – there was no significant upward movement in skills used at work between 2001 and 2006.
• The proportions strongly agreeing to the statement ‘my job requires that I keep learning new things’ has consistently moved upwards during the 1992-2006 period – rising from 26% in 1992 to 30% in 2001 and then to 35% in 2006. Respondents to the 2001 and 2006 Skills Surveys were also asked to indicate the extent of their agreement or disagreement with the statement ‘my job requires that I help my colleagues to learn new things’. The proportions strongly agreeing to this statement rose from 27% in 2001 to 32% five years later. This evidence suggests that the workplace itself is becoming an ever more important driver for learning.
• There has been a striking and continued increase since 1986 in the number of jobs which use automated or computerised equipment – over three-quarters of people now use such equipment at work. The increase has slowed down over the last five years, indicating that the diffusion of computerised and automated equipment is approaching saturation. However, there has also been a marked and sustained increase in the proportion of people who report that computing is an ‘essential’ part of their job. This rose from 31% in 1997 to 40% in 2001, and then to 47% in 2006.
• The importance of internet use has increased sharply over the last five years. The proportion of workers regarding the use of internet as an ‘essential’ component of their jobs doubled between 2001 and 2006. All forms of internet use (with the exception of designing/updating web pages) have become more prevalent. Email is now being used by over 70% of people in work.
Qualifications Supplied and the Qualification Requirements of Entry to Jobs
• In the past, there seems to have been a closer match than now between the supplies of workers with a particular level of qualification and the numbers of jobs requiring qualifications upon entry at each level. There has been rapid growth in the supply of workers holding qualifications at all levels, but slower growth in the numbers of jobs requiring the qualifications they hold. There has also been an increase in the numbers
ix

of people holding qualifications at a higher level than those required for getting their job. In 2006 two-fifths of workers held qualifications at a higher level than was required for entry to the jobs they were doing, up from the figure of 35% recorded in the 2001 survey. The increase was greatest for those holding level 4 or above qualifications, for example, graduates.
• However, differences between the qualification level a person has attained and the level needed to get the job do not necessarily imply that the skills of a person are too high or low for the job. The qualifications required to get a job are only one measure of the skills needed for a job. Moreover, some qualifications tend to be helpful in getting a job even if they are not formally required. Among those in jobs not requiring qualifications, 24% had received either a total of more than a year’s cumulative training, or were in jobs requiring more than a year’s learning time to do well.
The Value of Skills
• Jobs which require the use of ‘influence skills’ pay a premium over and above the rewards to education and training. Comparing otherwise similar jobs for which influence skills are on average ‘essential’ with jobs where the skills are ‘very important’, the difference in hourly pay amounts to an estimated 7% for females and 8% for males.
• The usage of computing skills continues to be associated with substantial pay premia in the labour market. Compared with otherwise similar jobs that do not use computers at all, those which use them in a ‘complex’ manner – for example, using statistical software packages – pay an estimated 18% premium for females, 12% for males.
• No other generic skill requirements yield a substantial positive and statistically significant pay premium among all workers. However, among managers and supervisors there is a modest premium reflecting the use of greater managerial skills.
• There has been a marked fall since 2001 in the labour market value of advanced computer skills. Apart from that fall, however, there has been considerable stability in the rewards to the generic skills over the 1997 to 2006 period.
• All the broad skills indicators are associated with positive wage premia. Graduate level jobs attract by far the highest premia: 56% for females and 48% for males, compared with jobs requiring no qualifications on entry.
• The premia associated with high-level qualification requirements have been consistent over the past twenty years; however, there has been a recent fall, between 2001 and 2006, in the labour market premium for jobs requiring Level 2 qualifications.
Skills, Gender and Region
• There are substantive differences between the types of job skills that are prevalent in jobs held by men and those prevalent in jobs held by women. For example, some generic skills – such as communication skills – are more associated with women’s jobs, while other generic skills – such as physical and number skills and technical know-how – are more associated with men’s jobs. Among managers, human resource management skills such as coaching are more important for female managers, while
x

strategic thinking is more important for male managers.
• There has been a marked convergence between men and women in the presence of advanced equipment and computerised technology at work. In 1986 there was a gender gap of 13 percentage points. This fell to 5 points in 1992 and by 2001 the gap had disappeared, with women at least as likely to be using such equipment as men. In 2006, almost identical proportions of men and women – around four-fifths – reported using advanced technologies in their jobs. Nevertheless, men are more likely to be in jobs that involve complex and advanced computer use. Moreover, this gender imbalance has changed little between 1997 and 2006.
• Among women, an important distinction needs to be drawn between full-time and part-time work. All the measures of broad skills, most of the generic skills measures, and the importance of on-going learning are at lower levels for female part-time workers than for either men or female full-time workers.
• However, although these distinctions remain in 2006, both the overall gender skills gap and the skills gap between women working part-time and those working full-time have narrowed substantially over the last two decades. Over the last two decades, women’s broad work skills have risen faster than men’s, thereby serving to narrow the gender skills gap. This change applies to each of the three broad measures, over the last two decades and the more recent five year period. For example, between 1986 and 2006 the proportion of jobs requiring no qualifications on entry has declined from 48% to 27% for women and from 31% to 28% for men. Thus, the gender gap for broad work skills has virtually disappeared. Much the same pattern of change is recorded for the use of generic skills at work. In all ten skill domains, the rapidity of change over the 1997-2006 period has been greatest for women part-timers.
• There are substantial regional differences in the use of computing skills at work. The proportion of jobs for which computer skills are essential is 55% in London, 56% in the East of England and 54% in the South East. This compares with just 41% of jobs in Scotland, 44% in Wales and 42% in the East Midlands.
Task Discretion
• More skilled jobs typically require higher levels of discretion over job tasks. Despite this, the rise in skills among employees over the last two decades has not been accompanied by a corresponding rise in the control they can exercise over their jobs. Between 1992 and 2001 there was a marked decline in employee task discretion for both men and women, but since 2001 employee task discretion has remained stable. For example, the proportions reporting a great deal of influence over how to do tasks at work fell from 57% in 1992 to 43% in 2001, where it remained in 2006.
• In all years the level of job control exercised by women in full-time jobs was substantially greater than that exercised by women in part-time jobs. However, unlike our other findings the situation worsened between 1992 and 2001, when the level of task discretion declined faster for female part-timers than for female full-timers. Over the last five years this relative deterioration for part-timers has been reversed somewhat.
• Reduced personal discretion in jobs over the last two decades has been partly matched by rises in external sources of control. There was also a rise between 1986 and 2001 in the importance of certain non-hierarchical constraints on individual job
xi

performance – notably by fellow workers and by clients or customers. Since 2001, however, these forms of external control have loosened. This may have contributed to the levelling off in employee task discretion.
Attitudes to Work and Skill Development
• Opportunities for the use of abilities and of personal initiative were of central importance to the job preferences of British employees in 2006. The importance of being able to make use of abilities at work were ranked higher than ‘good pay’ – 83% rated being able to use initiative at work as ‘essential’ or ‘very important’ compared to 76% who gave good pay a similar rating. Moreover, there is no evidence of a decline in the relative importance of intrinsic job features – such as opportunities for the use of abilities and initiative – compared with pay. Expectations have risen with respect to both over the period 1992-2006.
• There was a convergence between men’s and women’s job preferences between 1992 and 2006. Whereas in 1992 men attached more importance than women to use of abilities, opportunities to use initiative and good training provision, the difference with respect to use of abilities had virtually disappeared by 2006, and women had come to attach more importance than men to the use of initiative and good training provision.
• Three out of five employees reported that they had been aware of the likely availability of training opportunities in their organisation at the time they initially chose the job – and 56% of employees had thought that the training opportunities would be good. But there were strong variations by occupational class. Two in three (67%) of workers in ‘‘Elementary’’ occupations and either had had no clear impression about the training opportunities on offer, or knew when they were being recruited that it would be difficult to get training opportunities.
• In nearly two-thirds (65%) of cases the initiative for employee training came from the employer rather than from the employee. But the relative importance of employee and employer initiative varied substantially by occupational class. Among the least skilled training was an employer initiative in 80% of cases.
• Most employees that had experienced training had found it beneficial. Relatively few had found it stressful or considered that it had led to significant conflicts with family time. A majority thought that it had led both to more enjoyment of work (60%) and to perceived improvement in the way the work was done (87%). Fewer mentioned longer-term career advantages. Just under half thought that it had led to greater job security, but less than one in five reported that it had led to a pay increase or a better job. Only a small proportion of employees had looked for a job with another employer as a result of their training.
• While nearly two-thirds of employees wanted training in the future, only a quarter expressed a strong desire for it. Just over half wanted to acquire additional skills or qualifications in the next three years. The type of training people were most frequently looking for involved acquiring new vocational or professional qualifications. Training was seen primarily as a way of increasing job mobility, of providing a sense of personal achievement and of improving performance in the job. Only a third thought that it would lead to promotion.
xii
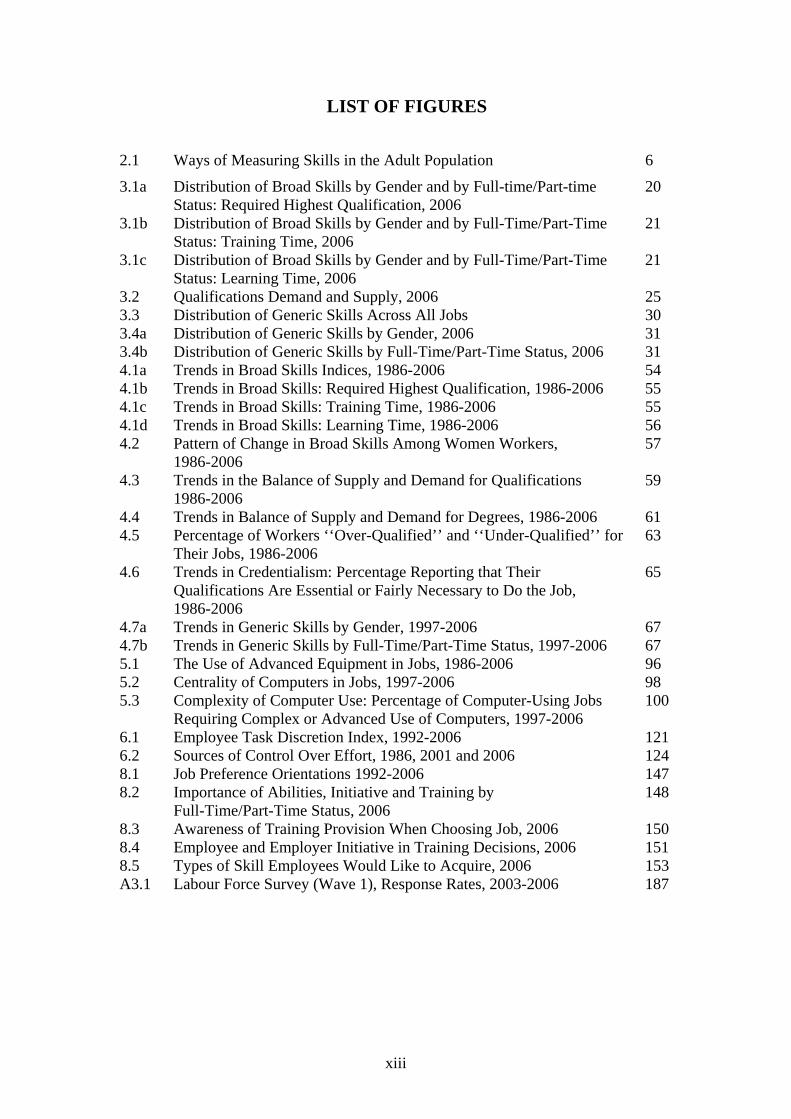
LIST OF FIGURES
2.1 Ways of Measuring Skills in the Adult Population 6
3.1a Distribution of Broad Skills by Gender and by Full-time/Part-time Status: Required Highest Qualification, 2006
20
3.1b Distribution of Broad Skills by Gender and by Full-Time/Part-Time Status: Training Time, 2006
21
3.1c Distribution of Broad Skills by Gender and by Full-Time/Part-Time Status: Learning Time, 2006
21
3.2 Qualifications Demand and Supply, 2006 25 3.3 Distribution of Generic Skills Across All Jobs 30 3.4a Distribution of Generic Skills by Gender, 2006 31 3.4b Distribution of Generic Skills by Full-Time/Part-Time Status, 2006 31 4.1a Trends in Broad Skills Indices, 1986-2006 54 4.1b Trends in Broad Skills: Required Highest Qualification, 1986-2006 55 4.1c Trends in Broad Skills: Training Time, 1986-2006 55 4.1d Trends in Broad Skills: Learning Time, 1986-2006 56 4.2 Pattern of Change in Broad Skills Among Women Workers,
1986-2006 57
4.3 Trends in the Balance of Supply and Demand for Qualifications 1986-2006
59
4.4 Trends in Balance of Supply and Demand for Degrees, 1986-2006 61 4.5 Percentage of Workers ‘‘Over-Qualified’’ and ‘‘Under-Qualified’’ for
Their Jobs, 1986-2006 63
4.6 Trends in Credentialism: Percentage Reporting that Their Qualifications Are Essential or Fairly Necessary to Do the Job, 1986-2006
65
4.7a Trends in Generic Skills by Gender, 1997-2006 67 4.7b Trends in Generic Skills by Full-Time/Part-Time Status, 1997-2006 67 5.1 The Use of Advanced Equipment in Jobs, 1986-2006 96 5.2 Centrality of Computers in Jobs, 1997-2006 98 5.3 Complexity of Computer Use: Percentage of Computer-Using Jobs
Requiring Complex or Advanced Use of Computers, 1997-2006 100
6.1 Employee Task Discretion Index, 1992-2006 121 6.2 Sources of Control Over Effort, 1986, 2001 and 2006 124 8.1 Job Preference Orientations 1992-2006 147 8.2 Importance of Abilities, Initiative and Training by
Full-Time/Part-Time Status, 2006 148
8.3 Awareness of Training Provision When Choosing Job, 2006 150 8.4 Employee and Employer Initiative in Training Decisions, 2006 151 8.5 Types of Skill Employees Would Like to Acquire, 2006 153 A3.1 Labour Force Survey (Wave 1), Response Rates, 2003-2006 187
xiii

LIST OF TABLES
3.1 Distribution of Broad Skills by Gender and by Full-Time/Part-Time Status, 2006
37
3.2 Distribution of Broad Skills by Occupation, 2006 40 3.3 Distribution of Broad Skills by Social Class, 2006 41 3.4 Distribution of Broad Skills by Industry, 2006 42 3.5 Distribution of Broad Skills by Region/Country, 2006 43 3.6 Qualifications Demand and Supply, 2006 44 3.7 Improving Learning and Performance by Gender, Full-Time/Part-Time
Status and Occupation, 2006 46
3.8 Distribution of Generic Skills by Gender and by Full-Time/Part-Time Status, 2006
47
3.9 Distribution of Generic Skills Across Occupations, 2006 48 3.10 Distribution of Generic Skills by Industry, 2006 49 3.11 Distribution of Generic Skills by Region, 2006 50 3.12 Generic Management Skills, 2006 51 3.13 Correlation Coefficients Between Skill Measures 52 4.1 Trends in Broad Skills, 1986-2006 72 4.2 Change in Broad Skills, 1986-2006 75 4.3 Pattern of Change in the Distribution of Broad Skills by Gender and by
Full-time/Part-Time Status, 1986-2006 76
4.4 Pattern of Change in the Distribution of Broad Skills by Occupation, 1986-2006
77
4.5 Pattern of Change in the Distribution of Broad Skills by Industry, 1986-2006
78
4.6 Qualifications Demand and Supply, 1986-2006 80 4.7 Trends in the Proportions ‘‘Over-Qualified’’ and ‘‘Under-Qualified’’
for their Jobs, 1986-2006 83
4.8 Credentialism, 1986-2006 84 4.9 Trends in Qualifications Used at Work, 1986-2006 85 4.10 Change in the Distribution of Generic Skills by Gender and by
Full-Time/Part-Time Status, 1997-2006 86
4.11 Pattern of Change in the Distribution of Generic Skills by Occupation, 1997-2006
88
4.12 Pattern of Change in the Distribution of Generic Skills by Industry, 1997-2006
89
4.13 Differences Between Detailed Skills in 2006 and Detailed Skills in 1997
90
4.14 Importance of Factors in Getting Jobs, 2001-2006 92 4.15 Percentage Required to Learn New Things At Work, 1992-2006 93 4.16 Percentage Helping Others to Learn, 2001-2006 94 5.1 Percentage Using Computerised or Automated Equipment in Their
Job, 1986-2006 104
5.2 Percentage of Employees Using Computerised or Automated Equipment in Their Job by Occupation, 1986-2006
105
5.3 Percentage of Employees Using Computerised or Automated Equipment in Their Job by Industry, 1986-2006
106
5.4 Percentage of Employees Using Computerised or Automated 107
xiv

Equipment in Their Job by Region, 2006 5.5 Importance of Use of PC or Other Types of Computerised Equipment
to Job, 1997- 2006 108
5.6 Percentage Reporting Use of PC or Other Types of Computerised Equipment ‘Essential’ in Their Job by Occupation, 1997-2006
109
5.7 Percentage Reporting Use of PC or Other Types of Computerised Equipment ‘Essential’ in Their Job by Industry, 1997-2006
110
5.8 Percentage Reporting Use of PC or Other Types of Computerised Equipment ‘Essential’ in Their Job by Region, 2006
111
5.9 Whether Change in Importance of Computing Skills in Own Job in Last Five/Four/Three Years, 2006
112
5.10 Complexity of Use of Computers or Computerised Equipment, 1997-2006
113
5.11 Complexity of Use of Computers or Computerised Equipment by Occupation, 1997-2006
114
5.12 Complexity of Use of Computers or Computerised Equipment by Industry, 1997-2006
115
5.13 Importance of Use of the Internet in the Job, 2001-2006 116 5.14 Type of Use of the Internet, 2001-2006 117 5.15 Percentage Reporting Use of the Internet ‘Essential’ or ‘Very
Important’ in Their Job by Occupation, 2001-2006 118
5.16 Percentage Reporting Use of the Internet ‘Essential’ or ‘Very Important’ in Their Job by Industry, 2001-2006
119
6.1 Employee Task Discretion, 1992-2006 126 6.2 Influence Over Employee Task Characteristics by Gender, 1992-2006 127 6.3 Influence Over Employee Task Characteristics by Full-time/Part-time
Contract Status among Women, 1992-2006 128
6.4 Employee Task Discretion Index by Occupation, 1992-2006 129 6.5 Employee Task Discretion Index by Industry, 1992-2006 130 6.6 Closeness of Supervisory Control, 1986-2006 131 6.7 Forms of Control over Work Effort, 1986-2006 132 7.1 Association of Pay With Skills 141 7.2 The Value of Skills, 1997-2006 143 7.3 The Value of Broad Skills, 1986-2006 144 8.1 Job Preference Orientations, 1992 and 2006 156 8.2 Job Preference Orientations by Sex, 1992 and 2006 157 8.3 Importance of Use of Abilities, Initiative and Training by
Full-time/Part-time Status, Class and Industry, 2006 158
8.4 Awareness of Training Provision on Choice of Job, 2006 159 8.5 Employee and Employer Initiative in Training Decisions, 2006 160 8.6 Employee Perceptions of Costs and Benefits of Training, 2006 161 8.7 Future Perspectives: Desire for Training, 1992 and 2006 162 8.8 Future Perspectives: Desire for Training, 2001 and 2006 163 8.9 Future Perspectives: Desire for Training, 2006 164 8.10 Future Perspectives: Types of Skill and Benefits, 2006 165 A2.1 Month of Interview for ‘Core’ Sample 178 A2.2 Re-issued Addresses – Original Outcomes 178 A2.3 Re-issued Cases – Final Outcomes 179 A2.4 Length of Interview 181 A2.5 Length of Questionnaire Sections 182
xv

A3.1 Gross Response Rate 184 A3.2 Net Response Rate 185 A3.3 Comparative Gross and Net Response Rates 186 A3.4 Socio-economic Distribution of the Sample 189 A3.5 Socio-economic Distribution of the Sample (20-60 year olds) 191
xvi

ACKNOWLEDGEMENTS
First and foremost our thanks must go to all the anonymous respondents who took part in the 2006 Skills Survey. Without them – as well as the respondents to the other surveys in the series reported here – this Report could not have been produced. We would also like to thank BMRB Social Research for administering the 2006 survey in a highly efficient and professional manner. In particular, we would like to thank Bruce Hayward, Mark Peters, Ken Seeds, Barry Fong and members of their Operational Team for managing, collecting and coding the data gathered. Last, but by no means least, we would like to thank the sponsors of the survey who have provided financial support for the research, and have offered continued encouragement and advice as the research has progressed. This advice has been channelled through a Steering Committee chaired by Ken Mayhew (SKOPE) which has regularly met during the course of the project. Members of this Committee have included: Ian Farnden (ESRC); Geoffrey Shoesmith and Janette King (Department for Education and Skills); David Campbell and Maria Cody (Department for Trade and Industry); Joyce Findlater and Robert Cirin (Learning and Skills Council); Carol Stanfield and Lesley Giles (Sector Skills Development Agency); Sarah Munro and Stephen Boyle (Futureskills Scotland); Jackie McDonald and Jo Corke (Futureskills Wales); Andrea Rutherford and Diane Duncan (Highlands and Islands Enterprise); Claire Townsend and Chris Lawton (East Midlands Development Agency); and Dave Rogers and Gayle Kennedy (Department for Employment and Learning, Northern Ireland). All gave freely of their time to give this advice; for this we are very grateful.
The analysis reported here is the responsibility of the authors alone and cannot be attributed to either the sponsoring organisations or their representatives.
xvii

CHAPTER 1 INTRODUCTION
1.1 Issues to be Addressed
In recent years there has been much policy interest in measuring the stock of skills in Britain: its distribution, how it is changing and whether the international skills gap is narrowing. The presumption that underlies much of this interest is that the development of human capital is the key to the economic success of the nation, organisations and individuals. Substantial research support can be called upon to justify such a position. In the 1990s a stream of articles from the National Institute for Economic and Social Research (NIESR) in particular highlighted Britain’s relatively lowly ranking in the world skills league – as measured by qualifications of a comparable standard. This, it was argued, hinders labour productivity and weakens Britain’s economic performance (DfES, 2001; HM Treasury, 2002; Mason and Finegold, 1995; Mason et al., 1992).
This research evidence prompted a flurry of policy interest which intensified with the election of the Labour government in 1997. This resulted in the launching of evidence based enquiries led by a variety of government departments. For example, in 1998 the Skills Task Force was set-up by the Department for Education and Skills (DfES, 2000) with the remit of developing a national skills agenda, in 2000-2001 the Performance and Innovation Unit (now the Strategy Unit and part of the Prime Minister’s Office) carried out an investigation into the development of workplace skills (PIU, 2001; Strategy Unit, 2002) and, more recently, the Leitch Review of Skills was established by HM Treasury to provide an independent review of skills and to make policy recommendations with a view to making Britain ‘a world leader in skills by 2020’ (HM Treasury, 2005 and 2006). All of these investigations have been focused on sustaining and enhancing economic well being, while at the same time providing equality of opportunity for all.
An up-to-date understanding of the distribution of skills is, therefore, an important underpinning for the policy agenda of enhancing Britain’s economic performance and promoting greater social inclusion. Similarly, fresh evidence on the changing use of skills is warranted, if we are to understand the direction in which the country and its workplaces are headed. However, these issues pose some basic prior questions, including ‘which skills are relevant?’, and ‘how can they be measured?’. Given answers to these questions, one can then examine how the different skills are distributed across workplaces, which are growing and which are declining. To investigate the role of skills in the current labour market it is also important to know what they are worth in the labour market: how much are employers paying in jobs which require the different types of skill? Linked to these issues, it is also of interest to examine what workers, as well as employers, think about the prospects for acquiring skills at work. Answers to these questions can be of interest both to scholars eager to test theories of the modern workplace and to policy-makers concerned to use skills if possible to improve economic performance.
This Report tries to answer some of these questions, reporting on information about skills derived from the people actually exercising those skills. It stands in contrast to, and complementary with, reports on skill shortages and other skills-related variables that are based on data collected from employers. The Report presents results from the 2006 Skills
1

Survey, a survey of work skills in Britain based on interviews with individuals in their homes concerning their jobs.
1.2 The 2006 Skills Survey in the Context of the Skills Survey Series
The 2006 Skills Survey is supported by a consortium formed by the Economic and Social Research Council (ESRC) and several government agencies: the Department for Education and Skills, the Department for Trade and Industry, the Learning and Skills Council, the Sector Skills Development Agency, Scottish Enterprise and Future Skills Wales. This consortium is supplemented by the East Midlands Development Agency, Highlands and Islands Enterprise and the Department for Employment and Learning (Northern Ireland) who have funded additional regional samples. The survey is the latest in a series of surveys of British jobs carried out over a period of two decades, where the main features of the jobs are reported by the individuals themselves who carry out the jobs.
The first substantial study which aimed to find valid measures of the skill requirements of jobs and to measure the distribution of broad skills in Britain was carried out as part of the ESRC’s Social Change and Economic Life Initiative surveys in 1986. Its focus was on the skills required of employees in their jobs. The Employment in Britain Survey in 1992 (which was funded by an Industrial consortium, the Employment Department, the Employment Service and the Leverhulme Trust) included the same measures together with much more extensive information on job quality, thereby giving us the first rigorous evidence on trends over time (Gallie et al., 1998).
The first Skills Survey, carried out in 1997 as part of the ESRC’s ‘Learning Society’ programme of research, was designed to extend the evidence about trends over time in ‘broad skills’ such as the qualifications required for job entry, the length of time it takes to train and the period taken to learn to do a job well. In addition, the survey also provided us with much more detailed knowledge about the importance of a wide range of activities carried out at work. These data were collected by adapting the methods of job analysis for the purposes of social survey. The outcome of this approach was that it enabled the measurement of ten generic skills and in addition computing skills.
The 2001 Skills Survey was a partial repeat survey, but this time funded by the Department for Education and Skills. All the key questions on job analyses and skill requirements were repeated identically. The survey thereby enabled an updating of the picture of the distribution and trend of broad skill requirements, and for the first time gave measures of the trends in utilisation of generic skills. The survey extended the work of the 1997 survey by including a richer set of measures of other aspects of job quality that allowed comparisons with the 1992 Employment in Britain Survey.
These earlier surveys, with their varying funding sources, were not originally planned as part of a series. They had a mix of objectives driven by academic issues in social science and by the concerns of policy-makers. Yet, as funding has become available researchers have been able to construct a series by designing continuity into questionnaire design where possible. The same principle has driven the design of the current survey. Together,
2

the surveys provide a unique picture of change in British workplaces as reported by individual jobholders.1
1.3 Objectives of the 2006 Skills Survey
The overarching objective of the 2006 Skills Survey is to provide a resource for analysing skill and job requirements in the British economy in the middle part of the current decade, thus providing continuity with the previous sequence of surveys, and a benchmark for comparison with the past and potential future surveys. Within this overarching aim, there are five main objectives which informed the design of the questionnaire:
1: to provide information on the level and distribution of skills being utilised in British workplaces in 2006. Data on important skills-related variables is also collected, including task discretion, team-working, the requirement for learning, and skills mismatches.
2: to provide a picture of recent trends in broad and generic skills, updating previous series that extended to 2001.
3: to enable us to update our knowledge of the valuation of skills, and of the association of skills usage with other worker rewards and indicators of well-being, and of how skills are related to the evolution of inequality.
4: to provide a description of the work preferences and work motivation of those in employment in Britain, and to make possible a systematic analysis of how preferences and motivation relate to the skill development that people experience in their jobs.
5: to enable us to further our knowledge about the relationship between employers’ human resource practices, the competitive environment in which they operate, other job characteristics, and the level and development of their employees’ skills.
An additional objective has been to provide analyses of job skills utilisation within and between the regions and nations of the United Kingdom. For this purpose, certain regions have been targeted with additional sample points in order to obtain sufficient within-region observations. 2 This objective is to be discussed in more detail in subsequent region-specific reports, and is not referred to again in this Report. 3
1 For a list of publications based on the three Skills Surveys and some related ones based on the earlier surveys, see http://www.kent.ac.uk/economics/staff/gfg/2006skillssurvey.htm 2 Wales, the whole of Scotland (including the Highlands and Islands) and the East Midlands are the subject of these boost samples; in addition, the survey is also being conducted for the first time in Northern Ireland. 3 Region/country-based reports and papers to follow will address the remaining objectives.
3

1.4 Objectives of the Report
This Report is directed at the second, third and fourth of these objectives. It describes the findings of the research team in respect of the distribution and trends in skills in Britain, task discretion, the valuation of skills and the experience of skills acquisition.
We begin in Chapter 2, however, by setting the methods used in the survey in the context of a general discussion about skills measurement in national populations. Chapter 2 also provides a summary description of the survey methods and outcomes, which are described in detail in the Technical Annexe.
Our initial findings on the distribution of skills are presented in Chapter 3, covering both broad skills – the qualification, learning and training requirements of jobs – and generic skills other than computing skills. Included in this chapter is a description of how we generate the measures of the skills from the raw data. We focus on how the skills are spread across jobs, and across genders, part-time and full-time workers, occupations, industries and regions/nations within Britain, and examine the balance between the supply of qualifications at various levels in the population and employers’ use of qualifications as perceived by jobholders.
Chapter 4 focuses on the trends in broad and generic skills, and examines the changing balance of qualifications held and qualifications required. Chapter 5 is focused entirely on computing skills, looking both at the distribution and at the trends in the exercise of computing skills over the years.
In Chapter 6 we turn to the distribution of task discretion, and examine how this measure has changed in recent years and over the long term. Chapter 7 investigates the valuation of skills, as given by how the skills are rewarded in the labour market. Again, we investigate both the value afforded to broad and generic (including computing) skills in 2006, and how these values have changed over time.
Chapter 8 is the newest aspect of the analysis. It examines workers’ motivations and attitudes towards skills acquisition and related variables, and how these attitudes have changed since 1992.
Finally, Chapter 9 concludes with a brief review of some important themes that have emerged from the analysis, and points to the further research which is planned for these areas.
4

CHAPTER 2 METHODOLOGY
The previous chapter has stated the purpose of, and motivation for, measuring skills used in British workplaces in 2006. Before considering the detailed structure of the new survey, it will be useful to review various approaches to skills measurement that have been adopted in previous literature, in order to set the current study in context. This chapter will then describe the innovations made in the 2006 Skills Survey, outline the questionnaire, and summarise the sampling and data collection procedures and outcomes.
2.1 Approaches to Skills Measurement
Several approaches have been used to assess skills among national or sub-national populations, and it is useful to begin by considering the general advantages and disadvantages of each. The five main approaches base their measures on, respectively: educational attainment, occupational classification, skill tests, self-assessment and job requirements.4 The 2006 Skills Survey, like its predecessors, is largely based on individuals’ reports of job requirements. The usefulness of each approach, whether for academic or policy-making purposes, depends on the concept of skill which is the object of the study, as well as on the issues of reliability and feasibility. A broad judgement about each approach is summarised in Table 2.1.5
4 For the sake of completeness it may be worth mentioning two indirect approaches which are occasionally resorted to by economists, for lack of other data: the ideas that skills could be proxied by wages or by indicators of work experience. Thus, high wage jobs are typically thought of as high-skilled jobs; and the ‘returns’ to work experience are thought to capture the acquisition of workplace skills. 5 This section extends the discussions contained in Borghans et al. (2001), which looked just at the issue of skills in economic analysis, in Green (2004) and in Felstead et al. (2002).
5

Table 2.1 Ways of Measuring Skills in the Adult Population Approach Example(s) Advantages Disadvantages 1a. Qualifications
The proportions at each level (sometimes limited to degree-level and below)
Steedman and Murray (2001)
Objective; long-term trends available
Loose connection of academic qualifications with job skills
1b. Education Length
Average years of schooling, or proportions with at least x years
Barro and Lee (1996; 2001)
Objective; long-term trends available; internationally comparable
Variable quality of education, and loose link with job skills
2. Occupation
The proportions in higher-skilled occupations
Machin and Van Reenen (1998); Gregory et al. (2001)
Easily available from labour force surveys or censuses; sometimes internationally comparable
Skills change within occupations; the hierarchy of skill among occupations is contestable and changing
3. Tests
Scores from literacy and numeracy tests, such as the Skills for Life Survey
OECD et al. (1997); Freeman and Schettkatt (2001)
Objective; international comparisons sometimes possible
Narrow range of skills; expensive to administer.
4. Self-Assessment
Survey-based individual reports about themselves
Bynner (1994)
Wide range of skills
Subjective, and skill assessment associated with self-esteem
5. Job requirements
Sourced from commercial job analyses, expert assessments of occupations, or surveys of individuals or employers
Cappelli (1993); Holzer (1998); Howell and Wolff (1991); Ashton et al.(1999); Felstead et al. (2002); Autor et al. (2003a); Handel (2000)
Wide range of skills; intimately connected to jobs
Job skill requirement could differ from person skill; subjective; does not measure skills of non-employed people.
Source: Adapted from Green (2006).
Educational attainment, and qualifications gained, are probably the most commonly used measures of the skills of populations. The basic idea is to measure, through survey methods (or where possible through administrative data collection), the proportions of the adult population who have achieved certain education or qualification levels, such as possession of a bachelor’s degree or equivalent. Conversely, one might measure the proportions of the population who are not in possession of any academic or vocational qualifications. Educational attainment, as measured by the stage reached (e.g. ‘completed high school’) or by the number of years’ schooling, is closely related to qualifications achievement, though not quite the same. A measure of the number of years’ schooling has the particular advantage of being most easily utilised in an international comparative
6

measure of human capital, as for example in the series of studies by Barro and Lee (2001, 1996).
The main advantage of this approach is that the measures obtained are normally ‘objective’, in the sense that the measure of skill is determined by some external authority (the examining body) or by some externally verifiable datum. Educational measures should also, in principle, be consistent. If the proportion of people holding a degree rises from x% to y% over time, one would infer that the skills base has increased, providing that one has confidence that the standard of the degree qualification has not been lowered in the meantime. Objective comparisons across countries are more constrained because the extent to which the qualifications of different educational systems are equivalent has only been established in relatively few cases, and even then the equivalence is never very precise. The ISCED classification system is one way of measuring broad attainment levels, but the attribution of individuals to ISCED levels sometimes requires contestable judgements. Where, however, the comparison is of years of schooling the measures are more obviously internationally commensurate (Barro and Lee, 1996, 2001), although there can be international differences in the quantity of educational inputs per year, and in their quality.
The disadvantages of using qualifications or educational attainment as a measure of job skills are, however, well-known. Qualifications gained in schools and colleges are only loose measures of the skills actually used in workplaces, and by the same token of the productivity of workers. This is as it should be: education is for life, not just for the workplace. Equal years of schooling can lead to differing workplace skills, according to the varying emphasis and quality of the education process, and according to individual characteristics. Most qualifications assess academic competence, not workplace skills. Many of the skills necessary for high levels of productivity are acquired at work, either formally through training or informally through a practical learning environment. Organisational change is found especially to be a trigger for the acquisition and utilisation of higher and new workplace skills (Green et al., 2001; Caroli and Van Reenen, 2001; Felstead and Gallie, 2004). Sometimes a positive learning environment is consciously fostered by employers, for example, through the use of continuous improvement groups (‘quality circles’).
Occupational classification is another commonly used method of skills measurement. Quite commonly the rise in proportions of higher status occupational groups such as managers and professionals, for example, is given as evidence of rising skills demand. In economic analyses requiring detailed multi-country data on skill, for lack of anything better a particularly simple classification is sometimes adopted, namely the proportion of workers in non-manual occupations (Machin and Van Reenen, 1998). The major advantage of using occupational classification is that this measure is relatively easily available, certainly at national level, using labour force surveys or census data.
International comparisons using anything other than the manual/non-manual ratios are unfortunately much harder, owing to the lack of widespread conformity of international occupation classification standards. Moreover, there are two other serious problems with this method. First, there is likely to be imperfect agreement over the skills hierarchy of occupations, which may be grouped according to other criteria such as pay or social esteem, which may not coincide with skill. In any case, any such ranking is likely only to be partial: many occupations have to be grouped together as equally skilled. Moreover, a single skills hierarchy would not distinguish between different types of generic skills, which can be ranked differently across the occupations. A second problem of using
7

occupation as the measure of skill is that jobs change within occupations. The overall skill structure of nations may grow partly because of compositional changes in occupations and industries, but partly also because of the transformation of jobs. The changing roles of managers is a case in point; another is the widespread diffusion of requirements for computing skills. In an earlier study we estimated that the changing occupational structure in Britain could account for no more than half of the skills changes observed using direct measures of job skill requirements (Green et al., 2003).
The third method of measuring the stock of skills in the adult population is through the use of skills tests. The International Adult Literacy Surveys pioneered in the 1990s by the OECD have had a considerable influence on both academic research and on research for policy-makers. Other tests have been developed in a similar vein, such as the Information et Vie Quotidienne (IVQ) in France, and the UK Skills for Life Survey. The focus of these tests, carried out usually in people’s homes and supported by a regular survey collecting demographic and workplace data, has largely been on numeracy and literacy. IT skills have been examined but with mixed success so far. Some analytical skills are also tested in the more recent Adult Literacy and Life Skills Survey, in which Britain, like many other major industrial countries, did not take part. The advantages of the testing approach to skills measurement are self-evident: if done properly they provide objective measures. However, tests have some important disadvantages if one wants regular assessments of a wide range of skills in a work context. Skills tests have hitherto only been able to tap a relatively narrow range of skills, primarily the basic academic ones. There are likely to be some skills, which are thought to be of distinct value in the labour market, which would be hard to measure using a testing methodology. Communication skills may be a case in point. Tests are also especially expensive to administer. Persuading a representative sample of adults to sit tests in their own homes is a non-trivial task. Given finite resources this limits the scope of accompanying surveys. A third potential disadvantage is that the tests may not capture the usage of skills in the context of the workplace. An example is problem-solving: though a generic skill, the capacity to transfer problem-solving skills in analytical exercises performed in the home under test conditions to the needs of the workplace is itself problematic.
Self-assessment of skills has been used in some survey contexts, such as the National Child Development Study (Bynner et al., 1997). The advantage of this method is that it allows one to investigate an especially wide range of competences. The disadvantage, however, is that self-assessment is potentially subject to considerable social esteem biases, and also to measurement error if people are unable to judge for themselves how good they are. Comparisons of self-assessed competences between groups – for example, between males and females – do carry significant information, and have been found to be related to economic performance. But one cannot safely attribute such effects to the skills per se rather than to the individual’s self-confidence and other character traits.
Finally, the approach to skills measurement based on job requirements has its origins in the commercial practice of job analysis developed by occupational psychologists. In the early 1990s a selection of path-breaking skills studies were made through retrospective analyses of commercial files (measures of broad skills were first used in Britain in the SCELI survey carried out in 1986). These studies were able to examine skills change in particular occupations, but not with respect to the aggregate workforce.
More recently, there has been the development of survey-based measures of job skills adapted from the general principles of job analysis. This approach, which has been
8

termed the ‘job requirements approach’, underpins the 1997 Skills Survey and the 2001 Skills Survey (see Ashton et al., 1999; Felstead et al., 2002).
The advantages and disadvantages of the job requirements approach are both shown in the following three assumptions which underpin this approach. First, suppose that the objective is to measure the work skills of the employed population. It could be assumed that measures of skills in use in jobs are a reasonable proxy for the skills of the jobholder. If an individual is using a computer for advanced programming, for example, it is assumed that he/she has the relevant skills, or would not have survived in the job. Nevertheless, discrepancies between jobholders’ skills and job requirements are possible and supplementary questions need to be asked to ascertain subjective views about skills mismatches. Some individuals may have an excess supply of some skills, and not be using them fully on the job; others may have insufficient skills for the job they are doing, and may survive despite the consequent poor performance. These mismatches are dynamic: they can appear and disappear as both jobs and people change. While data on job skill requirements is useful in its own right, any inferences from the job requirements about workers’ skills will need to be qualified by this first assumption. An alternative response to this issue is simply to regard and make use of the data as direct measures of job skills, that is, the skills required and used in jobs. For the most part, this latter position is the approach taken in this study.
A second assumption is that the individual is a well-informed person to report about the job he/she is doing. All jobs differ, even within quite narrowly categorised occupations, and one would normally (but not always) expect the jobholder to know best. In highly skilled jobs this is more likely to be true, as workers adapt jobs to their own abilities and tastes. In less skilled jobs, and where the jobholder has been only a short time in post, the assumption might be questioned in some cases. Still, on balance it seems reasonable to assume that the individual is generally the best informant about the job he/she is doing.
The third assumption is that the individual reports these activities in an unbiased way. This assumption is also arguable: individuals might talk up their jobs, to boost their self-esteem. But, it is maintained by occupational psychologists that reportage of behaviour (something that is grounded in activity) is more reliable than reportage of capabilities. A validation study of a limited selection of the skills measures used in the 1997 survey is reported in Green and James (2003).
If, following the second assumption, individuals are the best-placed informants about their own jobs, and if social esteem bias is reduced as far as possible through careful phrasing of questions about grounded activities, measurement error is likely to be minimised.
Also using the job requirements approach, the US Government’s Occupational Information Network (ONET) data collection program has derived job skill measures for the large majority of US occupations. The ONET approach itself has its origins in the skills measures allocated to the Dictionary of Occupation Titles (DOT), which ONET replaced; the DOT measures were decided by expert panels at certain points in time, and the changes in the skills of the American workforce could be traced by examining the changing occupation structure (Howell and Wolff, 1991). The value of the DOT measures was, however, limited by the dependence on the judgements of the panel, and on the irregular and infrequent timing of those judgements, and on the incomplete representativeness of the jobs assessed. By contrast ONET derives information from surveys of employees in representatives samples of establishments. It will be useful to undertake a brief review of the differences and similarities between the ONET surveys
9

and the British Skills Surveys, both of which deploy the job requirements approach. This comparison introduces some of the key methodological assumptions that have informed the British Skills Surveys, including the present one.
2.2 A Brief Comparison of the British Skills Surveys and ONET Measures of Job Skill
The origin and aims of the ONET surveys used in the US are very different from those of the British Skills Surveys. ONET is an occupational database of worker attributes and job characteristics that was developed as a replacement for the Dictionary of Occupational Titles. Its objectives are to assist employers and others in their recruitment and in the design of training programmes, and individuals in their career planning.
Despite these differences in origin and purpose, it is remarkable that similar issues and solutions for the analysis of job skills are found in ONET and the British Skills Surveys. One part of ONET’s work has involved surveying employees about the activities involved in their jobs. The objective of these surveys has been to assist in defining the skills, knowledge and abilities needed in various occupations. Some common principles have been used in questionnaire design by ONET and the British Skills Surveys.
2.2.1 Conceptual Approach
The British Skills surveys adopted a broad conceptual approach, comprising intellectual ability, interpersonal skills, physical ability, knowledge base, and working environment. A more detailed account is given in the introduction to the Report on the 1997 Skills Survey (Ashton et al., 1999: 25); while the introduction to the Report on the 2001 Skills Survey provides a comparison of skill definitions among different social science disciplines – economics, sociology and psychology (Felstead et al., 2002). Only a few items of motivation are included, but a good deal of information is collected about the context in which skills are exercised (working conditions, work organisation, responsibility, autonomy and so on). This classifactory framework is less detailed than that underlying the ONET surveys, reflecting the latter’s greater scope and facility to design more detailed surveys exploring different domains, not all within the same survey. There are also differences in nomenclature, concerning the classifications of ‘skill’. For example, ‘job requires being sensitive to others’ needs and feelings’ is classified as a ‘work style’ in ONET, but is often referred to in academic literature as ‘emotional skill’, an approach adopted in this study. It may be argued that some nomenclature differences do not matter very much, as long as the meaning is clear.
2.2.2 Skills Assessed
In addition to the conventional measures of occupation and educational qualifications, the British Skills Surveys measure utilised skills in two ways.
First, the surveys generate very many items describing generic activities involved in doing the job. The choice of items is informed by theories of skill and the practices of
10

commercial psychology; but to reduce the multiple items to a smaller and more meaningful set of ‘generic skills’, statistical techniques are used to generate several generic skill indicators from the responses on these items. The skills captured in this way are: literacy, numeracy, technical know-how, high-level communication skills, planning skills, client communication skills, horizontal communication skills, problem-solving, checking skills and physical skills; and there are two measures of the importance and sophistication of computer use in jobs. Measures are also obtained of a small number of generic management skills, taken just from those identified as managers in the sample. In the 2006 survey, emotional and aesthetic skills have been added.
Second, there are three indicators of the ‘broad skills’ required in the job, measured in terms of the total training time required to do the job, the time spent learning on the job in order to become fully competent, and the qualification level required by employers for new recruits to the job. Instruments were included that were identical to those used in earlier surveys in SCELI in 1986 and in Employment in Britain in 1992.
In addition, the survey captures other measures of skill such as workers’ own qualifications and prior training and length of work experience as well as other job and worker characteristics that are not directly connected to skill.
The measures of skills do not encompass measures of motivations and attitudes of respondents, with the exception that some investigation of skills expectations is included. Also, the surveys have only loose measures of the extent to which jobs use occupation-specific technical skills. Intermediate technical skills relevant to particular jobs have been picked up only approximately through the role of required technical qualifications, and through some items in the job requirements part of the questionnaire. Occupation-specific technical skills may be very important in certain jobs.
The ONET surveys measure a larger number of activities and attributes than are found in the British Skills Surveys. These surveys are divided into eight types: background, abilities, education and training, skills, knowledge, work styles, work context and generalised work activities. One can find in these surveys just about all the skills (both broad and generic) measured in the British Skills Surveys, broken down in different and more disaggregated ways; and there are additional skills not specifically included in Britain (e.g. negotiating). ONET thereby covers the generic skills in greater detail. ONET also includes motivations and character traits under ‘work styles’ (e.g. dependability), and estimates of the required generic knowledge of a greater range of disciplines than are attempted in Britain (e.g. chemistry and physics).
2.2.3 Unit of Analysis
A central point of similarity between the British Skills Surveys and ONET is that both are attempting to measure the skills that are required to be used in workplaces. The basic method of measurement is through of a social survey, with multiple questions about the requirements and activities of respondents’ jobs. But the two sets of surveys adopt different units for analysis.
In the case of the British Skills surveys, nationally representative surveys are conducted using random sampling methods. The sample is drawn from postcode addresses, from which eligible individuals are selected. Individuals are interviewed in their homes, rather than at their place of work. Thus the unit of analysis is the person-job. The analytical
11

output consists of measures of skills that can be held to be statistically acceptable measures for the population of employed people aged between 20 and 60 (65 for the 2006 survey).
By contrast, ONET samples employees via a random sample of employers, and selection of employees within their organisations. The analytical output consists of measures of average skill levels for each of many occupations, (classified to 3-digit level). Thus the unit of analysis is the occupation, rather than the individual.
2.2.4 The Range and the Level of Generic Skills
In addition to the desire to capture a wide range of skills, it must also be noted that certain skills appear at a number of different levels. For example, writing a signpost requires one to be able to spell and form sentences; and these same skills are needed to write a long report for clients. Nevertheless, writing a long report needs a much wider range of writing skills, deploying, for example, analytical capabilities and involving complex constructions. These are additional skills, that require the spelling and grammatical skills needed for sign-writing as a foundation. An alternative is to think of long-report writing as deploying the same skill as that needed for writing a signpost, but at a higher level. Whether we think of long-report writing as a different skill, or whether we think of different levels of writing skill, any survey of generic skills needs to capture such skill hierarchies where they are important. In the case of the British Skills surveys, hierarchies in the use of literacy skills (both reading and writing) and numerical skills are captured by asking sequentially about activities of increasing complexity and sophistication. For most other activities, no attempt is made to subdivide them into hierarchies. This decision is driven in part by survey time limitations, in part by consideration of the skills themselves and the purposes of the overall project. In many cases, the significant aspect is whether or not the activity is part of the job, and how central or important that activity is to the job.
By contrast, in the case of the ONET surveys all the activities classified under ‘knowledge’, ‘skills’ or ‘generalised work activities’ are conceived as being able to be categorised into a hierarchy of levels on a partially-anchored seven-point scale. For example, questions seek to ascertain the level of knowledge of engineering and technology, and respondents are given a scale where ‘2’ is exemplified by ‘install a door lock’, and ‘6’ by ‘plan for the impact of weather in designing a bridge’.
2.2.5 Response Scales for the Importance of Skills
In both the British Skills Surveys and in ONET, the importance of each skill in the job is captured by asking respondents to reply on a conventional importance scale. (We say ‘conventional’ because this is what is used widely and successfully in occupational psychology in commercial practice). Responses on these scales form the core of the measures of generic skills. In the case of Britain, the scale is: ‘not at all important/does not apply, not very important, fairly important, very important, essential’, while with ONET the scale is: ‘not important, somewhat important, important, very important, extremely important’. These are similar, and both employ the device of skewing the language, so that the mid-point is not neutral; in the case of Britain, this was deliberate,
12

following pilot testing, as otherwise respondents tended to bunch at the top of the scale. In neither case was the scale anchored by examples, so comparisons between people rely on an assumption that there is a common understanding of the notion of ‘importance’ among respondents and between respondents and researchers.
Overall, the differences between the two approaches derives from their respective origins, with the UK Skills Surveys being driven by a research agenda, the ONET surveys feeding into a careers and training advice service. Nevertheless, the similarities reflect a common acceptance of the general principle of adapting job analysis methods in a survey context, in order to obtain data about the nature of work.
2.3 Innovations in the 2006 Skills Survey
There are four main ways in which the 2006 survey makes innovations compared with the 2001 survey.
First, the new questionnaire includes some questions on individuals’ motivations and attitudes. The issues of the centrality of work in people’s lives, their motivation at work and their preferences with respect to jobs and careers have been of core interest in the social science literature for several decades. Through the light they shed on barriers to social mobility, they are also of central importance for policy concern with the factors affecting social integration and social cohesion. But progress has been very severely hampered by lack of adequate data and by the failure to connect these issues properly to the changing nature of work. The new survey makes it possible to take a major step forward in understanding these issues.
Second, the range of skill domains included in the job requirements analysis has been extended, to include aesthetic and emotional skills. This extension reflects a number of case studies and theoretical arguments within sociology that suggest that these skills have become especially important in service industries, and may have a bearing on gender disparities at the workplace (Nickson et al., 2003; Korczynski, 2005; Payne, 2006).
Third, the questions on training have been altered to focus on training that took place in the year leading up to interview, and questions surrounding the motivation for this training have been included for the first time. The intention is to gain more thorough information about the extent and forms of skill acquisition currently taking place in respondents’ jobs.
A fourth innovation is that the target sample has been expanded to include all those in employment aged between 20 and 65. The previous surveys had restricted the sample to those between 20 and 60. It was felt that now, with pressure for all people to retire later, and especially women, it was important to gain a picture of the sorts of jobs being done by people in their early sixties. This innovation means that the trend analyses in this Report, involving comparisons with earlier surveys, are confined to those aged 20 to 60, while the distributional picture in 2006 includes the whole age range 20 to 65.
13

2.4 Questionnaire Content
The broad outline of the topics covered in the questionnaire is as follows:
BLOCK A: Checking Eligibility (age and whether in paid work in the last 7 days)
BLOCK B: Broad Questions about the Job
BLOCK C: Detailed Job Analysis Questions
BLOCK D: Computing Skills and Qualifications Questions
BLOCK F: Work Attitudes
BLOCK E: The Organisation
BLOCK G: Pay Questions
BLOCK H: The Job Five Years Ago
BLOCK J: Recent Training, Skill Changes and Future Perspectives
BLOCK K: Personal Details and Measures of Well-Being at Work
BLOCK Q: Details of Employing Organisation and Conclusion
The ordering above, with Block F coming before Block E, comes from a design preference about question ordering, combined with the requirement for continuity in variable names with earlier surveys to aid analysis.
2.5 Survey Methods and Outcomes
The 2006 Skills Survey replicated many aspects of the two previous Skills Surveys in the series carried out in 1997 and 2001. Replication with the 2001 survey included the methods of sample selection and the main elements of the questionnaire. By these means comparability between the three surveys was maximised. In addition (and as before), several of the questions asked in 2006 were also used in a nationally representative survey of the workforce in 1992 – Employment in Britain (EIB) – and in a survey of six contracting localities carried out in 1986 – the Social Change and Economic Life Initiative (SCELI). This allows us to provide evidence of skill change over a much longer time horizon than is possible using the Skills Survey series alone.
At the same time as maintaining a strong element of comparability between surveys carried out at various points over the last two decades, we were also keen to introduce new themes including individuals’ work motivations and attitudes, aesthetic and emotional skills, and the usefulness of training in skill acquisition. Many of these questions have not been used before and so we cognitively tested 12 key questions on a sample of employees (see BMRB, 2006: Appendix B). As a result, these questions were either confirmed as conveying the meaning intended by the research team, adapted or, in
14

some cases, abandoned as likely to generate misleading responses. These cognitive interviews were followed by a pilot survey of 60 respondents, which tested the procedures of the survey and led to further refinements of the questions.
The fieldwork for the 2006 Skills Survey was conducted through computer-aided personal interview (CAPI). The sample selection was based on a conventional multi-stage design with addresses eventually being drawn from a random start point within each of the 297 geographical boundaries selected (in most cases, postcode sectors). The interviews were carried out over a seven month period with over half completed during the months of March, April and May. Considerable effort was devoted to maximising the response rate, including the re-issuing of 4,610 addresses which initially failed to produce an interview. A total of 4,800 productive interviews with individuals aged 20-65 years old and in work were conducted. This achieved number of interviews gave a ‘net response rate’ of 56%, and a ‘gross response rate’ of 62%, the difference depending on the assumptions made about the eligibility of households that could not be screened (see Technical Annexe A3 for details). This response rate is lower than that achieved for the 2001 Skills Survey. However, the decline is in line with falling response rates to similar surveys such as the Labour Force Survey.
Weights were computed to take into account the differential probabilities of sample selection according to the number of dwelling units at each issued address and the number of eligible interview respondents (Kish weight). Further analysis was carried out on the representativeness of the achieved sample. The distribution of the achieved sample was compared with the Spring 2006 Labour Force Survey, according to sex, age, ethnicity, working time, occupation, industry and qualification level, and found to be acceptably close. However, sex and age weights were added to the sample weights in order to correct for a slight under-representation in the sample of men and those in their twenties (see Technical Annexe A3.3). With this correction, the result is a high quality, randomly drawn and representative, data set.
15

CHAPTER 3 THE DISTRIBUTION OF WORK SKILLS IN BRITAIN
3.1 Introduction
In this chapter, we examine the distribution of skills using two types of skill measure derived from the 2006 Skills Survey. The first part of the chapter deals with broad measures of skill that seek to assess the abilities and capacities of those in employment by focusing on the requirements of the job. The second part examines the generic skills demanded from workers in jobs by assessing the importance of detailed activities carried out at work. The chapter also examines the generic managerial skills of those who report themselves as having managerial or supervisory duties. To complete the picture, the chapter considers how closely correlated our broad and generic skill measures really are. The chapter also provides evidence on the extent to which jobs in Britain require foreign language skills.
3.2 Broad Skills
A common way of measuring skills is to examine the stock of qualifications held by the workforce. Data sets such as the Labour Force Survey and their equivalents in other countries make this type of analysis possible on a regular basis. One aspect of the skills debate, therefore, has been to compare the qualifications of the British workforce with those of competitor nations. While this is a complex and difficult task since adjustments have to be made which take into account different qualification standards, norms and scope between nations, several studies have adopted such an approach (e.g. DfEE and Cabinet Office, 1996; HM Treasury, 2005). This type of research identifies the strengths and weaknesses of the British educational system. Its strength lies in the production of graduates – approaching a quarter of the population now have qualifications above National Vocational Qualification (NVQ) level 3, a proportion which has more than doubled over the last decade. However, the UK has proportionately more people with low qualification levels than many of its major comparators and is ranked 18th across the Organisation for Economic Co-operation and Development (OECD) on this measure. Five million people have no formal qualifications at all (HM Treasury, 2005: 40). It also has a smaller than average proportion of people with intermediate-level qualifications which puts it 20th out of the 30 countries in the OECD (HM Treasury, 2005: 43).
However, such an approach is focused exclusively on the supply of skills as proxied by qualifications. Although it is possible to examine the qualifications held by those actually in employment, the match between the qualifications held by jobholder and the qualifications their employers and their jobs require is likely to be less than perfect. We therefore need accurate data on the qualifications that are required for each job. Moreover, an academic or a vocational qualification may be only a loose proxy for the skills and abilities that an individual possesses. There is a need for other broad measures of job skills to supplement the measure derived from the qualifications needed to get jobs.
16

The 2006 Skills Survey (and the other four data sets discussed in this Report) contains measures both of the qualifications held by jobholder, and of three separate measures of the broad skills required in the job. Collecting three broad measures of the skills required for jobs recognises that skills are acquired in different ways, and that it is important therefore to have a multi-dimensional picture rather than any single measure. The survey therefore collected information on:
• the qualifications required to get the job;
• the length of training;
• the time taken to learn to do the job well.
These broad skill measures have been successfully tested in previous surveys. By repeating the same questions (word-for-word and prompt-for-prompt) a firm basis from which to make comparisons across time was secured (see Chapter 4 where all the calculations are restricted to 20-60 year olds for comparability; whereas this Chapter is based on the 20-65 year old respondents who comprised the 2006 sample).
3.2.1 Measurement of Broad Skills
First, each respondent was asked to judge what qualifications would be required to get his or her current job in today’s labour market. They were asked: ‘If they were applying today, what qualifications, if any, would someone need to get the type of job you have now?’ A range of qualification options was given. To maximise comparability with previous surveys, relatively new qualifications such as NVQs and GNVQs were integrated as far as possible into this coding framework without lengthening it unduly. From this, the highest qualification level ranked by NVQ equivalents was derived. Hence, the responses were grouped into five categories, with the top category (level 4) further sub-divided into degrees and professional qualifications. As a summary measure of the entire scale, the Required Qualifications Index was derived ranging from zero to four, corresponding to the five qualification levels.
However, changes in required qualifications may also follow from the use of qualifications by employers to screen job applicants and hence might not reflect genuine changes in job demands. To assess this possibility, respondents were asked a follow-up question: ‘How necessary do you think it is to possess those qualifications to do your job competently?’ The responses to this question can be used to tease out the necessity of the qualifications required to carry out the work tasks involved in the job and has been used in some of the analysis that follows.
The estimates of the qualifications required to get jobs (as perceived by jobholders) can be compared with the supply of qualifications available in the labour market. Using evidence drawn from the contemporaneous Spring 2006 Labour Force Survey the profile of skills supply among the economically active can be mapped, the Vacancies Survey for the equivalent months can provide data on the level of unmet labour demand (ONS, 2006; Williams, 2004a) and data from the 2006 Skills Survey can be used to estimate the number of jobs requiring a particular level of qualification on entry (for more detail see Table 3.6). By restricting these three sources of data to the relevant 20-65 year old British population (the vacancy data cannot as vacancies are open to all irrespective of age), it is possible to identify at which levels in the qualification hierarchy the aggregate
17

qualification requirements and qualifications supply are in equilibrium and where, if at all, they are out of step with one another.
However, in these analyses it should be remembered that required qualifications are merely one aspect used in recruitment, and are only one measure of the complex skills needed in jobs. Other factors such as experience, natural ability and motivation also play a part and give further insights into the demands of the job. In order to estimate their relative importance, respondents to the 2006 Skills Survey were asked to identify from a list of options attributes ‘someone would need to get the type job you have now?’ Multiple responses to the question were allowed. While ‘educational or technical qualifications’ were mentioned by 26% of the sample as the most or second most important attribute needed to get jobs, this factor was neck and neck with ‘motivation’ (27%) and dwarfed by ‘previous experience of similar work’ (40%) which was much higher by comparison. This provides further justification for an approach that measures skills in a variety of ways rather than relying on the required qualifications measure alone. However, as might be expected the importance of qualifications in getting jobs rose with the level of qualification required. For example, it was reported as the most or second most important factor by 54% of those in jobs requiring level 4 or above qualifications compared with 17% of jobs requiring level 1 qualifications (these figures have changed little from those reported in the 2001 Skills Survey, see Table 4.10 but note that Chapter 3 relates to 20-65 year olds not 20-60 year olds as in Chapter 4).
A second broad skill measure is based on responses to a series of questions on the length of training time required for the particular type of work carried out by respondents. It is based on the premise that the training time required for different jobs reflects various ability levels and knowledge demanded by contrasting types of work. Respondents were asked: ‘Since completing full-time education, have you ever had, or are you currently undertaking, training for the type of work that you currently do?’ If ‘yes’, ‘How long, in total, did (or will) that training last?’ If training was still on-going respondents were asked to estimate how long it would take. For the purposes of presentation, we examine the proportions reporting ‘short’ (less than three months) and ‘long’ (over two years) training times i.e. the points at either end of the continuum. We also use a summary measure of the complete range of options allowed, ranging from zero to six, entitled the Training Time Index. We report the average Training Time Index for various groups.
The third broad skill measure is similarly constructed. Respondents were asked: ‘How long did it take for you after you first started doing this type of job to learn to do it well?’ If they answered ‘still learning’ they were asked: ‘How long do you think it will take?’ Again, for the purposes of presentation, we examine the proportions at either end of the continuum – ‘short’ learning time denoting less than one month and ‘long’ denoting over two years. The Learning Time Index is a summary measure of all the answers given ranging from one to six. For comparability with earlier data sets, the results are presented for employees only.
Our basic expectation is that the more skilled jobs take longer to learn. Data collected by the 2006 Skills Survey provides considerable justification for this position. The survey asked respondents who reported that their jobs took less than three months to learn to identify why they thought this was so (multiple responses were allowed). Almost half (49%) of those asked this question, said that it was because their job was ‘relatively straightforward’, 42% because they had ‘natural aptitude for this type of job’ and only 16% said that their education prepared them especially well for the tasks they were required to do. Further analysis reveals that very short learning times (less than one
18

week) were closely associated with the straightforward nature of the jobs held by respondents – nearly three-fifths (57%) of these jobholders cited this as a key factor (these figures have changed little from those reported in the 2001 Skills Survey). Nevertheless, some ambiguity still remains. It might be the case, for example, that since a better-educated person could learn to do some jobs well more quickly than a person with less education, a high learning time may be a negative rather than a positive indicator of skill. Alternatively, if the job called for manual dexterity, then perhaps the better educated would be slower learners since they may have put more emphasis on the development of their cognitive abilities at the expense of manual skills. However, the analysis that follows confirms our basic expectation that learning time is positively correlated with other skills indicators and provides a reasonable indicator of the skill level demanded of those in work.
3.2.2 Findings on the Distribution of Broad Skills
Table 3.1 gives the distribution of broad skills according to the gender and job status of the jobholder, as measured in the three ways outlined above. Overall, in 2006 almost equal numbers of jobs (29%) required level 4 or above qualifications for entry – that is, a professional qualification such as SRN in nursing, or an undergraduate or post-graduate degree – as those (28%) that required no qualifications on entry. The skills demanded of jobs also varied markedly according to the length of time needed to train for the job. Three out of ten jobs required a training period lasting more than two years (29%), while at the other end of the spectrum approaching three-fifths (56%) of jobs had training periods that lasted less than three months. Similarly, some jobs took a long time to do well, while others can be picked up relatively quickly. A quarter of jobs (25%) could only be done well after spending more than two years in post, but a fifth (20%) could be learnt in less than one month and competent performance could be achieved in less than a week according to respondents in one in eleven jobs (9%).
Table 3.1 also reveals the extent to which work skills are gendered. There is little difference between men and women in terms of the highest level of qualification required to get jobs – a similar proportion require level 4 credentials on entry to jobs and there is little gender difference in terms of the percentage who need no qualifications at all. The only gender variation is in terms of intermediate and low level qualifications with men more likely to need level 3 qualifications and women more likely to require level 2 qualifications. Overall, however, the gender differences are negligible according to this skills measure. The picture in 2006 of broad equality in the skills content of men’s and women’s jobs is confirmed by the indices measures. Two out of the three broad skills indices do not differ significantly between the sexes (p<0.05) – the point estimates for the Required Qualification Index for men and women are on a par and for the Training Index the point estimate for women is higher than for men, although it is not significant (p=0.146). Only for learning time do men record significantly higher scores than for women. These findings suggest that the gendered pattern of skills reported in earlier surveys carried out in 1986, 1992, 1997 and 2001 has now weakened substantially (cf. Ashton et al., 1999; Felstead et al., 2000, 2001; Felstead and Gallie, 2004).
However, there is substantial (and statistically significant) difference in the skill content of women’s jobs according to whether they are designated as full-time or part-time workers (which in the analysis which follows is self-defined). According to all three
19

broad skill measures, female part-timers are on average in lower skilled jobs than their full-time counterparts. For example, 33% of female part-timers are in jobs that require no qualifications for entry compared to 23% of female full-timers. At the other end of the scale, one-fifth (20%) of female part-timers need a level 4 qualification to get their jobs compared to over a third (36%) of full-time women who need to be similarly qualified. The same story can be told for the other skill measures – women are in part-time jobs that are quicker to learn and require shorter training times than their full-time counterparts. In addition, the differences between female full-timers and female part-timers on all three broad skills indices are statistically significant (p<0.05). Figures 3.1a, 3.1b and 3.1c show these results graphically with two out of three of the bars (representing the three broad skills indices) for men and women on a par with one another, but substantial gaps appearing between the heights of the columns for women working full-time and those working part-time (see Figures 3.1a, 3.1b and 3.1c).
Figure 3.1a Distribution of Broad Skills by Gender and by Full-time/Part-time Status: Required Highest Qualification, 2006
0
0.5
1
1.5
2
2.5
Males Females Female Full-timers
Female Part-timers
Requ
ired
Hig
hest
Qua
lific
atio
n In
dex
Source: Table 3.1.
20

Figure 3.1b Distribution of Broad Skills by Gender and by Full-Time/Part-Time Status: Training Time, 2006
2.5
3
0.5
1
1.5
2
Trai
ning
Tim
e In
dex
0Males Females Female Full-
timers Female Part-
timers
Source: Table 3.1.
Figure 3.1c Distribution of Broad Skills by Gender and by Full-Time/Part-Time Status: Learning Time, 2006
4
4.5
0
0.5
1
1.5
2
2.5
3
3.5
Males Females Female Full-timers
Female Part-timers
Lear
ning
Tim
e In
dex
Source: Table 3.1.
Table 3.2 shows the distribution of broad skills by occupation. In general, the evidence suggests that the further up the occupational hierarchy one goes, the higher the skills demand. So, for example, the Required Qualification Index rises more or less smoothly from 0.42 for ‘Elementary Occupations’ to 3.66 for ‘Professionals’. Similar patterns are evident for the Training Time and Learning Time indices. However, there is a little more
21

fluidity in the skills ranking of ‘intermediate’ occupations on these measures. For example, those in ‘Administrative and Secretarial Occupations’ slip down the rankings for Training Time and Learning Time where they are ranked sixth and fifth respectively. The skill ranking of those in ‘Personal Service’ occupations, on the other hand, is better according to the Training Time index than the other two broad skills indices or their occupational rank would suggest.
Nevertheless, the three broad skill indices confirm the occupational hierarchy suggested
the skills rankings. One explanation is that this finding simply reflects the nature
and ‘Health and Social Work’ –
by the Standard Occupational Classification (SOC) system. The derivation of the one-digit SOC hierarchy (i.e. the occupational groups reported here) is based either on the level of formal qualifications required for a person to get a particular job or the duration of training and/or work experience normally required for occupational competence (ONS, 2000: ix, 4; Elias et al., 1999; Elias, 1995: 43-45). These criteria bear close resemblance to our Required Qualification, Training Time and Learning Time indices. The consistency between the SOC hierarchy and the skill hierarchy produced by our broad skills measures is therefore reassuring.
Despite this reassurance, the SOC hierarchy rates the jobs of ‘Managers’ as the most highly skilled of all jobs. However, our indices suggest that these jobs come in the top four in of the occupational grouping, which includes many of the self-employed who are traditionally in lowly skilled jobs but who nonetheless exercise managerial responsibilities. This is partly confirmed by our analysis of the data according to the National Statistics Socio-Economic Classification (NS-SEC) (Table 3.3). This confirms the relatively lowly skilled position of ‘Small Employers and Own Account Workers’ in the skills hierarchy (especially according to the Required Qualification and Training Time indices). Their separate designation (i.e. removal from the ‘Managers’ SOC category) also highlights the expected high skill content of ‘Higher Managerial and Large Employer’ jobs which come in the top two for the three broad skill measures.
Table 3.4 outlines the industrial distribution of broad skills and shows that skills demands vary markedly by industry but in line with a priori expectations. Jobs in ‘Education’ are the highest skilled according to the Required Qualification and come a close second when measured by the Training Time and Learning Time Indices. Other public sector dominated industries – such as ‘Public Administration’also record relatively high broad skills scores. Put another way, six out of ten (62%) positions in the ‘Education’ industry require level 4 or above qualifications for entry, 36% take over two years to train for and 38% take more than two years to do well. ‘Hotels and Restaurants’ and ‘Wholesale and Retail’, on the other hand, are relatively lowly skilled according to the three broad skill measures. In ‘Hotels and Restaurants’, for example, over half (53%) of jobs require no qualifications for entry, 59% need no training whatsoever and 46% can be learnt to do well in less than one month. The data also reveal that industrial sectors may be a lot lower on some measures than on others. Those in ‘Construction’, for example, have middling skill levels according to the Required Qualification and Training Time indices, but are highly skilled according to the length of time required to learn skills on-the-job.
Devolution in Wales and Scotland, and the establishment of nine Regional Development Agencies (RDAs) in England in 1999 have heightened interest in geographical variations. Previous comparisons of regional skills profiles based on evidence drawn from previous Skills Surveys have suggested differences in the geographical distribution of skills in Britain (e.g., Felstead, 2002, 2005). Table 3.5 updates that debate by outlining the broad
22

skill distribution of jobs according to RDA region/country. According to this evidence no clear pattern of spatial variation emerges. Some geographical areas score high on one broad skill indicator, low on another and middling on the third. For example, jobs in
get jobs, alongside the numbers of economically active
s’ perceptions of the qualification requirements of
recruits – have already taken place (Machin, 2003). We take a three-month rolling average covering the months March-May (in line with the LFS estimates and the time period during which the majority of the 2006 Skills Survey interviews were carried out, see Technical Annexe). To arrive at the total number of vacancies available in Britain we remove the estimates for Northern Ireland. Our second source of data is the 2006 Skills Survey. To approximate the qualification levels of these vacancies, we examine the required qualifications of the 2006 respondents who are new appointees (in post 12 months or less, which equates to 15% of the sample). These proportions are multiplied by the total number of vacancies available to produce estimates of vacancies by qualification level.
Wales are low according to the training time indicator, but high according to learning time and middling according to the level of qualifications required to secure jobs. Only jobs in the East are consistently ranked highly, while those in the North West are ranked lowly according to our three broad skill measures.
Table 3.6 presents estimates of the numbers of jobs including vacancies that require various levels of qualifications topeople holding each level of qualification. We refer to the former as the ‘demand’ for qualifications, because it is an estimate of employers’ demand for labour at each qualification level as perceived by current jobholders. We thus use the conventional assumption that, in a relatively flexible labour market, the actual number of jobs would not remain in the long term above employers’ planned demand for qualified labour; and the inclusion of vacancies accounts for sectors where the demand exceeds the current number of jobs. In effect, ‘demand’ equates to the number of jobs occupied by level of qualification required by new entrants plus an estimate for unfilled posts at each of these levels.
The estimates of demand for qualifications are based on the 2006 Skills Survey evidence for the highest qualification required to get the job respondents occupied at the time of interview. These proportions are grossed up to the numbers of 20-65 year olds recorded to be in work in Britain according to the Spring 2006 Labour Force Survey. It should be remembered that these demand estimates derive from the jobholders’ perceptions of the required qualifications, rather than their employers’ perceptions. Evidence from elsewhere suggests that line managerjobs are on average not substantially different from the perceptions of their subordinates (Green and James, 2001). Since the 2006 Skills Survey was designed as, and has been shown to be, representative for Britain as a whole, the estimates should be regarded as reasonably reliable. Nevertheless, since as noted above qualifications are only a loose measure of skills used at work, which is why we examine multiple measures in this Report, it should be remembered that the demands at each qualification level are only loose measures of the demand for different skill levels.
The details of the calculation are as follows. In order to provide a complete picture of the demand for labour at each qualification level we need to take into account vacancies in the labour market and apportion these to each of the qualification levels. These numbers (shown in column 3, Table 3.6) are derived from two sources. The first source is the Vacancies Survey which is carried out every month and asks businesses (who have to take part in the survey by law) to report the number of ‘unoccupied or soon to be vacated’ posts for which recruitment activities – such as placing adverts or approaching potential
23
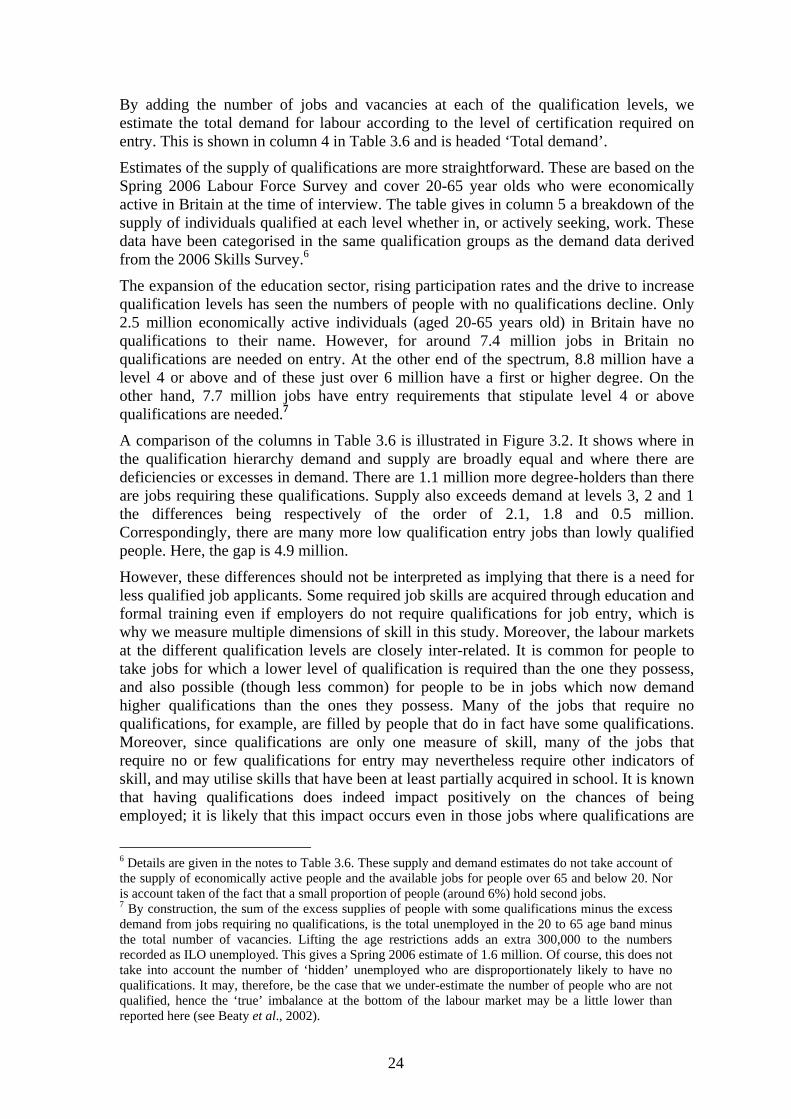
By adding the number of jobs and vacancies at each of the qualification levels, we estimate the total demand for labour according to the level of certification required on entry. This is shown in column 4 in Table 3.6 and is headed ‘Total demand’.
stimates of the supply of qualifications are more straightforward. These are based on the Spring 2006 Labour Force Survey and cover 20-65 year olds who were economically active in Britain at the time of interview. The table gives in column 5 a breakdown of the supply of individuals qualified at each level whether in, or actively seeking, work. These data have been categorised in the same qualification groups as the demand data derived from the 2006 Skills Survey.6
The expansion of the education sector, rising participation rates and the drive to increase qualification levels has seen the numbers of people with no qualifications decline. Only 2.5 million economically active individuals (aged 20-65 years old) in Britain have no qualifications to their name. However, for around 7.4 million jobs in Britain no qualifications are needed on entry. At the other end of the spectrum, 8.8 million have a level 4 or above and of these just over 6 million have a first or higher degree. On the other hand, 7.7 million jobs have entry requirements that stipulate level 4 or above qualifications are needed.7
A comparison of the columns in Table 3.6 is illustrated in Figure 3.2. It shows where in the qualification hierarchy demand and supply are broadly equal and where there are deficiencies or excesses in demand. There are 1.1 million more degree-holders than there are jobs requiring these qualifications. Supply also exceeds demand at levels 3, 2 and 1 the differences being respectively of the order of 2.1, 1.8 and 0.5 million. Correspondingly, there are many more low qualification entry jobs than lowly qualified people. Here, the gap is 4.9 million.
However, these differences should not be interpreted as implying that there is a need forless qualified job applicants. Some required job skills are acquired through education and
ven if employers do not require qualifications for job entry, which is
mand possess. Many of the jobs that require no
it is likely that this impact occurs even in those jobs where qualifications are
E
formal training ewhy we measure multiple dimensions of skill in this study. Moreover, the labour markets at the different qualification levels are closely inter-related. It is common for people to take jobs for which a lower level of qualification is required than the one they possess,
ople to be in jobs which now deand also possible (though less common) for pehigher qualifications than the ones they qualifications, for example, are filled by people that do in fact have some qualifications. Moreover, since qualifications are only one measure of skill, many of the jobs that require no or few qualifications for entry may nevertheless require other indicators of skill, and may utilise skills that have been at least partially acquired in school. It is known that having qualifications does indeed impact positively on the chances of being employed;
6 Details are given in the notes to Table 3.6. These supply and demand estimates do not take account of the supply of economically active people and the available jobs for people over 65 and below 20. Nor is account taken of the fact that a small proportion of people (around 6%) hold second jobs. 7 By construction, the sum of the excess supplies of people with some qualifications minus the excess demand from jobs requiring no qualifications, is the total unemployed in the 20 to 65 age band minus the total number of vacancies. Lifting the age restrictions adds an extra 300,000 to the numbers recorded as ILO unemployed. This gives a Spring 2006 estimate of 1.6 million. Of course, this does not take into account the number of ‘hidden’ unemployed who are disproportionately likely to have no qualifications. It may, therefore, be the case that we under-estimate the number of people who are not qualified, hence the ‘true’ imbalance at the bottom of the labour market may be a little lower than reported here (see Beaty et al., 2002).
24

not required to get the job, because better qualified individuals would be more likely to have acquired the skills needed8. We examine the match between jobs and qualifications t an individual level in the next chapter. a
Figure 3.2 Qualifications Demand and Supply, 2006
4000
5000
6000
7000
8000
9000
10000
'000
s of P
eopl
e
DemandSupply
0
1000
2000
3000
No Qual Level1 Level 2 Level 3 Level 4+ Degree Prof. Qual
Source: Table 6
Note: ‘‘Demand’’ is the aggregate number of jobs at which each qualification level is required for job entry; ‘‘supply’’ is number of economically people at each level of highest achieved qualification. See notes to Table 3.6.
Finally in this section we also investigated the idea that, beyond the education, training one’s current work tasks, there may also be a need
acquire more skills in order to maintain proficiency. Much of this learning takes place n the job (Felstead et al., 2005), but we are interested here in the overall extent to which
and job-related learning needed to dotooon-going learning is a requirement of the job, seen to be an aspect of the knowledge economy.
To address this issue, the 2006 Skills Survey asked respondents to indicate their level of agreement with the statement: ‘My job requires that I keep learning new things’. This statement elicited very high levels of agreement with four-fifths (82%) agreeing to some extent (see Table 3.7). Nevertheless, there was some variability in these responses. This proportion, for example, fell among female part-timers to around three-quarters (74%), rose among ‘Professionals’ to nineteen out of twenty (95%), but fell sharply lower down
8 To investigate this effect it would have been necessary to include unemployed and non-employed people in the survey; but the sample included only employed people by design.
25

the occupational scale – with just over half (53%) of those in ‘Elementary’ jobs agreeing that they were expected to learn on-the-job.
3.3 Generic Skills
Previous surveys in this series have pioneered the development of measures of the use of ‘generic skills’ in workplaces. The idea of a generic skill refers to a skill which is used across a wide range of occupations and industrial situations, in contrast to occupation-specific or firm-specific skills that are needed in particular jobs. A widely-cited example is the skill of communication, which is needed in many jobs, but to differing degrees and at varying levels. There is nothing new in this: communication has been necessary in many jobs since the dawn of cooperative working. The desire to measure generic skills arose in the 1990s, however, owing to the suspicion that there were certain identifiable skills that were growing in importance in modern workplaces, and for which employees were not always being well-prepared either at school or through training. A policy focus on ‘key skills’ emerged, and these were entered in the school and university curricula; and a separate Key Skills Qualification was introduced in 2000.
The measures of generic skills usage in 1997 and 2001 afforded the opportunity to test the proposition that the skills were indeed becoming more important in the workplace. The changes in the responses to the first two surveys re
e somewhat more important, even over that comvealed that most generic skills had
paratively short period of only ur years. The generic skill that increased most was computing, while physical skills
changed at all over the period. The surveys also revealed that ertain skills were in receipt of substantive and significant pay premia, over and above e general education and training requirements of jobs. In particular, computing skills
s chapter is to describe how measures of generic skills are obtained from
becomfowere found not to havecthand influence skills were well rewarded. Most other skills, however, were not associated with special rewards in the labour market.
The aim in thithe survey responses, and then to examine how generic skills are distributed across jobs held by various socio-economic groups in Britain.
3.3.1 Measurement of Generic Skills
The overall approach taken to devising measures of generic skills from the 2006 Skills Survey responses is similar in principle to that utilised in the previous surveys. In those surveys the 35 items involved were factor analysed and the scores on the 10 resulting factors were treated as the indices of generic skills. However, certain changes have been made with the current survey for two reasons. First, there were now some additional items to be included in the analysis. Second, it was felt that a new way of calculating skill indices would be beneficial if the interpretation of the indices were to be made somewhat more transparent than in previous surveys, and if the indices enabled the importance of the skills to be compared with each other.9
9 Continuity is maintained, for the purposes of trend analyses, by recalculating indices for the previous surveys using the new method utilised here; see Chapter 4.
26

Five additional items were included in the generic skills section of the questionnaire. There are two questions concerning ‘emotional skills’, concerning how important it is for workers to manage their own feelings and handling the feelings of others. There are also two questions on ‘aesthetic skills’, concerning how important is for them to ‘look the part’ and to ‘sound the part’ in their jobs. These items were introduced into the survey because it has been argued that there are a number of jobs, particular in the service sector
here it is common to interact with the public or with colleagues, where such skills are ecoming especially important, particularly so for women (Nickson et al., 2003;
yne, 2006). On the basis of such studies, we expected to find that omen utilise more emotional skills and more aesthetic skills than do men. If so, failing
mation about these activities would give an incomplete picture of the
ow the factor analysis was conducted. It follows closely the
your job. At this stage
ivity]’. The response scale offered was: ‘essential’, ‘very important’, ‘fairly
s and planning the activities of others. e 35 able
inal scale of
t’) to 4 (meaning ‘essential’). Factor analysis is a statistical technique which examines the hidden structure of a large number of variables, reducing them to a much more limited number of ‘factors’ whose covariance captures a large proportion of the overall covariance between the original items. The factors were chosen in such a way as to capture sub-sets of the 35 variables which vary closely together, and which conform
wbKorczynski, 2005; Pawto collect infordifferences between men’s and women’s jobs. Finally, the fifth newly introduced question concerned the use of foreign language skills. This item was not strongly correlated with any of the other activities, and was investigated separately (see below).
Initially a factor analysis similar to that used in previous surveys was conducted. This analysis, which is described in the next sub-section, had the purpose of exploring the structure of the data – that is to say, whether it was still correct to reduce the many individual items to a limited number of underlying generic skills in the same way as before. However, to improve the interpretability of the indices, it was decided not to use the factor scores as the skills indices. Rather, the factor analysis was used to specify how items would be combined (i.e. which items grouped together). The skill indices were then obtained by averaging across the items in each group.
3.3.1.1 Factor Analysis
This sub-section describes hdescription of the factor analysis conducted in the 2001 and 1997 surveys Felstead et al. (2002: 33-4).
Respondents were asked a series of detailed questions about what their job comprises. The generic skills section of the questionnaire was prefaced by the following: ‘You will
ay or may not be part of be asked about different activities which mwe are only interested in finding out what types of activities your job involves and how important these are’. Respondents were asked: ‘in your job, how important is [a particular job actimportant’, ‘not very important’ and ‘not at all important or does not apply’. Examples of the activities included working with a team of people, working out the causes of problems or faults, making speeches or presentationTo maintain continuity with previous surveys the factor analysis focused on thactivities (other than computing) that were also covered in the earlier surveys (see T4.12). The use of computers is to be discussed separately below (Chapter 5).
The 35 items were first changed into 35 variables. We transformed the ord‘importance’ for each variable into an increasing cardinal scale, running from 0 (meaning ‘not at all importan
27

to theoretical concepts – in this case, to our concepts of generic skill types. We chose to ere consistent in this case with ulting factor scores were easily
nvolved the same high loadings as same set of factors le.
ls indices, we grouped the variables/items in the ways implied by the ctor analysis. For each group an additive index is calculated, which is scaled to lie
etween 0 and 4, just as for the raw data items. We attributed labels to the index scores nt 4, we use the label ‘essential’, at
oint 3 ‘very important’ etc. If a person has a value of 3, in effect what this means is that
iteracy Skills: both reading and writing forms, notices, memos, signs, letters, short and
kills: the use of physical strength and/or stamina; skill in using one’s hands. (0.78)
ng, subtracting, divisions, decimal point or fraction calculations etc., nd/or more advanced maths or statistical procedures. (0.86)
uct or service, counselling or caring for customers
extract ten factors because, after ‘rotation’, ten factors wthe accepted criteria for factor analyses, because the resinterpretable as skill types, and because these factors ihad been found when factor analysing the 1997 and 2001 surveys. Thewas found whether we used just males, just females or the whole samp
3.3.1.2 Skills Indices
To calculate skilfabidentical to the labels in the raw data. Thus, at poipthe score of that person averaged across questions in that group is 3. At the bottom end we use the label ‘not used’, as a short-hand for ‘not at all important/does not apply’.
The same approach was used to gain measures of the additional generic skills implied in our additional questions. A factor analysis implied that the variables loaded onto two distinct factors, which were easily interpreted as aesthetic skills and emotional skills. Two further additive indices were accordingly created in the same way as the previous ten.
A brief description of the generic skill measures is as follows (with Cronbach’s alpha statistic in parentheses):10
Llong documents etc.. (0.90)
Physical S
Number Skills: addia
Technical ‘Know-How’: knowing how to use tools or equipment or machinery, knowing about products and services, specialist knowledge and/or skill in using one’s hands. (0.64)
Influence: persuading or influencing others, instructing, training or teaching people, making speeches or presentations, writing long reports, analysing complex problems in depth, and planning the activities of others. (0.84)
Planning: planning activities, organising one’s own time and thinking ahead. (0.85)
Client Communication: selling a prodor clients, dealing with people, knowing about products and services. (0.66)
Horizontal Communication: working with a team of people, listening carefully to colleagues. (0.76) 10 In a small number of cases it may be seen that the same variable figures in more than one skill index: an example is ‘skill in using one’s hands’ which is part of both technical know-how and of physical skills. This grouping reflects the factor analysis, and is similar in prvariables that are the factor scores used with previous surveys.
actice to using the weighted combinations of
28

Problem-Solving: detecting, diagnosing, analysing and resolving problems. (0.88)
Checking Skills: noticing and checking for errors. (0.88)
Aesthetic Skills: looking and sounding the part. (0.79)
Emotional Skills: managing own and handling others’ feelings. (0.75)
Ainte
part from the two new measures, the definitions of the skills thus closely followed the rpretation of the factors reported in Felstead et al. (2002). One difference is that we
have named one generic skill ‘influence skill’, in contrast to previous surveys where we used the term ‘high communication skill’. The new term is intended to convey the somewhat broader package of activities that, according to the data, tend to be combined in certain jobs.
3.3.2 Findings on the Distribution of Generic Skills
How important are the generic skills in Britain? How widespread is their use in jobs? For a skill to be properly regarded as generic, we would expect that it is indeed deployed in a substantial range of jobs, and across different occupations and industries.
Figure 3.3 presents histograms of each of the twelve skills across. Each histogram shows the relative frequency of jobs using the generic skills with varying degrees of importance. Table 3.8 complements this Figure. The first row presents the average score for each skill, while the second row shows the proportion of jobs for which the average score is at least 3, corresponding to ‘very important’: this is, therefore, a measure of how generic the skill is.
29

010
2030
40Pe
rcen
t
0 .5 1 1.5 2 2.5 3 3.5 4Literacy
010
2030
40Pe
rcen
t
0 .5 1 1.5 2 2.5 3 3.5 4Physical Skills
010
2030
40Pe
rcen
t
0 .5 1 1.5 2 2.5 3 3.5 4Number Skills
010
2030
Figure 3.3: Distribution of Generic Skills Across All Jobs
40Pe
rcen
t
0 .5 1 1.5 2 2.5 3 3.5 4Technical Know-how
010
2030
40Pe
rcen
t
0 .5 1 1.5 2 2.5 3 3.5 4Influence Skills
010
2030
40Pe
rcen
t
0 .5 1 1.5 2 2.5 3 3.5 4Planning Skills
010
2030
40Pe
rcen
t
0 .5 1 1.5 2 2.5 3 3.5 4Client Communication Skills
010
2030
40Pe
rcen
t
0 .5 1 1.5 2 2.5 3 3.5 4Horizontal Communication Skills
010
2030
40Pe
rcen
t
0 .5 1 1.5 2 2.5 3 3.5 4olving SkillsProblem-s
010
2030
40Pe
rcen
t
0 .5 1 1.5 2 2.5 3 3.5 4Checking Skills
010
2030
40Pe
rcen
t
0 1 2 3 4Aesthetic skills
010
2030
40Pe
rcen
t
0 1 2 3 4Emotional skills
0=not used, 1='not very important', 2='fairly important', 3='very important', 4='essential'
o their status as full-time or part-time workers. The same pattern is
Source: Table 3.8.
From Table 3.8 and Figure 3.3 it can be seen that checking skills are the most prevalent, being present at this level in 79% of all jobs in the economy. In around 43% of jobs checking skills are at their highest possible level of use. Horizontal communication skills are also widely used, the corresponding indicator being 74% of all jobs. At the other end of the scale, the least generic skill domains are influence skills, number skills and physical skills, used each in 23%, 28% and 26% of jobs respectively. In each of these cases, therefore, the majority of jobs hardly call for such skills at all. The new measures for aesthetic and emotional skills lie in the middle of the spectrum, being used in, respectively, 52% and 65% of jobs.
Figures 3.4a and 3.4b (also based on data contained in Table 3.8) show the distribution of each generic skill according to the gender and job status of the jobholder. Comparing females with males, neither group dominates in respect of all skills. Yet there are some significant differences in the average skill levels. Females exceed males substantially in the use of emotional skills, somewhat less so in the use of horizontal communication skills and aesthetic skills. Conversely, males use more technical know-how, along with more physical, number and problem-solving skills.
In previous surveys wide-ranging differences were found among the jobs performed by females, according tfound in the current survey, but the full-time/part-time difference does not extend to all skills. Rather, female part-timers use less of most skills, but physical skills, technical know-how, and aesthetic and emotional skills are exceptions. The pattern of part-timers using less skills mirrors the similar finding earlier in respect of broad skills.
30

Figure3.4a The Distribution of Generic Skills by Gender, 2006
3.5
2
2.5
3
0
0.5
1
1.5
Literac
y
Physic
al
Numbe
r
al Kno
w-How
Influe
nce
Plannin
g
ommun
icatio
n
ommun
icatio
n
oblem
-Solvi
ng
Check
ing
Aesthe
ticoti
onal
Techn
ic
Client
C
Horizo
ntal C Pr
Em
Males
Females
Source: Table 3.8.
Figure 3.4b The Distribution of Generic Skills by Full-Time/Part-Time Status, 2006
3
3.5
2
0
0.5
1
1.5
Literac
y
Physic
al
Numbe
r
Techn
ical K
now-H
ow
Influe
nce
Plannin
g
Client
Commun
icatio
n
Horizo
ntal C
ommun
icatio
n
Problem
-Solvi
ng
Check
ing
Aesthe
tic
Emotion
al
2.5
Female Full-timers
Female Part-timers
Source: Table 3.8.
31

Table 3.9 gives the distribution of generic skills across occupational groups. As can be seen, while there is considerable variation across groups, this Table shows again the generic nature of these skills, in that every skill is used to some degree across a broad
ric skills are distributed across regions. Most generic skills re widely used in all the regions, and indeed the differences between regions are mainly ss than the differences between occupational groups or industries. This confirms a
l distribution of broad skills (cf. Table 3.5). Nevertheless ere are some distinct patterns. Jobs in London and in the South East especially require
ost influence skills and planning skills, and utilise the least physical skills. By
ut in this case focusing only on those people in jobs that have
of controlling resources, while the fifth
range of occupations. Nevertheless some skills (e.g. influence skills) are distinctly concentrated in certain groups of occupations, while others (e.g. checking skills) are widely used across all occupations. On the whole, occupations normally considered higher skilled show greater uses of most of the generic skills. In addition, the variation across occupations is broadly what one might expect. Thus, aesthetic and client communications skills are highest in ‘Sales’ occupations; literacy skills are highest for ‘Professional’ occupations, lowest in ‘Elementary’ occupations; physical skills and technical know-how are highest for those in ‘Skilled Trades’; number skills are highest for ‘Managers’; influence skills are at their highest for ‘Professionals’ and ‘Managers’; horizontal communication skills are greatest for ‘Professionals’; problem-solving skills greatest for ‘Managers’ and ‘Skilled Trades’; checking skills, while being high for all groups, are most used by ‘Administrative and Secretarial’ occupations; and emotional skills are at their highest in ‘Personal Service’ occupations.
As Table 3.10 shows, the generic skills are used to some extent in all industries. There is, however, a cross-industry variation which conforms to what one might expect. Emotional and aesthetic skills are most important in the service industries, while problem-solving and technical know-how are most important in ‘Construction’ and ‘Manufacturing’. Horizontal communication skills are used mostly in ‘Education’ and ‘Health and Social Services’, client communication skills in ‘Wholesale and Retailing’, physical skills in ‘Construction’, number skills in ‘Finance’. Influence, planning and literacy skills are especially prevalent in ‘Education’.
Table 3.11 shows how genealesimilar finding for the regionaththe mcontrast, physical skills are at their highest in jobs in the East Midlands, the North East and Scotland. Aesthetic skills are at their highest use in the North East and least in the South West.
3.4 Generic Management Skills
In addition to the generic skills so far examined, which are potentially applicable in all jobs to greater or lesser degrees, the 2006 Skills Survey also examined the use of certain management skills, bmanagerial or supervisory functions. It was not intended to capture a comprehensive range of management functions. Rather, the emphasis was on selected functions where the activity is relatively easily measured and related to a management skill. We were also interested in looking particularly at those management functions associated with skill acquisition for their subordinates. Using the same scale of ‘importance’ as for the other generic skills, the questions concerned three activities thought to be central to the human resource function, namely coaching staff, developing their careers, and motivating staff. Another question addressed the importance
32

question addressed the importance of strategic thinking. Of course, these functions do not exhaust by any means the potential role of managers; and several of the generic skills are also especially important for those in managerial occupations, as we have seen above (Table 3.9). The questions on managerial skills were directed only to those people whose jobs involved managerial or supervisory duties. While most of these were classified in managerial or professional occupations, there were at least some with such duties across all the occupational groups. The questions asked were identical to those utilised in the 2001 Skills Survey.
Table 3.12 shows the distribution of the management skills among employees with management or supervisory duties and among self-employed respondents who employ
thers, giving for each skill the proportion at the top two points of the importance scale. is ‘very important’ or ‘essential’ for the majority of he staff whom they manage or supervise is a vital skill
r the large majority (86%). Also remarkable is that 75% of managers and supervisors
upervisors as opposed to managers. Unsurprisingly, in all
lfem
In a analysis of the 2001 Skills Survey it was found that there was a systematic ff
witexa‘essmomosup
amthinem
Stasupstraself mployed managers said that strategic thinking was ‘very
p
em
3.5
oEach of the first four activities respondents. Notably, motivating tfosee themselves as having a coaching role. This finding suggests that work-based skills development is an important function in British workplaces. By contrast, strategic thinking about the future is an activity largely confined to a minority (42%) of managers.
For both males and females, there is a difference in the skills exercised by those classifying themselves as scases the supervisors’ skill requirements are lower than the managers, though there is litt e difference in the case of staff motivation (and no significant difference at all among
ales).
similardif erence in the managerial job skills reported by males and females. That gender dif erence remains in the 2006 data, but is now quite small. Those functions associated
h human resource management are more prominent among female managers. For mple, 74% of female supervisors thought that coaching was a ‘very important’ or ential’ activity, compared with 68% of male supervisors. The equivalent figures for
tivating staff are 88% for females, 81% for males. By contrast, strategic thinking is re important for male managers (52%) than for female managers (48%), and for male ervisors (32%) compared with female supervisors (26%).
As we have found earlier for other generic skills, there are also important differences ong females between full-time and part-time employees. For example strategic king is ‘very important’ or ‘essential’ in 50% of the jobs of female full-time
ployee managers, but in only 38% of part-time employee managers.
ff coaching skills are in more widespread use by employees with managerial or ervisor duties than by the self-employed (76% compared with 68%). In contrast, tegic thinking and resource control are generally much more important for the -employed. 82% of self-e
im ortant’ or ‘essential’, compared with only one in three (38%) of employees. There is also more importance attached to resource control among the self-employed than among
ployees (87% compared with 73%).
The Links Between Broad and Generic Skills
33

The three measures of broad skills assess the required inputs needed to acquire wledge and skills needed to perform jobs. These measures cover in principle the nitive skills, manual dexterity and occupation-specific skills needed to perform jobs. broad skills measures also can be expected to capture in part some of the generic ls needed to perform jobs. Therefore, it is expected that those jobs with greater broad ls will also score more highly on the measures of generic skills. Nevertheless, the ociation between generic and broad skills measures is not expected to be very close, ause a number of the generic skills used in jobs will be acquired neither through cation, nor through long periods of training or learning on the job. Rather, several eric skills may be picked up through family, or in other formative institutions, or eed in the course of everyday life. The physical strength needed in some jobs may ply be a genetically-determined trait; and the personality required to work with other ple might be linked to genes or upbringing to a varying extent. Moreover, the generic ls measures do not, of course, include the occupational specialist skills that are, at t loosely, picked up through the measures of training and learning time requirements. illustrate these points, the association between the broad and generic skills measures is wn in Table 3.13, which gives the bivariate correlation coefficients
knocogTheskilskilassbecedugenindsimpeoskilleasTo sho between all of the measures.
s can be seen the broad skills measures show positive correlations with all but one of e generic skills measures, the exception being physical skills. It seems that physical
skills are not in any way picked up through education, training or learning at work, which is not a surprising conclusion. Each of the broad skills measures is most closely correlated with influence skills. For example, the required qualification level is well correlated with influence skills (0.51). In each case planning skills, literacy and computing are not far behind in their links with the broad skills measures. By contrast, the correlations of the broad skills requirements with management skills, technical know-how and aesthetic and emotional skills are on the low side. In short, Table 3.13 is a reminder that the generic skills measures are not simply the detailed elements that go to make up the broad skills needed for jobs; they constitute additional measures of skills domains that are not captured even in the aggregate by the broad skills measures.
The table also shows the correlations with the supply measure of qualifications held. As may be seen, the level of qualifications that a worker holds is also positively correlated with most of the generic skills measures; but the correlation coefficients are in every case notably lower than the correlations of the required qualification level with the generic skills requirements. It is also of note that the association between the required education level and the qualification level held by workers is also not very close, having a correlation coefficient of only 0.60. This loose connection is consistent with the aggregate qualifications imbalances noted earlier in this chapter (Section 3.2). We take up again the theme of individuals’ qualifications mismatches in the next chapter when we look at the trends over time.
3.6 Foreign Language Skills
In recent years, it has been argued that foreign language skills are likely to be increasingly needed, given the globalisation of the economy. However, hitherto there has been little systematic information about the extent to which language skills were being used in Britain. We therefore wished to investigate in a preliminary manner just how
Ath
34

w the analsysis separate from the analysis eneric skills. We asked a question for the first time in the 2006 Skills Survey: ‘In your job, how important is being able to speak fluently a language other than English’ (in Wales, we added ‘or Welsh’). Speaking is only a part of a language skill, and we did not explore other language skills such as reading and listening. We also could not afford space to explo eig s were relevant if any.
Only 7% of respondents said that the use of portant’ that do use foreign language skills in their jobs, just
white ethnic groups. For these people, the s that they in jobs se various ethnic communities within Britain, for
English may not be the language spoken at home, rather than communication with foreign customers or colleagues. Just under a third were located in the health sector or in education (most of the
From e use of languages ot jobs located in Britain is highly specialised. However, it should be borne in
e figure of 7% undoubtedly understates portance for British peop in foreign lang . Many ose that do acquire foreign language skills in hools will be ing abro d therefore will not be ded in t ple n for the su If the us oreign languages is to be explored further in
equent investigation , it would be useful also to examine the languages con rned; nd the f langua lly one would have to investigate their use by
which would ake the issue outside the immediate scope of the British Skills
n Findings
r has examined the distribution of broad and gener kills (o n computing skills) being used in jobs in Britain. also e ed the ate
the s of quali ns at various levels in the workforce, and the requirements for those qualifications in jobs as perceived by our respondents. The main
• Generic skills are each used across a range of occupations, but some are more read than o Checkin s are use ur out o y five jobs, while
influence skills, number skills and physical skills are each used in roughly one in four
nly m (and sta lly negl differences between the broad l levels of jobs held by men and those held by women. Similarly, neither men nor
women dominate in terms of the use of ric skills – they merely differ in the types ed. Nevertheless, an important distinction should be made between
he
st f r.
idespread was the use of foreign languages in British jobs, keeping this part of of the other g
re what for n language
foreign languages was either ‘very imor ‘essential’ in their jobs. Of those over a quarter were from a range of non-likelihood iwhom
were rving
latter being teachers).
these findings one can conclude that th her than English or Welsh inmind that thacquiring
the im le uages of th
British scpopulatio
workrvey.
ad, ane of f
inclu he sam
subsand to understa
s ce use o ges fu
expatriates tSurvey series.
3.7 Summary of Mai
This chapte ic sxamin
ther thaaggreg It has
balance between upply ficatio
findings of the chapter are:
widesp thers. g skill d in fo f ever
jobs.
• There are oskil
odest tistica igible)
geneof skills usfull-time and part-time workers’ jobs. All the measures of broad skills, most of tgeneric skills measures, and the indicator of ‘improving learning and performance’ are at lower levels for women who work part- as opposed to full-time.
• Among the major occupational groups, ‘Professionals’ tend to require the higheskill levels, according to most of our measures. ‘Managers’ also utilise high levels oskill, though a distinction should be made according to the type of manage
35

Owner-managers in small firms report relatively low measures of broad skills. Somegeneric skills are used in a wide range of occupations; but influence skills arconcentrated among managers, professionals and associated professionals; numbeskills and physical skills are also concentrated in a limited range of occupations. Botbroad and generic skills measures are in line with expectations about the skill rankingof occupational groups.
• A narrower but still substantive range of skills is displayed across industries. ‘Hoteand Res
e r h
ls taurants’ are an area of work demanding relatively low levels of skill, on
y d e g
ost important.
l f h e e f f t
t, o
e e
d useful skills at school, and go
average. The ‘Public Administration’, ‘Education’ and ‘Finance’ industries, bcontrast, tend to require relatively high levels of broad skills, and utilise influence anliteracy skills. Emotional and aesthetic skills are most prominent in the servicindustries generally. Construction and Manufacturing are where problem-solvinskills are m
• In aggregate, there are differences between the supply of qualifications in thepopulation and estimated numbers of jobs requiring qualifications at each leve(which we have referred to as the ‘demand’ for qualifications). With the exception olevel 1, at all other qualifications levels there are many more people witqualifications than there are jobs where these qualifications are perceived by thjobholders to be required for entry. There are 1.1 million more graduates than therare degree-entry jobs. There are 6.4 million people qualified to the equivalent oNVQ level 3 in the workforce, but only 4.3 million jobs that demand this level ohighest qualification. There are a further 5.8 million people qualified at level 2, buonly 4 million jobs at this lower level. The other side of this same coin is thawhereas there are now only 2.5 million economically active people aged 20-65 whpossess no qualifications, there remain 7.4 million jobs that do not requirequalifications on entry. These differences do not necessarily represent differences inthe supply and demand for skills, since qualifications are themselves only onmeasure of skill. Many of the jobs that require no qualifications for job entry arfilled by people with qualifications who have acquireon to acquire further skills through work experience and training.
36

T l
All Males Females Female Full-Time
Female Part-Time
ab e 3.1 Distribution of Broad Skills by Gender and by Full-Time/Part-Time Status, 2006
Broad Skills1
Sample Percentages/Scores
(a) Highest Qualification Required2
Level 4 or above
Degree Professional qualifications
29.4
18.9
10.5
29.1
19.4
9.8
29.8
18.4
11.4
36.3
23.5
12.8
19.8†
10.6†
9.2
Level 3 16.3 19.1 13.1* 14.2 11.5
Level 2 15.1 9.5 21.5* 20.0 23.8
Level 1 11.3 13.7 8.6* 6.5 11.8†
No qualifications
27.9
28.9
27.1
23.1
33.2†
Required Qualification Index
2.08
2.08
2.06
2.34
1.73†
(b) Training Time3
> 2 years 29.3 30.6 27.9 31.5 22.2†
< 3 months 56.1 57.9 54.1* 50.5 59.5†
Training Index 2.56 2.51 2.63 2.85 2.29†
(c) Learning Time (Employees Only)4
> 2 years 24.9 30.9 18.6* 20.9 15.1†
< 1 month 19.5 16.2 22.9* 16.7 32.5†
Learning Time Index
3.59 3.87 3.30* 3.56 2.91†
Notes: * = a statistically significant difference between male and female workers (p<0.05) † = a statistically significant difference between female full-time and female part-time workers (p<0.05) 1. The data reported here and throughout have been weighted by a factor that takes into account the slight over-representation of women in all of the samples and according to the number of eligible respondents at each address visited (the 2006 data has also been
37

weighted to ar old age group). All calculations exclude missing values. The 2006 survey collected data on the oup, where other su her e 20-60 year age group. a are presented the en s reported. are m hen making risons over time (see Chapter 4). Hence, the data reported in this table are not comparable
ta reported in similar tables produced in previous reports (e.g. Felstead et
ive surveys were asked: ‘If they were applying today, what ns, if any, would som need to get the type of job you have now?’ A
ns was given. From this the highest qualification level, ranked by NVQ equivalents, was derived. For 2006 (and 2001), the following qualification mapping
above = masters or PhD degree, university or CNAA degree, other professional (eg, law, medicine), teaching, nursing (eg SCM, RGN, SRN, SEN), NVQ
VQ4) or HNC/ (or SHNC/SHNC); Degree = masters or PhD degree, university or CNAA degree; Professional qualifications = other professional
e), teaching, n (eg SCM, RGN, SRN, SEN), NVQ level 4 (or SNVQ4) or HNC/HNC (or SHNC/SHNC);
3 = GCE ‘A’ level or advanced, SCE higher or SLC/SUPE higher, th ity certificate/di a (not degree), SCOTVEC
SCOTBEC TBEC certificat oma, completion of trade ip, NVQ level 3 (or SNVQ 3) or ONC/OND (or SNC/SND); CSE A*-C or GNV termediate or GCE ‘O’ level or CSE grade 1 or cate of matriculati E standard (1-3)/ordinary (A-C) or SLC/SUPE l/commercial (eg typing or bookkeeping), professional qualification
without sitting exam, NVQ level 2 (or SNVQ 2); = GCSE D-G or CSE (other than grade 1) or GNVQ foundation, other, NVQ
• The Required Qualifications Index was calculated from the responses: none=0; level 1=1; level 2=2; level 3 =3; and level 4 or above=4.
3. Respondents to all five surveys were asked: ‘Since completing full-time education, have you ever had, or are you currently undertaking, training for the type of work that you currently do? Respondents answering ‘yes’ were then asked: ‘How long, in total, did (or will) that training last?’ A range of options was given.
• The Training Time Index was calculated from the responses: none=0; less than 1 month=1; 1=3 months=2; 3-6 months=3; 6-12 months=4; 1-2 years=5; and over 2 years=6.
4. Respondents to all five surveys were asked: ‘How long did it take for you after you first started doing this type of job to learn to do it well?’ This question was asked only of employees in 1986 and so the 1992, 1997, 2001 and 2006 figures have been restricted accordingly.
take into account the under-representation of the 20-29 ye
20-65 age gr as all the When the 2006 dat
rveys reported
ade w
e focused on thtire age range i
compa However, appropriate restrictions
with the daal., 2002).
2. Respondents in all fqualificatiorange of optio
eone
was applied: Level 4 or
level 4 (or SN HNC
(eg, law, medicin ursing
Level GNVQcertificate of 6 year studies, universnational certificate, apprenticesh
plome/dipl/SCO
Level 2 = Gschool certifilower, clerica
Q inon, SC
Level 1level 1 (or SNVQ 1); No qualifications = none reported.
38

• The ss than 1 month=1; less than 3 months=2; 3-6 months=3; 6-12 months=4; 1-2 years=5; and over 2 years=6.
Learning Time Index was calculated from the responses: le
39

T
Occ 1
ReqQualif
T
able 3.2 Distribution of Broad Skills by Occupation, 2006
upation uired ication Index
raining Time Index
Learning Time Index
Managers 2.59 2.87 4.24
Professionals 3.66 3 .7 5 4.87
Associate ionals Profess
2.8 34 .4 2 4.16
Administrative & Secretarial
2.09 2.27 3.19
Skilled Trades 1.8 29 .60 4.20
Personal Service 1.8 21 .91 3.17
Sales 0.8 1.47 2 2.26
Plant & Machinery 0.9 1Operatives
9 .67 2.92
Elementary Occupations
0.42 0.91 2.16
1. Occupations are classified by SOC2000 Major Groups. The indices are derived as in Table 3.1.
Note:
outlined
40

Table 3.3 Distribution of Broad Skills by Social Class, 2006
Social Class1
Required
Qualification Index
Training TimeIndex
Learning Time
Index
Higher Man& Large Em
agerial ployers
3.26
4.04
4.42
Higher Professional
3.56
3.54
4.75
Lower Managerial & Professional
2.97
3.30
4.33
Intermediate
2.08
2.66
3.43
Small Employers & orkers2 Own Account W
1.78
2.16
4.38
Lower Supervisory & Technical
1.96
2.79
4.32
utine Semi-Ro
1.09
1.84
2.70
Routine
0.80
1.37
2.69
1. Social class is derived according to the National Statistics Socio-Economic cation system (NS-SEC). The indices are derive utlined in Table 3.1.
2. Elsewhere in this Report, the Learning Time Index has been restricted to employees , this restriction has been
Notes:
Classifi d as o
only. Here lifted.
41
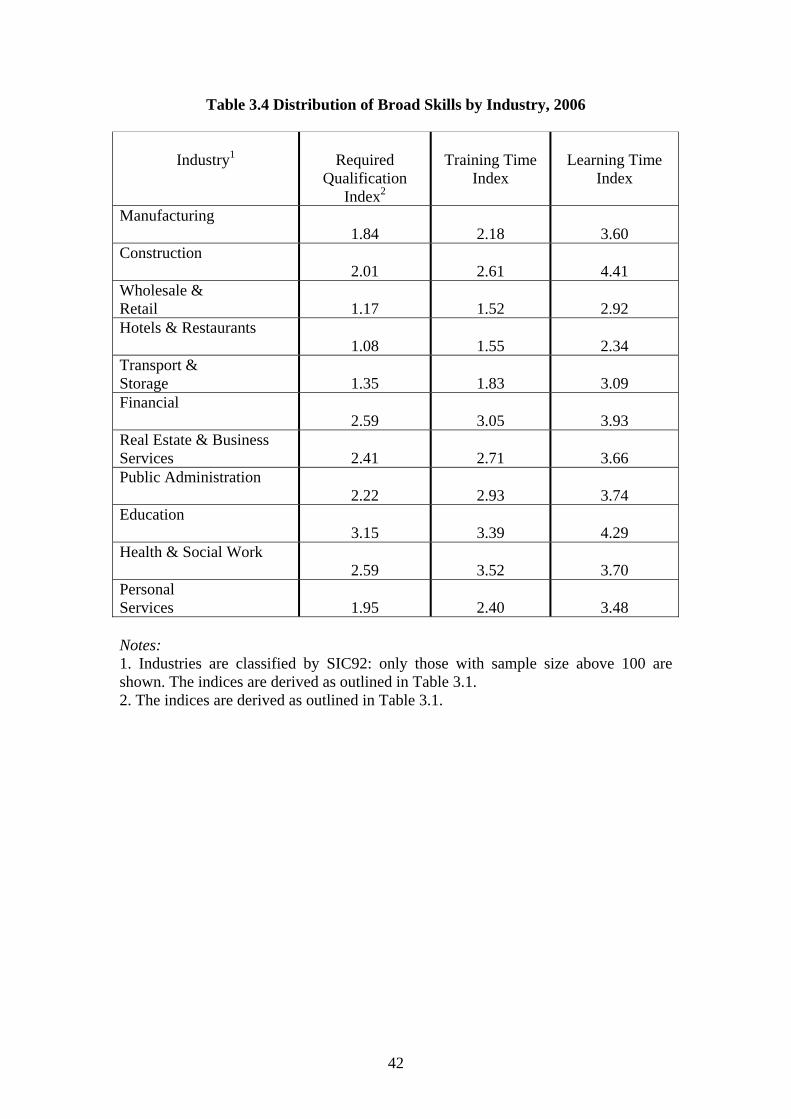
Ta 6
Industry1
Requ
Qualificati
Training Time
Index
Learning Time
Index
ble 3.4 Distribution of Broad Skills by Industry, 200
ired on
Index2
Manufacturing 1.84
2.18
3.60
Construction
2
4.41 .01 2.61
Wholesale & etail
1.17 1.52
2.92 R
Hotels & Restaurants 1.08 1.55 2.34
Transport & S
1.35 1.83 3.09 torage
F 2.59 3.05 3.93
inancial
Real Estate & Business ervices
2.41 2.71 3.66 S
Public Administration 2.22 2.93 3.74
Education 3.15 3.39 4.29
Health & Social Work 2.59 3.52 3.70
Personal Services
1.95 2.40 3.48
Notes: 1. Industries are classified by SIC92: only those with sample size above 100 are shown. The indices are derived as outlined in Table 3.1. 2. The indices are derived as outlined in Table 3.1.
42

Table 3.5 Distribution of Broad Skills by Region/Country, 2006
Region
Required
Qualification Index
Training Time
Index
Learning Time
Index
North East 2.22 2.70 3.67
North West 1.89 2.41 3.27
Yorkshire and the Humber
1.97 2.74 3.59
East Midlands 1.96 2.53 3.69
West Midlands 1.87 2.66 3.54
East 2.16 2.78 3.81
Lon ndo 2.53 2.22 3.55
South East 2.24 2.62 3.66
South W 3.45 est 2.07 2.65
Wa les 2.04 2.36 3.75
Scotland 2.00 2.51 3.71
43

Table 3.6 Qualifications Demand and Supply, 2006
Supply Demand
Highest Required
(‘000s)
Qualification 1
Jobs Vacancies and
Highest Qualification
Held2
(‘000s of people) Total
dem Level 4 or abo
Degree Professionaqualification
141
98
43
76
42
2,734
8,770
6,091
2,679
ve
l 4,844
s 2,691
7,535
7,6
4,9
Level 3
87
64
6,397 4,177 4,2
Level 2
0
86
57
5,774 3,87 3,9
Level 1
62
58
3,452 2,896 2,9
No qualifications 7,150
201
7,351
2,472
Column totals ,628
576 26,204
26,865
25
Notes: 1. Using the Spring 2006 Quarterly Labour Force Survey, an estimate was derived of the total numb individuals aged 20-65 years old who were in paid work in Britain. This figure was then multiplied by the perc of respondents to the 2006 Skills Survey w access to their jobs required qualifications at one of the levels shown in column 1. These percentages are reported in Table 3.1 (Table 4.1 is not comparable since it covers 20-60 year olds only in order to provide comparisons over all five data points). Column 2, then, comprises estimates of the number of jobs
and qualifications at various levels in the NVQ hierarchy. The is here is restricted to individuals’ main job; secondary jobs are not included. In
ployers are seeking e demand column of jobs filled
illiams, 2004a and 2004b). These data are taken from the Vacancy Survey for the onths March, April and May 2006 (ONS, 2006: Table 21; Machin, 2003). The
published figures are grossed up by 3% to provide UK estimates; this grossing factor was removed in the total number of vacancy figures for March-April 2006 (594,000) giving a total vacancy figure of 577,000. These were apportioned using the 2006 Skills Survey and focussing on those who had been in post for 12 months or less. We examined the level of qualifications these individuals reported they required on entry. These proportions were multiplied to produce an estimate of vacancies in the labour
er of entage
ho reported that
in Britain that demanalysaddition, vacancies represent the number of posts for which emrecruits, hence column 3. These need to be added to th(Wm
44

mand number of vacancies at particula levels.
. Using the Spring 2006 Quarterly Labour Force Survey, an estimate was also made of the total number of individuals who possess qualifications at e f these levels. To capture the complete supply of individuals available for work, we selected not only those in d w – m t re edas ILO unem d p ithevidence fro e S S res ed o ed 65years old living in Britain. Simila e the greater d b e L onqualifications held (such as the ability to differentiate t w or two A levels,
ence allocating individuals precisely across the Level 2/3 divide), we decided to use impler q c p o d r t a ti e Skills e a n U d a is ,
y between the columns was maximised. The figures in column 3, then, m o n r in u u r r s e
NVQ hierarchy. The LFS proportions are multiplied by the total number of dividuals available for work. To maximise comparability with the 2006 Skills
uali o ee Table 3.1), the highest qualification ariable, HIQUAL5, was categorised as follows: • Level 4 or above = higher degree, NVQ level 5, first/foundation degree, other
gre i h , retc, teaching – further education, teaching – secondary, teaching – primary,
ching – foundation stage, teaching – level not stated, nursing etc, RSA er om
Degre ig e f u o r r• Professional qualifications = NVQ level 5, NVQ level 4, diploma in higher
ucation, HNC/HND, BTEC higher etc, teaching – further education, ch n y c ,
teach u S g i r education below degree level;
• Level 3 = A level or equivalent, RSA advanced diploma, OND/ONC, BTEC/SCOTVEC national, City and Guilds advanced craft/part1, Scottish 6th
equivalent, access qualifications, AS
intermediate, RSA diploma, City and Guilds craft/part 2, grade A-C or
SVQ foundation level, CSE below grade 1, GCSE below grade C, BTEC/SCOTVEC first or general certificate, SCOTVEC modules, RSA other, City and Guilds other, YT/YTP certificate, key skills qualification, basic skills qualification, entry level qualification, other qualifications;
• No qualifications = none reported.
arket at each qualification level. Column 4 produces a total of the number of jobs r qualification
2ach o
also comto thvidene
paiploy
m th
ork (us
2006
employees and the self-eg thkills
ployedvariabl the an
dethose
– bute). Foralysis ail pro
ith o
hosearab
se agy th
cordty w 20-FS
ed in e INECAurvey, rly, de
C05we spit
erivetrict
d ili
hthe s001
ualifiSurv
ation y (b
rotocsed o
ls use the
in deHIQ
ivingAL
he querived
lifica vari
on hieble).
rarchyIn th
for th way2
comparabilitprovide esti ates f the umbe s of divid als q alified to pa ticula level in th
inSurvey q ficati ns mapping protocols (sv
de e, NVQ level 4, diploma n hig er education HNC/HND, BTEC highe
teahigh
• diple = h
a, other higher eher d
ducation below degree level; irst/fo
ee; gree, ndati n deg ee, other deg
edtea ing –
ing – secon
level ndary, ot sta
teachited, n
g – rsing
primaretc, R
, teaA hi
hing her d
– founploma
dation, other
stagehighe
year certificate (CSYS), SCE higher orlevel or equivalent, trade apprenticeship;
• Level 2 = NVQ level 2 or equivalent, intermediate Welsh baccalaureate, GNVQBTEC/SCOTVEC first or general diploma, O level, GCSEequivalent;
• Level 1 = NVQ level 1 or equivalent, GNVQ/G
45

Table 3.7 Improving Learning and Performance by Gender, Full-Time/Part-Time Status and Occupation, 2006
Percentage who agree o on
heir job requea g n
r strires
ew thin
gly them gs
agree thto ke
at tep l rnin
All 82.3
Males 83.1
Females 81.6
FemFull- J
ales Time obs
86.5
Feme Jobs 74.2
ales Part-tim
Occupation1
Managers 88.4
Professionals 95.1
Associate Pro n
93.3 fessio als
AdmSec a
inistrative & retari l
79.4
Skilled Trades 85.0
Personal Service 87.8
Sales 73.7
Plant & Machine Operatives
68.1
Elementary 52.9
Note: 1. Occupations are classified by SOC2000 Major Group.
46

Table 3.8 art-Time Status, 2006
Lite
racy
A Em
Distribution of Generic Skills by Gender and by Full-Time/P
Phys
ical
Num
ber
Te
chni
cal
Kno
w-H
ow
Influ
ence
Plan
ning
Clie
nt
Com
mun
icat
ion
Hor
izon
tal
Com
mun
icat
ion
Prob
lem
-Sol
ving
Che
ckin
g
esth
etic
otio
nal
All
2.48 1.88 1.86 2.57 2.04 3.05 2.66 3.12 3.00 3.25 2.64 2.93
H0.40
ow Generic †
0.26 0.28 0.41 0.23 0.68 0.46 0.74 0.67 0.79 0.52 0.65
2.45 Males
2.01 2.03 2.70 2.07 3.03 2.60 3.01 3.10 3.26 2.47 2.73
Females 2
.52* 1.72* 1.67* 2.42* 2.00 3.08* 2.72* 3.26* 2.89* 3.23 2.83* 3.17*
FemaleFull-Time 2.
s
Jobs
70 1.66 1.86 1.66 2.18 3.23 2.74 3.33 3.00 3.33 2.81 3.19
Females Part-time 1.82* 1.39* 1.82* 1.73* 2.85* 2.70 3.14* 2.73* 3.07* 2.87 3.14 Jobs 2.25*
Notes: The generic skills indices are the average scores of the items in each index, derived from the 2006 data. The item scale ranges from 0 (‘not at all important/does not apply’) to 4 (‘essential’). † proportion of jobs where the skill index is at least ‘very important’.
indicates a significant difference at the 5% level between female and male workers, or among females between part-time and full-time workers.
*
47

Tab 06
Note: ccupations are classified by SOC2000 Major Group. The generic skills indices are the
e scores of the items in each index, derived from the 2006 data. The item scale
Lite
racy
Phys
ial
N T E
le 3.9 Distribution of Generic Skills Across Occupations, 20
c um
ber
ec
hnca
l K
now
-How
In
fluen
ce
i
Plan
ning
Clie
nt
Com
mun
icat
ion
Hor
izon
tal
Com
mun
icat
ion
Prob
lem
-Sol
ving
Che
ckin
g
Aes
thet
ic
mot
iona
l
Managers 2.8 1.3 2.4 3 2 2.50 4 2.68 3.46 3.18 3.33 3.29 3.34 2.93 3.09
Professionals 3 1 .18 .29 2.25 2.42 2.83 3.53 2.74 3.43 3.18 3.36 2.78 3.11
Associate 2 1.88 .63 2.01 2.62 2.41 3.36 2.82 3.30 3.18 3.43 2.92 3.09 Professionals Administrative 2 1.64 .12 2.10 2.19 1.74 3.03 2.45 3.16 2.96 3.45 2.65 2.90 & Secretarial Skilled Trades 2 3.15 .04 1.94 3.38 1.73 3.01 2.47 2.79 3.33 3.40 2.14 2.64
Personal Service 2 2.38 .29 1.17 2.50 1.92 2.91 2.68 3.23 2.73 2.97 2.87 3.37
Sales 2 1.05 .82 1.75 2.58 1.60 2.54 3.32 3.12 2.61 3.00 3.08 2.91
Plant & Machine 1 2Operatives
.99 .49 1.37 2.75 1.44 2.66 2.07 2.71 2.85 3.20 2.05 2.58
Elementary 1.50 2.46 0.91 2.23 1.15 2.27 2.08 2.82 2.33 2.68 2.25 2.60
Oaveragranges from 0 (‘not at all important/does not apply’) to 4 (‘essential’).
48

49
Table 3.10 Distribution of Generic Skills by Industry, 2006
Industry
Lite
racy
Phys
ical
Num
ber
nica
Ko ce g
Co
atio
Co
ao
ol
Che
ckin
g
Aes
thet
ic
Emot
iona
l
Tech
now
-HIn
fluen
Plan
nin
C
lient
mm
unic
Hor
izon
tal
mm
unic
blem
-S
l w
n
tion
ving
Pr
Ma uring 2.33 2.19 2.10 2.91 1.94 2.92 2.36 3.05 3.21 3.40 2.10 2.62 nufact
Co 2.26 2.13 3.09 1.76 3.11 2.54 2.76 3.23 3.38 2.67 nstruction 2.76 2.38
Wholesale & Re il 2.10 1.88 2.57 1.73 2.84 3.08 3.04 2.85 3.15 2.85 ta 2.04 2.84
HoRestaurants 1.70 2.16 1.60 2.45 1.54 2.71 2.84 3.06 2.49 2.95 2.86 3.00 tels &
TraStorage 2.19 1.51 2.45 1.67 2.78 2.49 2.80 2.75 3.05 2.79 nsport & 2.03 2.52
Finance 2.78 0.76 2.54 2.28 2.25 3.09 2.98 3.27 3.07 3.48 2.88 2.84
ReBusiness Ser 2.62 1.19 2.15 2.28 2.16 3.17 2.66 3.04 3.07 3.30 2.65 2.74 al Estate &
vices PuAdminis 2.79 1.62 2.23 2.18 3.13 2.44 3.33 2.97 3.27 2.99 blic
tration 1.46 2.72
Education 2.94 2.00 2.30 2.65 3.41 2.60 3.41 2.91 3.12 3.32 1.65 2.85
He cial Wo 2.86 2.02 1.46 2.69 2.27 3.19 2.8 3.41 3.01 3.28 2.92 3.39 alth & So
rk Pe s 2.20 2.15 1.55 2.73 1.96 3.13 2.87 3.08 3.04 3.23 2.97 3.18 rsonal Service
Note: 1. Industries are classified by SIC92; only those with sample size above 100 are shown. Th lls indices e averag es of the item in each derived the 006 data. The item scale ranges from 0 (‘not at all important/does not apply’) to 4 (‘ess
e generic ski are th e scor s index, from 2
ential’).

Table 3.11 Distribution of Generic Skills by Region, 2006
acy
Ph
ysic
al
N
umbe
r
Tech
nica
l K
now
-How
In
fluen
c
Plan
ning
Clie
nt
Com
mun
icat
ion
Hor
izon
tal
mm
unon
l
lvin
g
Che
ckin
g
Aes
thet
ic
Emot
iona
l
Lite
r
e
Co
icat
iPr
obem
-So
North East 2.45 2.01 1.56 2.68 2.03 3.04 2.75 3.17 3.09 3.14 2.77 2.96
North West 1.91 2.72 1.98 3.07 2.66 3.22 3.04 3.30 2.65 2.95 2.50 2.00
Yorkshire And The umber 1.84 2.54 2.02 3.06 2.67 3.07 3.03 3.26 2.67 2.96 2.48 1.88 H
E
ast Midlands 2.42 1.96 3.04 2.72 3.14 3.03 3.20 2.67 2.89 2.02 1.90 2.67
W
est Midlands 2.62 2.03 2.95 2.64 3.09 3.02 3.27 2.67 2.88 2.45 1.96 1.86
E
ast of England 3.08 2.65 3.12 3.05 3.33 2.57 2.95 2.55 1.77 1.92 2.52 2.10
L
ondon 2 1.57 1.93 2.37 2.23 3.18 2.75 3.19 2.91 3.23 2.63 2.99 2.6
S
outh East 2.49 1.76 1.89 2.53 2.09 3.12 2.69 3.15 3.01 3.23 2.69 2.94
S
outh West 2.42 1.89 1.93 2.53 2.52 2.92 2.00 3.02 2.63 3.06 2.99 3.21
W
ales 2.57 2.95 2.57 1.98 1.81 2.55 2.09 3.05 2.59 3.15 2.95 3.29
S
cotland 1.68 2.5 3.17 2.68 2.89 2.35 2.01 8 1.91 2.95 2.53 3.04 2.90
Note: 1. The generic average scores of the items in each index, derived from the 2006 data. The item sca not apply’) to 4 (‘essential’)2. Region of residence.
skills indices are the le ranges from 0 (‘not at all important/does
.
50

Table 3.12 Generic Management Skills, 2006
Coaching Staff
Developing St
Motivating aff
Resource Control
Strategic Thinking aff Careers St
hom Each Percentage for WActivity is ‘Very Important’ or ‘Essential’
75.3 57.6 86.2 74.4 41.5 All1
Male Employees
Managers 80.6 66 89.6 82.9 52.3 Supervisors 67.7 51.4 81.4 65.2 31.6
Female Employees
Managers 87.9 70.5 89.9 82.1 47.7 Supervisors 73.7 50.7 88.1 68.4 26
Female Full-Time Employees
Managers 88.1 72 90.4 80.2 50.1 Supervisors 74.1 51.9 89.6 71.1 26.1
Female Part-time Employees
Managers 87.3 64.6 88.2 89.9 38.2 Supervisors 72.8 47.7 84.5 61.8 25.8
Employees 75.9 57.8 86.6 73.4 38.3
55.7 81.8 87 81.8 Self-employed 68.5
Note: 1. The base for whom these questions were asked comprised 1,871 employees and 158 self-employed workers who had others working for them.
51

52
Table 3.13 Correlation Coefficients Between Skill Measures
Lear
ning
Lite
racy
Phys
ical
Num
ber
Tech
nica
l K
now
-How
Influ
ence
Plan
ning
Clie
nt
Com
mun
icat
ion
Hor
izon
tal
Com
mun
icat
ion
Prob
lem
-Sol
ving
Com
putin
g
Qua
lific
atio
n H
eld
Qua
lific
atio
n R
equi
rem
ent
Trai
ning
R
equi
rem
ent
Req
uire
men
t
Che
ckin
g
Man
agem
ent
Aes
thet
ic
Emot
iona
l
Qual. Requ 1 Train Requ 1 0.340 Learn Requ .328 1 0.407 0
Literacy 0.292 1 0.445 0.318 Physical -0.025 -0.119 1 -0.270 -0.060 Number 0.255 0.426 -0.099 1 0.343 0.184 Tech KH 0.171 0.189 0.611 0.203 1 0.028 0.112 Influence 0.364 0.724 -0.119 0.434 0.182 1 0.512 0.329
Planning 0.308 0.538 -0.043 0.335 0.195 0.584 1 0.396 0.253
Client Com 0.157 0.390 0.034 0.275 0.389 0.495 0.389 1 m 0.162 0.153
Horiz Comm 0.138 0.412 -0.027 0.182 0.143 0.492 0.268 0.292 1 0.233 0.202
Problem-Sol 0.265 0.430 0.104 0.344 0.420 0.476 0.427 0.328 0.28 1 0.248 0.188
Checking 0.193 0.417 0.051 0.320 0.351 0.360 0.378 0.283 0.27 0.614 0.200 0.150 1
Managemen 0.086 0.389 0.038 0.234 0.097 0.614 0.426 0.380 0.39 0.274 t 0.142 0.110 0.201 1
Computing 0.248 0.435 -0.389 0.445 0.019 0.460 0.333 0.209 0.24 0.307 0.474 0.232 0.268 0.128 1
Emotional 0.100 0.395 0.052 0.107 0.131 0.403 0.396 0.403 0.380 0.235 0 0.145 0.179 0.238 0.442 .093 1 Aesthetic 0.091 0.399 -0.010 0.176 0.131 0.392 0.359 0.489 0.268 0.195 0 1 .141 0.5020.226 0.321 0.151 0.158
Qual. Held 0.289 0.356 -0.282 0.284 -0.046 0.438 0.341 0.161 0.19 0.167 0 138 1 0.141 0.1230.606 0.279 .470 0.133 0.

CHAPTER 4 SKILL TRENDS
4.1 Introduction
This chapter examines how skills have changed over time. To do this, we draw on data collected on broad skills in five nationally representative sample surveys: the 1986 Social Change and Economic Life Initiative survey (SCELI); the 1992 Employment in Britain survey (EIB); the 1997 Skills Survey; the 2001 Skills Survey; and the 2006 Skills Survey.11 They surveyed 4047, 3855, 2467, 4470 and 4568 individuals in employment aged 20-60 years old respectively. The 2006 survey focused on the 20-65 year old age group, hence yielding a larger sample base of 4800 respondents from which to present 2006 data (such as those presented in the preceding Chapter).
Each survey asked some identical questions of its respondents. These included the qualifications respondents would require to get their current job and their importance in carrying out the work, the length of training time required, and the period of learning time needed to do the job well. These variables have been defined and discussed in Chapter 3. By comparing the responses given we are able to track trends in broad skills over the last two decades. These results are outlined in Section 4.2. Section 4.3 investigates further the issue of mismatch between the qualifications that workers hold and the qualifications actu
do their jobs, and considers how the extent of this mismatch has changed
he 1997, 2001 and 2006 Skills Surveys also collected data on the detailed skills used by individuals at work. From this information, we are able to measure how job demands have
, albeit over a nine-year period from 1997 to 2006. These results are ons 4.6 and 4.7 consider how the learning
quirements and management skills of jobs have changed.
ally required to get and over time.
T
changed over timepresented in Sections 4.4 and 4.5. Sectire
4.2 Broad Skills Trends, 1986-2006
Table 4.1 outlines the distribution of broad skills at each of the five data points. The overall trend is an increase in the levels of required skill over the last two decades. In 1986, a fifth of jobs (20%) required a level 4 on entry, now the figure is three out of ten (30%). At the other end of the scale, around a quarter (28%) of today’s jobs do not require any qualification to enter, but in 1986 the proportion was approaching two-fifths (38%). Similarly, the time taken to train for jobs has lengthened and so too has the time it takes to learn to do jobs well. For example, 22% of jobs in 1986 took longer than two years to train for compared to 30% of
11 Whereas the 1992, 1997, 2001 and 2006 surveys were designed to be representative, the 1986 SCELI survey focussed on six areas of Britain with a range of social and economic characteristics. Nevertheless, analysis has shown that the SCELI sample was closely representative of Britain as a whole according to key socio-economic criteria (Green et al., 2000).
53

jobs two decades later. At the other end of the scale, jobs comprising skills that can be picked up very quickly (less than one month) have become less prevalent, falling from 27% in 1986 to 19% in 2006. This trend is confirmed by a strong perception among respondents that the skills they use at work have increased – in all five surveys over half of the sample reported that their skills had increased over the previous five years. In 2006, the figure was 56%.
The overall upward trajectory in skills is illustrated in Figure 4.1a which charts the movement of the three broad skills indices. The Required Qualification Index rose from 1.71 in 1986 to 2.09 twenty years later. Similar rises were recorded for the time it takes to train for jobs – rising from an index of 2.01 in 1986 to 2.59 in 2006 – and the time required to learn to do a job well – rising from 3.30 to 3.60 over the same period.
Figure 4.1a Trends in Broad Skill Indices, 1986-2006
0
0.5
1
1.5
2
2.5
3
3.5
4
1986 1992 1997 2001 2006
Scor
e
Required Qualification IndexTraining Time IndexLearning Time Index
Source: Table 4.1.
Figures 4.1b, 4.1c and 4.1d display some of the raw data underlying the changes in these indices. Figure 4.1b shows the rising proportion of jobs requiring level 4 or above qualifications for entry over the last two decades along with falling proportion of jobs that require no qualifications at all. Figures 4.1c and 4.1d complete the picture by showing the lengthening (and also shortening) training and learning times of jobs in 2006 compared to twenty years ago.
54

Figure 4.1b Trends in Broad Skills: Required Highest Qualification, 1986-2006
0
5
10
15
20
25
30
35
40
45
1986 1992 1997 2001 2006
Level 4+No qualification
Source: Table 4.1.
Figure 4.1c Trends in Broad Skills: Training Time,1986-2006
60
70
10
20
30
40
50
> 2 years< 3 months
01986 1992 1997 2001 2006
Source: Table 4.1.
55

Figure 4.1d Trends in Broad Skills: Learning Time,1986-2006
30
0
25
1986 1992 1997 2001 2006
20
5
10
15
> 2 years< 1 month
Source: Table 4.1.
Table 4.2 presents the movement in the percentages and scores over two time periods: between 1986 and 2006; and the more recent five year period spanning the years 2001 and 2006. Comparison of these two columns of data suggests that the rate of upskilling as measured by the broad skills indices is slowing down. For example, only one of the three broad skill measures has grown significantly between 2001 and 2006. Even then, the statistically significant increase in the Training Time Index is largely the consequence of a significant dip in 2001 – comparison of 1997 and 2006 on this indicator suggests little change over the last nine years. It is of particular note that the rise in the Required Qualification Index has come to a halt in 2006. In fact, for the first time the proportion of jobs that require no qualifications for entry has actually risen, while those requiring level 4 qualifications has stagnated at around 30%. However, these higher level qualifications may be becoming more differentiated as they become more widely held. In 2001 and 2006 Skill Survey respondents were presented with a list of qualifications that differentiated Masters/PhDs and undergraduate degrees. Although only over a short period, the pattern of responses suggests that a greater proportion of jobs now require Masters or PhDs to enter than five years ago – rising from 2.6% in 2001 to 3.3% in 2006 (significant p<0.10).
It is also the case that the summary of the three broad skill measures (see panel d, Table 4.1) shows a steady, if shallowing, rise over the last twenty years. Furthermore, there may be other sources of learning and skill acquisition that are not captured by our broad skill indicators and therefore skill development may be taking place through means other than qualifications and training (see Section 4.6).
56

Table 4.3 also shows how the distribution of broad skills has change12
d over time according to e gender and status of the jobholder. The skill level of women’s jobs has risen faster than en’s, thereby serving to narrow the gap between the skills of men’s and women’s jobs.
rs, hence serving to narrow the (albeit still significant) equalities that exist between women who are in part-time and full-time jobs. This pattern
of change is shown in Figure 4.2 with the part-time columns exceeding the full-time columns for each of the broad skills indices, hence illustrating the greater pace of skill change among
thmThis change applies on each measure, over the two decades and the more recent five year period. An example underlying the change in the indices is the decline over 1986 to 2006 in the proportion of jobs requiring no qualifications: from 48% to 27% for women, and from 31% to 28% for men. Thus, on this evidence the gender gap for work skills has virtually disappeared. The narrowing of the gap can also be seen from Table 4.3 with all the rows for women outstripping those for men across the last two decades and the more recent five year period.
Furthermore, closer inspection reveals that female part-timers have, on the whole, been the main beneficiaries of these trends. The changes in each of the three indices have been greatest for this group of workein
women working part-time as opposed to full-time.
Figure 4.2 The Pattern of Change in Broad Skills Among Women Workers, 1986-2006
0
0.2
0.4
0.6
0.8
1
1.2
1.4
1.6
1986-2006 2001-2006 1986-2006 2001-2006 1986-2006 2001-2006
Change in RequiredQualification Index
Change in Training Time Index Change in Learning Time Index
Female Full-timersFemale Part-timers
Source: Table 4.3.
12 Part-time jobs are self-defined for all of the surveys, except the 1992 survey where an hours measure is used. In this case, those reporting working less than 30 hours a week are regarded as part-time and those working 30 hours or more are deemed to be full-timers.
57

Further analysis (not shown) suggests that in the first decade under study (1986-1997), the upskilling trends affected female full-timers and female part-timers more or less equally, with no clear pattern to suggest that skills gap between the two groups was narrowing. However, the 1997-2006 period saw female part-timers benefiting most from the overall increase in skills. During this period female part-timers, for example, saw the three broad skills indices significantly rise in five out of six data point (1997-2001 and 2001-2006) comparisons compared to two out of six for their full-time counterparts.
For reasons of equality of opportunity, it is also important to assess whether overall skill change is spread evenly throughout all occupation groups, or whether it is confined to some groups instead of others. Table 4.4 provides the answers. In short, the picture is mixed with
o one occupational group outperforming the others. Nevertheless, this occupational analysis provides further confirmation that the rise in skills is beginning to plateau. The 1986-2006 period saw the Required Qualification Index increase significantly for five out of nine occupational groups, the Training Time Index for six occupations and the Learning Time Index rose significantly for five out of nine job categories. In total, the data suggest that skills rose significantly in 16 out of 27 cases during 1986-2006 compared to just ten cases in 2001-2006 period. This plateauing of skill change appears to have affected all occupations.
Similarly, the changes in broad skills recorded nationally have been felt fairly evenly across industrial groupings. Over the entire period eight out of eleven industrial groups have seen their skills rise significantly on two out of three measures. The exceptions are ‘Transport and Storage’, ‘Wholesale and Retail’ and ‘Construction’ (however, this sector recorded a significant rise in the Learning Time Index). Table 4.5 presents results by industrial sector for the past two decades and the more recent five year period. While no single industry exhibits a distinctly different pattern from the economy as a whole, variation by industry has declined time. The number of industrial groups reporting at least one significant skill change according to our three measures between 1986 and 2006 was ten. Comparisons between 2001 and 2006 suggest this has fallen to four. These tend to suggest that the upskilling that has taken place over the last five years has been more evenly spread by industry than in the past.
this section, we investigate how the differences between the aggregate numbers of jobs levels, and the supply of
ualifications held have changed over time. Secondly, we examine the match between ualifications held and required at the level of the individual.
n
4.3 Trends in Qualifications Held and Required, 1986-2006
Inrequiring qualifications (as perceived by jobholders) at various qq
58

4.3.1 Qualifications Required and Supplied: Aggregate Differences
First, we examine how the aggregate pattern of supply and demand for qualifications has changed over time. We repeat the analysis for 2006 – as in the previous chapter (shown in Figure 3.2 and Table 3.6) – for the earlier years in the data series. ‘‘Demand’’ refers to the number of jobs that are perceived by jobholders to require various levels of qualifications for job entry, while supply is the number in the economically active population with a highest qualification at each level. For comparability, the 2006 data presented in this chapter are restricted to the 20-60 year old age group, hence the small differences in the data presented here as opposed to Chapter 3. The estimates, given in Table 4.6, are illustrated in Figure 4.3 with positive columns above the line suggesting an oversupply of people over jobs and vice versa for columns below the line.13
Figure 4.3 Trends in the Balance of Supply and Demand for Qualifications,1986-2006
-2000
-1000
0
1000
2000
3000
4000
1986 1992 1997 2001 2006
y M
inus
Dem
and
(000
s)
-6000
-5000
-4000
-3000
Supp
l
Level 4+Level 3Level 2Level 1No qualifications
obs that do not require any qualifications rose, but because the number of people
Source: Table 4.6. The excess supply (+) or demand (-) at each level is the difference between the number of people holding highest qualifications at that level and the number of jobs with highest qualifications requirements at that level plus an estimate of the number of vacancies at each of these qualification levels.
The phenomenon of large excess numbers of jobs for people with no qualifications requirements has emerged over the last fourteen years. This excess arose, not because the numbers of jholding no qualifications fell substantially. The number of people with no qualifications has 13 Table 4.6 shows only 2.2 million with no qualifications in 2006. Note that this figure refers to workers in employment aged 20 to 65, and is more restrictive therefore than the basis for the 5 million figure of non-qualified people of working age in the UK referred to above on page 16.
59

fallen sharply by 5.5 million between 1986 and 2006 (see Table 4.6), reflecting successful expansion of the education system and the growth of qualifications over this period. Meanwhile, over the same period the British economy has seen the number of jobs requiring no qualifications for entry fall by 1.2 million. Comparing the 2006 and 2001 figures the ongoing reductions in the ranks of the non-qualified people stand in contrast to a small rise in the number of jobs requiring no qualifications on entry. These jobs are not, it should be remembered, all necessarily low-skilled, as many of them may also require skills picked up in ways other than through formal education. In 2006, 28% of employed people were in the no-qualifications group (Table 4.1), but among these 24% had received either a total of more than a year’s cumulative training, or were in j ore than a year’s learning time to do well. Low-qualification jobs may sometimes also utilise academic skills which are nevertheless not seen as a formal requirement for recruitment.
s that the differences between the supply of qualifications at levels 1, 2 nd 3 and the numbers of jobs at these levels have fluctuated over the years. However, over
obs requiring m
Figure 4.3 also showathe whole period the differences at levels 2 and 3 are still higher in 2006 than in 1986, even though they have been falling at level 3 since 1997. The most notable change in recent years has taken place at graduate level (see Figure 4.4). The difference between the supply of graduates and the numbers of jobs requiring graduates for entry into them, standing at 1.1 million people in 2006, was less than 300,000 in 1986. This change is largely the result of the supply of graduates outpacing the growth of jobs where degrees are perceived by jobholders to be required for entry. Despite this fact, part of the expansion of graduates may have been absorbed into the labour market without an increase in the under-utilisation of skills, because the new graduates are likely to possess skills not necessarily captured in employers’ qualification requirements. The extent to which the new skills resulting from the expanded population of graduates are being successfully absorbed and utilised in jobs remains a matter for ongoing research (see Chapter 9).
Figure 4.4 Trends in the Balance of Supply and Demand for Degrees, 1986-2006
1200
(000
s)
400
600
800
1000
umbe
r of D
egre
e-R
equi
red
Jobs
-200
De
0
200
1986 1992 1997 2001 2006gree
sin
us N
Hel
d M
60

Source: Table 4.6. The excess supply (+) or demand (-) is the difference between the number of graduates and the number of graduate-level jobs plus an estimate of the number of
ver, the differences just noted between the
to get the job they are oing. From this we can calculate whether the respondent has a higher or lower level of ualification than is required to get their current job.
In academic literature, these differences are typically referred to as ‘‘overeducation’’ or ‘‘undereducation’’. In the Report on the 2001 Skills Survey the terms ‘‘over-qualification’’ and ‘‘under-qualification’’ were used. These terms should be regarded as technical terms, a short-hand for the individual differences being described. Whatever term is used, it should be noted that the term ‘‘over-qualified’’ does not
graduate-level vacancies.
4.3.2 Workers Who Are ‘‘Over-Qualified’’ or ‘‘Under-Qualified’’
Since qualifications are only one measure of skill, it is not surprising to find that there are many people in employment where the person’s own qualifications are not at the same level as those currently required for getting the job. Such a finding is common in industrialised countries (see McIntosh, 2005). Workers might have a higher or a lower qualification level than that required for getting the job. Moreoaggregate supplies of workers and numbers of jobs requiring qualifications at each level are an additional reason to expect that there will be many people in the economy who have apparently too high or too low qualification levels for their jobs. To obtain, therefore, a fuller picture of the utilisation of qualifications in the economy, we investigate the difference (if any) between each individual’s qualifications and their job’s requirements, and how this difference has changed over time. For each respondent to the surveys, we compare their own qualification levels with the qualification levels someone would needdq
in itself imply that a person has received too much education, or that his/her skills are under-utilised. First, the qualifications may yet be necessary for a job that the person will do in the future. Some ‘‘over-qualified’’ people may be currently constrained by their domestic circumstances from taking a job that would better use their qualifications, but would still hope to use the qualification in the future. Second, there are in any case many wider benefits of education, that are not just to do with their jobs. The cultural and social benefits of education, both to the person being educated and to others in society, are hard or impossible to quantify, but should not be ignored. Third, qualifications can vary substantially in the skills that they stand for, even within the same level and type of qualification. Indeed, as we have noted in Section 3.2.1, employers are frequently concerned with other attributes besides qualifications when assessing whether job applicants have the right skills for jobs. Previous research has indicated that there is a correlation between being ‘‘over-qualified’’ in the sense defined here and being ‘‘over-skilled’’, in the sense that the jobholder perceives he has skills that are not being fully utilised at work (Green and McIntosh, 2007). However, the correlation is very far from perfect, and there are many cases of workers who are ‘‘over-qualified’’ but do not perceive themselves to be under-utilising skills.
re ‘‘under-qualified’’, this does not imply that they are under-skilled for e job. Rather, it is likely that they have increased their skills in other ways as job demands
have changed. Any new person undertaking the job might require now to have a
Equally, if people ath
61

qualification. Moreover, some older workers may have professional or vocational qualifications that have since been formalised as higher academic qualifications.
Nevertheless, the fact that the qualifications a person holds might not match the job requirements does matter. It has been shown in a number of studies (two examples are Green and McIntosh, 2007; Allen and van der Welden, 2001) that people in jobs requiring less education than they themselves have experienced are more likely to be underutilising their kills than those whose qualifications match their jobs, and to receive lower pay and enjoy
opposite is the case for those who are technically nging extent to which people’s qualifications are matched to
eir job requirements can thus be regarded as a useful indicator of workers’ experiences in
almost five
sless job satisfaction; the‘‘under-qualified’’. The chaththeir jobs.
In previous analyses it was observed that the prevalence of ‘‘over-qualified’’ workers in Britain, while increasing in the 1970s and early 1980s, had remained fairly stable in the ensuing period until 1997. During the 1986-1997 period, the ‘‘over-qualification’’ rate was rising but only relatively slowly and was around 30%. However, according to the 2001 Skills Survey it rose markedly around the turn of the century (Green et al., 2002; Felstead et al., 2002). Table 4.7 brings the trend analysis of ‘‘over-qualification’’ and ‘‘under-qualification’’ up to date. The 2006 findings suggest that ‘‘over-qualification’’ has continued to grow throughout the early years of the new century – since 2001 it has grown bypercentage points in as many years. Furthermore, this growth has been statistically significant and now means that two out of every five workers (40%) are in jobs for which they are ‘‘over-qualified’’, in the sense that the qualification level they perceive is required to get the job is lower than the qualification level that they themselves hold ‘‘’’(see Figure 4.5).
62

Figure 4.5 Percentage of Workers 'Over-Qualified' and 'Under-Qualified' for Their Jobs, 1986-2006
45
10
15
20
25
30
35
40
0
5
1986 1992 1997 2001 2006
Over-QualifiedUnder-Qualified
Source: Table 4.7.
Looking over the 1986-2006 period a total of ten percentage points have been added to the e trends have had greatest impact on those holding level 4
xample, while one-fifth (20%) of graduates were ‘‘over-qualified’ in 1986, three-tenths (30%) of them were in jobs that did not require a degree in 2006. Furthermore, three-quarters of this increase has taken place in the last five years. It is also notable that in 2006 around half of those qualified to levels 3 (51%) and 2 (49%) are in jobs that do not require these qualifications for entry compared to around a third (35%) of those with level 4 or above qualifications. Being ‘over-qualified’, therefore, appears to be concentrated among those holding levels 3 and 2 qualifications.
Table 4.7 also reports on the trends in ‘under-qualification’, that is, people whose highest qualification falls short of the level required to get the job they currently occupy. In 1986, the ‘under-qualification’ rate was around 18%, and since then it has fallen significantly and is now 14%. However, the downward movement over the last five years has been both modest and statistically insignificant. As expected, the prevalence of ‘under-qualified’ workers is greater amongst older workers. The data indicates that in 2006 only about 8% of workers in their 20s are ‘under-qualified’, compared with 19% of those in their 50s and 16% of those in their 60s.
Taking the proportions of ‘over-qualified’ and ‘under-qualified’ workers together, and subtracting from 100%, it may also be noted that the proportion of workers whose qualification held is at the same level as the requirements of the job they do was 53% in 1986. Twenty years later the figure has since fallen somewhat to 47%. This loose
‘‘over-qualification’’ rate. Thesqualifications. For e
63

qualifications match is consistent with the evidence given in Section 3.2.1, which showed that qualifications are often not the most important factor in recruitment to jobs, especially among jobs requiring lower level qualifications.
4.3.3 Credentialism
It is sometimes suggested that, while qualifications may be needed in order to get a job, they may not have been necessary in order to perform the job. This might be because the qualification acts as a signal of general ability, but that the skills acquired in gaining the qualification are not themselves needed to do the job.
The usefulness of required qualifications for job performance, as opposed to recruitment, can be examined by analysing the highest qualification required data alongside the responses to the question ‘How necessary do you think it is to possess those qualifications to do your job competently?’ The changing responses over time can also be used to assess the extent to which rising qualification requirements – as indicated in Table 4.1 – are associated with credentialism on the part of employers. By ‘credentialism’ we mean a situation in which employers raise the qualification requirements for jobs even though the skills of the jobs themselves have not risen commensurately. If, at any given qualification level, fewer
e say that the qualifications requirements are necessary, we take this as entialism has taken place.
requiring level 4 or above.
respondents over timan indicator that cred
Overall, the results outlined in Table 4.8 and illustrated in Figure 4.6 provide reassurance that the qualifications that jobs require are useful in carrying out the work. In general, around three-quarters of respondents say that their qualifications are ‘essential’ or ‘fairly necessary’ to do the job. Relatively few say that they are ‘totally unnecessary’. Interestingly, those in jobs with lower qualification requirements are more likely to say that today’s entry qualifications are ‘totally unnecessary’ to do the job – 14% of those in jobs requiring level 1 qualifications as opposed to 9% of those
64

Figure 4.6 Trends in Credentialism: Percentage Reporting that Their Qualifications Are Essential or Fairly Necessary to Do the Job, 1986-2006
70
80
90
1986199220012006
0
10
20
30
40
50
60
Level 4+ Level 3 Level 2 Level 1
Source: Table 4.8.
Nevertheless, at levels 4, 3 and 1 the extent to which the required qualifications for entry are actually needed to do the job has fallen significantly over the last two decades. Table 4.8 also presents a Qualifications Necessity Index which captures the entire range of responses with a high score indicating a higher level of necessity and a low score indicating the reverse. While
ere is no evidence of credentialism for jobs requiring qualifications at level 2, there is vidence of a small extent of credentialism at all other levels.
The results of this analysis are presented in Table 4.9. This shows a gradual increase in the ‘use’ at work of level 3 and 4 qualifications. Thus, the proportion of jobs where a high level
the
4.3.4 Qualifications ‘Used’
To what extent does this evidence of credentialism at levels 1, 3 and 4 undermine our earlier findings about skill rises? To investigate this question we examine the percentage of each sample that ‘used’ qualifications at the various levels. We define the qualification level that a job ‘uses’ as follows. If the required qualifications are reported as ‘fairly necessary’ or ‘essential’ then that is the level of qualification that is ‘used’. But if the respondent indicates that a qualification is unnecessary for doing the job, we take the next highest qualification level to be the one used in the job. In this way, we can make an estimate of the combined effect that the rising requirement for qualifications and growing levels of credentialism have on our finding that work skills in Britain have risen over the last twenty years.
65

qualification (level 4 or above) is both required to get the job and deemed to be ‘fairly necessary’ or ‘essential’ to do the job competently, rose from 16% in 1986 to 22% in 2006. The proportion of jobs ‘using’ level 3 qualifications rose from 16% to 19% over the same period. The proportion of jobs which did not ‘use’ any qualifications fell from 40% to 31%. These three changes are statistically significant and therefore imply that even though credentialism has occurred to some extent over the last two decades, this has been more than compensated for by the increased qualification requirements of jobs. Thus, the evidence of
eric Skills, 1997-2006
than computing skills which are to be discussed in the next chapter). In is Section, the question to be examined is whether, as some have claimed, generic skills are
1997 through to 2006. We are thus in a position to investigate
pparent that the
credentialism does not nullify our earlier conclusion that, in line with our other findings, the skills demanded at work have increased markedly in Britain over the last twenty years.
4.4 Changes in Gen
In Chapter 3 we examined the distribution over jobs, occupations, and industries, of several generic skills (other thbecoming more important or more widespread.
In the previous survey it was found that there had been a modest yet statistically significant increase in all but one of the generic skills, the exception being physical skills over the 1997 to 2001 period (Felstead et al., 2002: 51-3). This short period of change, it was surmised, was a continuation of an earlier rise before 1997; however, the earlier rise had had to be inferred from individuals’ backward-looking estimates of how the skills had changed in their own jobs, rather than the preferable method of comparing responses to identical questions in successive representative surveys. Here, we investigate the extent to which required generic skills have continued to rise in importance in British jobs, and have the advantage of a longer period to inspect change, fromfor the first time, using the preferred method, whether there has been a substantive long-term rise in the use of generic skills in jobs.
Table 4.10 presents estimates of the mean skill levels used by all those in employment at each of the three data points, 1997, 2001 and 2006, and in the fourth row the change over the whole period. It can be seen that, with the exception of physical skills, for every other type of generic skill there has been a significant increase over the whole period. In most domains, the increase in generic skills is also statistically significant over the recent period 2001-2006, but somewhat less in magnitude than occurred over 1997 to 2001. Influence skills, literacy skills and planning skills stand out as the domains showing the greatest increase. For some skills there has been no further increase in importance over the 2001-2006 period – these are number skills, technical know-how, and problem-solving skills; while physical skills were unchanged in both sub-periods.
In most skill domains, the point estimate of the change in skill levels is greater for females than for males (see Figure 4.7a). On closer inspection, however, it is abiggest difference is among females between part-timers and full-timers: in every case the rise in skills is substantially faster for part-timers (see Figure 4.7b). The rise for female full-timers is in several domains close to that for males. Thus the pattern of change is
66

consistent with what has already been reported in respect of broad skills, a tendency for female part-timers to be catching up towards female full-timers and males.
Figure 4.7a Trends in Generic Skills by Gender, 1997-2006
-
0.25
0.35
0.3
0.05Lite
racy
Physi
cal
Numbe
r
Techn
ical K
now-H
ow
Influe
nce
Plann
ing
Client
Commun
icatio
0
0.05
0.1
0.15
0.2
n
Horizo
ntal C
ommun
icatio
n
Proble
m-Solvi
ng
Check
ing
Manag
emen
t
MalesFemales
rce: Table 4.10. Sou
Figure 4.7b Trends in Generic Skills by Full-Time/Part-Time Status, 1997-2006
005
Literac
y
Physi
cal
Numbe
r
al Kno
w-How
nflue
nce
Plann
ing
munica
tion
munica
tion
m-Solvi
ng
Check
ing
agem
ent
0.
0.
0.0.
0.
0.
I
Com Com ob
le Man
350.445
0.5
0.115
0.2253
Techn
ic
Client
Horizo
ntal Pr
Female Full-timers Females Part-timers
rce: Table 4.10. Sou
67

Theocc lt
chachagen
Thuandis ndec‘Ad al’ occupations, and in ‘Skilled Trades’. Technical Know-how
‘Prbotwobut horizontal communication skills were among
expSer f planning skills was also concentrated mainly in lower-status occupations, especially ‘Personal Services’ and ‘Plant and Machine Operatives’. The increase in client communication skills was focused on ‘Sales’ occupations.
In sum, the rises in generic skills over the past nine years have been largely concentrated among the lower-status occupational groups. Though higher-status groups, such as ‘Managers’ and ‘Professionals’, unsurprisingly retain their lead in the usage of skills (as the analysis in Chapter 3 shows), there has been some narrowing of the gap between occupations. ‘Professional’ occupations have experienced either a stable usage of skills or in some domains a deskilling, while overall managers’ use of skills has risen little, with the exception of literacy skills and horizontal communication skills. By contrast, each of the lower occupational groups are utilising more generic skills in multiple domains.
The pattern of skill change across industries is presented in Table 4.12. It may be observed, again, that in the large majority of cases the point estimate of change is positive, and in no case is there a statistically significant fall in the use of generic skills. However, the substantial and statistically significant increases in generic skills have been concentrated in some specific industries. Most notably, generic skill requirements have increased in 8 separate domains in ‘Health and Social Work’. ‘Personal Services’ and ‘Education’ also record several increases (in 4 and 3 domains respectively). The increases are not, however, confined to the service sector. Both ‘Manufacturing’ industry and ‘Wholesale and Retail’ record skill increases in 4 domains each. By contrast, ‘Construction’ and ‘Hotels and Restaurants’ are two industries where there have been no significant increases in generic skills requirements in any domains. In sum, the skill changes taking place at work appear not to be changes across all industries and sectors, but to be concentrated in particular spheres. Previous literature has shown that skills increases over the 1980s and 1990s were, in a
pattern of change in different occupational groups is presented in Table 4.11. For many upations, the majority of the skill changes are statistically insignificant. This resu
derives largely from the fact that the numbers of observations in each cell can be quite small; hence small changes in skills cannot be measured precisely enough to be sure that any
nge has occurred at all. Nevertheless it is of interest to note that the point estimate of nge is positive in the large majority of cases. The table points to where the changes in eric skills have been concentrated.
s, physical skills have increased in importance in ‘Sales’ and ‘Elementary Occupations’ among ‘Associate Professionals’, but have diminished among ‘Managers’. The net effect o significant change overall. The overall increase in number skills comes, despite a line in the use of number skills by ‘Professionals’, from large increases among ministrative and Secretari
increased substantially in ‘Personal Service’ and ‘Sales’ occupations, and in ‘Elementary’ occupations. Influence skills increased among most occupations with the exception of
ofessional’ occupations. Indeed, it is notable that over this period there was a lowering of h problem-solving and number skills in ‘Professional’ occupations. ‘Professional’ rkers’ skills were required to increase only in respect of horizontal communication skills; even there the largest increases in
lower-status jobs, namely ‘Sales’ and ‘Elementary’ occupations. The latter two groups also erienced the largest increases in problem-solving skills and, together with ‘Personal vice’ occupations, the largest increases in checking skills. The overall increase in use o
68

number of modern e ge being ‘skill-biased’, where the term ‘technological change’ is interpreted in a broad sense to cover the introduction of either new techniques or new forms of work organisation (Machin and Van Reenen, 1998). Further work would be necessary to establish the exten spread of generic skills increas s industries observed uld be a ed for in of technical or organisational changes which may differ in their speed and depth across industries.
, 1997-2 06
s analysis has shown the patterns o nge in ge t is also inform ore detail at changes in the activities whicth ces. To summarise the change in each particular skil first calc the a e across the sample f ch skill in 4 (‘ess l’) to 0 ‘not at all importan not app e then subtract the 1997 skill average the 2006 average. Table 4.13 gives the results of this calcu
nge betwe n 2001 and 2 6. To gain a idea of how s stantial the implied are, consider tha ange in any index of 0.1 is roughly equ t to, for le, centage point ris the proportion saying tha is ‘ l’ in their jobs,
by a 10 perc point fall in the proportion for whom the skill is ‘very t’.
e largest increa e im nce of co ing skills idered in detail in e next chapter. Also not ble is that th e have been substantial increases in writing long
g short documents, g speech d presen s, persuad nd g other people, i tructing, ana sing complex problems in depth – in other words,
ngredients compo ill index that we have labelled influence skills. ist knowledge or understanding, and knowledge of the organisation, ingredients of
hat we have called ‘technical know-how’, have also both increased substantially.
f the components of physical skills have increased significantly over the operation of ipment/m sed in imno increase in the importance of paying attention tail, and a ervice.
Factor ded to obs and uiremen Learn a lp thers, 1992-2006
in Chapter 3, fications are not the only factor in ge jobs (see on .2.1). In 2001 and 2006 spondents were asked to select from a list of options attributes
ould need the typ ob you ow’. Mu response the uestion were allowed. In 006 around t o-thirds (69% ous experience of
7% cited ivation’ der half (46%) mentioned qualifications of one sort or another as an important factor in securing jobs. Respondents were then asked to select
conomies, associated with technological chan
t to which thees acros here co ccount terms
4.5 Changes in Particular Skills 0
While the previouative to look in m
f cha neric skill indich are used to derive
es, i
e skill indiverage index valu
l, we ing from
ulate entiaor a e each year, rang
t/does ly’. W from n (3)lation in column (2), while colum
indicates the cha e 00 n ubchanges 10 per
t a che n
ivalene ntia
exampa i t his skill t ssematched mportan
entagei
By far th se is in th porta mput , consth a erdocuments, writin makin es an tation ing ainfluencin ns lymany of the iSpecial
of the site sk
w
By contrast, none oyears, andalso been
to s/equol achinery has decreaclose
portance. There has to de selling
product or s
4.6 Changes in s Nee Get J Req ts to nd HeO
As noted quali tting Secti3 re‘someone w to get e of j have n ltiple s to q 2 w ) identified ‘previsimilar work’, 5 ‘mot and un
69

the most and second most important factor from the list so identified. Even according to ), qualifications still came behind previous experience and
otivation in terms of their importance in securing jobs. Little seems to have changed 006
phasis on qualifications as a source of learning rem ins strong, it is now ised that the workplace itself ma provide an important source of
ad skill ure of learning time captures an important aspect of on-the-job er, in 92, 200 2006 s an add question he
ands of jobs was added to the survey instrument, and in 2001 and 2006 a further n on the degree to which jobholders are expected to help others learn was also added.
e s
in d p 2
e points in 1992 to 11 percentage points in 2006 (see Table 4.15).
at s is also available, but d to i s tha ly sign in he arg , em e aga n par
4.7
The e nat ls. Nev as add en by respondents at five data points over the last are
• s
ades have seen work skills rise substantially. While only 20% of jobs r. n
percentage points over the same period. On average, jobs in 2006 are also associated with
these data (see Table 4.14mbetween 2001 and 2 .
While the policy emin
acreasingly recogn
learning. Our brolearning. Howevlearning dem
y m asthe 19
e1 and urveys itional on t
questioUnlike the Learning Time Index (a measure of the time it takes someone to learn to do a job well), which has stagnated over the last five years, the proportions strongly agreeing to thstatement ‘my job requires that I keep learning new things’ has consistently moved upwardduring the 1992-2006 period – rising from 26% in 1992 to 30% in 2001 and then to 35% 2006. The gender gap of those agreeing or strongly agreeing with the statement has narrowefrom 9 percentage points in 1992 to 2 percentage points in 2006. In addition, the gabetween women who work part-time and those who work full-time has halved from 2percentag
D a on the extent to which workers are expected to help their colleague over a shorter time horizon. Respondents to the 2001 and 2006 Skills Surveys were askendicate the extent of their agreement or disagreement with the statement ‘my job requiret I help my colleagues to learn new things’. This shows a substantial and statisticalificant (p<0.05) rise in the proportions strongly agreeing the statement rising from 27%
2001 to 32% five years later. Table 4.13 therefore provides further support for tument that the workplace itself is becoming an ever more important source of learningphasising here the importance of spillovers from one person’s learning to another’s. Oncin, the gap between men and women is shrinking and the extent to which womet-timers are disadvantaged is falling.
Summary of Main Findings
motivation for a series of dedicated Skills Surveys that question those in work about thure of their jobs is the view that there is no single, undisputed, measure of skilertheless, there is keen interest in how skills have changed over time. This chapter hressed this question by using a variety of skill measures and comparing the results giv
two decades. The main findings of the chapter as follows:
As measured by the level of qualification required to get jobs, the length of time it taketo train for them and the period needed to do jobs well – what we refer to as broad skills – the last two decrequired a level 4 qualification for entry in 1986, this had risen to 30% twenty years lateSimilarly, the proportion of jobs requiring no qualifications on entry fell by eleve
70

longer periods of training – training periods over two years account for 30% of jobs in Britain today compared to 22% of jobs in 1986. They also take longer to get to grips with
prevalence,
• d nt d
• m er e
gnated.
• t g
th
• ’s, e .
ve benefited most from these trends, particularly since 1997. Much the same pattern of change is recorded for the use of
of rs of jobs perceived to be
e rs
equiring the qualifications they hold. There has also been an increase in the numbers of people holding qualifications at a higher level than those required for getting their job. In 2006 two-fifths of workers held qualifications at a higher level than was required for the work they carried out, up from the figure of 35% recorded in the 2001 survey. The increase has been greatest for those holding level 4 or above qualifications, for example, graduates.
• Since 1986 there has been a modest ‘credentialism’, that is, a rise in jobs where the qualification required by employers is judged by the jobholder not to be necessary for performing the job competently. This rise is far less than the increase in qualification requirements, implying that there is no reason to doubt the fact of increasing skill requirement of jobs over the long term.
• A final factor indicating the continuing increase in skill requirements is a rising emphasis on learning while at work. The proportion of workers strongly agreeing that learning new things was a continual requirement of the job rose from 26% in 1992 to 35% by 2006.
– for example, jobs that can be picked up in under a month are declining in falling from 27% of jobs in 1986 to 19% twenty years later.
Measures of the importance of activities carried out at work also suggest a strong upwarmovement in skills used at work. Between 1997 and 2006 there have been significaincreases in all the generic skill domains except physical skills with influence skills anliteracy skills rising most.
Nevertheless, recent increases between 2001 and 2006 have been below the longer-terupskilling trend. For example, only the Training Time Index has risen significantly ovthis last five-year period, while both the Required Qualification and Learning TimIndices have sta
Similarly, the rises in generic skills have become more muted and less pronounced thanpreviously. In fact, in three out of ten domains the upward movement in skills used awork has ground to a halt – number skills, technical know-how and problem-solvinskills have seen little change over the last five years compared to significant growbetween 1997 and 2001.
Over the last two decades, women’s broad work skills have risen faster than menthereby serving to narrow the gender skills gap. This change applies to each of the threbroad measures, over the last two decades and the more recent five year periodFurthermore, it is female part-timers that ha
generic skills at work with these skills rising fastest of all for female part-time workers.
• In the past, there seems to have been a closer match than now between the supplies and the numbeworkers with a particular level of qualification
requiring qualifications at each level (see Figure 4.3). There has been rapid growth in thsupply of workers holding qualifications at all levels, but slower growth in the numbeof jobs r
71

Table 4.1 Trends in Broad Skills, 1986-2006
1986
1992
2001
1997 2006
Broad Skills Samp Percentages/Scores le
ighest QualificaH tion Required1
L
s/PhDs2
ing Ds)
ional tions
NA
9.7
10.5
25.5
NA
13.2
12.3
24.3
NA
14.1
10.2
29.2
2.6
17.3
11.9
29.8
3.3
19.2
10.6
evel 4 or above 20.2
MasterDegree (includMasters/PhProfessqualifica
Level 3
15.2
16.6
13.8
16.3
16.3
Level 2
18.5
19.0
21.2
15.9
15.1
Level 1
7.7
5.0
9.2
12.1
11.2
No qualifications
38.4
34.0
31.5
26.5
27.7
Required qualification
3index
1.71
1.95
1.90
2.10
2.09
(b) Training Time > 2 years
22.4
21.9
28.9
23.6
29.5
< 3 months
66.0
62.6
57.0
61.1
55.7
raining index
2.0T 1
2.21
2.53
2.27
2.59
(c) Learning Time (Employees Only) > 2 years 24.3 21.6 24.3 25.6 24
.8
< 1 month 27.1 22.3 21.4 20.2
19.3
Learning index
3.30
3.36
3.48
3.57
3.60
72

(d) Broad Skills Composite4
Broad skills index
0.437
0.470
0.503
0.521
0.497
Sample base: all in employment, aged 20-60
4047
3855
2467
4470
4568
otes:
he qualificatio fra eac se has bjec ly inor amendment. To further enhance comparability the same qualification mapping
rotocols have been a lied to ea h data set reported he . For com is note the qualific app d fo , 19 199 2006 is
utlined in Table 3.1. The 2006 figures in this table differ from those reported in Table .6 because they are restricted to 20-60 year lds for com arability with the other four
• For 1986 and 1992, the following qualification map was applied: or ab univ or deg er professional (eg law,
dicine), teaching, nursing (eg SRN/SEN), HNC/HND or SHNC/SHND; Degrees = university or CNAA degree; Professional qualifications = other pr
icine), teac N/S C/H HN D; = GCE ‘A’ level, SCE higher or SLC/SUPE higher grade, certificate of 6th
year studies, ONC/OND (or SNC or SND), university certificate/diploma (not ee), SCOTVEC national certificate, SCOTBEC/SCOTEC certificate/diploma,
ool certificate of matriculation, SCE ‘O’ level or lower grade SLC or SUPE, City and Guilds, clerical and commercial (eg typing, shorthand or bookkeeping), professional qualification without sitting exam; Level 1 = CSE (other than grade 1), other; No qualifications = none reported. • For 1997, the following qualification map was applied: Level 4 or above = university or CNAA degree, other professional (eg law, medicine), teaching, nursing (eg SRN/SEN), HNC/HND or SHNC/SHND; Degrees = university or CNAA degree; Professional qualifications = other professional (eg law, medicine), teaching, nursing (eg SRN/SEN), HNC/HND or SHNC/SHND or S/NVQ level 4; Level 3 = GCE ‘A’ level or GNVQ advanced, SCE higher or SLC/SUPE higher grade or GNVQ advanced, certificate of 6th year studies, ONC/OND (or SNC or SND) or S/NVQ level 3, university certificate/diploma (not degree), SCOTVEC national certificate, SCOTBEC/SCOTEC certificate/diploma, completion of trade apprenticeship; Level 2 = GCE ‘O’ level or grade 1 CSE or school certificate of matriculation or GNVQ intermediate, SCE ‘O’ level or lower grade SLC or SUPE or GNVQ
N1. T n coding mes in h of the surveys been su t to onmp pp c re pleteness thdetails ation m ing use r 1986 92 and 7. The map o3 o psurveys.
Level 4 ove = ersity CNAA ree, othme
ofessional (eg law, med hing, nursing (eg SR EN), HN ND or S C/SHN Level 3
degrcompletion of trade apprenticeship; Level 2 = GCE ‘O’ level or grade 1 CSE or sch
73

intermediate, City and Guilds or S/NVQ level 2, clerical and commercial (eg typinional qualific
g, shorthand or bookkeeping), profess ation without sitting exam; Level 1 = CSE (other than grade 1), other; No qualifications = none reported. • For 2001, the following qualification map was applied:
or above = gree, NVQ ree, other degree, NVQ level 4, diploma in h n, HNC/HND C higher etc, tea further education, teaching ndary, teaching – primary, teaching – level not stated, nursing etc, RSA higher diploma, other higher education below degree level; Degree = hi e, f ree ree; io tion Q level 5, NVQ l l 4, dip in higher education, HNC/HND, BTEC higher etc, teaching – further education, teaching – secondary, teaching – primary, teaching –
not sta ing SA h iplo r h ucati w degree level;
= vel uiva A ed d/SCOTVE national, City and uilds advanced craft, Scottish 6
e (C SCE er or alent, AS level or equivalent, trade iceship; = NV 2, inte , RSA diploma, City and Guilds craft,
EC/SCOTVE first or ge ral diplom , O level, GCSE grade A-C or equivalent; el 1 = NV l 1, G GSV dation level, CSE below grade 1, GCSE
grade C, TEC/SCOTVEC first or general certificate, SCOTVEC m other, G her, P certificate, ot ifica o
qualifications = none reported.
spondents to 001 and 2006 Skills Su ovided with options which aster De nd ‘ ty o Deg owev ier
es are as outlined in Table 3.1 a stand sum easure
o 1.
Level 4 higher deigher educatio
level 5, first deg, BTE ching –
– seco
gher degreeve
irst deg , other deg Profess nal qualifica s = NVloma
level ted, nurs etc, R igher d ma, othe igher ed on belo
Level 3 A le or eq lent, RS advanc iploma, OND/ONC, BTECcertificat
C G th yearSYS), high equiv
apprent Level 2 Q level GNVQ rmediateBT C ne aLev Q leve NVQ/ Q founbelow B odules, RSA City and uilds ot YT/YT her qual tions; N
2. Re the 2 rvey were princluded ‘Mrespondents were not allowed the di
s or PhD gree’ afferentiate the type of degree.
Universi r CNAA ree’. H er, earl
3. The indic. This is
derivedardised4 mary m of the three broad skills measures ranging
from 0 t
74

Table 4.2 Trends in Broad Skills, 1986-2006
1986-2006
2001-2006
Broad Skills
ercentagChange in P es/Scores Highest Qualification Required Level 4 or above
Degree a s
6*
.1
+0
+1.9* -1Professional qu lification
+9.
+9.5* +0
.6
.3 Level 3
+1.1
0.0
Level 2
-3.4*
-0.8
*
-0Level 1 +3.8 .9
No qualifications
+1.2 -10.7*
Required qualification index +0.38* -0.01
(b) Training Time > 2 years +7.1*
+5.9*
s
.3*
-5.< 3 month -10 4*
0.58*
+0.32*Training index +
(c) Learning Time ees (Employ Only) > 2 years
+0.5
-0.8
< 1 month
-7.8*
-0.9
ndex
0*
+0.0Learning i +0.3 3
(d) Broad Skills Composite
s index
35*
0.01
Broad skill +0.08 83*
tistically s t difference between time po the d s (p<* = a sta ignifican ints in ata serie 0.05)
75

76
Required
Qualification Index1
Training Time
Index
Learning Time
Index
Table 4.3 Pattern of Change in the Distribution of Broad Skills by Gender and by Full-time/Part-Time Status, 1986-2006
1986- 2006
2001- 2006
1986- 2006
2001- 2006
1986- 2006
2001- 2006
All
+0.38*
-0.01
+0.58*
+0.32*
+0.30*
+0.03
Males
+0.13*
-0.12*
+0.06
+0.20*
+0.05
-0.02
Females
+0.73*
+0.14*
+1.26*
+0.47*
+0.68*
+0.11
Female Full- Time
+0.57*
+0.05
+1.02*
+0.39*
+0.44*
+0.03
Female Part-Time
+0.82*
+0.24*
+1.46*
+0.55*
+0.85*
+0.21*
Notes: 1. A positive (negative) figure indicates a rise (fall) between the two sample points. * = a statistically significant index change (p<0.05).

77
Table 4.4 Pattern of C b of d S by Occupation, 1986-2006
e edQualification
Index2
Tra TimIndex
Index
hange in the Distri ution Broa kills
quirR
ining e Learning Time
Occupation
1986-2006
2001- 2006 6
2001- 2006
1986-2006 2001-
1
1986-2002006
Managers
+0
+0
.30* 0.13 +0.27 .37* +0.40*
+0.03
Professional
0.01+ - +0
0.04
+0.63*
.14 +0.12
-0.02
Associate Professional
+0.26*
-0.08
+0.24
+0.26
+0.01
-0.08
AdmSecretarial
in and +0 +
+0
+0.23*
.19*
0.10 +0.72*
.53* +0.17*
Skilled Trades
+0.07
-0.05
-0.18
-0.08
+0.23*
-0.19
Personal Service
+1.05* +0.35*
+0.48*
+1.69*
+1.02*
+0.06
Sales
+0.10
-0.13
+0.71*
+0.51*
+0.05
-0.09
Operatives +0.24* +0.09
+0.51*
+0.44*
+0.22
-0.00
Elementary
+0.04
-0.16*
+0.27*
+0.21*
+0.33* +0.22*
Notes: 1. Occupatio re c sif by C20 ajor oup.
2. The figures are the changes in the broad skill indices in each of the sub-periods. A positive (ne ) f e indic n incre se (d se) in skill.
ns a las ied SO 00 M Gr
gative igur ates a a ecrea

78
Table 4.5 Pattern of Change in the Distribution of Broad Skills by Industry, 1986-2006
Training Time
Index
Required Qualification
Index2
Learning Tim
Index e
Industry1
1986- 2006
2001- 2006
1986- 2006
2001- 2006
1986- 2006
2001- 2006
Manufacturing
+0.22*
-0.15
+0.17
+0.22
+0.19*
-0.03
Construction
+0.18
-0.09
-0.21
+0.21
+0.39*
-0.05
Wholesale and Retail
+0.10
-0.14
+0.29*
+0.17
+0.16
-0.06
Hotels and Restaurants
+0.50*
-0.03
+0.86*
+0.36
+0.26
+0.09
Transport and Storage
-0.04
+0.02
+0.12
+0.28
+0.19
-0.03
Financial
+0.30*
+0.23
+0.31
+0.49*
+0.44*
+0.35
Real estate and Business Services
+0.52*
-0.17
+0.66*
+0.43*
+0.54*
+0.09
Public Administration
+0.26*
-0.19
+0.66*
-0.07
-0.17
-0.06
Education
+0.70*
+0.19
+1.21*
+0.46*
+0.66*
0.09
Health and Social Work
+0.33*
+0.17
+0.84*
+0.34*
+0.17
+0.03
Personal Services
+0.77*
+0.04
+0.75
+0.15
+1.28*
+0.21
Notes: 1. Industries are classified by SIC92; only those with sample size above 100 are shown.

79
2. The figures are the changes in the broad skill indices in each of the sub-periods. A e gative) figure indicates an increase (decrease) in skill. positiv
(ne

80
1992 7 2
Table 4.6 Qualifications Demand and Supply, 1986-2006
1986 199 001 2006
D (’000s)
S (’000s)
D (’000s)
S (’000s)
D (’000s)
S (’000s)
D (’000s)
D (’000s)
S (’000s)
S (’000s)
Level 4 or above
Degree Professionqualifica
al tions
4,260
2,04
2,214
3,820
2,319
1,501
5,793
02
2,791 2,009
5,805
3,3
2,430
6,324
3,877
2,447
7,292
4,321
2,973
2,585
7,445
4,805
2,641
8,495
5,928
2,567
8 3,0
4,988
2,979
76
7,359
4,774
Level 3
3,21 4,905 59 3,2
6,209
4.074
4,08
,126 5 3,7
4,124 92 6,379 1 6
Le
3,92
4,080
09
5,0
5,255
3,985 3,78
,617 vel 2
0 4,3
7,276 81
5,302
8 5
Level 1
1,631
2,198
1,125
2,213
3,754
3,031
2,808
3,248
2,269
3,549
No
ualificaq tions
8,20
7,748
02
7,5
3,274
6,651 1
6,990
2,232 1 7,7
5,831 88
2,88
Notes: D indicates the number of jobs with highest qualifications requirements at each level plus the number of estimated vacancies at each level; S indicates the number of people holding highest qualifications at each level. Estimates were obtained as follows:

81
• D: For each year, using the appropriate Labour Force Survey, an estimate was derived of the total number of individuals aged 20-60 years old who were in paid work in Britain. This figure was multiplied by the percentage of
r te a ess to their jobs required highest qualific the levels shown. p i b 1. f es t s o n be jo n ain that
at ou v T n s in nd not y totals for 1986, 1992 and 1997 were taken fro e entre vacancy d O le igures only capture 3 % ll vacanc
rdingly. The 2006 vacan ave been taken f Vacancy Surve d 6: Table 21), while those fo 01 have been e source for the nths of April acancy Survey only started reporting in April 2001). All the published data relates to the UK but ting to Britain. To arrive figures the British data have been inflated 3% (Machin, eport (and data) are focused Britain, the published figures have been adj d do ardsh yeons have been m ltiplied by the total number a ns e total number of jobs occupied and th l. , giving the total number of individuals who possess qualificatie Survey. They are constituted from all economically active people,E an O N ar es for the 1986
e ing A ora e demand figures, we restricted the analysis to those aged 20-60 years old g tain. t tail provided by the LFS on qualifications held (such as the ability to differentia o ith oneA ce allocating individuals precisely across the Level 2/3 divide), for comparability w sed the q rotocols used in deriving the qualification bands for Table 3.1.
Fo AP N ar s e use dde g gree level, BTEC/BEC/TEC higher, teaching – secondary, teaching – primhigher degree, first degree, other degree level; Professional qualifications = BTEC/BEC/TEC higher, teaching – secondary, te a Level 3 = BTEC/BEC/TEC general, A level, completed trade apprenticeship; Level 2 ity and
pr ssi l q ificat ; qualifications = n re te
higher degree, first degree, other degree level, BTEC etc hi a g ucation, teaching – secondary, teaching – primary, teaching – level not stated, nursing; Degree = hi g fi ther degree level; Professional qualifications = BTEC etc higher, teaching – further education,
sTdin2bMafr2bTa
• SfruIcDosi
r 1986gree, f
aching
gher, tegher de
urvey hese pemandclude
0). Hoeen gray 20
nd Maom in003: 8y 100he resre a su: The om thsing tLO unomparespiter two mpler
, the Qirst de
– prim
chinree,
respondents wercentages are qualificationsd. The vacancwever, these fossed up acco06 (ONS, 200y 2001 (the Vformation rela). Since this R
/103. For eaculting proportimmation of thsupply figurese Labour Forc
he EMPLOYEmployed us
bility with thhe greater de levels, henualification p
UALSM1 andree, other de
ry, nursing; Guilds, O level; Level 1 = CSE, ot
– further edrst degree, o
ho re
eporortedvari
d thn Tas le
t accle 4.els.
ations at one of umjob; s
Thehe a
6.5cy
demalys
of a totals h
r 20
at these on
vels requ
andis i
igurre
are hus estricted to individuals’ m
m th
ro
tima
Jobcies (Machin, 2003: 6). The tota
m thetaken from the sam
UK
e vacancies at each qualification leve
war
tes f thea
r of ecoata (
y
bs iaryNS
mo
by uste
ons at each level, are also derived including the unemployed,
EClivinte th
Brit jobs , 2001
ls used have, therefore, for March, April an
are: Tab
wnw
nd colum
ar, the qualification le ired of those in work 12 months or less have been calculated.u of vacancies for each year. The dem
d Lthe
OKIE
G vCA
iableri
Labour Force Survey, and including those recorded as ren IN CA d ved variable for 1992 on ds, 2006 amed IN C0
in se we u
ary, nursing; Degree =
= C
5).Bri
F
PRE T v iable wer d to erive the following categorisation: Level 4 or above = higher
her
For 1992, HIQUAP was categorised as follows: Level 4 or above =
ofe ona ual ions No one por d.

82
teaching – secondary, teaching – primary, teaching – level not stated, nursing; Level 3 = BTEC (etc) general, A level and equivalent, completed trade apprenticeship; Level 2 = City and Guilds, O level and equivalent, RSA; Level 1 = CSE below grade 1, YT certificate, other For 1997 and 2001, the varia n 5. All these LFS variables derive the highest qualificatio o Table 3.6 for mapping protocols.
; No quali
ble HIQUn held by
fications = none reported.
AL was used. For 2006 the a respondents. See the notes t
alysis is based on the HIQUAL

Table 4.7 Trends in the Proportions ‘Over-Qualified’ and ‘Under-Qualified’ for Their Jobs, 1986-2006
Change in Percentage
1986- 2006
Change in centa
20012006
83
1986
992 1 1997
2001
2006 Per ge
-
Perce‘OverQualif
29.3
0.2
+10.3*
+4.5*
ntag- ied’
e
2 3
31.7
.1 35
39.6
Perce‘UndQualified’1
17.9
3.9
-4.3*
-1
ntager-
e 1
16.8
.6 14
13.6 .0
Percentage ‘Over-Qualified’ Among Those Holding Qualifications at Levels: Level
Pr ional qu
27.920.3
32.1
5.3
21.7
8.5
+7
+10.0*
+11.5*
+7 +
+9
4 o Degree
r above
ofessalifications
2
2
25.21.9
8
30.0
28.0 23.0
33.9
35.230.3
43.6
.3*
.2*
7.3*
.7*
Level
47.7
1.5
+3. + 3 4
52.0
48.1
51.4 8
3.3
Level 2
42.4
42.7 40.8 50.0 49.4
+7.0* -0
.6
Level
54.3
8.9
1 4
42.5
.2 43
46.4 -7.9
+3.2
Notes
ificant difference in the change in percen 200 – onlyreported for the last two columns of data in the table. 1. An fied’ indi highest qu a lo n tha equi he/she
2. An ‘over-qualified’ individual has a qualification at a higher lev han that curre y required to get /she now holds
: * = a statistically sign tages between 1986-2006 and 1-2005 (p<0.05)
‘unnow holds.
der-quali vidual has a alification at wer level tha t currently r red to get the job
el t ntl the job he.

Table 4.8 Credentialism, 1986-2006
1986 1997 2001 2006
Highest
Qualification Percentage of Each QualificatiRequired
on Cohort
(a) Qualification ‘Essential/Fairly Necessary’ to Do Job1
Level 4 or above
80.5
76.9
77.5
75.2
Level 3
77.3
74.1
70.3
73.3
Level 2
64.7
71.7
70.2
68.1
Level 1
79.3
77.2
62.7
70.0
(b) Qualification ‘Totally Unnecessary’ to Do the Job2
Level 4 or above
4.8
6.7
9.1
8.8
Level 3
4.4
6.9
10.2
9.9
Level 2
11.0
6.8
8.8
11.6
Level 1
5.8
9.8
18.8
13.8
(c) Qualifications Necessity Index3
Level 4 or above
3.26
3.12
3.13
3.10
Level 3
3.17
3.06
2.91
2.98
Level 2
2.81
2.95
2.88
2.88
Level 1
3.32
3.18
2.83*
3.00
Notes: 1, Respondents were asked to assess whether today’s entry qualifications (see note 2 in Table 3.1) were ‘essential’, ‘fairly necessary’, ‘not really necessary’ or ‘totally unnecessary’ to do the job competently. This panel reports the proportions of respondents in each required qualification category saying that their qualifications were either ‘essential’ or ‘fairly necessary’ to do the job. 2. The panel reports the proportions of respondents in each required qualification category saying that their qualifications were ‘totally unnecessary’ to do the job. 3. As a summary measure, this panel presents the extent to which required qualifications are regarded as necessary to do the job. Here 4 = ’essential’; 3 = ‘fairly necessary’; 2 = ‘not really necessary’ and 1 = ‘totally unnecessary’.
84
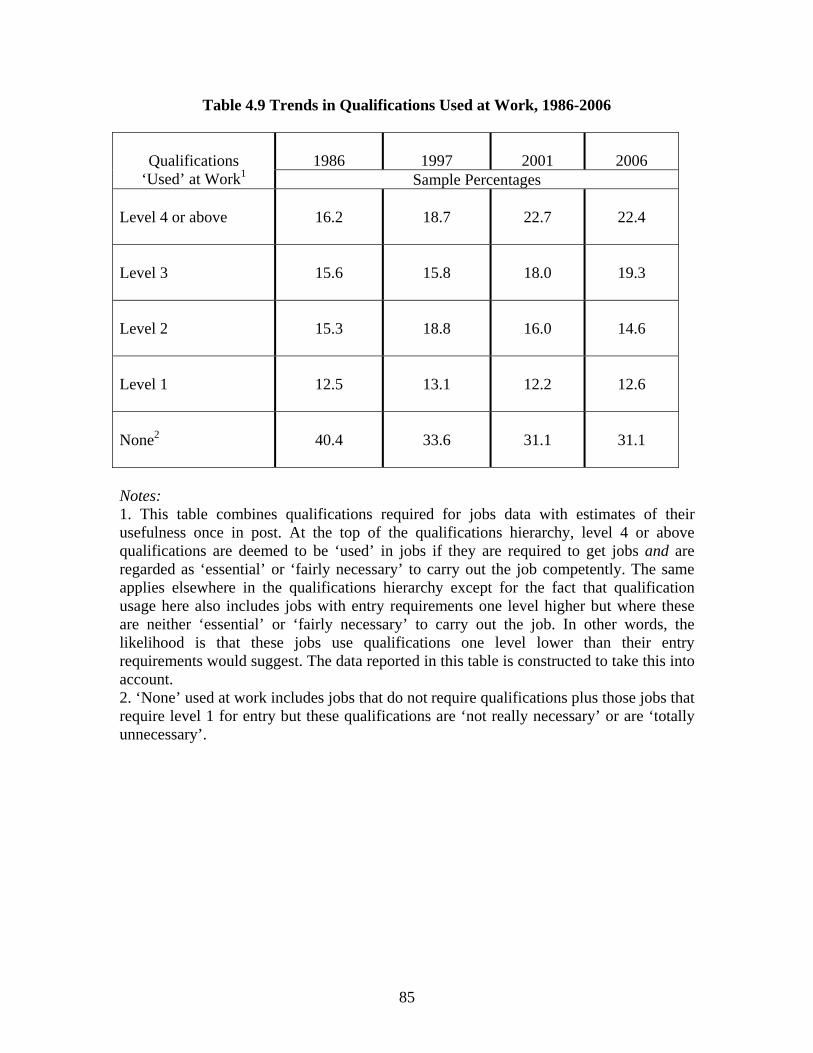
Table 4.9 Trends in Qualifications Used at Work, 1986-2006
1986
1997
200
01 2 06
Qualifications
‘Used’ at Work1 mSa ple Percentages
ove 6 2
2.7
2.4
2Level 4 or ab .2
1
8.7
1
Level 3
15.6
15.8
18.0 19.3
8 1
Level 2 15.3
1 .8
6.0 14.6
Level 1
.5
3
12
212 1 .1 .2 1 .6
None2
.
3
31
1
40 4 3 .6 .1 3 .1
Notes:
com a r d a e s eusefulness once in post. At the f a i r o
lifications are ed ‘ i a u o b aregarded as ‘essen r n a c t b T m
re in the qualifications hierarchy except for the fact that qualification e also i it y e o e er h e
are neither ‘essential’ or ‘fairly necessary’ to carry out the job. In other words, the is that se
requirements would suggest. The data reported in b on e e nount.
2. ‘None’ used at work includes jobs that do not require qualifications plus those jobs that quire level 1 for entry but these qualifications are ‘not really necessary’ or are ‘totally
ssary’.
1. This table bines qualific tions top o
equirethe qu
for jolificat
bs datons hie
with archy,
stimatelevel 4
of thor ab
ir ve
qua deemtial’ o
to be ‘fairly
used’ ecess
n jobsry’ to
if theyarry ou
re req the jo
ired t comp
get joetently.
s and he sa
re e
applies elsewheusage her ncludes jobs w h entr requir ments ne lev l high but w ere th se
likelihood the jobs use qualifications one level lower than their entry this ta le is c struct d to tak this i to
acc
reunnece
85

Table 4.10 Change in the Distribution of Generic Skills1 by Gender and by Full-Time/Part-Time Status, 1997-2006
Lite
r
Kno
How
Plan
ning
Cl
nt
Man
agem
ent
acy
Phys
ical
Num
ber
Tech
nica
l w
-
Influ
ence
ieC
omm
unic
atio
n
Hor
izon
tal
Com
mun
icat
ion
Prob
lem
-Sol
ving
Che
ckin
g
A1997 2.27 5 2 1 na
ll 1.83 1.7 2.48 1.79 .86 2.55 2.96 2.94 3.1
2001 2.40 2.68 1.88 1.87 2.60 1.91 3.00 2.60 3.07 3.04 3.20 2006 2.49 7 . 3 5 2.77 1.87 1.8 2.57 2 05 .06 2.66 3.14 3.01 3.2
C 2* 0.20* 0.11* 0.09*hange, 97-062
0.2 0.04 0.12* 0.09* 0.26* 0.18* 0.07* 0.14*
M.28 6 . 2 5 na
ales 1997 2 2.04 1.92 2. 9 1 87 .93 2.52 2.91 3.06 3.12001 2.41 2.70 2.02 2.06 2.75 1.99 3.04 2.57 3.02 3.15 3.24 2006 2.45 4 . 3 7 2.77 2.01 2.0 2.71 2 08 .04 2.61 3.02 3.11 3.2
C 0.17* -0.03 0.12* 0.02 0.22* 0.11* 0.09* 0.11* 0.05 0.12* 0.07 hange, 7-0629
F4 . 2 6 na
emales 1997 2.2 1.58 1.55 2.22 1 70 .78 2.58 3.02 2.79 3.02001 2.39 2.65 1.72 1.64 2.41 1.81 2.94 2.63 3.13 2.91 3.15 2006 2.53 1.72 1.68 2.42 2.01 3.08 2.73 3.26 2.90 3.23 2.76
C * * * 0 . . 0 * 0.11*hange, 2
0.2997-06
0.14 0.13 0.2 * 0 31* 0 30* .15* 0.24* 0.11* 0.17
FFJo
.51 1.55 1.78 2.33 1.99 3.02 2.66 3.14 3.00 3.28 Na
emales, ull-Time bs
21997 2001 2.65 . 3 3 2.74 1.64 1.86 2.50 2 06 .17 2.72 3.27 3.09 3.32006 2.70 . 3 3 2.81 1.66 1.86 2.42 2 19 .23 2.74 3.34 3.00 3.3
Change, 97-062
0.19* 0.11 0.08 0.09 0.20* 0.21* 0.08 0.20* 0.00 0.05 0.07
Females, Part-Time Jobs
47 2.86 2.50 1997 1.88 1.62 1.23 2.06 1.31 2.45 2. 2.76 na 2001 2.00 1.83 1.31 2.28 1.44 2.61 2.51 2.93 2.64 2.87 2.34 2006 2.25 1.83 1.38 2.41 1.74 2.85 2.70 3.15 2.73 3.06 2.61
Change, 97-062
0.37* 0.21* 0.15* 0.35* 0.43* 0.40* 0.23* 0.29* 0.23* 0.30* 0.27*
Notes:
86

1. The generic skills indices are the average scores of the item in each ind ed from the 2006 data. The item scale ranges from 0 (‘not at all important/does not apply’) to 4 (‘essential’).2. Change over 2001-2006 in the case of managem erwi 2006. * indicates the change is statistically significant at the vel.
s
ent skills; oth 5% le
ex, deriv
se over 1997-
87

Table 4.11 Pattern of Change in the Distribution of Generic Skills b1997-2006
Oc
Tech
nica
l K
now
-How
Influ
ence
Plan
ning
Clie
nt
Com
mun
icat
ion
Hor
izon
tal
Com
mun
icat
ion
Prob
lem
-Sol
ving
Che
ckin
g
y Occupation,
cy
cupation1
Lite
ra
Phys
ical
Num
ber
Mana -0.08 0.18 2 -0.02 0.02 0.08 gers 0.19* -0.23* 0.01 * 0.0 0.18*
Profe -0.06 -0.0 2 -0.06 -0.18* 0.01 ssionals 0.01 -0.04 -0.25* 1 0.0 0.15*
AssocProfe
1* 0.21* 0.05 0.04 0.13 4* 0.02 0.19* -0.02 0.07 iate
ssionals 0.2 * 0.1
AdmiSecre
0.05 0.08 0.17* 0.05 0.11 0.08 0.12*nistrative & tarial 0.10 -0.01 0.25*
Skille 0.16 5* 0.09 0.03 0.12 d Trades 0.14 0.03 0.23* 0.06 * 0.1 0.01
Perso * 0.26* 0.28* 0.07 -0.07 0.07 0.24*nal Service 0.06 0.01 0.20 0.27
Sales 0.33* 0.32* 0.10 0.24* 0.23* 0.10 -0.010.09 0.45* 0.09
Plant Operatives
0.30* 0.06 0.05 0.13 0.27* 0.25* 0.08 0.02 0.07 0.21*& Machine
Elementary 0.17 0.36* 0.06 0.29* 0.14 0.10 0.18 0.35* 0.14 0.28*
ALL
0.22* 0.04 0.12* 0.09* 0.26* 0.14* 0.11* 0.18* 0.07* 0.14*
Note: 1. Occupational groups are classified by SOC2000 Major Group. The figures are the changes in the generic skills indices between 1997 and 2006. A positive (negative) figure indicates an increase (decrease) in skill. * indicates the change is statistically significant at the 5% level.
88

Table 4.12 Pattern of Change in the Distribution of Generic Skills by Industry, 1997-2006
Lite
r
Phys
ical
Num
ber
Tech
nica
l K
now
-How
Influ
ence
Plan
ning
Clie
nt
Com
mun
icat
ion
Hor
izon
tal
Com
mun
icat
ion
Prob
lem
-Sol
ving
Che
ckin
g
Industry1
acy
Manufacturing 0.27* 0.05 0.12 0.10 0.27* 0.22* 0.17* 0.11 0.04 0.08
Construction -0.04 0.09 0.03 0.08 -0.08 0.01 0.00 -0.01 0.04 0.12
Wholesale & Retail 0.18* 0.15 0.02 0.14 0.26* 0.17* 0.05 0.26* 0.12 0.08
Hotels & Restaurants -0.10 -0.05 -0.03 0.00 0.12 0.14 0.13 0.1 .22 0.08 5 -0
Transport & 0.06 0.21 0.08 0.13 0.20 0.29* 0.06 0.1 .09 0.16 Storage 2 0
Finance 0.08 -0.08 0.09 - 0.11 0.03 0.05 0.1 .03 0.02 0.05 4 0
Real Estate & Business Services
0.06 -0.07 0.23* 0.00 0.11 0.11 0.08 0.1 .01 0.12 8* -0
Public 0.Administration 06 0.22 0.03 -0 0.21* 0.05 -0.07 0.0 0.02 -0.01.02 0 -
Education 0.24* 0.17 0.15 0. 0.12 0.14 0.09 0.17 0.03 0.12 23* * -
Health & Social Work 0.34* 0.13 0.43* 0.42* 0.41* 0.28* 0.23* 0.14 0.25* 0.45*
Personal Services
0.23 0.33* 0.05 0.17 0.21 0.23 0.25* 0.3* 0.22 0.3*
Note: 1. Industries are classified by SIC92; only those industries with sample size above 100 in each year are shown. The figures are the changes in the generic skills indices between 1997 and 2001. A positive (negative) figure indicates an increase (decrease) in skill. * indicates the change is statistically significant at the 5% level.
89

Ta 97
iled Skills
Averag
2006 minus
Average for
199
Averag
2006 minus
Average for
200
ble 4.13 Differences Between Detailed Skills in 2006 and Detailed Skills in 19
Deta
e for
7
e for
1
Paying close attention to detail
0 0.030. 1 Dealing with people 0.12* 0.11* Instructing, training or teaching p 0.23* 0.11* eople
Making speeches or presentations 0.29* 0.17*
Persuading or influencing others 0.24* 0.17* Selling a product or service 0.00 0.05 Counselling, advising or caring for customers or clients 0.17* 0.01 Working with a team of people 0.17* 0.10*
Listening carefully to colleagues 0.18* 0.03 Physical strength 0.03 0.06 Physical stamina 0.04 0.05 Skill or accuracy in using hands or fingers 0.04 -0.14* How to use or operate tools/equipment/machinery -0.15* -0.17* Knowledge of particular products or services 0.18* 0.09* Specialist knowledge or understanding 0.31* 0.12* Knowledge of how your organisation works 0.32* 0.10* Using a computer, PC, or other types of computerised equipment 0.62* 0.24* Spotting problems or faults 0.00 -0.05* Working out the causes of problems or faults 0.04 -0.06* Thinking of solutions of problems or faults 0.17* 0.02 Analysing complex problems in depth 0.30* 0.22*
90

Checking errors 0.13* 0.06*
things to ensure that there are no
Noticing when there is a mistake 0.14* 0.04* Planning your own activities 0.18* 0.05 Planning the activities of others 0.16* 0.07* Organising your own time 0.23* 0.06* Thinking ahead 0.18* 0.07* Reading written information such as
0* 0.03 forms notices or signs 0.1Reading short documents such as short
rts, letters or memos 0.22* 0.10* repo
Reading long documents such as long s, articles or books 0.24* 0.13* reports, manual
Writing written information such as formnotices or signs 0.16* 0.03
s
Writing short documents such as short reports, letters or memos 0.30* 0.11* Writing long documents such as long reports, manuals, articles or books 0.31* 0.11* Adding, subtracting or dividing numbers 0.02 -0.04
Calculations using decimals, percentages or fractions 0.14* -0.01 Calculations using more advanced mathematical or statistical procedures 0.20* 0.05
* indicates the change is statistically significant at the 5% level.
91

Table 4.14 Importance of Factors in Getting Jobs, 2001-2006 2001 2006
Factors Needed to Get Current Type of Work
Previous experience of similar work
69.1 69.4
Motivation 66.4 57.2
Educational or technical qualifications
48.6 46.4
A natural ability or fitness for this type of work
45.5 42.5
Right age for the job 20.0 14.8
Previous employment in the organisation you work for
15.8 13.9
None of these 3.4 3.3
Most or Second Most Important Factor
Previous experience of similar work
44.2 40.5
Motivation 32.4 27.0
Educational or technical 27.4 26.6 qualifications
A natural abfo
ility or fitness r this type of work
26.4 22.1
Right age for the job 4.2 3.8
Previous employment in the organisation you work for
4.5
3.3
92

Table 4.15 Percentage Required to Learn New Things At Work, 1992-2006
esponses to Statement
1992
2001
2006
R‘My job Requires That I Keep Learning New Things’
Strongly Agree 26.1 30.2 34.6 Agree 50.1 51.1 47.9 Disagree 19.6 16.6 14.4 Strongly Disagree 4.2 2.1 3.1 Percentages agreeing or strongly agreeing to statement All 76.2 81.3 82.5 Males 80.2 83.7 83.4 Females 71.7 78.5 81.5 Female full-time 81.1 83.8 85.5 Female part-time 59.0 70.6 75.0
93

Table 4.16 Percentage Helping Others to Learn, 2001-2006
Responses to Statement ‘My Job Requires That I Help My Colleagues to Learn New Things’
2001
2006
Strongly Agree 26.9 31.5 Agree 52.1 50.2 Disagree 17.2 14.5 Strongly Disagree 3.8 3.8 Percentages agreeing or strongly agreeing to statement All 79.0 81.7 Males 80.3 81.6 Females 77.3 81.8 Female full-time 84.0 85.5 Female part-time 67.4 75.5
94

CHAPTER 5 COMPUTING SKILLS
5.1 Introduction
This chapter focuses on what is widely considered to be the most far-reaching generic skill of the modern era – computing. Over the past three decades, the advent of computers in the workplace has accompanied a fundamental re-alignment of the mix of skilled and unskilled workers (Bresnahan, 1999). In particular, the upskilling reported in British jobs between 1986 and 1997 has been shown to be strongly associated with the expansion of computer usage (Green et al., 2003).14 Rather than being confined to a relatively small sector of highly skilled information technology experts, the direct impact of computers has spread through a very diverse range of jobs. Policy in recent years has been developed to ensure that school and college students can all acquire sufficient computer skills, and there is also concern that adults should have sufficient access to this technology. However, there is a scarcity of information about just how widespread computer usage is in Britain, how fast it is changing, how workers are coping with the changes and whether they are doing so adequately. There is, therefore, a strong need for
tive data about the expansion of computer usage at work. In this e distribution of computing skills and chart their spread over recent
ears. We then examine the importance of internet use in Britain, with attention given to
ipment?’ This was asked in the
cally sophisticated equipment in 2006 (57% compared
accurate, representachapter, we plot thyexamining the recent changes over the last five years.
5.2 The Growth of Use of Advanced Technology
A number of different measures point to a striking increase in the importance of computing skills in work since the early 1990s. Our broadest and longest trend indicator on the use of advanced technology in jobs is a question that asks employees: ‘Does your own job involve use of computerised or automated equSocial Change and Economic Life survey of 1986, the Employment in Britain survey of 1992 and the Skills Surveys of 2001 and 2006.
As can be seen in Table 5.1 and Figure 5.1, there has been a continuous expansion of the use of computers and automated equipment in work. Taking employees, there was a 16 percentage point increase between 1986 and 1992 and a similar increase (18 percentage points) between 1992 and 2001. Between 2001 and 2006, however, the increase appeared to have slowed down (only 4 percentage points), suggesting that the use of computerised and automated equipment is approaching saturation. Taking the period 1986 to 2006 as a whole, the proportion has risen from 40% of all employees to over three quarters. Despite the faster increase among the self-employed, they were still substantially less likely than employees to be using technologiwith 77%).
14 At the same time, some studies have also attributed to computers a substantive role in the changing distribution of wages, though this claim is contested and the evidence is mixed. We report some relevant findings in Chapter 7.
95

Figure 5.1 The Use of Advanced Equipment in Jobs, 1986-2006
0
10
20
30
ees
% U
sing
Com
pute
40
50
60
70
80
90ris
ed o
r Aut
omat
ed E
quip
men
t
All Emplo
yM
alFe
m
Female
Full-
ti
Female
Part-
times ale
s mers
ers
1986199220012006
ource: Table 5.1.
here has been a marked convergence between men and women in the use of advanced
f advanced technology was also faster among older employees.
ted
nced technologies has varied substantially depending on a person’s occupational group from the mid-1980s to the present. The
e restricted to employees because the question was not asked of the
S
Tequipment. In 1986 there was a gender gap of 13 percentage points. This fell to 5 points in 1992. In 2001 the gap had disappeared, with women at least as likely to be using such equipment as men (74% compared with 73%). By 2006, there was virtually no gender difference with 78% of women working with advanced technologies compared to 77% of men. It is notable, however, that substantial differences persist among women workers according to their hours of work. Women in full-time jobs are more likely than men to be using computerised or automated equipment, whereas the reverse is the case for women in part-time jobs. While both female full-timers and part-timers substantially increased their use of advanced technology, the gap between them remained unchanged between 1986 and 2001. However, since 2001, female part-timers have begun to close the gap with the proportion of female full-time workers using advanced equipment largely remaining constant, while part-timers made an eight percentage point advance.
The increase in the use oIn earlier periods older workers were less likely to be using advanced equipment. However, the age threshold at which such use declines has changed over time. Between 2001 and 2006, the oldest workers (55+) experienced the fastest increase (from 60% to 72%), whereas the youngest group (20-24) experienced a notable decline (75% to 70%). Over the period 1986 to 2006 as a whole, the gap between the young and older employees has disappeared. However, both groups still lag behind employees aged 25-44 years old. For this group more than 80% reported using computerised or automa
ent in their jobs in 2006, following a small but steady increase from 2001. equipm
As can be seen in Table 5.2, the use of adva
comparisons had to b
96

self-employed in 1986. Table 5.2 shows that in 2006 the use of new technologies was
int),
oints from 2001 and sixteen percentage points from 1997. If the estimate of
most common among ‘Administrative and Secretarial’ employees and among ‘Managers’, followed by ‘Professionals’ and ‘Associate Professionals’. In contrast, even in 2006, only 57% of those in ‘Skill Trades’ used such equipment and less than half of those in ‘Personal Service’ and ‘Elementary’ occupations. The growth in use between 2001 and 2006 affected all occupational groups except ‘Sales’ and ‘Plant and Machine Operatives’. It was particularly strong among ‘Skilled Trades’ and ‘Personal Service Workers’, as the proportion of employees using advanced technologies increased by about 10 percentage points. By contrast, the increase was rather slight for ‘Professionals’ (3 percentage points) and ‘Administrative and Secretarial’ workers (1 percentage poindicating that the use of such equipment is becoming almost ubiquitous among these groups of workers.
By 2006, computerised equipment was widely used in most industrial sectors (Table 5.3). In ‘Finance’, ‘Education’, ‘Public Administration’ and ‘Real Estate and Business Services’ it was relevant to the jobs of more than 85% of employees. It was only in ‘Construction’ and ‘Hotels and Restaurants’ that it affected the work of only half of employees, but even in these industries computer usage has grown substantially since 1992. Over the last five years, there were substantial variations between industries in the extent of this growth. The increase in ‘Finance’ and ‘Real Estate’, for instance, was relatively small, possibly reflecting its widespread adoption by the turn of the century. In contrast, there were particularly marked increases in ‘Personal Services’ (15 percentage points), ‘Construction’ (11 points), ‘Health and Social Work’ (9 points) and ‘Education’ (8 points). Table 5.4 shows the distribution of jobs requiring the use of computerised or automated equipment across regions in 2006. Unlike the picture with respect to broad skills, there are clear geographical differences in the distribution of computing skills. While more than 80% of jobs in London, East of England and South East made use of computerised or automated technologies, this was the case for only 71% of jobs in Yorkshire and the Humber and around 73% of jobs in Wales, East Midlands and Scotland.
5.3 The Increasing Centrality of Computing to Job Tasks
The measure discussed above covers jobs that vary substantially in terms of the centrality of computing work to task activities. A further question helps to explore whether computing has not only come to affect a wider range of jobs, but also has become more important to the nature of the tasks carried out. In all the surveys since 1997, a question was included asking people how important ‘Using a computer, PC or other types of computerised equipment’ was to their job (Table 5.5).
The overall use of computers can be measured as the sum of the responses ranging from ‘essential’ to ‘fairly important’. This gives a very similar estimate to the previous question, with 74% saying it was of importance in 2006, a rise of approximately five percentage psome type of use is taken to include the response ‘not very important’, the increase remains very similar with the proportions rising from 70% in 1997 to 79% in 2001 to 83% in 2006.
Taking those who said that the use of such equipment was either ‘essential’ or ‘very important’ as an indicator of the centrality of computer skills to the work task, as Figure
97

5.2 shows, there was also a marked growth in work where computing activities constituted a central component of the job. The increase was mainly driven by the expansion of the category that considered use of computers as ‘essential’ in their jobs. In 2006 approximately 47% of all those in employment said that the use of computing equipment was ‘essential’, compared to 40% in 2001 and 31% in 1997. Women were more likely than men to consider it ‘essential’ in all three years. But again the much sharper divide is between women in full-time work and women in part-time work. Among the former, 57% reported that the use of such equipment was ‘essential’ to their job in 2006, whereas among the latter the proportion was only 39% (Table 5.5).
Figure 5.2 The Centrality of Computers in Jobs, 1997-2006
40
50
60
ial'
199720012006
10
20
30
% R
epor
ting
'Ess
ent
0All Employees Males Females Female Full-timers Female Part-timers
Source: Table 5.5.
The relative importance of computerised equipment to the job was strongly affected by the type of work as reflected by occupational group. For instance, by 2006, 82% of ‘Administrative and Secretarial’ workers regarded it as ‘essential’ and this was also the case for approximately two thirds of ‘Managerial’, ‘Professional’ and ‘Associate Professional’ workers (Table 5.6). In contrast, only 12% of ‘Elementary’ workers and ‘Personal Services’ workers and around 20% of those in ‘Skilled Trades’ and ‘Plant and Machine Operative’ occupations thought it ‘essential’. Similarly, while the proportions making some use of such equipment rose in all occupational groups, the growth was
e points), ‘Construction’ (8 points) and ‘Wholesale and Retail’ (8 points). In contrast, the proportions rose substantially in ‘Education’ (24 points), ‘Health and Social Work’ (24 points), and
particularly fast among ‘Managers’ and ‘Professionals’.
This variability in the increased centrality of computerised technology to jobs is also evident from industry comparisons (Table 5.7). Between 1997 and 2006 there was a moderate increase in the proportions regarding the use of computerised equipment as ‘essential’ to the job in ‘Hotels and Restaurants’ (6 percentag
98

‘Public Administration’ (19 points). Examining the picture by region (Table 5.8), the ogy appears to be highest in East of England, London of employees considered it ‘essential’ to their job in
006. By contrast, the proportion is considerably lower in North East (40%), Scotland
Theconthethetheor ntha s ago, they were then asked about their
TheThiimpcomtheimpwer
The puting skills was evident for both men and women,
wittheimppar
Ovsubcha
Ouwide range of tasks of very different levels
To comof givprocom for word-processing and/or spreadsheets or communicating with others by e-mail); ‘Complex’ (for example, using a computer for analysing information or design, including use of computer aided design or statistical analysis packages); and ‘Advanced’ (for example, using computer syntax and/or formulae for programming). The results are presented in Table 5.10.
centrality of computerised technoland South East, where around 55%2(41%) and East Midlands (42%).
overall picture of the increasing importance of computers in work was also firmed by individuals’ reports of their own recent experiences. We asked people in 2006 survey to compare the computing skills in their current job with those in the job y were doing five years earlier (Table 5.9). The question was: ‘Would you say that re has been a significant increase between then and now, a significant decrease or little o change in the importance of computing skills in your job?’ If it became established
t respondents were not in employment five yearemployment four/three years ago.
most frequent response was that the importance of computing skills had increased. s was given by half of all those in work. In contrast, only 7% thought that the ortance of such skills in their work had decreased. Thus, the rising importance of puters over time is not only attributable to younger people replacing older people in
workforce, but also to changes experienced by older people too. The growing ortance of such skills was mainly evident for employees, whereas the self-employed e more likely to say that there had been no change.
rising importance of comalthough it was even more the case for women (53%) than for men (47%). However, as
h the use of computerised equipment, the experience of women varied depending on ir contract status. While 57% of women in full-time work reported an increase in the ortance of computing skills in their job, this was the case for 46% of those in
t-time work.
erall, not only did the number of jobs affected by computerised technology increase stantially, but its centrality for job performance also rose. However, this pattern of nge varied sharply by occupational group, industry and geographical location.
5.4 The Complexity of Computer Use at Work
r broad measure of the prevalence of the use of computerised equipment also covers a of complexity. To what extent has the growth
been primarily in terms of routine types of computer use as against more advanced use? address this issue, those who used computers (i.e. excluding those who reported puter use as ‘not at all important’) were given a set of statements about possible types
use and asked which best characterised their own job. The four broad types of use en were: ‘Simple’ (for example, using a computer for straightforward routine cedures such as printing out an invoice in a shop); ‘Moderate’ (for example, using a puter
99

T (46%). However, the trends towards in istication in computer use can be very learly discerned. As illustrated in Figure 5.3, there has been a continuous increase in the roportion of employees stating that their job involved ‘Complex’ or ‘Advanced’ use of
computers. Furthermore, ce of the se has ac ted durin last five e years men were more likely to be making both complex and advanced s than wom owever, th ard trend ilar for both sexes.
he most frequent type of computer use in 2006 was at a ‘moderate’ level of complexitycreased soph
cp
the pa increa celera g the years. In all threuse of computer en. H e upw is sim
Figure 5.3 Complexity of Computer Use: Percentage of Computer-Using Jobs Requiring Complex or Advanced Use of Computers, 1997-
2006
0
5
10
15
20
25
30
35
40
1997 2001 2006
AllMalesFemalesFemale FTFemale PT
Source: Table 5.10.
Nevertheless, the growth of complex usage was more marked for female part-timers than for female full-timers. Despite the fact that there remains a very substantial difference between women in full-time and women in part-time work, there has been a trend towards convergence over the last ten years (see Figure 5.3). In 1997, 22% of full-timers reported that their jobs required complex or advanced forms of computer use, compared to only 6% of part-timers. By 2006, the gap narrowed by 7 percentage points. At the other extreme, there had also been a faster decline in the relative importance of ‘simple’ use (from 55% to 34%) for part-timers compared to full-timers (from 31% to 23%).
Complexity of use was strongly related to occupational group (Table 5.11). Those in professional occupations (‘Professionals’ and ‘Associate Professionals’) were the most likely to use computerised equipment in an advanced or complex way – indeed, this was the case for 40% in 2006. They were followed by ‘Managers’ (34%) and ‘Administrative and Secretarial’ workers (28%). While less than a fifth of people in these occupations were classified as making ‘simple’ use of their equipment, the proportion rose to 52% among ‘Sales’ workers, 55% among ‘Plant and Machine Operatives’ and 69% among those in ‘Elementary’ occupations. There was also an interesting difference in the trend across time. In ‘Managerial’, ‘Professional’, and ‘Administrative and Secretarial’
100

occupations there was a rise in the proportion making advanced or complex use of computerised equipment, and a sharp decline among those making simple applications. By contrast, an opposite trend occurred for those in ‘Elementary’ occupations. Here, the spread in the use of advanced equipment at work was primarily related to relatively simple job tasks. While ‘Plant and Machine Operatives’ shared the same experience as Elementary’ workers between 1997 and 2001, the proportion making complex use of computerised equipment rose after 2001. Complexity of use was also strongly related to industrial sector (Table 5.12), with the strongest concentrations of more advanced types of use in ‘Real Estate and Business Services’, ‘Finance’ and ‘Manufacturing’, while ‘Hotels and Restaurants’ and ‘Wholesale and Retail’ stood out for the very high proportion making simple use of computerised equipment. The pattern remained very stable over the last five years.
Another indicator of more complex use is the importance and type of use of the internet. Comparable data on the use of the internet is available from the last two Skills Surveys. Table 5.13 shows a rapid increase in the importance of internet use between 2001 and 2006. In 2001 just under a quarter (24%) of those in work said that use of the internet was either ‘essential’ or ‘very important’ for their job, while just over a third (39%) made some use of the internet in their work. By 2006, 42% of workers considered use of the internet as ‘essential’ or ‘very important’, while 57% made some use of it. The increase has been faster for women than for men. In 2001 the proportion using the internet was slightly higher on both measures for men than for women, while by 2006 the sex difference had disappeared. However, there remains a sharp divide between women in full-time and women in part-time work. Even in 2006, only 44% of women in part-time work reported that the internet had some importance for their job, compared to 67% of full-timers.
In terms of the earlier definition of complexity, use of the internet is one aspect of the moderate or higher complexity categories of use. In order to further differentiate levels of complexity, we asked people about what they did when their job involved use of the internet. They were given the following set of options: communicate with colleagues by e-mail; communicate with others outside your organisation by e-mail; seek information about your organisation; seek information about products or services from potential suppliers; deliver information or knowledge to clients or customers; deliver a product or service to clients or customers; buy or sell products or services; update web pages; and design or construct web-sites. Respondents could mention as many uses of the internet as they liked. The results for all answers are presented in Table 5.14. These confirm that the use of computerised technology is predominantly of a ‘moderate’ level of complexity.
Communication with colleagues within the organisation by e-mail was overwhelmingly the most commonly cited use – mentioned by two-thirds of internet users in 2001. It further increased to 72% in 2006. The next most frequently mentioned type of use (given by 58% of users) was external communication by e-mail, which also showed a marked increase to 64% by 2006. Similarly, there was a substantial growth in the proportion of workers who used it to get information about their own organisation (from 36% to 46%), to get information from suppliers (44% to 50%) and to deliver information to clients (39% to 47%). More active e-business was much less frequent, but also increased between 2001 and 2006. Whereas only 20% used the internet to deliver products to customers and 16% to buy or sell products in 2001, by 2006 the figures had increased to 27% and 21% respectively. The only form that has not increased was internet use which involved programming – either to design web pages or to update them. In both years they were reported by a small minority of respondents (7% and 14% respectively in 2006).
101

In 2001, as with computer use more generally, men were more likely to make advanced use of the internet than women. By 2006 there was little sex difference with respect to the use of email, and women were even more likely to search information on their own organisations than men. Apart from these, however, men remained more likely to use the internet in other ways than women. The self-employed, while less likely to use internal email or check information on their own organisations, were more likely to use the internet in other ways than employees.
As with computerised equipment more widely, there were marked occupational group and industry differences in internet use. As can be seen in Table 5.15, it was most central to the work of those in ‘Professional’ occupations – indeed nearly 70% reported that use of the internet was either ‘essential’ or ‘very important’ for their job in 2006. Around two thirds of ‘Managers’ (66%) and ‘Associate Professionals’ (62%) also considered it vital for their work. In contrast, less than 20% of those using it at work in ‘Skilled Trades’, ‘Personal Service’, ‘Plant and Machine Operative’ or ‘Elementary’ occupations saw it as of major importance to their job. Examining the trends from 2001 to 2006, it can be seen that the importance of internet increased substantially for all occupational groups, especially among the higher skilled. In terms of industrial sector, it was most crucial to people’s work in ‘Real Estate and Business Services’, ‘Finance’ and ‘Education’ – where around 60% of users regarded it as ‘essential’ or ‘very important’ for their job in 2006 (Table 5.16). By contrast, this was the case for only 18% of those using the internet in the ‘Hotel’ industry and 21% of those in ‘Construction’. As with the pattern for occupations, the increase was evident across all industrial sectors.
In short, the use of the internet covers a wide range of jobs. More complex internet uses are primarily found among those in higher occupational groups and among the self-employed. The increase from 2001 to 2006 in use of internet at work was substantial across all occupations and industries. However, the prevalence data conceal major variations in its function and importance in the work process.
5.5 Summary of Main Findings
• There has been a striking and continued increase since 1986 in the number of jobs in which advanced technology is used. The increase has slowed down over the last five years, indicating that the adoption of computerised and automated equipment is approaching saturation. However, there has been a marked increase over the last five years in the proportion of jobs in which computing is considered to be an ‘essential’ component of the job. Over 75% of people in employment now make use of some type of automated or computerised equipment, and computerised equipment is seen by 47% as an ‘essential’ feature of their work.
• These changes have affected the work of both men and women. There has been a sharp reduction of the gender gap in the use of advanced technologies. By 2006 there is no significance sex difference in terms of the use of advanced equipment at work, and women are even more likely to consider it ‘essential’ to their work than men. Nevertheless, men are more likely to be in jobs involving complex and advanced computer applications. There is also a major difference between women in full-time work, who are high users of computerised technologies, and female part-timers, who are less likely to use them. However, the gap has gradually narrowed over the last nine years.
102

• There are substantial differences in the use of computerised equipment according to occupation. There is widespread use of computers, and computers are especially important to the jobs, in ‘Professional’, ‘Managerial’, ‘Associate Professional’, and ‘Administrative and Secretarial’ occupations. Computers are much less important for jobs in ‘Plant and Machine Operative’, ‘Skilled Trades’, ‘Personal Service’ and ‘Elementary’ occupations. Similarly, complexity of use is strongly related to occupational group. Those in highly skilled occupations were not only more likely to make complex and advanced use of computerised equipment, but were also more likely to have experienced an increase in the job requirement for complex computing skills over time.
• There are substantial regional differences in the use of computing skills at work. The proportion of jobs for which computer skills are essential is 55% in London, 56% in the East of England and 54% in the South East. This compares with just 41% of jobs in Scotland, 44% in Wales and 42% in the East Midlands.
• The importance of internet use increased sharply over the last five years. The proportion of workers regarding the use of internet as ‘essential’ to their jobs doubled between 2001 and 2006. All forms of internet use (with the exception of designing/updating web pages) have become more prevalent with email now being used by over 70% of people in work. Although there is little sex difference in terms of email use, men are more likely than women to make use of the internet in other ways.
103

Table 5.1 Percentage Using Computerised or Automated Equipment in Their Job, 1986-2006
1986
1992
2001
2006 Employees and Self-Employed
N/A
53.3
71.5
75.1
Self-Employed
N/A 28.9 53.6 56.9
All Employees
40.3 56.0 73.7 77.4
Sex (Employees)
Men
46.0 58.8 73.1 76.7
Women
33.2 53.0 74.3 78.1
Contract Status(Women Employees) Full-time
44.0 61.2 83.0 83.9
Part-time
20.2 40.7 61.2 68.8
Age (Employees) 20-24
41.9 62.6 74.8 69.6
25-34
46.3 59.8 76.0 80.6
35-44
42.0 58.2 77.0 80.6
45-54
34.3 48.4 71.9 76.2
55-60
24.3 38.3 59.8 71.9
Note: The question was only asked of employees in 1986.
104

Table 5.2 Percentage of Employees Using Computerised or Automated Equipment in Their Job by Occupation, 1986-2006
Occupation1
1986
1992
2001
2006
Managers 54.4 80.1 89.7 96.4
Professionals 60.5 78.6 92.0 94.9
Associate Professionals 41.6 66.3 86.8 94.2
Administrative & Secretarial
61.5 81.0 95.8 97.2
Skilled Trades 32.0 33.7 48.0 57.2
Personal Service 11.1 25.2 36.6 47.4
Sales 29.8 57.9 86.4 82.2
Plant & Machine Operatives 27.8 39.1 53.9 53.0
Elementary 21.6 23.4 37.2 40.8
Notes: 1. Occupations are classified by SOC2000 Major Groups. 2. As the question was only asked to employees in 1986, the comparison over the period 1986 to 2006 has excluded the self-employed. Figures for 1992 and 2001 differ from the 2001 Skills Report (Felstead et al., 2002) which included both the employed and self-employed in the calculations.
105

Table 5.3 Percentage of Employees Using Computerised or Automated Equipment in Their Job by Industry, 1986-2006
Industry1
1986
1992
2001
2006
Manufacturing
45.2 54.9 70.2 77.2
Construction
21.9 25.0 41.6 52.4
Wholesale & Retail 37.5 55.6 77.2 78.6
Hotels & Restaurants 16.6 27.1 49.7 50.5
Transport & Storage 44.0 61.8 75.3 68.0
Finance 76.7 89.0 96.6 98.6
Real Estate & Business Services
37.3 53.4 84.5 85.7
Public Administration 45.0 70.2 87.2 86.1
Education 36.7 57.7 79.9 87.9
Health & Social Work 29.7 53.7 61.4 70.4
Personal Services 24.9 33.9 60.8 75.7
Note: 1. Industries are classified by SIC92; only those with sample size above 100 are shown. Figures for 1992 and 2001 differ from the 2001 Skills Report (Felstead et al., 2002) which included both the employed and self-employed in the calculations.
106

Table 5.4 Percentage of Employees Using Computerised or Automated Equipment in Their Job by Region, 2006
Region
2006
North East
78.0
North West
76.4
Yorkshire and the Humber 71.3
East Midlands 73.4
West Midlands 74.2
East of England 83.2
London 82.4
South East 81.3
South West 75.9
Wales 72.9
Scotland 73.5
Note: 1. The sample includes 20-65 year olds, employees and self-employed.
107

Table 5.5 Importance of Use of PC or Other Types of Computerised Equipment to Job, 1997-2006
Essential
(%)
Very Important
(%)
Fairly important
(%)
Not very important
(%)
Not at all important
(%)
All
1997 30.8 14.8 12.2 11.7 30.5
2001 39.7 14.8 13.8 10.5 21.1
2006 47.2 14.7 11.6 9.4 17.0
Men
1997 27.5 15.4 13.0 14.2 29.8
2001 38.5 14.7 14.5 11.2 21.1
2006 44.8 15.0 12.7 10.4 17.1
Women
1997 34.8 13.9 11.3 8.5 31.4
2001 41.4 15.0 13.1 9.7 21.2
2006 50.0 14.3 10.4 8.4 17.0
Contract Status (women)
Full-time 1997 42.9 16.6 12.2 7.8 20.6
Full-time 2001 49.5 16.4 12.9 8.1 13.0
Full-time 2006 57.0 13.5 9.9 7.3 12.4
Part-time 1997 23.9 10.4 10.2 9.5 45.9
Part-time 2001 28.8 12.8 13.3 12.0 33.1
Part-time 2006 38.8 15.6 11.4 10.0 24.2
108

Table 5.6 Percentage Reporting Use of PC or Other Types of Computerised Equipment ‘Essential’ in Their Job by Occupation, 1997-2006
Occupation1
1997
2001
2006 Change
1997-2006
Managers 37.8 52.6 68.7 30.9
Professionals 39.1 53.3 66.9 27.8
Associate Professionals 41.9 49.1 62.2 20.3
Administrative & Secretarial 57.0 75.1 81.9 24.9
Skilled Trades 12.5 14.3 18.4 5.9
Personal Services 7.3 10.8 12.1 4.8
Sales 43.7 39.6 45.7 2.0
Plant & Machine Operatives 14.8 15.0 21.9 7.1
Elementary 11.1 10.5 11.9 0.8
Note: 1. Occupations are classified by SOC2000 Major Groups.
109

Table 5.7 Percentage Reporting Use of PC or Other Types of Computerised Equipment ‘Essential’ in Their Job by Industry, 1997-2006
Industry1
1997
2001
2006 Change
1997-2006
Manufacturing 33.1 35.5 48.0 14.9
Construction 11.4 19.0 19.4 8.0
Wholesale & Retail 33.4 32.3 41.4 8.0
Hotels & Restaurants 13.8 16.6 19.3 5.5
Transport & Storage 25.6 44.5 41.2 15.6
Finance 70.1 76.3 85.9 15.8
Real Estate & Business Services 47.5 64.0 65.8 18.3
Public Administration 42.5 54.4 61.6 19.1
Education 25.0 37.4 49.0 24.0
Health & Social Work 18.1 34.4 41.8 23.7
Personal Services 22.8 31.8 33.5 10.7
Note: 1. Industries are classified by SIC92; only those with sample size above 100 are shown.
110

Table 5.8 Percentage Reporting Use of PC or Other Types of Computerised Equipment ‘Essential’ in Their Job by Region, 2006
Region
2006
North East
40.1
North West
46.4
Yorkshire and the Humber 50.8
East Midlands 42.3
West Midlands 47.1
East of England 55.7
London 55.0
South East 53.9
South West 50.5
Wales 43.9
Scotland 40.8
Note: 1. The sample includes 20-65 year olds, employees and self-employed.
111

Table 5.9 Whether Change in Importance of Computing Skills in Own Job in Last Five/Four/Three Years, 2006
Increase
(%) Little/No Change
(%) Decrease
(%)
All 49.5 43.3 7.2
Men 47.0 45.7 7.3
Women 52.5 40.5 7.0
Employment Status
Employed 51.0 41.9 7.2
Self-Employed 38.2 54.5 7.3
Contract Status (Women)
Full-time 56.6 38.3 5.1
Part-time 46.0 43.9 10.1
112

Table 5.10 Complexity of Use1 of Computers or Computerised Equipment, 1997-2006
Simple
(%) Moderate
(%) Complex/Advanced
(%)
All
1997 38.1 39.1 22.8
2001 30.7 45.8 23.6
2006 26.0 45.5 28.5
Men
1997 37.5 34.7 27.8
2001 27.3 43.3 29.4
2006 25.2 39.7 35.1
Women
1997 38.8 44.5 16.7
2001 34.6 48.7 16.6
2006 26.9 51.9 21.2
Contract Status (Women)
Full-time 1997 30.9 47.0 22.1
Full-time 2001 27.0 52.1 20.8
Full-time 2006 23.2 52.3 24.5
Part-time 1997 54.9 39.3 5.8
Part-time 2001 49.6 42.0 8.5
Part-time 2006 33.9 51.3 14.8
Note: 1. Asked of those for whom use of computerised equipment was in the response set range ‘essential’ to ‘not very important’.
113

Table 5.11 Complexity of Use of Computers or Computerised Equipment by Occupation, 1997-2006
1997 2001 2006
Occupation1 Advanced/ Complex
(%)
Simple
(%)
Advanced/ Complex
(%)
Simple
(%)
Advanced/ Complex
(%)
Simple
(%)
Managers 29.6 30.1 31.0 19.1 34.0 14.9
Professionals 34.7 20.3 36.4 11.9 39.5 9.2
Associate Professionals
34.5 25.7 26.6 23.2 40.0 17.5
Administrative & Secretarial
17.0 29.9 20.1 21.1 27.8 15.4
Skilled Trades 19.6 58.0 20.3 50.2 23.2 40.1
Personal Service 9.1 72.4 10.5 51.0 7.3 45.2
Sales 11.4 52.1 7.8 60.2 10.5 51.7
Plant & Machine Operatives
11.6 62.5 10.3 67.7 15.9 55.4
Elementary 13.8 55.9 9.7 65.4 3.1 68.5
Note: 1. Occupations are classified by SOC2000 Major Groups.
114

Table 5.12 Complexity of Use of Computers or Computerised Equipment by Industry, 1997-2006
1997 2001 2006 1997 2001 2006
Industry Advanced/
Complex (%)
Simple
(%)
Advanced/
Complex (%)
Simple
(%)
Advanced/
Complex (%)
Simple
(%)
Manufacturing 29.5 36.3 27.8 34.0 39.7 26.4
Construction 11.8 56.8 23.3 26.3 18.6 39.9
Wholesale & Retail 10.7 60.1 13.2 53.0 14.4 49.9
Hotels & Restaurants 9.6 44.2 12.5 55.9 17.6 50.0
Transport & Storage 22.2 44.0 25.9 37.1 24.9 36.5
Finance 34.5 17.7 30.2 14.9 41.6 9.7
Real Estate & Business Services
38.6 16.0 43.8 13.6 43.3 10.6
Public Administration 21.7 25.0 20.8 15.6 28.0 17.2
Education 16.8 30.4 18.9 24.3 27.6 15.4
Health & Social Work 12.5 50.6 11.1 40.3 19.2 26.6
Personal Services 31.3 29.5 15.2 28.2 20.1 27.2
Note: 1. Industries are classified by SIC92: only those with sample size above 100 are shown.
115

Table 5.13 Importance of Use of the Internet in the Job, 2001-2006 Essential
(%)
Very Important
(%)
Fairly Important
(%)
Not Very Important
(%)
Not at All Important
(%)
All (2001) 13.3 10.9 14.4 16.2 45.2
All (2006) 26.8 15.3 14.6 14.1 29.2
Men (2001) 14.8 12.2 13.6 15.9 43.5
Men (2006) 26.7 15.0 14.1 15.1 29.2
Women (2001) 11.5 9.4 15.3 16.6 47.2
Women (2006) 26.9 15.7 15.3 12.9 29.2
Contract Status (Women, 2001)
Full-time 14.9 12.5 18.7 17.6 36.3
Part-time 6.5 4.9 10.3 15.2 63.1
Contract Status (women, 2006)
Full-time 32.6 18.0 16.3 11.5 21.6
Part-time 17.9 12.1 13.6 15.2 41.2
116

Table 5.14 Type of Use of the Internet, 2001-2006
Internet Use
All
(%)
Men
(%)
Women
(%)
Employed
(%)
Self- Employed
(%) Internal E-Mail (2001) 65.4 67.6 62.6 67.3 49.5
Internal E-Mail (2006) 71.6 70.2 73.2 73.6 55.1
External E-Mail (2001) 57.5 62.1 51.4 57.4 58.2
External E-Mail (2006) 63.5 64.2 62.6 63.3 64.9
Information on Own Organisation (2001)
36.4 36.9 35.6 38.4 18.8
Information on Own Organisation (2006)
45.8 43.7 48.1 46.9 36.7
Information on Suppliers (2001)
44.3 48.3 39.0 43.4 51.3
Information on Suppliers (2006)
49.7 53.3 45.5 47.8 64.9
Delivering Information To Clients (2001)
39.4 43.9 33.5 38.7 44.8
Delivering Information To Clients (2006)
47.4 50.0 44.5 46.3 56.7
Delivering Products To Clients (2001)
19.8 24.0 14.4 18.9 27.1
Delivering Products To Clients (2006)
27.1 30.3 23.4 26.3 33.4
Buy/Sell Products or Services (2001)
16.3 18.9 12.8 14.4 32.0
Buy/Sell Products or Services (2006)
20.8 23.9 17.3 18.5 39.6
Update Web Pages (2001) 13.5 15.1 11.6 13.1 17.3
Update Web Pages (2006) 13.5 16.1 10.6 13.0 18.0
Design Web Pages (2001) 8.6 11.3 5.1 8.0 13.9
Design Web Pages (2006) 7.0 8.9 4.8 6.4 11.7
117

Table 5.15 Percentage Reporting Use of the Internet ‘Essential’ or ‘Very Important’ in Their Job by Occupation, 2001-2006
Occupation1
Internet ‘Essential’ or ‘Very Important’ in Job
(2001)
Internet ‘Essential’ or ‘Very Important’ in Job
(2006) Managers 36.5 65.8
Professionals 47.9 68.8
Associate Professionals 37.9 62.4
Administrative & Secretarial 28.4 56.5
Skilled Trades 9.7 17.8
Personal Service 5.4 16.3
Sales 16.0 32.0
Plant & Machine Operatives 3.8 10.7
Elementary 3.1 7.8 Notes: 1. Occupations are classified by SOC2000 Major Groups.
118

Table 5.16 Percentage Reporting Use of the Internet ‘Essential’ or ‘Very Important’ in Their Job by Industry, 2001-2006
Industry1
2001
2006
Manufacturing 20.8 36.5
Construction 10.8 20.7
Wholesale & Retail 15.1 33.6
Hotels & Restaurants 8.7 18.0
Transport & Storage 24.7 35.7
Finance 38.0 61.1
Real Estate & Business Services
44.0 61.9
Public Administration 32.1 49.8
Education 34.0 57.1
Health & Social Work 13.1 39.3
Personal Services 23.5 39.1
Note: 1. Industries are classified by SIC92: only those with sample size above 100 are shown.
119

CHAPTER 6 EMPLOYEE TASK DISCRETION
6.1 Introduction
It is often argued that skills are closely linked to levels of task discretion for employees – that is to say greater control over the detailed execution of the job. This is thought to reflect the need to motivate employees who are carrying out more complex work and greater difficulties in externally monitoring more skilled work. Discretion offers the potential productive advantages of flexibility, together with better use of employees’ judgement and skill. This putative connection between task discretion and skill has been assumed or proposed by writers from diverse social scientific traditions (e.g. Blauner, 1964; Braverman, 1973; Zuboff, 1988). In recent years, management theorists have also argued that workers should be ‘empowered’, as their skills and responsibilities are broadened. Recent research showed that employee task discretion indeed increased in some European countries (e.g., Sweden and Germany) over the 1990s (Gallie, 2007); while an earlier increase is also recorded for Finland (Lehto and Sutela, 1999). In contrast, previous research in Britain showed a decline in choice and discretion at work (Gallie et al., 2004).
It has been seen in earlier parts of the Report that skills have risen in Britain over the last two decades. In this chapter we examine the proposed connection between skill and discretion, and consider whether there has been a corresponding increase in the extent of task discretion. The survey included four detailed questions that assess how much personal influence people thought they had over specific aspects of their work: how hard they worked, deciding what tasks they were to do, how the task was done, and the quality standards to which they worked15. These permitted comparison over the period 1992 to 2006. The results for employees are presented in Table 6.1.
6.2 Change in Task Discretion
The questions on task discretion are designed to provide a picture of the extent of influence that employees had over specific aspects of their work task. It is clear that influence was felt to be highest with respect to work effort and quality standards, where half of all employees thought they had a great deal of influence in 2006, and lowest with respect to decisions about which tasks were to be done and how to do the task, where this was the case for only 29% and 43% respectively. The extent of task discretion was, as expected, related positively to other broad measures of job skills. For example, in those jobs which required a qualification of at least level 3, half of employees reported a great deal of influence over how to do their work, whereas in jobs requiring no qualifications only 39% felt they could exercise a great deal of influence. The task discretion indicators were also positively related to the extent of previous training, and to the extent of the
15 The question format was: ‘How much influence do you personally have on …how hard you work; deciding what tasks you are to do; deciding how you are to do the task; deciding the quality standards to which you work?’
120

Required Learning Time Index. This finding confirms the view that skill and task discretion are related as expected.
Despite the fact that discretion is positively correlated with skill, comparison of the pattern for 2006 with that for earlier years points not to a rise, but to a general decline, in employee task discretion over time. Between the 1992 and 2001, there was a decline of 14 percentage points in the proportion feeling that they had a great deal of influence over how they do their work. Since 2001, however, the level of discretion has levelled off.
To provide an overall picture from the different items measuring task discretion, a summary index was constructed by giving a score ranging from 0 (no influence at all) to 3 (a great deal of influence) and then taking the average of the summed scores.16 As can be seen in Figure 6.1 and in the last row of Table 6.1, the index score for task discretion declined from 2.43 in 1992 to 2.25 in 1997 and then to 2.18 in 2001. Between 2001 and 2006 it remained constant.
Figure 6.1 Employee Task Discretion Index, 1992-2006
2
2.05
2.1
2.15
2.2
2.25
2.3
2.35
2.4
2.45
2.5
All Males Females
Task
Disc
retio
n In
dex
1992199720012006
Source: Table 6.1.
Taking the longer time period (1992 to 2006), the decline in task discretion was sharpest with respect to work effort and quality standards. For the first three aspects of task control - over work effort, decisions about which tasks to do and how to do the task - the decline was continuous between the first three surveys, although control over work effort declined particularly sharply between 1997 and 2001. With respect to control over work quality, the change occurred primarily between 1992 and 1997. From 2001 onwards, however, there was no further significant change in any of the four aspects of task discretion. 16 The index was statistically robust, with an overall alpha of .78.
121

6.3 Sex, Contract Status and Control
The decline in task discretion from 1992 to 2006 was similar for men and women. Taking the items tapping particular aspects of control, there was little difference between the sexes on any of the measures in 1992 and this remained the case in 2006, except for control over ‘how to do the task’ where men had a somewhat higher level of job control than women (Table 6.2). The decline in the overall task discretion index is however very similar indeed for both sexes (see Figure 6.1). For men, it decreased from 2.43 to 2.18 and for women from 2.44 to 2.18.
The figures for female employees however conceal a substantial difference by contract status (Table 6.3). On all measures and in all years, female part-timers had considerably lower levels of job control than female full-timers. Taking 2006, the point difference was 12 percentage points with respect to influence over work efforts and 8 percentage points with respect to how to do the task. Examining the trend over time, part-timers had witnessed a sharper reduction of influence over their job than full-timers before 2001. The summary index for the specific aspects of control shows a decline between 1992 and 2001 of 0.24 for female full-timers compared with 0.30 for female part-timers. From 2001 onwards, however, the trend was reversed. By 2006 the relative position of part-timers to full-timers is quite similar to that in 1992.
6.4 Occupation and Industry
Job control is strongly related to occupational group. For instance, in 2006, the summary index of task discretion was 2.51 among managers, compared to 1.87 among operatives and 1.81 among elementary workers. In 2001, similarly, the task discretion index ranged from 2.58 among ‘Managers’ to 1.86 among ‘Plant and Machine Operatives’. This finding is also consistent with the argument that task discretion and skill are positively associated.
From 1992 to 2006 the decline in job control occurred across all occupational groups (Table 6.4). There were variations in the extent to which this was the case. Those in ‘Skilled Trades’ occupations were the least affected, with the index of task discretion declining from 2.37 in 1992 to 2.25 in 2006. In contrast, the loss of job control was particularly striking for elementary workers (2.24 to 1.81), personal service workers (2.57 to 2.18) and associate professionals (2.60 to 2.25). Further, examining the recent trends, these occupational groups (together with managers) experienced a further erosion of job control from 2001 to 2006 whilst the level of task discretion levelled off or slightly risen among employees in other occupations.
The reduction of job control over the last two decades was also widespread across different industrial sectors. A comparison of the index of task discretion between 1992 and 2006 (Table 6.5) shows a particularly high loss of job control in ‘Education’ and ‘Finance’. In 1992, ‘Education’ ranked as the sector with the highest level of task discretion. However, by 2006 the index fell from 2.59 to 2.25, below ‘Personal Services’ and close to ‘Construction’, ‘Real Estate and Business Services’ and ‘Health and Social Work’. Similarly, ‘Finance’ also saw a very sharp erosion of task discretion. In 1992, employees in the finance industry had about the average level of task discretion among all industrial sectors. By 2006, the index of task discretion declined to 2.09, only higher
122

than ‘Transport and Storage’ (2.03) and very close to ‘Hotel and Restaurants’ (2.08). Since 2001, the fastest decline occurred in ‘Finance’, ‘Hotels and Restaurants’ and ‘Health and Social Work’.
6.5 External Control over Work Performance
If individuals’ own control over the job task has been reduced, what types of external control have become more important? The view that increased skills would be accompanied by greater employee task discretion was usually linked to the view that detailed monitoring by supervisors would become less close. The balance of control was largely understood as lying between the relative discretion of the individual and the supervisor. Given that employee task discretion diminished, was this then reflected in tighter supervisory control?
A question was included in the survey to examine this. It asked people: ‘How closely are you supervised in your job?’ The response options were ‘very closely’, ‘quite closely’, ‘not very closely’ and ‘not at all closely’. The question replicated items that had been placed in surveys in 1986, 1997 and 2001. The results for the four dates are given in Table 6.6.
A first point to note is that there is little evidence that tight supervisory control increased substantially between 1986 and 2006. Taking those who said that they were either very or quite closely supervised, the proportion was 35% in 1986 and 38% in 2006. Where there was a more marked change was in the proportions at the other end of the scale, that is those who were either ‘not very closely’ or ‘not at all closely supervised’. There was a continuous decline in the proportion of employees who received almost no supervision. In 1986, these constituted just under a third (31%) of all employees, whereas by 2006 they were only 20%. The overall index suggests that the period 1986 to 2001 was characterised by an increased influence of supervision, while the trend was reserved somewhat by 2006.
Although supervision has received particularly close attention as a constraint on task discretion, there are clearly other factors that can limit people’s capacity to carry out their jobs in the way they want. To examine this, people were asked which of a range of factors were ‘important in determining how hard you work in your job’. These included a machine or assembly line; clients or customers; a supervisor or boss; pay incentives; and reports and appraisals. They were asked to choose as many factors as were relevant. This question can be compared with results from 1986 to 2006 (Table 6.7).
Figure 6.2 contrasts these sources of influence in 1986, 2001 and 2006. With one exception, all forms of external control were more frequently mentioned in 2001 than had been the case in 1986. The only factor that had declined in importance as a constraint on job performance was that of the constraints of machinery or of an assembly line. The strongest rise had been in the influence of ‘fellow workers’ – an increase of 21 percentage points between 1986 and 2001. This was followed by the influence of clients (20 percentage points), of supervisors (16 percentage points) and reports and appraisals (15 percentage points). From 2001 onwards, however, all forms of control showed a decline, with the fall particularly notable for ‘fellow workers’ (7 percentage points). Taken together with the trends in task discretion, the evidence suggests that the loss of a sense of individual job control by employees from 1992 to 2001 was likely be related to a
123

growth in a wide variety of external constraints that have affected job performance. When these constraints were loosed, the decline in individual task discretion levelled off.
Figure 6.2 Sources of Control Over Effort, 1986, 2001 and 2006
0
10
20
30
40
50
60
Machine Clients Supervisor FellowWorkers
Pay Reports/Appraisals
% M
entio
ning
For
ms
of E
ffor
t Con
trol
1986
2001
2006
Source: Table 6.7.
6.6 Summary of Main Findings
• More skilled jobs typically require higher levels of discretion over job tasks. Despite this, the rise in skills among employees over the last two decades has not been accompanied by a corresponding rise in the control they can exercise over their jobs. Between 1986 and 2001 there was a marked decline in task discretion for both men and women. Since 2001 there has been no further change in employee task discretion.
• In all years the level of job control exercised by women in full-time jobs was substantially greater than that exercised by women in part-time jobs. Moreover, there was an increased polarisation of the quality of jobs in this respect between 1992 and 2001, when the level of task discretion declined faster for part-timers than for full-timers. Over the last five years the trend has been somewhat reversed.
• The reduction of task control was general across occupational groups between 1992 and 2001, but there were considerable variations in the extent to which it occurred. ‘Skilled Trades’ workers were relatively unaffected, whereas ‘Elementary Workers’, ‘Personal Service Workers’ and ‘Associate Professionals’ witnessed a particularly sharp decline in their control over the period. These occupational groups (together with managers) experienced a further erosion of job control from 2001 to 2006, whereas task discretion stopped falling or increased somewhat among other occupational groups.
• The decline of task discretion was also evident across all industries. Between 1992
124

and 2006 it was particularly notable in ‘Education’ and ‘Finance’. Since 2001, the fastest decline occurred in ‘Finance’, ‘Hotels and Restaurants’ and ‘Health and Social Work’.
• Reduced personal discretion in jobs over the last two decades has been partly matched by rises in external sources of control. There was some evidence of an increase of supervision, although there was little increase in close supervisory practices. There was also a rise between 1986 and 2001 in the importance of certain non-hierarchical constraints on individual job performance – notably by fellow workers and by clients or customers. Since 2001, however, these forms of external control appeared to have been loosened. This is consistent with the levelling off of the decline in task discretion.
125

Table 6.1 Employee Task Discretion, 1992-2006 1992
(%) 1997 (%)
2001 (%)
2006 (%)
Influence Over How Hard to Work A Great Deal 70.7 64.4 50.6 52.5 A Fair Amount 23.2 28.8 39.2 38.2 Not Much 4.9 4.7 8.6 7.2 None At All 1.2 2.0 1.6 2.1 Influence Over What Tasks Done A Great Deal 42.4 33.1 30.5 28.7 A Fair Amount 33.5 36.2 35.7 37.2 Not Much 15.4 20.6 22.1 23.4 None At All 8.7 10.0 11.7 10.6 Influence Over How To Do Task A Great Deal 56.9 49.7 42.8 42.7 A Fair Amount 30.9 34.5 40.4 39.2 Not Much 8.4 10.2 11.0 12.6 None At All 3.9 5.6 5.8 5.5 Influence Over Quality Standards A Great Deal 69.6 51.1 51.7 51.1 A Fair Amount 23.1 28.4 32.0 30.7 Not Much 4.8 12.6 10.4 11.8 None At All 2.6 7.9 5.9 6.4 Overall Task Discretion Index1
All 2.43 2.25 2.18 2.18 Note: 1. The task discretion index is computed as the summed average score of the four ‘task influence’ questions, with a highest score of 3 and a lowest score of 0.
126

Table 6.2 Influence Over Employee Task Characteristics by Gender, 1992-2006 1992
(%) 1997 (%)
2001 (%)
2006 (%)
Great Deal of Influence Over How Hard to Work Men 70.1 64.6 51.1 51.5 Women 71.4 64.2 50.0 53.6 Great Deal of Influence Over What Tasks Done Men 40.9 33.0 30.3 28.4 Women 44.0 33.3 30.7 29.0 Great Deal of Influence Over How To Do Task Men 57.2 51.2 45.0 44.4 Women 56.5 48.1 40.3 40.9 Great Deal of Influence Over Quality Standards Men 69.1 52.5 52.1 51.0 Women 70.1 49.6 51.3 51.3 Overall Task Discretion Index Men 2.43 2.26 2.19 2.18 Women 2.44 2.24 2.17 2.18
127
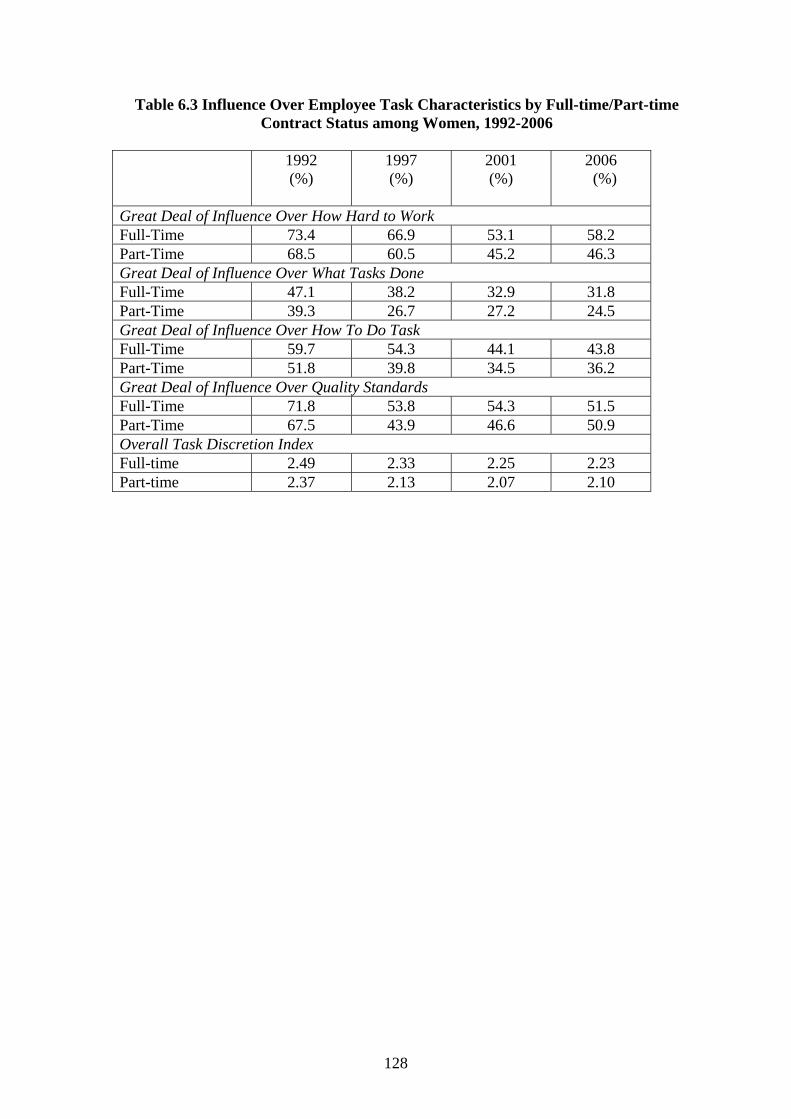
Table 6.3 Influence Over Employee Task Characteristics by Full-time/Part-time Contract Status among Women, 1992-2006
1992
(%) 1997 (%)
2001 (%)
2006 (%)
Great Deal of Influence Over How Hard to Work Full-Time 73.4 66.9 53.1 58.2 Part-Time 68.5 60.5 45.2 46.3 Great Deal of Influence Over What Tasks Done Full-Time 47.1 38.2 32.9 31.8 Part-Time 39.3 26.7 27.2 24.5 Great Deal of Influence Over How To Do Task Full-Time 59.7 54.3 44.1 43.8 Part-Time 51.8 39.8 34.5 36.2 Great Deal of Influence Over Quality Standards Full-Time 71.8 53.8 54.3 51.5 Part-Time 67.5 43.9 46.6 50.9 Overall Task Discretion Index Full-time 2.49 2.33 2.25 2.23 Part-time 2.37 2.13 2.07 2.10
128

Table 6.4 Employee Task Discretion Index by Occupation, 1992-2006
Occupation1
1992
1997
2001
2006
Change 92-06
Change 01-06
Managers 2.71 2.61 2.58 2.51 -0.20 -0.07
Professionals 2.54 2.48 2.23 2.27 -0.27 0.04
Associate Professionals 2.60 2.38 2.30 2.25 -0.35 -0.05
Administrative & Secretarial 2.45 2.25 2.15 2.19 -0.26 0.04
Skilled Trades 2.37 2.29 2.18 2.25 -0.12 0.07
Personal Service 2.57 2.24 2.24 2.18 -0.39 -0.06
Sales 2.28 2.06 1.94 1.97 -0.31 0.03
Plant & Machine Operatives 2.16 1.90 1.86 1.87 -0.29 0.01
Elementary 2.24 2.04 1.92 1.81 -0.43 -0.11
Note: 1. Occupations are classified by SOC2000 Major Groups.
129

Table 6.5 Employee Task Discretion Index by Industry, 1992-2006
Industry1
1992
1997
2001
2006
Change 92-06
Change 01-06
Manufacturing 2.35 2.19 2.14 2.12 -0.23 -0.02
Construction 2.50 2.43 2.25 2.25 -0.25 0.00
Wholesale & Retail 2.41 2.18 2.18 2.16 -0.25 -0.02
Hotels & Restaurants 2.26 2.24 2.13 2.08 -0.18 -0.05
Transport & Storage 2.36 2.01 1.92 2.03 -0.33 0.11
Finance 2.45 2.29 2.15 2.09 -0.36 -0.06
Real Estate & Business Services 2.50 2.27 2.22 2.24 -0.26 0.02
Public Administration 2.44 2.33 2.15 2.15 -0.29 0.00
Education 2.59 2.37 2.27 2.25 -0.34 -0.02
Health & Social Work 2.49 2.35 2.29 2.24 -0.25 -0.05
Personal Services 2.44 2.38 2.27 2.28 -0.16 0.01 Note: 1. Industries are classified by SIC92: only those with sample size above 100 are shown.
130

Table 6.6 Closeness of Supervisory Control, 1986-2006
Closeness of Supervisory
Control Among Employees
1986 (%)
1997 (%)
2001 (%)
2006 (%)
Very closely
10.5
6.2
9.2
7.7
Quite closely
24.9
27.0
29.8
30.0
Not very closely
34.1
44.0
43.3
41.9
Not at all closely
30.6
22.8
17.7
20.4
131

Table 6.7 Forms of Control over Work Effort, 1986-2006
Forms of Control Over
Work Effort
1986 (%)
1992 (%)
1997 (%)
2001 (%)
2006 (%)
Machine 7.1 5.3 10.2 5.8 5.1
Clients 37.2 50.4 53.9 56.7 53.9
Supervisor 26.7 37.7 41.0 42.4 40.5
Fellow Workers 28.7 36.1 57.0 49.6 43.1
Pay 15.3 19.4 29.8 26.3 22.6
Reports/ Appraisals 15.3 27.3 23.6 30.4 28.1
132

CHAPTER 7 THE VALUE OF SKILLS
7.1 Introduction
We have found so far in this Report that, while two out of our three broad measures of skill requirements remained fairly stable over the five years from 2001 to 2006, a third measure indicated that training requirements had lengthened. Moreover, computing skills and several other generic skills measures have continued to grow in importance in British workplaces, with influence skill requirements and literacy requirements growing the fastest. These changes may be interpreted as reflecting a growing demand by employers, and raise the question as to whether the growth has resulted in bottlenecks in the labour market, putting these skills at a pay premium above the normal costs of acquiring the skills through education and training. If the demand grew faster than the supply, and there was no surplus of people available with the required skills, labour market competition might be expected to bid up the wages of those capable of carrying out the new more skilled tasks. We therefore wished to examine whether there is a labour market premium for any or each of our individual generic skill domains, and if so whether those premia have been changing in recent years.
Using data from the previous two surveys, it is reported in Felstead et al. (2002) that each of the broad skill indicators was associated with a pay premium in the labour market. Meanwhile, both computing and what we then referred to as high-level communication skills received a significant pay premium. Further analysis by Dickerson and Green (2004) revealed that this premium was robust to various alternative statistical treatments. Some evidence was also found from cross-section analyses that planning skills received a smaller but positive premium, but this evidence was not supported by further investigations which looked at how the pay and skills of different pseudo-cohorts changed between the two surveys. The jury is therefore still out as to whether planning skills were receiving a pay premium. Other generic skills were associated either with no significant pay premium, or else a negative premium.
In this chapter we report some findings of estimates of the value of generic skills in Britain, using the full range of generic skills, including the newly estimated domains of emotional and aesthetic skills. We also investigate if the values of skills have altered over the decade.
7.2 Measurement and Method
To find out the market value of each skill, it is necessary to combine all the measures of generic broad skills in a simultaneous analysis of pay determination. In this way, one can calculate the association between, say, planning skills and pay, while holding all other skills the same. The statistical technique for achieving this is ‘multiple regression’. The essence of this technique is that it measures the simultaneous associations of pay with the many skills (and other factors). The findings provide answers to questions like: ‘Suppose one job involved using planning skills at one unit higher on the importance scale than in another job, with all other skills and other characteristics the same, what would be the
133

difference between the two jobs in terms of their pay?’. One can regard this measure as the value of planning skills as revealed in the labour market. Simultaneous answers are provided for all the skills involved.
We included also in our analysis some ‘control variables’, designed to capture possible additional influences on pay that were not properly attributable to the skills indices. These were industrial sector, whether full time or part-time, the gender mix of the job, establishment size and region. It is common practice to include such variables, and we do not discuss here the estimated associations of these variables with pay except to state that they were in line with the findings of many other studies.
Because there is reason to expect from earlier studies that wages may be determined in different ways for men’s and women’s jobs, we looked at the valuations of job skills separately for men and women. We measured wages as hourly pay, but where an employee’s employer contributed to the employee’s pension fund, we augmented pay by 10 percent. The dependent variable in the multiple regression analysis was the logarithm of (hourly) pay.17 Using the logarithmic form is conventional, and enables the estimated associations to be phrased in terms of the percentage difference in pay associated with changes in the level of any independent variable. In discussing the findings, we convert changes in the logarithm of pay into percentage changes in pay.18
All measures of skill types are as used and described in earlier chapters.
7.3 Findings on the Value of Skills
We carried out two sets of analyses. In the first, we utilised only the 2006 data to estimate a ‘hedonic wage equation’, which is a multiple regression analysis where the key variables on the right-hand side of the equation are job characteristics, including the job’s skill requirements. In the second, we examined all three data sets, but for comparison purposes restricting the 2006 set to 20-60 year olds, and using only those skills measures common to all three surveys.
7.3.1 The Value of Skills in 2006
Focusing first on the analyses of the 2006 survey, these are presented in Table 7.1 in four columns, the first pair for females and the second pair for males. The first and third columns use all the data. The second and fourth columns include the index of management skills defined in Chapter 3; this analysis is restricted of necessity only to managers and supervisors. We begin by discussing the main findings that apply across the whole of the data, that is, columns (1) and (3).
17 To help to reduce possible measurement error we did not use observations where pay was more than 4 times, or less than a quarter, of the level predicted by a simple earnings function prediction. We also trimmed the distribution by dropping the observations in the top 0.5%: this device helps to eliminate non-linear effects that might be derived from a highly-skewed pay distribution, with a few extremely highly-paid individuals biasing the estimates that apply to the large majority. 18 If a coefficient on a variable which changes by 1 is given by x, then the percentage change is given by 100*(ex-1); for low values of x (below 0.1) this approximates to 100*x.
134

The first finding is that there is a significant and substantial value in the labour market for two generic skills: influence skills and computing skills.
In the former case, the estimates imply that moving up one point difference in the importance scale – for example, between ‘fairly important’ and ‘very important’ – is associated with a pay premium of 7% for females and 8% for males. It should be recalled that this difference is found after allowing for the differences in jobs attributable to educational requirements, and other broad skills measures. The estimate is evidence that employers will pay for the necessary generic skills over and above what is necessary to hire employees with the right broad skills.
In the latter case, it can be seen that the skills needed to use computers at a ‘complex’ level of sophistication (examples are statistical analysis software or computer-aided design packages) are associated with an 18% pay premium for females over similar people in otherwise identical jobs that do not require the use of computers at all, with the premium increasing with the level of sophistication required. The equivalent for males is a 12% premium for ‘complex’ computer skills, but in their case the premium does not rise beyond the ‘complex’ level.
It is possible that these estimated associations do not reflect a causal impact on pay. Perhaps jobs with high communication skills demands and/or high computing demands are simply given to those people with high ability who were in any case getting high pay. Early analyses of computing skills implied such a possibility (Dinardo and Pischke, 1997). However, in separate ways Dickerson and Green (2004) and Dolton and Makepeace (2004) have shown that during the 1990s a genuine causal computer skills premium did exist in the British labour market: those with, or prepared to acquire, the needed computing skills, did indeed receive more pay. In the case of Dickerson and Green (2004) this claim is made for both the high-level communication skills and computing skills, partly by allowing for very many job characteristics to affect pay, using the rich data available in the earlier surveys; and partly by examining groups of workers between 1997 to 2001 in a cohort analysis. Dolton and Makepeace (2004) also used longitudinal data to firm up their conclusions about computer skills’ link with pay. On the basis of this earlier literature, we interpret the findings here with the 2006 data also in a causal way: we think that the soundest interpretation is that these generic skills do require employers to pay a premium in the labour market.
For females a small positive premium of 2.5% may also be observed in respect of planning skills. In the same earlier study by Dickerson and Green, planning skills had a similar association with pay in the cross-section analysis, but no effect could be detected when it came to the robustness testing using cohort analysis. We therefore conclude that the link observed here may also not be causal: to confirm this finding would require further research. In the case of males, no significant premium for planning skills is detectable at all.
The skills needed, for example, to lift heavy objects are arguably acquired at very little or no cost, so one would not expect to see a substantial positive pay premium associated with physical skills. However, in the case of physical skills a negative, rather than a zero association with pay is found. That is, other things equal, jobs where these skills are less important pay more than jobs where the skills are more important. We think that the most likely interpretation of this finding is down to physical skills being associated with other aspects of jobs linked to lower pay, possibly including low levels of other skills that are not observed in the data: if so, the use of more physical skills would be associated with
135

lower pay, but not be the cause of that lower pay. The same conclusion was drawn from the analysis of the previous surveys (Felstead et al., 2002: 76).
Columns (1) and (3) also show that none of the other generic skills are associated with premia in the labour market. This conclusion extends to the new skills measures introduced in the 2006 survey. Neither emotional skills nor aesthetic skills are associated with statistically significant pay premia. In a separate analysis not shown in the table we also included the usage of foreign language skills in the regression; this measure also had no significant association with pay, and did not affect the other estimates significantly. We interpret these findings as showing that the generic skills are not in short supply. Despite the modest increases in all generic skills (except physical skills) recorded in Chapter 4, in most cases the supply appears to have been sufficient to prevent employers having to pay premia over and above what they pay to meet their broad skills requirements.
In columns (2) and (4) it may be seen that, among managers and supervisors, there is a pay premium for jobs that use more management skills: a one-point difference in the importance level of management skills is associated with an estimated 4% premium for females, 7% for males. Some of this premium is undoubtedly related to the different requirements of managers’ and supervisors’ jobs (see Table 3.12). Note also that the premia associated with the other generic skills largely follows the same pattern as for the whole sample.
Table 7.1 also gives the estimates of what employers pay to obtain their broad skills requirements. As can be seen, unsurprisingly there are significant and substantial pay premia in jobs where a degree-level qualification is required in new recruits. Beyond Level 2, the premia increase with the required qualification level for both females and males. At degree level the estimate of the premium is 56% for females and 48% for males, compared with jobs that require no qualifications. At level 2 and below, however, there is no premium associated with the qualification requirement.
The table also shows returns to the other indicators of broad skills. Among females, jobs with very low amounts of prior training time (under one month or none) have lower pay than jobs requiring intermediate amounts of training time. Among males, however, there is no significant association with training time requirements. There is also a return to the third indicator of broad skills, the length of time required to learn to do the job well. Jobs requiring a long time (over two years) to learn to do well receive a pay premium for both males and females and, for the latter, jobs requiring a very short time (less than one month) receive lower pay, compared to jobs requiring intermediate learning times.
Overall the skills requirements of the jobs together with the control variables account for 62% of the variance of pay in female jobs and 58% in male jobs. These proportions are reasonably high compared with typical estimates of earnings functions in the economic literature, based on the human capital acquired by jobholders and not including the requirements of jobs. Nevertheless, they are a reminder that there remain substantial parts of the variation in pay that have not been accounted for by the observed variables in the data set.
136

7.3.2 Changes in the Value of Generic Skills, 1997 to 2006
While the existence and magnitude of the premium attached to a generic skill at a point in time gives a snapshot of its value at that time, it is possible to put more than one labour market interpretation on that finding. The premium for a skill might be a short-term consequence of an accelerated demand for that skill which cannot yet be met. It might also be a long-term consequence of the fact that, over and above education costs, the costs of acquiring the skill needs to be rewarded, otherwise people will not have an incentive to acquire it. A third interpretation is that the premium could be an economic rent, that is, a return to a scarce skill which only some have, and which cannot be acquired by others no matter how much education or training they received. In that case the return would also be maintained in the long term.
By looking at how the value of skills evolves over time one can gain a better understanding of which of these interpretations is more likely to be relevant. For example, if a basic level of computing skills can be acquired at relatively low cost in the long term, one might expect to find that the premium associated with basic computing skills that was found with the earlier data would diminish over time. This would be equivalent to the long-term decline in any skill which is at first scarce, and later becomes more commonplace – driving skill is a historical example. It is thus of interest to examine how the values of computing and all the other generic skills have evolved over the recent 9-year period.
In previous reports, estimates of the value of skills were based on the 20 to 60 age bands, and on a different method for calculating generic skills indices. To investigate how the values may have changed over 1997 to 2006 we have re-estimated wage equations for the previous years, using the 2006-defined indices and the same age band of 20 to 60 throughout. Table 7.2 presents the findings.
First, it can be seen that influence skills have held a substantive and significant pay premium of between 5% and 7% for females, and between 7% and 9% for males, at all three data points without any obvious major trend. The most likely conclusion to draw is that influence skills do indeed carry a long-term premium over and above returns to education and training. Part of this return is an economic return to something that can be acquired at some cost19; another part may be due to a scarce inherent competence that is able to capture a reward in the labour market. However, it should also be recalled that, apart from computing, influence skill was the generic communication skill which had expanded most over the period. One cannot therefore rule out that the return might be a short-term response to a demand expansion exceeding the short-term supply capability. If the demand expansion were to slow down, for some reason, the premium would under such a circumstance be expected to diminish.
Turning to computing skills, one might expect that, in the very long term, the lowest level of computing skills would begin to lose its attached pay premium, if the costs of acquiring such skills approach zero. Yet consider what has been happening to the supply and demand for computer skills in the current period. On one hand, greater proportions of the working-age population are acquiring at least simple computing skills in the current
19 The cost need not be an explicit financial cost; it can be hidden, as for example in the effort and experience devoted to learning at work.
137

age of computers.20 On the other hand, we have also seen in Chapter 5 a continued expansion in the demand for computer use at work. Since at the same time the level of computer usage has become more sophisticated between 2001 and 2006, this has left the proportions of the employed workforce using computers at a simple level roughly stable at one in five. On balance, therefore, with the basic usage of skills remaining unchanged, one might expect to begin to see a decline in the premium attached to basic computing skills.
Yet, as can be seen from Table 7.2, the premium associated with using computers at a simple level remains fairly steady over the period, at around 8% to 9% for females, and 6% to 7% for males. This persistence suggests that there may remain a premium for basic computing skills even in the long-term, despite the expanded supply. One possible explanation is that the basic skills remain scarce among a section of the population which finds it hard to come to terms with computer technologies. Another is that, despite these skills being basic, it is still necessary to renew and learn new basic skills as the possibilities of information technology evolve. In this case, it could be said that it is the ability to learn and pick up the new skills that is scarce.
At the other end of the computer skills spectrum it can be seen that the premia associated with advanced computing skills has fallen in recent years. For females, the estimated wage premium was 34% in 1997, falling to 24% in 2001, then to 21% in 2006. For males the pay premium for advanced computing skills rose from 13% to 26% over 1997-2001 but fell to just 8% in 2006. Since there is no evidence of a fall in the utilisation of computers at an advanced level, the most likely interpretation is that the supply of advanced computing skills in the population, while initially limited (hence the high premium) had started to expand fast enough to more than keep up with the demand. We conjecture that the demand for advanced computing skills may have been constrained during this period by the collapse of the ‘dotcom’ boom.
Not shown in Table 7.2 are the earlier returns to other generic skills. These were, however, included in the analyses. It was found that the premia associated with other generic skills were in most cases insignificantly different from zero, the exception being physical skills which, as with Table 7.1, were negatively associated with pay. Our conclusion remains the same as above, in respect of the 2006 cross-section: these other generic skills are not in so scarce supply that they command a premium over and above that paid for more broadly skilled labour.
7.4 Changes in the Value of Broad Skills, 1986 to 2006
In Chapters 3 and 4 we have reported that there emerged over the last twenty years a tendency for there to be growing differences between the aggregate number of people holding qualifications at various levels and the numbers of jobs for which each qualification level was required. It is of interest, therefore, to examine whether these growing differences reported are having an impact on the value of the required qualifications in the labour market.
Looking at the returns associated with the broad skill indicators shown in Table 7.2, it may be seen that there is no evidence of any fall in the premium associated with
20 We present no figures, but deduce this finding simply from the ongoing effects of recent IT education in schools which older generations did not receive.
138

degree-level jobs. The point estimate of the premium for males even shows, in fact, a modest increase over the period, from 39% in 1997 to 48% in 2001. At lower levels, the premia associated with jobs at levels 2 and below have remained insignificantly different from zero throughout the period. There is also considerable stability in the premia associated with training times and with learning times. For females, the point estimate of the difference between jobs with high and low learning times rose from 13% in 1997 to 16% in 2006, and for males the same differential rose from 16% to 19%; but these increments are small and well within the statistical confidence intervals for the estimates.
While Table 7.2 gives an initial picture of the trend in the value of broad skills, a better focus on this trend requires an analysis that includes only on the broad skills in the estimation. Some of the value of the broad skills is likely to be associated with the values of the generic skills, because there are substantial correlations between the broad skill and some of the generic skills indicators. In Table 7.3 we have omitted the generic skills indices from the estimation; and this gives an additional benefit in that we are now able to examine the trend in the values of the broad skills from 1986 onwards.
As expected, the values of the broad skills reported in Table 7.3 are greater than those reported in Table 7.2 which controlled for the generic skills indices. Looking at the trends over time for women, we find that the labour market value of jobs requiring degrees and the other upper level qualifications has held up throughout the period, with some oscillations. Similarly for men, there is no fall in the value attached to jobs requiring higher-level qualifications on entry; if anything the value attached to professional/vocational qualifications rose somewhat over the period.
The premium for women associated with jobs requiring level 2 qualifications, while in 1986 around 15% (compared with jobs requiring no qualifications on entry), and holding up until 2001, fell considerably to just 5% in 2006; the fall in this premium is statistically significant at the 5% level. For men, the premium fell to 6% in 2006, compared with 13% in 2001; here, however, the premium for level 2 had also been low in 1997, though much higher in both 1986 and 1992. The premium for women linked with level 1 qualifications was consistently low at around 6 to 8% throughout the period. For men the point estimate for level 1 qualifications started at around 6% and fell to zero by 2001, but the change is not statistically significant.
While there is no obvious trend in the value of high learning-time jobs, there is a slight discernible upward trend in the penalty (negative premium) associated with low learning time for women: over time this penalty rose from 7% in 1986 to 13% in 2006. For men there is also an upward movement in the penalty for jobs with low learning time, the main jump occurring between 1992 and 1997. Meanwhile, neither for men nor for women is there any obvious pattern of change in the value associated with long or short training times.
7.5 Summary of Main Findings
• Jobs which require the use of influence skills pay a premium over and above the rewards to education and training. Comparing jobs for which these skills are on average ‘essential’ with jobs where the skills are ‘very important’, the difference in hourly pay amounts to an estimated 7% for females and 8% for males.
139

• The usage of computing skills continues to be associated with substantial pay premia in the labour market. Compared with jobs that do not use computers at all, those which use them at a ‘complex’ manner – for example, using statistical software packages – pay an estimated 18% premium for females, 12% for males.
• No other generic skill requirements yield a substantial positive and statistically significant pay premium among all workers. However, among managers and supervisors there is a modest premium reflecting the use of managerial skills.
• There has been a fall in the labour market value of advanced computer skill requirements. Otherwise, there has been considerable stability in the rewards to the generic skills over the 1997 to 2006 period.
• All the broad skills indicators are associated with positive wage premia. Graduate level jobs attract by far the highest premia: 56% for females and 48% for males, compared with jobs requiring no qualifications on entry.
• The premia associated with high-level qualification requirements have shown no trend over the last twenty years; however, there has been a recent fall, between 2001 and 2006, in the labour market premium for jobs requiring Level 2 qualifications.
140

Table 7.1 Association of Pay With Skills
(1) Females
(2) Females
(3) Males
(4) Males
GENERIC SKILLS Managers/ Supervisors
Managers/ Supervisors
Literacy -0.012 -0.018 -0.019 -0.052 (1.21) (0.86) (1.47) (2.21)* Planning Skills 0.025 -0.005 -0.000 -0.008 (2.47)* (0.22) (0.02) (0.31) Problem-solving Skills -0.002 0.033 0.018 0.048 (0.23) (1.68) (1.37) (1.89) Horizontal Communication Skills
-0.012 0.003 0.003 0.006
(1.25) (0.14) (0.21) (0.25) Influence Skills 0.071 0.084 0.078 0.096 (5.75)** (2.95)** (4.62)** (2.80)** Checking Skills -0.014 -0.063 -0.017 -0.026 (1.38) (3.00)** (1.33) (1.10) Client Communication Skills -0.020 -0.026 -0.009 -0.023 (1.79) (1.22) (0.74) (1.13) Technical Know-how 0.016 0.007 0.021 0.032 (1.43) (0.32) (1.41) (1.22) Number Skills -0.008 -0.006 0.017 0.015 (1.30) (0.47) (2.14)* (1.16) Physical Skills -0.055 -0.062 -0.094 -0.124 (6.35)** (3.93)** (8.63)** (6.61)** Emotional skills 0.009 -0.002 -0.008 -0.031 (0.89) (0.11) (0.71) (1.54) Aesthetic skills 0.002 0.009 -0.003 -0.016 (0.23) (0.51) (0.28) (0.98) Management Skills 0.043 0.074 (2.10)* (3.24)** Level of Computer Usage. Pay premium compared with otherwise identical jobs involving no computer usage
‘Simple’ 0.084 0.107 0.077 0.138 (3.56)** (2.03)* (2.83)** (2.49)* ‘Moderate’ 0.152 0.159 0.108 0.178 (6.25)** (3.03)** (3.73)** (3.39)** ‘Complex’ 0.168 0.195 0.117 0.212 (5.42)** (3.23)** (3.43)** (3.61)** ‘Advanced’ 0.192 0.193 0.077 0.122 (4.15)** (2.30)* (1.90) (1.84)
141

BROAD SKILLS
Required Qualifications. Pay premium over otherwise identical jobs requiring no qualifications
Level 1 0.033 0.120 -0.024 0.018 (1.22) (2.12)* (0.85) (0.33) Level 2 -0.003 -0.021 -0.013 -0.038 (0.13) (0.45) (0.43) (0.71) Level 3 0.130 0.154 0.116 0.120 (4.98)** (3.24)** (4.38)** (2.58)* Level 4, non-degree 0.305 0.295 0.223 0.176 (10.60)** (5.88)** (6.32)** (3.34)** Leverl 4, degree 0.446 0.463 0.394 0.335 (16.02)** (9.67)** (12.74)** (6.99)** Previous Training Time. Pay premium over otherwise identical jobs requiring intermediate previous training.
More Than Two Years’ Training -0.039 -0.064 -0.026 0.012 (1.50) (1.45) (0.61) (0.18) Under One Month Or No Training -0.056 -0.054 -0.024 -0.023 (3.47)** (1.92) (1.28) (0.80) Required Learning Time. Pay premium over otherwise identical jobs requiring intermediate learning times
Over Two Years’ Learning Time 0.078 0.075 0.110 0.110 (4.17)** (2.57)* (5.63)** (3.84)** Less Than One Month's Learning Time -0.069 -0.060 -0.066 -0.063 (3.63)** (1.34) (2.62)** (1.21) CONTROL VARIABLES Task Discretion Index 0.001 -0.027 0.033 0.015 (0.05) (1.12) (2.24)* (0.57) Length of work experience (months) 0.013 0.016 0.024 0.021 (5.71)** (3.46)** (8.89)** (4.35)** Squared length of work experience -0.000 -0.000 -0.000 -0.000 (4.75)** (2.89)** (7.59)** (3.42)** Supervisor or Manager 0.103 0.042 (6.18)** (2.08)* Almost exclusively male job at workplace 0.062 0.049 0.067 0.062 (2.49)* (1.11) (3.43)** (2.07)* Almost exclusively female job at workplace
-0.041 -0.056 -0.062 -0.087
(2.60)** (1.97)* (1.79) (1.58) Observations 1872 744 1724 805 R2 (proportion of variance explained) 0.62 0.58 0.58 0.55
Notes:Absolute value of t statistics in parentheses; * significant at 5%; ** significant at 1%. Where there are no asterisks the estimate of the coefficient is not found to be statistically significant. This means that we cannot reject the hypothesis that the coefficient’s true value is zero. Each column of estimates derive from a multiple regression analysis using a ‘hedonic wage equation’, where the dependent variable is the log of hourly pay and the independent variables comprise many job characteristics. In addition to the variables shown, we also control for differences in pay associated with: industrial sector, whether full-time or part-time, establishment size and region.
142

Table 7.2 The Value of Skills, 1997-2006 Females Males 1997 2001 2006 1997 2001 2006Influence 0.058* 0.049* 0.072* 0.070* 0.088* 0.078* Level of Computer Usage. ‘Simple’ 0.084* 0.093* 0.084* 0.079* 0.060* 0.077* ‘Moderate’ 0.169* 0.193* 0.151* 0.127* 0.135* 0.108* ‘Complex’ 0.108* 0.187* 0.166* 0.15* 0.169* 0.118* ‘Advanced’ 0.293* 0.218* 0.192* 0.125* 0.233* 0.078* Required Qualifications Level 1 0.028 0.022 0.034 0.016 -0.004 -0.023 Level 2 0.017 0.068 -0.003 0.003 0.047 -0.014 Level 3 0.187* 0.124* 0.129* 0.091* 0.132* 0.118* Professional/vocational 0.281* 0.386* 0.305* 0.152* 0.223* 0.224* Degree 0.390* 0.438* 0.444* 0.331* 0.353* 0.395* Training Time More Than Two Years’ Training 0.039 0.062* -0.040 0.042 0.000 -0.026Under One Month Or No Training -0.037 0.003 -0.057* 0.029 -0.031 -0.024Learning Time Over Two Years’ Learning Time 0.075* 0.098* 0.078* 0.078* 0.070* 0.109*Less Than One Month's Learning Time -0.051* -0.036 -0.069* -0.070* -0.082* -0.066* Notes: Apart from the variables shown, the regressions included all the variables used in columns (1) and (3) of Table 7.1, except for aesthetic and emotional skills. * indicates significant at 5%.
143

Table 7.3 The Value of Broad Skills, 1986-2006 a) Females
1986 1992 1997 2001 2006 Required Qualifications Level 1 0.066 0.023 0.082 0.083* 0.066* Level 2 0.142* 0.144* 0.150* 0.172* 0.050* Level 3 0.342* 0.244* 0.360* 0.277* 0.247* Professional/vocational 0.495* 0.369* 0.477* 0.557* 0.449* Degree 0.672* 0.586* 0.679* 0.687* 0.663* Training Time More Than Two Years’ Training -0.026 0.019 0.047 0.063* -0.043 Under One Month Or No Training -0.025 -0.021 -0.063* -0.016 -0.083* Learning Time Over Two Years’ Learning Time 0.124* 0.088* 0.086* 0.116* 0.088* Less Than One Month's Learning Time -0.072* -0.095* -0.128* -0.099* -0.138* b) Males 1986 1992 1997 2001 2006 Required Qualifications Level 1 0.061 0.063 0.045 0.004 -0.009 Level 2 0.152* 0.152* 0.041 0.119* 0.064* Level 3 0.150* 0.211* 0.179* 0.208* 0.210* Professional/vocational 0.331* 0.37* 0.293* 0.417* 0.402* Degree 0.571* 0.558* 0.520* 0.609* 0.633* Training Time More Than Two Years’ Training -0.016 0.085* 0.065 0.013 0.000 Under One Month Or No Training -0.066* -0.010 -0.011 -0.042 -0.064* Learning Time Over Two Years’ Learning Time 0.045 0.049* 0.089* 0.089* 0.133* Less Than One Month's Learning Time -0.064* -0.084* -0.159* -0.147* -0.121* Note: All regressions controlled for a quadratic in work experience, size, industry and region.
144

CHAPTER 8 EMPLOYEE ATTITUDES TO SKILL USE AND TRAINING
8.1 Introduction
In the previous sections the focus has been on charting the changing nature of skills. But it is also important to try to understand the factors that influence employees’ willingness to develop their work skills. A new feature of the 2006 Skills survey was the inclusion of a module designed to explore employee attitudes to skill use and skill development and the way these may have changed since the early 1990s.
Our point of departure is that this will be affected in an important way by peoples’ underlying values about work – the extent to which their job preferences reflect a concern for the intrinsic characteristics of work, such as the opportunity to make use of skills and initiative in a job, or are primarily related to the extrinsic benefits of a job, for instance its pay level. Second, employers’ views on skill development are likely to be influenced by the extent to which people believe they can choose whether or not they receive training, since those who can exercise choice are more likely to receive the type of training they personally feel is important. Third, it will be related to their perception of the immediate costs and benefits of training, the balance between the pressures it may involve in terms of time and psychological stress and the advantages it may bring in terms of personal satisfaction. Finally it is likely that it will depend on their beliefs about the opportunities that training opens up for them, whether within their current organisation or in the wider labour market. There are grounds for thinking that work values are relatively stable personal characteristics, rooted in early life socialisation and conditioned by longer-term work experiences. With respect to the last three factors, however, employee beliefs are likely to be strongly affected by their more recent experiences of skill development. Our approach to these issues, then, is to focus primarily upon employees’ reports of their recent spells of training.
8.2 Job Orientations
The first concern was to investigate whether there had been a significant change in the importance of the intrinsic characteristics of work (the qualities of the job task) compared to the extrinsic (in particular the financial rewards of work). One argument has been that there has been a trend for employees to become more instrumental in their preferences about work, with the result that the nature of the job task is becoming less important.
There are few good points of comparison, but the 1992 Employment in Britain survey contained a series of questions that asked people about their ‘job orientations’ – that is to say the importance they attach to different job characteristics. The question was ‘I am going to read out a list of some of the things people may look for in a job and I would like you to tell me how important you feel each is for you’. They were asked for each characteristic whether they regarded it as ‘essential’, ‘very important’, ‘quite important’ or ‘not very important’. The list of job features was:
145

• Good promotion prospects
• Good pay
• Good relations with your supervisor or manager
• A secure job
• A job where you can use your initiative
• Work you like doing
• Convenient hours of work
• Choice in your hours of work
• The opportunity to use your abilities
• Good fringe benefits
• An easy work load
• Good training provision
• Good physical working conditions
• A lot of variety in the type of work
• Friendly people to work with
Table 8.1 shows the proportions of all employees who regarded each job feature as either ‘essential’ or ‘very important’ in 1992 and 2001. Taking those who reporting that the job facet was ‘essential’ in 2006, the five most important aspects of a job were: work you like doing, a secure job, good pay, opportunity to use one’s abilities and friendly people to work with. Nearly half of all employees thought that it was ‘essential’ to have work they liked doing, and around a third mentioned each of the other four factors. If those who cited a job feature as ‘very important’ are taken together with those who thought it was ‘essential’, the ‘opportunity to use one’s abilities’ comes third in rank, while ‘good pay’ falls to seventh position. An overall index that gives a score to each response category (from 4 for ‘essential’ to 1 for ‘not very important’), thereby taking account of the strength of all responses, shows ‘opportunity to use one’s ability’ in fourth position and ‘good pay’ in seventh (Figure 8.1). Table 8.1 shows that the opportunity to ‘use initiative’ also comes above ‘good pay’ on both of these measures. In short, it seems clear that British employees in 2006 cannot be characterised as primarily instrumental in their approach to work. The nature of the work itself and the extent to which it allows a person to make use of their abilities and exercise initiative in work is fundamental in their evaluation of a job, and indeed tends to be placed higher than good pay itself.
146

Figure 8.1 Job Preference Orientations, 1992-2006
0
0.5
1
1.5
2
2.5
3
3.5
4
Use of
Abiliti
es
Initia
tive
Training
Prov
ision
Variety
Work
You Li
ke Doing
Good P
ay
Good P
romotion
Job S
ecuri
ty
Friend
ly Coll
eagu
es
Good R
elatio
ns with
Superv
isor
Choice i
n Hours
Conven
ient H
ours
Good W
orking
Con
ditions
Scor
e
19922006
Source: Table 8.1.
Moreover, if one takes change between 1992 and 2006, there is no evidence of a declining relative importance of intrinsic job features compared with pay. The proportion of employees thinking that the opportunity to use one’s abilities in a job and the opportunity to use initiative are ‘essential’ or ‘very important’ has increased (by 6 and 8 percentage points respectively), exceeding the increase for ‘good pay’ (4 percentage points). The pattern of change has been for a rise in expectations with respect to both the intrinsic quality of jobs and pay.
However, it should be noted that this does not appear to imply that people are increasingly looking for jobs that offer opportunities for skill improvement through training. Less than one quarter of employees mentioned this as an ‘essential’ feature of a job in 2006, a proportion that was a little lower than in 1992.
There were some differences in pattern between male and female employees (Table 8.2). While ‘work one liked doing’ received the highest score from both sexes, this was followed by ‘use of ability’ and ‘a secure job’ for men, whereas for women the next most important job features were ‘working with friendly people’ and ‘good relations with supervisors’. ‘Use of abilities’ for women came only in fifth place. However, this difference in the relative importance of different job features did not imply that women were less concerned about the use of their abilities and initiative than men. In both cases, the average scores were a little higher for women than for men. In contrast the average score for ‘good pay’ was notably higher for men than for women.
Looking at change between 1992 and 2006, moreover, it is clear that there was some measure of convergence over time in the importance that women and men attach to ‘use of their abilities’ and ‘initiative’ in work. In both cases, the scores increased much more sharply for women than for men over the period 1992 to 2006. Whereas in 1992, men attached more importance to these aspects of a job than women, women’s score for the
147

importance of being able to use abilities or initiative is slightly higher than that of men in 2006. Similarly, the importance of ‘good pay’ increased considerably more for women. It is also notable that the decline in the importance of good training provision was primarily among men; among women there was little change in its importance over time. Whereas in 1992 the scores indicated that training was a more important characteristic of a job for men than for women, the reverse was the case by 2006.
Examining the differences between types of employee with respect to the importance attached to the opportunities to make use of abilities, initiative at work and to training provision, there is a substantial difference between female full-time and female part-time employees (Table 8.3). The importance of a job allowing use of abilities and initiative is lower for part-timers than full-timers. Part-timers are also less concerned about training provision, although the difference here is less marked (see Figure 8.2).
Figure 8.2 Importance of Abilities, Initiative and Training by Full-Time/Part-Time Status, 2006
2.5
2.6
2.7
2.8
2.9
3
3.1
3.2
3.3
Abilities Initiative Training
Scor
e
Female Full-timersFemale Part-timers
Source: Table 8.3.
There are also substantial differences between occupational classes. In general, those in ‘Managerial’, ‘Professional’, and ‘Associate Professional’ jobs stand out in terms of the importance they attach to the use of their abilities and initiative. ‘Elementary’ employees are the least likely to regard these features of a job as ‘essential’, although taking the score measures ‘Sales’ employees, ‘Operatives’ and ‘Elementary’ workers all emerge as relatively low. The differences between occupational classes with respect to the importance of training provision are in general small. But ‘Personal Service’ workers stand out as considering this particularly important, while on the overall score measure ‘Managers’, ‘Professionals’ and ‘Elementary’ workers are the least concerned about training provision.
148

With respect to industry, preferences for jobs allowing scope for use of ability and initiative are highest in ‘Education’, although they are also important in ‘Personal Services’, ‘Health’, and ‘Real Estate and Business Services’. Employees in ‘Finance’ stress use of ability, but are of middle ranking with respect to initiative. ‘Wholesale and Retail’ employees are relatively low with respect to both. Finally, concern about training provision is particularly marked among employees in ‘Health and Social Work’, followed by ‘Hotels and Restaurants’, ‘Public Administration’ and ‘Personal Services’. The lowest importance attached to training provision is in ‘Real Estate and Business Services’.
8.3 Choice and Opportunity in Training Participation
To what extent do employees take the initiative in getting access to training opportunities and to what extent are they dependent upon encouragement from their employers?
The role of employee choice may be located initially in the decision to seek employment with a particular organisation: a person may apply because they think that it is the type of employer that provides good training opportunities. Very little is currently known about the extent to which this is the case. It involves an important issue about the level of knowledge that employees have when they make job decisions. The possibility of choice implies a reasonable transparency of the labour market. Do employees have a clear image of the type of employer with respect to likely training opportunities or do they feel that it is difficult to know what opportunities there are likely to be?
The survey included a question that sought to explore this. It asked: ‘I want you to think about the time when you first chose a job with your present employer. Which of the following best describes the impression you had at that time about the training opportunities it would provide?’ The response options were:
• I thought that the job would provide good training opportunities
• I thought that it would be difficult to get training opportunities
• I didn’t have much of an impression about the training opportunities the job would offer.
As can be seen in Table 8.4 and Figure 8.3, more than half of all employees reported that they had considered that their employer would provide good opportunities. This was true for both men and women, although female full-timers were particularly likely to have chosen organisations with good training opportunities while female part-timers were closer to the pattern for men. Of the remainder, very few had taken jobs in organisations where they thought it would be difficult to get training opportunities. But 40% of employees did not have a sense of knowing about the potential training opportunities.
149

Figure 8.3 Awareness of Training Provision When Choosing Job, 2006
0
10
20
30
40
50
60
70
All Employees Males Females Female Full-timers
Female Part-timers
%Good training opportunitiesDifficult to get trainingDidn't know
Source: Table 8.4.
Within this overall picture there were marked variations by occupational class. More than 60% of ‘Associate Professionals’ and ‘Personal Service’ employees claimed to have joined organisations knowing that the training was good, and this was also the case for more than half of ‘Managers’, ‘Professionals’, ‘Administrative and Secretarial’ staff, workers in the ‘Skilled Trades’, and ‘Sales’ employees. In sharp contrast, this was true for only 45% of ‘Plant and Machine Operatives’ and 33% of ‘Elementary’ workers. In both of these categories, a large proportion of employees felt that they had very restricted knowledge about the training provision of the organisations they were joining.
Awareness of good training opportunities was particularly high among employees who had joined ‘Finance’, ‘Health and Social Work’ and ‘Public Administration’. In contrast, this was the case for only a minority of those joining organisations in the ‘Wholesale and Retail’, ‘Hotels and Restaurants’ and ‘Transport’ industries.
Once employed by the organisation, the issue of interest is whether the initiative for training came from the individual or from the employer. The survey asked all those who had received training in their current job over the previous year whether the following two statements were applicable or not: ‘I got the training because I asked my employer for it’ and ‘It was my employer that first suggested the training’. Since a person may have received more than one type of training over the period, it was in principle possible to respond positively to both. The findings presented in Table 8.5, however, show that this situation was relatively rare. Taking all employees, it is clear that the most common situation was for employers to take the initiative rather than employees themselves: whereas only 40% claimed personal responsibility, more than 60% mentioned that a training event had been initiated on the suggestion of their employer (Figure 8.4). The pattern was very similar among men and women, although female part-time employees were notably less likely than either men or female full-timers to have received training as a result of their own initiative.
150

Figure 8.4 Employee and Employer Initiative in Training Decisions, 2006
0
10
20
30
40
50
60
70
80
All Employees Males Females Female Full-timers Female Part-timers
%Own Initiative
Employer Request
Source: Table 8.5.
A notable point is how strongly the relative importance of personal initiative and employer suggestion varied depending upon the person’s occupational class. Among the more skilled occupational classes, the balance between the sources of initiative was roughly even, but among the least skilled training was overwhelmingly an employer initiative. Approximately half of ‘Professionals’ and ‘Managers’ had received training as a result of their own request, whereas this was the case for only 22% of ‘Sales’ employees, 18% of ‘Operatives’ and 28% of ‘Elementary’ workers.
The significance of personal choice in initiating training also varied by industry. It was most notable in ‘Education’ where 51% of employees reported that they had received training as a result of a personal request. Personal choice also played a substantial role in ‘Real Estate and Business Services’, ‘Health and Social Work’, ‘Personal Services’ and ‘Public Administration’. In contrast, training in ‘Wholesale and Retail’, ‘Hotels and Restaurants’ and ‘Transport’ was largely the result of employer decisions. Even in ‘Manufacturing’, only 35% reported training episodes that resulted from their own initiative, whereas 66% were trained at the instigation of their employer.
8.4 The Costs and Benefits of Training
There has been considerable discussion about whether training brings significant benefits either in terms of productivity or employee careers, but there is little direct information based upon employees’ own perceptions. At least potentially training might have a net negative outcome for employees if the additional stresses it involved were considerable while there were few tangible benefits either for the experience of the current job or for longer-term career perspectives. Similarly, there has been debate about whether training represents a sensible investment for employers, if it is more likely to encourage
151

employees to leave the organisation than to remain within it, with the result that employers cannot recoup their training costs.
The survey asked several questions designed to investigate these issues. First, it explored the costs with respect to family time and psychological stress. As can be seen in Table 8.6, only a relatively small minority of employees that had received training found that it had posed significant problems in terms of time with the family (12%) or stress (16%), although in both cases women experienced more problems as a result of training than men. Among women, the proportion reporting that family commitments made it hard to find the time for training rose to 15%, while 17% found the training stressful.
With respect to the experience of the current job, questions were asked about whether people enjoyed the job more as a result of the training and also whether they thought that it had helped them to improve the way they did their job. The overwhelming verdict was that training had indeed proved beneficial: 60% reported that they enjoyed their work more and as much as 87% said it had improved the way they worked. Women were even more likely to enjoy their job as a result of training than men, but there was little difference in the sexes in perceptions of the benefits of training for the efficiency of work.
Finally, there was a group of questions concerned with the longer-term consequences of training – for people’s job security, pay, career within the organisation and potential intentions to quit their current employer. By far the most frequently cited career advantage was that of heightened job security. This was mentioned by 46% of all employees, 48% of male employees and 44% of female employees. Only a small minority – less than 20% of people who had received training – mentioned other career benefits. For instance, only 18% had received a pay increase as a result of their training, while 17% had been given a better job. Although the differences between the sexes are small, it is notable that for all three benefits – security, pay and a better job – men were more likely to report a career gain as a result of training than women.
Finally, how did training affect employees’ career mobility intentions? Only a minority of employees (less than 25%) were led to look for a different job as a result of their training. Those who did start searching for a better job were somewhat more likely to look at the possibilities for career promotion within their own organisation (18%) than to moving to another employer (14%). Again, with respect to both types of career mobility men were more likely to have searched for a better job after training than women.
8.5 Future Perspectives
What are employees’ future aspirations with respect to training and how far do these differ between the sexes? What types of skills are they hoping to acquire? And what do they see as the potential benefits of training?
In 2006 a quarter of all employees ‘very much’ wanted training in the future and a further 40% wanted it ‘a fair amount’ (Table 8.7). Over half (55%) indicated that they wanted to acquire additional skills or qualifications over the next three years (Table 8.8). Consistently with the earlier findings about job preference orientations, there are signs that interest in training has slightly declined compared to earlier periods. For instance, in 1992 29% of all employees very much wanted training, while in 2006 the figure was only 25%.
152

Those wanting training in the next three years were in general optimistic about their chances of getting it, with nearly three quarters say that they strongly agreed or at least agreed that there would be many opportunities, although only a quarter strongly agreed that this was the case (Table 8.9).
As can be seen in Table 8.10 and Figure 8.5, the type of training people were most frequently looking for involved the acquisition of a new vocational or professional qualification (34%), followed by computer, internet or software skills (29%). There was a broad similarity between men and women in the importance they attached to these. Other types of preference about skill acquisition showed much more marked differences between the sexes. Over a quarter of employees were hoping to get an educational qualification, but this was more frequently the case for women (31%) than for men (22%). In contrast men were more likely to be concerned to acquire management skills (28% compared with 19% for women). The strongly gendered nature of work is also evident in the fact that men were more likely to be looking for technical or craft skills than women, while women were very much more likely to be hoping to acquire caring skills.
Figure 8.5 Types of Skill Employees Would Like to Acquire, 2006
0
5
10
15
20
25
30
35
40
Educa
tiona
l
Vocati
onal
Compu
ter
Man
agem
ent
Techn
ical
Foreign
lang
uage
Teach
ing
Caring
Driving
%
All
Men
Women
Source: Table 8.10.
Training was seen as a way both of increasing mobility opportunities and of improving performance in the current job. The most common benefit that people were looking for out of training was the ability to choose another job (53%). A substantial proportion also saw it as a way of achieving higher pay (41%), although only a third (32%) thought it would be a path to promotion. But much of the interest in training lay in its more immediate effects. Nearly half (49%) mentioned that it would give a sense of achievement, while 43% saw it as a way of becoming better at current work tasks.
153

Interestingly, given the earlier discussion of the perceived outcomes for those that had received training, increased job security did not feature as a particularly important reason why people were looking for future training: indeed this was least commonly mentioned benefit of all (19%).
8.6 Summary of Main Findings
• Opportunities for the use of abilities and of personal initiative were of central importance to the job preferences of British employees in 2006. Indeed, the importance of being able to make use of abilities at work was ranked higher than ‘good pay’. Moreover, there is no evidence of a declining relative importance of intrinsic job features – such as opportunities for the use of abilities and initiative – compared with pay. Expectations have risen with respect to both over the period 1992 and 2006. The importance attached to ‘good training provision’ did, however, decline over the period for men.
• There was a convergence between men’s and women’s job preferences between 1992 and 2006. Whereas in 1992 men attached more importance to use of abilities, opportunities to use initiative and good training provision than women, the difference with respect to use of abilities had virtually disappeared by 2006, and women had come to attach more importance than men to the use of initiative and good training provision.
• Differences between occupational classes with respect to the importance of good training provision are in general relatively small. But ‘Personal Service’ workers considered it particularly important, while it was least valued by ‘Managers’, ‘Sales’ employees and ‘Elementary’ workers. Concern about training provision was particularly marked among employees in ‘Health and Social Work’, followed by ‘Hotels and Restaurants’, ‘Public Administration’ and ‘Personal Services’.
• Three out of five employees reported that they had been aware of the likely availability of training opportunities in their organisation at the time they initially chose the job – and 56% of employees had thought that the training opportunities would be good. But there were strong variations by occupational class. Two in three (67%) of workers in ‘Elementary’ occupations and either had had no clear impression about the training opportunities on offer, or knew when they were being recruited that it would be difficult to get training opportunities.
• The initiative for employee training primarily came from the employer rather than from than the employee. The pattern was very similar for men and women, although female part-time employees were notably less likely to have received training as a result of their own suggestion. But the relative importance of employee and employer initiative varied substantially by occupational class. They were relatively evenly balanced among those in more skilled occupations, whereas among the least skilled training was overwhelming an employer initiative.
• Most employees that had experienced training had found it beneficial. Relatively few had found it stressful or considered that it had led to significant conflicts with family time. But a majority thought that it had led both to more enjoyment of work and to perceived improvement in the way the work was done. Fewer mentioned longer-term career advantages. Just under half thought that it had led to greater job security, but
154

less than one in five reported that it had led to a pay increase or a better job. Only a small proportion of employees had looked for a job with another employer as a result of their training.
• While nearly two-thirds of employees wanted training in the future, only a quarter expressed a strong desire for it. Just over half wanted to acquire additional skills or qualifications in the next three years. The type of training people were most frequently looking for involved acquiring new vocational or professional qualifications. Training was seen primarily as a way of increasing job mobility, of providing a sense of personal achievement and of improving performance in the job. Only a third thought that it would be a path to promotion.
155

Table 8.1 Job Preference Orientations, 1992 and 2006
1992 2006
Essential (%)
Essential or Very
Important (%)
Score1
Essential (%)
Essential or Very
Important (%)
Score
Opportunity to use abilities 27.4 78.5 3.03 34.3 84.6 3.17 Can use initiative 23.7 74.9 2.96 30.7 82.7 3.11 Good Training Provision 27.4 72.0 2.91 22.7 65.2 2.79 A lot of variety in type of work 16.6 60.2 2.69 21.3 68.5 2.84 Work you like doing 33.9 83.9 3.16 48.4 91.0 3.39 Good pay 25.7 71.6 2.94 34.7 75.7 3.08 Good promotion prospects 10.7 42.1 2.29 15.2 50.1 2.45 A secure job 37.3 83.3 3.17 37.8 83.1 3.18 Friendly People to work with 23.8 73.3 2.94 34.3 85.0 3.18 Good Relations with supervisor 29.2 79.2 3.05 31.1 84.3 3.13 Choice in hours of work 8.2 32.0 2.08 13.0 45.9 2.42 Convenient hours of work 13.3 45.2 2.39 21.1 65.9 2.80 Good Physical Working Conditions 23.1 69.4 2.86 23.2 73.8 2.93
Note:
1. The table summaries the responses given by respondents when asked to indicate the importance they attached to different job characteristics (as listed in column 1). An overall index gives a score to each response category (from 4 for ‘essential’ to 1 for ‘not very important’), thereby taking account of the strength of all responses. These scores are reported in this table.
156

Table 8.2 Job Preference Orientations by Sex, 1992 and 2006
Men Women Change in Scores,
1992-2006
1992
2006
1992
2006
Men
Women
Opportunity to use of abilities 3.08 3.16 2.99 3.18 0.08 0.19 Choice in hours of work 1.88 2.23 2.31 2.61 0.35 0.30 Convenient hours of work 2.14 2.60 2.66 3.01 0.46 0.35 Friendly people to work with 2.81 3.07 3.07 3.29 0.26 0.22 Fringe Benefits 2.12 2.33 2.01 2.29 0.21 0.28 Can use initiative 3.02 3.10 2.90 3.13 0.08 0.23 Easy work load 1.58 1.81 1.65 1.85 0.23 0.20 Good pay 3.03 3.12 2.84 3.03 0.09 0.19 Good promotion prospects 2.42 2.47 2.15 2.43 0.05 0.28 A secure job 3.24 3.16 3.10 3.20 -0.08 0.10 Good relations with supervisor 2.95 3.02 3.16 3.25 0.07 0.09 Good training provision 2.97 2.73 2.86 2.84 -0.24 -0.02 A lot of variety in type of work 2.68 2.83 2.69 2.86 0.15 0.17 Work you like doing 3.12 3.31 3.21 3.47 0.19 0.26 Good physical work conditions 2.82 2.87 2.92 3.00 0.05 0.08 Note: This table reports the scores as described in Table 8.1.
157

Table 8.3 Importance of Use of Abilities, Initiative and Training by Full-time/Part-time Status, Class and Industry, 2006
Abilities Initiative Training Essential Score Essential Score Essential Score Work Hour Status Female Full-Time 39.6 3.26 33.9 3.17 25.9 2.87 Female Part-Time 27.4 3.06 27.3 3.06 22.8 2.79 Occupational Class Managers 41.1 3.31 38.0 3.29 15.5 2.58 Professionals 51.7 3.47 41.7 3.32 17.5 2.66 Associate Professionals 40.2 3.32 35.2 3.23 27.2 2.93 Administrative & Secretarial 28.0 3.12 27.5 3.06 21.1 2.72 Skilled Trades 29.9 3.13 22.7 3.03 23.3 2.89 Personal Service 32.4 3.17 30.1 3.11 32.2 3.05 Sales 25.9 3.01 24.3 2.99 27.0 2.87 Plant & Machine Operative 29.3 2.96 25.1 2.87 25.5 2.77 Elementary 20.2 2.80 22.0 2.89 20.2 2.66 Industry Manufacturing 33.7 3.11 28.7 3.06 23.2 2.76 Construction 27.0 3.09 24.6 3.00 17.1 2.74 Wholesale & Retail 28.9 3.05 23.5 2.99 21.2 2.70 Hotels & Restaurants 31.2 3.11 26.1 3.04 27.4 2.87 Transport and Storage 30.3 3.07 30.2 3.08 25.0 2.80 Finance 34.5 3.25 28.0 3.10 19.2 2.70 Real Estate & Business Services 35.9 3.23 33.5 3.15 15.2 2.57 Public Administration 28.7 3.09 30.0 3.11 23.0 2.84 Education 45.6 3.36 36.1 3.24 18.7 2.71 Health & Social Work 40.6 3.28 36.3 3.20 32.7 3.05 Personal Services 36.3 3.26 36.2 3.23 25.5 2.84
158

Table 8.4 Awareness of Training Provision on Choice of Job, 2006
Good training opportunities
(%)
Difficult to get training
(%)
Didn’t know (%)
All Employees 55.8 4.6 39.5 Sex Men 54.3 5.3 40.4 Women 57.5 3.9 38.6 Work Hour Status Female full-time 60.4 3.9 35.7 Female part-time 53.0 3.9 43.1 Occupational Class Managers 55.9 4.6 39.5 Professionals 59.9 3.0 37.2 Associate Professionals 70.2 3.9 25.9 Administrative & Secretarial 53.9 3.3 42.9 Skilled Trades 60.9 6.1 33.0 Personal Service 64.1 4.4 31.5 Sales 53.6 3.1 43.3 Plant & Machine Operative 45.0 5.5 49.6 Elementary 32.6 8.5 58.9 Industry Manufacturing 49.2 7.4 43.4 Construction 54.6 3.9 41.4 Wholesale & Retail 47.4 4.0 48.6 Hotels & Restaurants 41.6 4.0 54.5 Transport & Storage 47.5 6.8 45.7 Finance 72.0 3.3 24.7 Real Estate & Business Services 55.7 3.7 40.6 Public Administration 60.7 4.7 34.6 Education 59.4 2.4 38.2 Health & Social Work 68.0 4.7 27.4 Personal Services 51.7 3.1 45.2
159

Table 8.5 Employee and Employer Initiative in Training Decisions, 2006
Own Initiative
(%) Employer Request
(%) All Employees 39.7 64.7 Sex Men 39.1 66.4 Women 40.4 62.9 Work Hour Status Female full-time 44.9 59.8 Female part-time 32.0 68.6 Occupational Class Managers 48.6 54.9 Professionals 50.5 51.6 Associate Professionals 45.3 61.7 Administrative & Secretarial 37.2 67.1 Skilled Trades 33.0 65.5 Personal Service 39.5 74.4 Sales 21.5 80.0 Plant & Machine Operative 18.3 80.0 Elementary 27.9 79.9 Industry Manufacturing 35.4 65.5 Construction 33.1 66.8 Wholesale & Retail 25.4 70.4 Hotels & Restaurants 25.9 73.6 Transport & Storage 36.0 74.0 Finance 41.1 63.7 Real Estate & Business Services 44.4 58.9 Public Administration 41.2 66.8 Education 50.5 57.5 Health & Social Work 45.6 62.6 Personal Services 40.6 69.0
160

Table 8.6 Employee Perceptions of Costs and Benefits of Training, 2006
All (%)
Men (%)
Women (%)
Family commitments made it hard to find time 12.3 9.9 14.8 The training itself was stressful 15.6 14.4 16.8 It has made me enjoy the job more 59.7 56.8 62.6 It has helped me improve the way I work 86.5 85.9 87.1 My job is more secure 46.3 48.2 44.4 I received a pay increase 18.2 19.0 17.4 I was given a better job in my organisation 17.2 18.9 15.6 It made me look for a better job in the organisation 18.4 19.5 17.3 It made me look for a better job in another organisation 13.8 14.8 12.8
161

Table 8.7 Future Perspectives: Desire for Training, 1992 and 2006
1992 2006 Percentage wanting training in the future
All Men Women All Men Women
Very much 28.5 29.5 27.3 25.4 24.3 26.4 A fair amount 36.5 38.5 34.3 39.5 40.6 38.4 Not much 19.5 19.0 20.0 22.0 22.4 21.5 Not at all 15.6 13.0 18.5 13.1 12.6 13.7
162
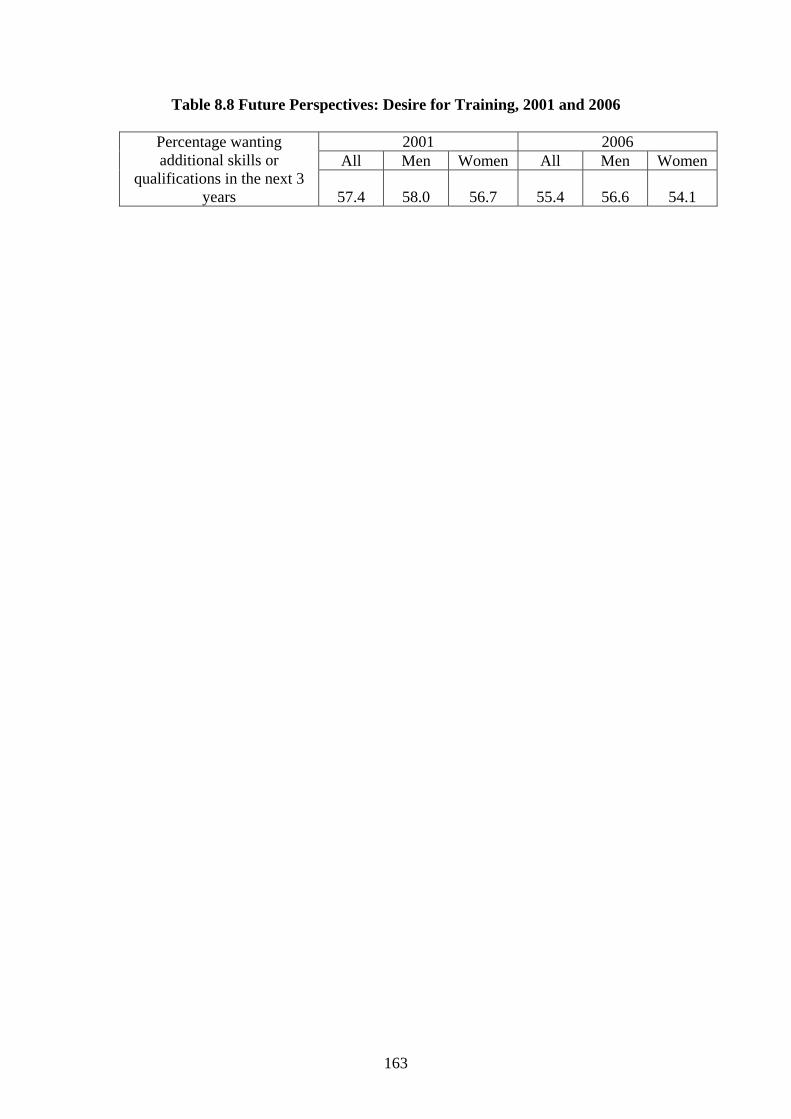
Table 8.8 Future Perspectives: Desire for Training, 2001 and 2006
2001 2006 All Men Women All Men Women
Percentage wanting additional skills or
qualifications in the next 3 years 57.4 58.0 56.7 55.4 56.6 54.1
163

Table 8.9 Future Perspectives: Desire for Training, 2006
(Among those who want training in next 3 years) percentage thinking will have
opportunities to get training All Men Women Strongly agree 25.6 23.2 28.2 Agree 51.8 52.4 51.1 Disagree 18.4 18.8 18.1 Strongly disagree 4.2 5.6 2.7
164

Table 8.10 Future Perspectives: Types of Skill and Benefits, 2006
Types of skill would like to acquire
All (%)
Men (%)
Women(%)
Educational qualification 26.5 22.1 31.3 Vocational or professional qualification 34.0 32.5 35.7 Computer, internet or software skills 28.7 30.1 27.1 Management skills 23.8 28.1 19.2 Technical or craft skills 13.7 20.7 6.1 Foreign language 10.3 11.9 8.6 Teaching skills 9.5 6.8 12.5 Caring skills 5.9 1.8 10.3 Driving licence 7.8 10.0 5.5 Perceived Benefits Better at current work tasks 43.3 44.7 41.8 Can do different tasks in current job 32.9 34.1 31.6 Helps keep up to date with changes at work 29.2 29.7 28.8 Gain a sense of achievement 48.6 44.4 53.2 Gives more personal influence over own work 22.5 23.5 21.4 Raises chance of promotion 31.7 31.5 31.8 Higher wage 41.0 42.4 39.5 Increases ability to choose another job 53.1 51.7 54.7 Enables to do a future job better 37.9 38.5 37.2 Makes job more secure 19.4 22.3 16.2
165

CHAPTER 9 CONCLUSION
9.1 Introduction
This Report has outlined some of the main trends taking place in British jobs over the period 1986 to 2006. It has deployed data from a succession of high-quality surveys in order to set the recent change in the context of the long-term evolution of skill use. Culminating in the 2006 Skills Survey, the series provides a unique representative picture of the history of British jobs over this period as seen by the individuals who performed those jobs, thereby complementing other sources which mainly give the perspective of employers such as the National Employers Skills Surveys (Shury et al., 2006) and the WERS/WIRS series (Kersley et al., 2006). This Report has a special emphasis on the skills used in workplaces, and reflects the primary research objectives of the three Skills Surveys in 1997, 2001 and 2006. While it has presented several key trends and described the current distribution of skills in 2006, the Report remains in a sense the ‘first findings’ from the latest survey. Several skills-related issues are still to be investigated in greater depth, and the data offer considerable scope for empirical testing of modern theories about the evolution of employment and work. In this final chapter we briefly recap some themes that have emerged from this first examination of the 2006 survey data, and point to the further research that is needed and planned to explore these themes in greater depth and in new directions.
9.2 Themes and Further Research
9.2.1 Upskilling and the Sources of Learning
The first major story that emerges from the long term examination of change is that since 1986 there has been an increasing use of high-skilled labour in British workplaces. This story is neither new nor surprising, since it has been held for some time that we live now in something called the ‘knowledge economy’, where the key to competitive success is the extent to which British-based firms can keep ahead of their rivals through innovation and knowledge, rather than superior physical or financial resources. Nevertheless, an alternative viewpoint is that employers have been concerned to exercise greater control over workplaces, and that sometimes this implies that lower-ranked staff deploying less, rather than more, skills. In previous surveys it was found that, indeed, British employees had been experiencing less personal influence over their jobs, but despite that most other indicators of skill were showing increases. The latest finding is that the use of generic skills has continued to increase over the last five years. There are also other indications of continually rising skills use: the proportions having had long training time for their current type of work have increased; and the proportions saying that their job continually requires them to keep learning have also risen.
Nevertheless, two key indicators of rising broad skill requirements have come to a halt over the last five years: qualification entry requirements and the learning time to do jobs well have reached a plateau. Both these indicators have their weaknesses as measures of
166

the skill requirements of jobs, but since they attempt to capture different and complementary proxies of the extent of skill acquisition necessary to do jobs competently, together they suggest that there may have been a deceleration of the pace of upskilling.
The picture, however, is mixed given the increases in the other skills measures. Especially notable are the rises in usage of computing skills and what we have called ‘influence’ skills. The latter is a collection of activities involving complex problem-solving, communication and persuasion skills that are found in combination in a range of jobs. Both computing and influence skills, moreover, are found to have substantial value in the labour market, over and above the compensation paid for higher qualification levels and the other broad skill indicators. In other words, these skills have both been expanding rapidly and have acquired a scarcity value. The value of very advanced computing skills has fallen in recent years, probably linked to the dotcom crash, but the lower value of even more basic computing skills has been retained.
The stagnation of the required qualifications measure, the increased emphasis placed on the requirement to learn new skills at work and rising use of generic skills, together imply that more importance is being attached to the kinds of learning and skill that can be picked up outside the education system and in the workplace in particular. In the 2001 Skills Survey it was found that most workers had learned their computing skills through training or self-learning either at home or at work. The same is likely to be true of other generic skills. Also, as we have seen, more people are strongly agreeing that their job requires them to keep learning: just over a quarter of workers in 1992, 30% in 2001 and more than a third in 2006. The stagnation of the learning time index runs counter to this interpretation of a change in the relative importance of routes to skill acquisition. However, what may be happening is that rate of skill acquisition while at work is increasing. One possibility is that, even though jobs in the current decade are still becoming more complex and hence requiring more skill, workers are being expected to become competent with the greater complexities in the same time as before. If this interpretation is correct, it follows that the importance of work-based learning is becoming more central to upskilling the workforce. This interpretation would support a shift in the balance of activities in favour of increased support for the lifelong learning policy agenda.
Moreover, support for lifelong learning could also benefit from an emphasis on those in lower-ranked occupations, because it is here that we see the larger increases in the generic skills indicators and even some increases in the learning time index over the last five years.
9.2.2 Aspects of Improvement
Two particular themes showing improvement are to be welcomed in the current findings: the narrowing of the gap between part-timers and full-timers, and a halt in the long-term decline in employees’ task discretion.
The improved position of part-timers has been a remarkably consistent theme through a number of the chapters in this Report. Throughout we have focused on the distinction between part-time and full-time jobs for women, since the numbers of part-time jobs held by men remain comparatively low. In the case of broad skills, female part-timers continue to be in jobs requiring less skills than female full-timers, but they have caught
167

up over the last two decades. Indeed, over the last five years part-timers were the only group for which their broad job skill rose according to all three measures. For this group the Required Qualifications Index rose by 0.24, a statistically significant change. The improvement was particularly at the lower end of the skills spectrum, with the proportion of part-time jobs requiring no qualifications on entry falling from 41% in 2001 to 33% in 2006. Similarly, the usage of generic skills has also increased faster for female part-timers in every domain, and this group has also been catching gradually in the utilisation of computing skills, though a gap still persists when compared with males and with female full-timers. Finally, there has been a reversal of the earlier trend up till 2001, namely a widening gap between the task discretion afforded to female part-timers and female full-timers; since 2001 the gap has narrowed somewhat.
Such a beneficial change should be seen in the context of the Part-time Workers (Prevention of Less Favourable Treatment) Regulations 2000, which was passed in order to conform to the EC Directive on part-time work. This Act made a number of restrictions on the extent to which part-time workers could be given lower pay and conditions for equivalent work, and included among these was access to training and to promotion, both of which could affect the skills use of part-time workers. Nevertheless, the changing use of part-time labour has also been subject to many other influences over recent decades (Rubery et al., 1999). It would be far too premature to attribute improvement in the skills use of part-time workers to the provisions of the Act. The evolution of part-time work will be the theme of a further working paper based on the Skills Survey data series.
The second aspect of improvement is perhaps surprising, since it represents a break in a trend that is at least a decade long for workers in Britain to be experiencing decreased autonomy. As we have shown in earlier studies, the decline in discretion particularly hit those in professional occupations, but it was not confined to those occupations and was found in every sector of the economy. The decline could not be attributed to any of the other measured changes at British workplaces, and we argued in Gallie et al., (2004) that the decline may have been associated with the particular prevailing management culture in Britain which was in favour of greater control and has been described as ‘low trust’. Workers in the few other countries for which data is available do not seem to have experienced the same decline in autonomy. The present findings shed no more light on the reasons for the earlier decline in Britain, but are a welcome indication of an end to the trend, which was associated with declining overall job satisfaction in British workplaces during the 1990s (Green and Tsitsianis, 2004).21
9.2.3 Further Planned Research
In contrast to the above improvements, the reported findings about the stabilisation of the proportions of jobs requiring qualifications at the various levels, combined with the continually rising supply of qualified workers, deserves further investigation. Differences between qualifications supply and the required qualification level have been shown to be a source of dissatisfaction for those affected. In addition, there is overwhelming evidence from several countries that those who do not succeed in finding jobs at their own level of education can expect normally to receive lower wages than those who do. Given this disadvantage for the individuals concerned, the social benefits and costs of 21 This decline in job satisfaction has been reversed in the present decade.
168

‘over-qualification’ deserve further investigation. An available stock of qualified persons is necessary, though not sufficient, for inducing employers to opt for higher-skilled strategies – that is, to go for product markets that demand more high skilled workers. Moreover, education has very many wider benefits, other than producing the general skills required in modern workplaces. However, such benefits have to be set against the costs of education.
In addition to the open question about the balance of benefits and costs of ‘over-qualification’, there remains also the empirical question as to what can be expected concerning the value of qualifications in the labour market. Even though there is some evidence of a reduction in the premia associated with required qualifications, especially at level 2, the overall findings on the pay trends for required qualifications appear at odds with our earlier findings on the growing differences in aggregate between the supply of qualifications and the numbers of jobs where each qualification level is perceived to be required for job entry (see Section 4.3.1). If labour markets are at all competitive, one might expect that employers would be able to attract qualified labour at lower prices if there is such an abundance of qualified people in the labour force relative to the number of employers seeking such qualified labour. Yet, the only evidence so far of a falling wage premia attached to jobs requiring qualified labour is at level 2. The lack of a generalised downward trend parallels the findings of other studies focusing on the supply of skills, in which the returns to acquiring qualifications through education have generally held up over the last two decades despite large increases in the proportions of qualified labour.22 These findings suggest that there must have been an increase in the demand for labour as great as the increase in the supply.
Is it possible to reconcile the finding of an increasing mismatch of qualifications with the findings of relatively stable returns to qualifications acquisition? One possible explanation for the fact that the value of higher level qualifications retaining their value in the face of excess supply is that the quality required from people with these qualifications is changing. For example, employers may be prepared to pay as much as before for graduates, but are seeking to discriminate (on quality) more in their choice of graduate recruit. Further research surrounding the finding of increasing ‘over-qualification’ at all levels is therefore planned. As part of this research it will be necessary to examine also whether the penalty for being overqualified has increased over time, as the proportions of people in this state have risen. In addition, the research on the value of skills will be extended by examining the changing rewards of different cohorts of workers as they progress through their careers and are observed in the various surveys. The advantage of this research is that it will be possible, with some further assumptions, to be more confident that the value associated with the skills is attributable to the possession of those skills rather than to some other fixed but unobserved characteristic of the cohort. In the light of these analyses an additional issue for future surveys may involve some refinement to the questions asked about broad skills.
Three additional areas also suggest themselves for further research. These concern the role of learning in the context of teamworking, the attitudes that workers have towards training and skill acquisition, and the role of employers’ human resource policies have in promoting training and raising skills.
22 Nevertheless, recent studies have shown evidence of some modest reductions in the returns to higher education following the period of mass expansion of universities during the 1990s (O’Leary and Sloane, 2004; Vignoles and Powdthavee, 2006; Walker and Zhu, 2005).
169

Academic and policy interest in teamworking has grown in recent years as an increasing number of work organisations in Britain have adopted various forms of group working as a means of utilising employees’ creative potential and enhancing job performance. However, little is known about the nature, mechanisms and consequences of teamwork. For instance, it is often assumed that teams have significant scope for decision-making, but to what extent is this empirically the case? What learning processes are involved in the context of teamwork? How does the use of self-managing or semi-autonomous work teams influence employees’ willingness to acquire skills? Does teamwork and group goal-setting increase the intrinsic rewards from work and give employees an enhanced sense of participation, thereby leading to higher levels of commitment to their organisation? Does it reduce work stress, by providing a stronger support network? Or does it lead to an intensification of work and increasing job stress?
Our initial results show the utilisation of initiative and abilities has become increasingly important for employees’ evaluation of jobs, but that there is little sign of a growth (and possibly some evidence of a decline) in the importance attached to receiving training. To unravel this apparent paradox, further research is needed to examine the determinants of attitudes towards training and skill acquisition. How does it relate to the technical environment of work, for instance the use of computer technologies and the complexity of such use? Is it affected by the pattern of work organisation – for instance, the extent to which employees are given individual discretion in how they carry out their jobs or to the use of semi-autonomous teams? To what extent is it related to the rate of recent change in skill requirements and work organisation? Is the pattern relatively general across the workforce or does it reflect the experiences of particular age groups? Is it affected by the growing mismatch between people’s own qualifications and those required by their jobs? How far are views on training influenced by beliefs about job security and the nature of career opportunities?
The connections between the way in which work is organised – and, in particular, the extent to which workers are empowered to make decisions without recourse to management – and business performance continue to excite considerable debate, hence the notion of the ‘high performance work organisation’. It is often assumed that those who work in these environments exercise more discretion and skills and have a stronger appetite for training, thereby enhancing organisational performance. To what extent does this survey support these assumptions? Do these types of organisations simply recruit more training aware individuals? Once recruited, is the training they receive adequate? What impact does this have on job performance? To what extent do these employment characteristics raise organisational commitment and levels of job satisfaction? Furthermore, we know little about how employer practices have changed over time. Are more organisations using ‘high performance working’ practices now than in the past? If so, how have the human resource outcomes of these practices changed over time?
Many other research questions will inevitably be pursued using the 2006 Skills Survey data set along with others in the series. It is our hope that this Report will prompt other researchers, in both the academic and policy-making communities, to consider how their particular interests can be pursued using this rich and unique data series. The data will be deposited in the UK Data Archive in 2008.
170

REFERENCES
Allen, J and van der Velden, R (2001) ‘Educational mismatches versus skill mismatches: effects on wages, job satisfaction, and on-the-job search’, Oxford Economic Papers, 53(3): 434-452.
Ashton, D, Davies, B, Felstead, A and Green, F (1999) Work Skills in Britain, Oxford, SKOPE, Oxford and Warwick Universities.
Autor, D H, Levy, F and Murnane, R (2003) ‘Computer-based technological change and skill’, in Appelbaum, E, Bernhardt, A and Murnane, R J (ed.) Low-Wage America, New York, Russell Sage Foundation.
Barro, R J and Lee, J W (1996) ‘International measures of schooling years and schooling quality’, American Economic Review, Papers and Proceedings 86 (2): 218-223.
Barro, R J and Lee, J W (2001) ‘International data on educational attainment: updates and implications’, Oxford Economic Papers 53 (3): 541-563.
Beatty, C, Fothergill, S, Gore, T and Green, A (2002) Hidden Unemployment in the East Midlands, Centre for Regional Economic and Social Research, Sheffield Hallam University.
Blauner, R (1964) Alienation and Freedom. The Factory Worker and his Industry, Chicago: University of Chicago Press.
BMRB (2006) 2006 Skills Survey: Technical Report, London: BMRB Social Research.
Braverman, H (1974) Labor and Monopoly Capital, New York: Monthly Review Press.
Bresnahan, T F (1999) ‘Computerisation and wage dispersion: An analytical reinterpretation’, Economic Journal, 109: June, F390-F415.
Bynner, J (1994) Skills and Occupations. Analysis of Cohort Members’ Self-Reported Skills in the Fifth Sweep of the National Child Development Study, Social Statistics Research Unit, City University.
Bynner, J, Morphy, L and Parsons, S (1997) ‘Gendered skill development’, in Metcalf, H (ed.) Women, Skill Development and Training, London: Policy Studies Institute.
Cappelli, P (1993) ‘Are skill requirements rising? Evidence from production and clerical jobs’, Industrial and Labor Relations Review, 46 (3): 515-530.
Caroli, E and Reenen, J Van (2001) ‘Skill-biased organizational change? Evidence from a panel of British and French establishments’, Quarterly Journal of Economics, 116 (4): 1449-1492.
DfEE and Cabinet Office (1996) The Skills Audit Report: A Report from an Interdepartmental Group, Occasional Paper, London: HMSO.
DfES (2000) Skills for All: Research Report from the National Skills Task Force, London: Department for Education and Skills.
DfES (2001) Meeting the Sector Skills and Productivity Challenge, London: Department for Education and Skills.
Dickerson, A and Green, F (2004) ‘The growth and valuation of computing and other generic skills’, Oxford Economic Papers, 56 (3): 371-406.
171

DiNardo, J E and Pischke, J S (1997) ‘The returns to computer use revisited: have pencils changed the wage structure too?’, Quarterly Journal of Economics CXII, (1): 291-304.
Dolton, P and Makepeace G (2004) ‘Computer use and earnings in Britain’, Economic Journal, 114 (March): C117-C129.
Elias, P (1995) ‘Social class and the standard occupational classification’, in Rose, D (ed.) A Report on Phase I of the ESRC Review of the OPCS Social Classifications, Swindon: ESRC.
Elias, P, McKnight, A and Kinshott, G (1999) ‘Monitoring and measuring occupational change: the development of SOC2000’, Skills Task Force Research Paper 19, London: Department for Education and Skills.
Felstead, A (2002) ‘Putting skills in their place: the regional pattern of work skills in late twentieth century Britain’, in Evans, K, Hodkinson, P and Unwin, L (ed.) Working to Learn: Transforming Learning and the Workplace, London: Kogan Page.
Felstead, A (2005) ‘The geography of work skills: a focus on Wales’, Briefing Paper No 6 for the Rees Review, Cardiff: Welsh Assembly Government.
Felstead, A, Ashton, D and Green, F (2000) ‘Are Britain’s workplace skills becoming more unequal?’, Cambridge Journal of Economics, 24 (6): November, 709-727.
Felstead, A, Ashton, D and Green, F (2001) ‘Paying the price for flexibility? Training, skills and non-standard jobs in Britain’, International Journal of Employment Studies, 9 (1): April, 25-60.
Felstead, A, Fuller, A, Unwin, L, Ashton, D, Butler, P and Lee, T (2005) ‘Surveying the scene: learning metaphors, survey design and the workplace context’, Journal of Education and Work, 18 (4): 359-383.
Felstead, A and Gallie, D (2004) ‘For better or worse? Non-standard jobs and high involvement work systems’, International Journal of Human Resource Management, 15 (7): 1293-1316.
Felstead, A, Gallie, D and Green, F (2002) Work Skills in Britain, 1986-2001, London: Department for Education and Skills.
Freeman, R and Schettkatt, R (2001) ‘Skill compression, wage differentials and employment: Germany vs. the US’, Oxford Economic Papers, 53 (3): 582-603.
Gallie, D (2007) ‘Task discretion and job quality’, in Gallie, D (ed.) Employment Regimes and the Quality of Work, Oxford: Oxford University Press.
Gallie, D, Felstead, A and Green, F (2004) ‘Changing patterns of task discretion in Britain’, Work, Employment and Society, 18 (2): 243-266.
Gallie, D, White, M, Cheng, Y and Tomlinson, M (1998) Restructuring the Employment Relationship, Oxford, Clarendon Press.
Green, F, Ashton, D, Burchell, B, Davies, B and Felstead, A (2000) ‘Are British workers getting more skilled?’ in Borghans, L and de Grip, A (ed.) The Over-Educated Worker? The Economics of Skill Utilisation. Cheltenham, Edward Elgar.
Green, F, Felstead, A and Gallie, D (2003) ‘Computers and the changing skill-intensity of jobs’, Applied Economics, 35 (14): 1561-1576.
172

Green, F and James, D (2001) ‘Do male bosses underestimate their female subordinates’ skills? A comparison of employees’ and line managers’ perceptions of job skills’, University of Kent at Canterbury Studies in Economics, Number 01/07.
Green, F and James, D (2003) ‘Assessing skills and autonomy: the job holder versus the line manager’, Human Resource Management Journal, 13 (1): 63-77.
Green, F. and McIntosh, S (2007) ‘Is there a genuine underutilisation of skills amongst the over-qualified?’ Applied Economics, forthcoming.
Green, F, McIntosh, S and Vignoles, A (2002) ‘The utilisation of education and skills: evidence from Britain’, The Manchester School of Economic and Social Studies.
Green, F and Tsitsianis, N (2005) ‘An investigation of national trends in job satisfaction in Britain and Germany’, British Journal of Industrial Relations, 43 (3): 401-430.
Gregory, M, Zissimos, B and Greenhalgh, C (2001) ‘Jobs for the skilled: how technology, trade, and domestic demand changed the structure of UK employment, 1979-90’, Oxford Economic Papers, 53 (1): 20-46.
Handel, M (2000) Trends in Direct Measures of Job Skill Requirements, Annandale-On-Hudson, Working Paper No. 301, Jerome Levy Economics Institute.
HM Treasury (2002) Developing Workforce Skills: Piloting a New Approach, London: HM Treasury.
HM Treasury (2005) Skills in the UK: The Long Term Challenge – Interim Report, London: HM Treasury.
HM Treasury (2006) Prosperity for All in the Global Economy – World Class Skills, London: HMSO.
Holzer, H J (1998) ‘Employer skill demands and labour market outcomes of blacks and women’, Industrial and Labor Relations Review, 52 (1): 82-98.
Howell, D and Wolff, E (1991) ‘Trends in the growth and distribution of skill in the U.S. workplace, 1960-1985’, Industrial and Labor Relations Review, 44 (3): 481-501.
Kersley, B, Alpin, C, Forth, J, Bryson, A, Bewley, H, Dix, G and Oxenbridge, S (2006) Inside the Workplace: Findings from the 2004 Workplace Employment Relations Survey, London: Routledge.
Korczynski, M (2005) ‘Skills in service work: an overview’, Human Resource Management Journal, 15(2): 3-14.
Lehto, A –M and Sutela, H (1999) Efficient, More Efficient, Exhausted, Helsinki: Statistics Finland.
Machin, A (2003) ‘The Vacancy Survey: a new series of National Statistics’, mimeo, downloaded from www.statistics.gov.uk on 26 November 2006.
Machin, S and Reenen, J Van (1998) ‘Technology and changes in skill structure: Evidence from seven OECD countries’, Quarterly Journal of Economics, 113 (4): 1215-1244.
Mason, G and Finegold, D (1995) ‘Productivity, machinery and skills in the United States and Western Europe: precision engineering’, National Institute of Economic and Social Research Discussion Paper, No. 89.
173

Mason, G, Prais, S J and van Ark, B (1992) ‘Vocational education and productivity in the Netherlands and Britain’, National Institute Economic Review, 140: 45-63.
McIntosh, S (2005) ‘Evidence on the balance of supply and demand for qualified workers’. What’s the Good of Education? The Economics of Education in the UK, edited by Machin, S and Vignoles, A, Oxford: Princeton University Press.
Nickson, D, Warhurst, C, Cullen, A M and Watt, A (2003) ‘Bringing in the excluded? Aesthetic labour, skills and training in the ‘new’ economy’, Journal of Education and Work, 16 (3): 185-203.
OECD, Human Resources Development Canada and Statistics Canada (1997) Literacy Skills for the Knowledge Society – Further Results from the International Adult Literacy Survey, Paris: OECD.
O’Leary, N and Sloane, P (2004) ‘The changing wage return to an undergraduate education in Great Britain’, WELMERC Discussion Paper No 2004-06, Swansea: Economics Department, University of Wales, Swansea.
ONS (2000) Standard Occupational Classification, Volume 1, London: Stationery Office.
ONS (2001) Jobcentre Vacancies, London: Office of National Statistics, downloaded from www.statistics.gov.uk on 26 November 2006.
ONS (2006) Virtual Bookshelf – Labour Market Statistics First Release Historical Supplement, London: Office of National Statistics, downloaded from www.statistics.gov.uk on 26 November 2006.
Payne, J (2006) ‘What’s wrong with emotional labour?’, SKOPE Research Paper No. 65. Coventry: SKOPE, University of Warwick.
PIU (2001) In Demand: Adult Skills in the 21st Century, London: Performance and Innovation Unit.
Rubery, J, Smith, M J, Fagan, C and Grimshaw, D (1999) Women’s Employment in Europe: Trends and Prospects, London: Routledge.
Shury, J, Winterbotham, M, Carter, K and Schäfer, S (2006) National Employers Skills Survey 2005: Main Results, Coventry: Learning and Skills Council.
Steedman, H and Murray, A (2001) ‘Skill profiles of France, Germany, the Netherlands, Portugal, Sweden and the UK’, European Journal for Vocational Training, (1): 22.
Strategy Unit (2002) In Demand: Adult Skills in the 21st Century – Part 2, London: Strategy Unit.
Vignoles, A and Powdthavee, N (2006) ‘Using returns to education to understand sector skill needs’, in Porter, S and Campbell, M (eds) Skills and Economic Performance, London: Capsian Publishing.
Walker, I and Zhu, Y (2005) ‘The college wage premium, overeducation and the expansion of higher education in the UK’, IZA Discussion Paper No 1627.
Williams, D (2004a) ‘Sources of data for measuring labour demand’, Labour Market Trends, 112 (9): 375-383.
Williams, D (2004b) ‘The demand for labour’, Labour Market Trends, 112 (8): 321-330.
Zuboff, S (1988) In the Age of the Smart Machine: The Future of Work and Power, New York: Basic Books.
174

TECHNICAL ANNEXE
A1. Sample Design23
The 2006 Skills Survey aimed to comprise 4,750 productive interviews. In the event, this target was slightly exceeded with an additional 50 interviews completed by the end of the fieldwork period. The 2006 Skills Survey, therefore, comprises 4,800 interviews. Area boosts were also carried out in some regions and countries of the UK adding almost 2,000 additional interviews. However, this Report focuses on the ‘core’ sample (excluding the area boosts funded by other agencies). The ‘core’ sample was intended to provide a nationally representative sample of people aged 20-65 years old who were in paid employment at the time of interview and living in Britain south of the Caledonian Canal.
The sample was based on the Postcode Address File (PAF) and involved random probability methods. The sample design employed was a conventional multi-stage design, as used in many high quality face-to-face interview-based social surveys (e.g. the British Crime Survey), using postcode sectors or combinations of postcode sectors as primary sampling units (PSUs). The convention amongst most PAF-based probability sample designs is for sample points to be stratified prior to selection by one or more stratifiers that correlate or are expected to correlate with key survey variables, since stratification generally improves the precision of survey representativeness.
A total of 35 sub-regions were identified (counties or sets of counties), each of which was divided into three bands, based on the percentage of household heads in non-manual socio-economic groups (this was based on taking the appropriate National Statistics Socio-Economic Classification categories). In each of the resulting 105 units, individual postcode sectors were listed in order of the percentage of non-retired males aged 16-74 who were unemployed. This ordered list was converted to a cumulative count of postal delivery points (addresses) and sectors were identified for the sample by identifying the sector in which a specific address was located, based on a random start and a fixed interval (total delivery points divided by the 297 sectors required). Addresses – also known as Delivery Points (DPs) – were then selected systematically within each of these postcode sectors. This was done by using an interval of M/52, with a random start between 1 and M/52, where M was the DP count for the PSU.
Interviewer assignments consisted of 52 addresses within 297 postcode sectors. The issued sample, therefore, comprise 15,444 addresses. The expectation was that just over half the addresses would be found to be eligible in meeting three criteria:
• residential and currently occupied;
• containing someone aged 20-65 years of age;
• at least one person in paid work of one hour per week or more.
Interviewers first had to determine whether there was an eligible individual to interview at each of the addresses they were given. For our purposes, they needed to be in work and aged 20-65 years old. 23 This section and the next are adapted extracts from the Technical Report of the survey company (BMRB, 2006).
175

When the interviewer was faced with a choice about selection, the procedure was based on a ‘Kish grid’, a table of randomly-generated numbers individually prepared for each address. In aggregate, the effect of using a Kish grid is to give each eligible person an equal chance of selection. It is used both for selection of the dwelling unit, where the postal delivery point contains more than one, and, far more often, for selection of a single adult person, when the dwelling unit contained two or more eligible for selection. The process of selection was fully documented on an ‘Address Contact Sheet’ (ACS), a paper document used by the interviewer to record all attempts to contact those at the address. As a measure to protect the identity of sample members the ACS was returned by interviewers to the office, separately from the computer data file (for a copy of the Address Contact Sheet used by interviewers see BMRB, 2006: Appendix F).
As there are differences in the probability of selecting each individual, depending on the number of dwelling units at the address and the number of eligible adults in the selected dwelling unit, Kish weights are used in the analysis. The data set supplied contained a Kish weight designed to take into account the differential probabilities of sample selection according to the number of dwelling units at each issued address and the number of eligible interview respondents. In other words, those from households with more eligible members for interview were given a higher weight than those from smaller households.
In order to achieve the targeted the number of interviews – in the light of corrected estimates of eligibility – a reserve sample was selected. The reserve sample was not selected at the same time as the main stage sample. So, the PSUs for the reserve sample were selected by taking the mid-point of cumulative addresses between each of the chosen PSUs. This process yielded a large number of PSUs. This was reduced to an appropriate number by randomly selecting from the list of PSUs generated. The addresses within each of the reserve sample PSUs were selected using the main fieldwork protocols described above. The issued reserve ‘core’ sample consisted of 1,248 addresses, bringing the total number of addresses issued for the survey to 16,692.
A2. Data Collection and Fieldwork Management
A2.1 Interviewer Briefings
All interviewers working on the survey undertook a whole ‘assignment’ of 52 addresses. All interviewers attended one of a series of briefing sessions on the survey, which were held at various locations around the country. These briefings were each conducted by one of BMRB’s researchers, following an agreed briefing plan and using a common set of materials. In most cases, a representative from the research team was also in attendance.
Personal briefings of interviewers play various roles and are critical to the success of the survey. Although much of the attention is devoted to practical aspects of a given survey, they have an important motivating function. By seeing that interviewers are aware of the purpose of the research, they are able to explain the study effectively to members of the sample. Standard procedures, such as reporting to the police in advance of interviewing, are also reinforced by attendance at briefings. Personal briefings are standard on most of BMRB’s face-to-face random probability surveys. Briefings were conducted in several stages. The first round of briefings started on 6 March and was completed on 16 March.
176

The second round was held between 18 April and 21 April. A few ad-hoc briefings were also arranged in June and July. The briefings covered:
• the background to the study and its aims;
• the survey population, what constitutes ‘paid work’ to determine eligibility;
• introducing the survey to members of the public, use of the advance letter and leaflet;
• sample selection procedures, using some worked examples;
• questionnaire structure;
• survey administration (led by a fieldwork supervisor).
The definition of the target population (between 20 and 65 years of age inclusive and in paid work) was given particular attention at all of the briefing sessions to ensure that interviewers understood the eligibility criteria. Extra time was taken to clarify the ‘paid work’ definition and examples were worked through to prepare interviewers for a variety of situations that they could have encountered.
All interviewers were provided with a copy of the project instructions for the survey (see BMRB, 2006: Appendix E). A video briefing was also put together by BMRB researchers and sent out to interviewers who would be working on the survey, summarising the key points from the main face-to-face briefing.
A2.2 Dates of Fieldwork
Interviewing started immediately after the first briefing session and continued to 15 October 2006 in order to maximise the response rate. Allowing contacts to continue over a period of weeks is important to minimise non-contact with people who are often away from home or absent for a period of time. In some cases interviewers had an area in which a relatively high proportion of the addresses included someone who was eligible for interview. In these cases, the interviewing work needed to be spread across a number of weeks. Table A2.1 illustrates the breakdown of interviews over the seven month fieldwork period. Almost half (47%) of the interviews were completed in the months of April and May.
177

Table A2.1 Month of Interview for ‘Core’ Sample
Month of interview
Number of interviews
Total sample %
March 427 9 April 1178 25 May 1070 22 June 729 15 July 654 14 August 358 7 September 298 6 October 86 2
A2.3 Re-issued Addresses
In addition to allocation of addresses to interviewers at the outset of the project, selected cases were ‘re-issued’, usually to a very experienced interviewer, both to ensure that reasonable response rates were achieved in more difficult areas and to maximise the overall response rate. Feedback from the original issue determined whether it would be appropriate to re-issue those addresses again, using information collected on the contact sheet. Rather than quickly re-issuing individual outcomes to available interviewers, time was spent matching cases up to the more successful interviewers on the project. A small team of re-issue interviewers was utilised, conducting a far more targeted approach. The re-issue strategy involved assessing cases on a micro level to establish the anticipated success rate with the preferred choice of interviewer.
From the core sample, 4,610 addresses were re-issued and they resulted in an additional 926 interviews being achieved. Table A2.2 shows what the original outcome was for these re-issued cases. Table A2.3 shows what outcome was achieved after those addresses had been re-issued.
Table A2.2 Re-issued Addresses – Original Outcomes
All cases n % Base: Re-issued addresses from core sample 4,610 100 No Contact No contact with selected respondent 397 8.6 Unknown eligibility due to no contact 1,008 21.9 Refusals Refusal – respondent, proxy, office 1,620 35.1 Broken appointment 352 7.6 Unknown eligibility due to refusal 913 19.8 Other unproductive 320 6.9
178

Table A2.3 Re-issued Cases – Final Outcomes n % % % % Base: Re-issued addresses from core sample
4610 100
Out of scope addresses 149 3.2 In-scope addresses 4461 96.8 100 Not screened 1202 26.9 Screened 3259 73.1 100 Screened ineligible 382 11.7 Selected eligible respondent 2877 88.3 100 No Contact 444 15.4 Refusals 1310 45.5 Other unproductive 197 6.8 Productive outcomes 926 32.2
A2.4 Household Letter and Leaflet
Owing to the wide range of sponsors of the 2006 Skills Survey advance letters were tailored with a letterhead appropriate to the sponsor’s country and remit of responsibility. Therefore, for sampled addresses in England, letters on a joint Department for Education and Skills (DfES) and Department for Trade and Industry (DTI) letterhead were prepared. For addresses in Scotland, letters were prepared on Scottish Executive letterhead, while for Welsh addresses, the letterhead was that of Futureskills Wales.
For each address, the interviewer also had an envelope, over-printed with the sponsor’s logo. Interviewers were instructed to send these letters in batches which they could follow-up personally within a couple of days. It is felt that timely contact following a letter of this type is likely to contribute to a high response rate. The letters explained the purpose of the survey and the importance of taking part. It also mentioned whom to contact if the members of the household were unwilling to take part in the survey. A freephone number was provided at BMRB for any enquiries which members of the public wished to make.
Interviewers were also asked to send a leaflet along with the respondent letter in advance. This was prepared by the research team in association with BMRB and gave more details about some of the issues included in the questionnaire and referred to sources where further information could be found (such as a survey web site).
A2.5 Selected Respondent Letter
The initial letter was necessarily addressed to ‘The Resident’, as there was not a named person to interview at that stage. In order to maximise the response rate a personally addressed letter to introduce the survey to the selected respondent was designed once an
179

eligible interview had been chosen. The idea behind this letter was that it would help to reinforce the importance of taking part in the survey, and would minimise possible problems of the interviewer’s call not being mentioned to the person selected (if selected in his or her absence) or the purpose of the interview not being explained adequately.
A2.6 Refusal Conversion Letter
It is standard BMRB practice to re-issue any unproductive outcomes (e.g. refusals, non-contacts) to alternative interviewers. This can be a significant vehicle for boosting response and addresses are re-issued twice, sometimes three or four times (see Section A2.3). Tied in with the re-issue approach is the use of specially targeted letters to respondents who refused to participate in the survey. These letters are a useful way of re-introducing the survey to respondents and provide a starting point for the interviewer when they make their first re-issue visit.
A2.7 Introducing the Survey and Incentives
Interviewers were given guidelines on how best to introduce the survey and answer questions which the respondent may have. The survey initially offered no financial incentives for respondents to participate. However, they were introduced for the reserve sample and re-issued addresses from June 2006 onwards as another method of maximising response rates.
A £5 conditional incentive payable to the respondent on completion of the interview was employed. This was in the form of a £5 high street gift voucher. The advance letter and second letter were amended to make respondents aware of this incentive. Eighteen% of respondents took up this incentive and they are indicated on the dataset by the variable ‘incentive’.
A2.8 Self-completion Questions
Blocks C and K contained questions which respondents were encouraged to answer by self-completion, keying a numeric answer on the computer. The questions were suitable for this approach because they followed a simple pattern.
Four in five respondents (81%) completed Block C on the computer, with this dropping to 80% for Block K. This was an increase from the 2001 survey when 77% of respondents completed Block C themselves.
A2.9 Length of Interview
In estimating the workloads of interviewers, it was planned that interviews should have an average length of 55 minutes. Some variation in the length of interview was allowed for according to factors such as whether respondents had been working in the past, in
180

which case they would qualify for additional questions (in Blocks H and J). In the event, the median length of interviews was 53 minutes. This was based on the time difference between the start and finishing times, as recorded on the interviewers’ computers.
The distribution of interview lengths shows considerable variation around the median. Various timings are presented in Table A2.4, broken down by respondent characteristics. Table A2.5 shows the average length of each section of the questionnaire24.
Table A2.4 Length of Interview
Type of interview Mean length (minutes)
Median length (minutes)
Unweighted base
Full productive interviews 59 53 4,800
12 to 29 minutes 26 28 91
30 to 44 minutes 39 40 1,152
45 to 59 minutes 52 52 1,924
60 to 74 minutes 65 65 978
75 minutes and over 116 89 639
Block C by respondent 60 53 3,910
Block C by interviewer 56 52 890
Respondent in same job 5/4/3 years ago
60 53 2,840
Respondent in different job 5/4/3 years ago
59 53 1,789
Respondent was not in work 5/4/3 years ago
55 49 171
Employed in Organisation 60 53 4,319
Not employed in Organisation 53 46 481
24 The total of all the block interview lengths does not match the overall average. This is because it omits the time taken to set up the survey and issue the standard ‘Thanks’ at the end.
181

Table A2.5 Length of Questionnaire Sections
Block Mean length (minutes:seconds)
Median length (minutes:seconds)
A: Checking Eligibility 1:45 0:25
B: Broad Questions about the Job 14:09 13:31
C: Detailed Job Analysis Questions 6:29 5:54
D: Computing Skills and Qualifications Questions
6:10 5:37
F: Work Attitudes 2:48 2:34
E: The Organisation 4:53 4:48
G: Pay Questions 1:30 1:19
H: The Job Five Years Ago 1:15 1:07
J: Recent Skill Changes and Future Perspectives
6:31 6:21
K: Personal Details 4:28 3:55
Q: Details of Organisation and Conclusion 4:45 3:47
A2.10 Supervision and Quality Control
One of the key methods of quality control on data collection is regular accompaniment of each interviewer by a supervisor. A total of 29 interviewers were accompanied during assignments on this project.
A second quality control measure is re-contact with members of the sample, to check on certain details of the information collected by the interviewer. Eleven percent of the productive interviews (542 cases) were back-checked, of which 474 were conducted by telephone and the remainder by post. No cases were considered unsatisfactory.
A3. Survey Outcomes
A3.1 Response Rate
The response rate is an indicator of survey representativeness. If the response rate is high, one can be confident that any bias in the achieved sample is likely to be small. The key problem with survey non-response is that often one knows little about the non-responding case. The nature and extent of bias can be estimated using other statistical data relating to the employed population. Such data may allow corrections to be applied to the survey data, using weighting in the analysis (see Section A3.3).
182

The response rate is also used as a measure of interviewer performance, where the starting point is the set of addresses where there was any prospect of conducting an interview. This is usually a smaller number than the issued sample, on account of deficiencies in the sample frame. With a survey which involves screening, there is a further complication with the calculation of response rates since in some cases the interviewer was unable to establish whether the address contained someone within the scope of the survey population – in this survey someone aged 20 to 65 and in paid work of one hour or more per week.
This means that response rates can be calculated and presented in two ways. The first focuses on the extent to which BMRB completed the screening of households and, where appropriate, conducted full interviews with eligible respondents. This is sometimes referred to as the gross response rate since it assumes that all those not screened were ineligible for interview. Secondly, the reliability of the results generated by the survey can be influenced by the extent to which sample households with eligible respondents participated in the survey. This is known as the net response rate and is based on assumptions about the proportion of households with eligible respondents who refused to be screened. We know that for the complete sample that the incidence of eligibility was about 57%. It, therefore, seems reasonable to apply this percentage to addresses where interviewers could not ask the questions to establish eligibility and calculate the response rate on this basis.
The two response rate calculations are set out in Tables A3.1 and A3.2. The total sample of addresses consisted of 16,692 addresses (15,444 in the original plus 1,248 in the reserve sample). The postcode address file contains some addresses which are either non-residential or unoccupied. These addresses are known as ‘deadwood’ and, in this survey, comprised 8.8% of the issued sample. The remaining addresses are referred to as the in-scope sample.
The first contact was a letter sent by interviewers in advance of any call at the selected addresses. Many recipients of these letters contacted BMRB, often explaining why they considered they were inappropriate to take part in the survey (e.g. no-one living at the address was in paid work) or that they were unwilling to be interviewed. Where the reason for the call could be ascertained, the case was coded accordingly. There remain a few cases where it could not be established whether residents at the address would have been eligible for an interview.
In many cases, interviewers were able to contact the residents and established by screening that an occupied, residential address was not within the scope of the study. Where screening was not conducted, this was either due to the interviewer being unable to contact a responsible adult at the address, or being met with a refusal to give the information required for respondent selection. Screening was carried out on 13,736 addresses. The first stage of this process was to ask about the number of occupied dwelling units at the address. In a small percentage of cases, where there are two or more, the interviewer selects one dwelling unit (using a Kish grid method to ensure equal probabilities across all addresses), and then proceeds to enumerate the adult residents who are within the age range 20-65 and who are in paid work. Again, the Kish grid is used to select one person from those eligible for interview. At each of these stages in the process, some people declined to provide the information needed to complete the sampling – 1,494 (9.8% of in scope addresses). However, of those screened interviewers were successfully able to identify 7,784 eligible respondents.
183

Not all of the 7,784 eligible individuals agreed to be interviewed. Around quarter (27%) refused to participate after screening. These refusals took the form of personal refusals (15%), proxy refusals (8%) or else interview appointments were made but not kept (5%). In other cases interviews could not take place for other reasons such as an inability to make contact after selection, illness or absence from the place of residence during the survey period. Nevertheless, 4,800 productive interviews were completed. This represents a gross response rate of 61.7% of those identified as eligible for interview (Table A3.1).
Table A3.1 Gross Response Rate Outcome category ACS Code Number % % % % Original issued addresses 16,692 100.0 Out of scope addresses: 1,462 8.8 - insufficient address 11, 12 13 0.1 - not traced 13 121 0.7 - not built 1 30 0.2 - derelict/demolished 2 88 0.5 - empty dwelling 3 770 4.6 - business premises 4 225 1.3 - institution 5 27 0.2 - holiday home 6 124 0.7 - other out of scope 10 64 0.4 In scope of screening 15,230 91.2 100.0 Not screened: 1,494 9.8 - no contact with an adult 14, 16, 18,
19, 20 613 4.0
- refusal (including head office)
15, 17, 31 881 5.8
Screened 13,736 90.2 100.0 No-one aged 20-65 in paid work
7, 32 5,952 43.3
Selected eligible respondent 7,784 56.7 100.0 Non-contact after screening 35 295 3.8 Refusal after screening: 2,131 27.4 - personal refusal 36, 38 1,171 15.0 - proxy refusal 37 589 7.6 - broken appointment 39 371 4.8 Other unproductives: 558 7.2 - ill during survey 40 17 0.2 - away/in hospital 41 233 3.0 - senile/incapacitated 42 19 0.2 - inadequate English 43 50 0.6 - other unproductive 44 239 3.1 Productive interviews 51, 52 4,800 61.7
184

It is also important to be aware of the net response rates to any survey since they also take into account the extent to which market research companies are able to successfully screen addresses. This is bound to reduce reported response rates since it is often not possible to screen all the addresses issued. However, some of those addresses not screened are likely to contain individuals eligible for interview. To calculate the net response rate one needs to make an adjustment which takes this into account. Certain assumptions have to be made to do so. For one thing, we simply do not know what proportion addresses not screened contain individuals eligible for interview. However, it is reasonable to assume that the proportion is similar to the proportion of addresses successfully screened in field. In our case the figure was 57%. In other words, of the 1,494 addresses not screened by BMRB for this survey we can assume that 847 contained individuals who were eligible for interview. Were the screening of households 100% successful, therefore, we would have had 7,784 + 847 eligible individuals to interview (Table A3.2). The fact that BMRB successfully interviewed 4,800 of them suggests that the net response rate was 55.6% (4,800/(7,784+847)). Even though the screening of households was completed in the overwhelming majority of cases (91.2%), failure to screen even a small percentage of households has an impact on the net response rate recorded. One should, therefore, be wary about comparing response rates across surveys since those which screen (such as ours) will inevitably post lower net response rates than those whose sample comprises a list of pre-selected named individuals.
Table A3.2 Net Response Rate
Outcome category ACS Code Number % % % % Original issued addresses 16,692 100.0 Out of scope addresses: 1,462 8.8 - insufficient address 11, 12 13 0.1 - not traced 13 121 0.7 - not built 1 30 0.2 - derelict/demolished 2 88 0.5 - empty dwelling 3 770 4.6 - business premises 4 225 1.3 - institution 5 27 0.2 - holiday home 6 124 0.7 - other out of scope 10 64 0.4 In scope of screening 15,230 91.2 100.0 Not screened: 1,494 9.8 - no contact with an adult 14, 16, 18,
19, 20 613 4.0
- refusal (including head office)
15, 17, 31 881 5.8
Screened 13,736 90.2 100.0 No-one aged 20-65 in paid work
7, 32 5,952 43.3
Selected eligible respondent 7,784 56.7 100.0
185

186
Not screened, but assumed eligible
847
Estimated eligible addresses 8,631 100.0 Not screened, but assumed eligible
847 9.8
Non-contact after screening 35 295 3.4 Refusal after screening: 2,131 24.7 - personal refusal 36, 38 1,171 13.6 - proxy refusal 37 589 6.8 - broken appointment 39 371 4.3 Other unproductives: 558 6.5 - ill during survey 40 17 0.2 - away/in hospital 41 233 2.7 - senile/incapacitated 42 19 0.2 - inadequate English 43 50 0.6 - other unproductive 44 239 2.8 Productive interviews 51, 52 4,800 55.6
A3.2 Comparisons with Other Surveys
It is useful to compare the 2006 Skills Survey response rates with those of its predecessor in 2001 (see Table A3.3). It is immediately apparent that the response rate – however, measured – has fallen from the levels achieved in 2001. The gross response rate has fallen by seven percentage points, while the net response rate has fallen by nine percentage points.
Table A3.3 Comparative Gross and Net Response Rates
Survey
Gross Response Rate (%)
Net Response Rate (%)
2001 Skills SurveyTP
25PT
68.9 64.8
2006 Skills Survey 61.7 55.6
However, this is a common trend experienced by similar surveys and it is not an issued confined to this survey alone. The Labour Force Survey (LFS), for example, is a quarterly sample survey of households living at private addresses in Britain. Its purpose is
TP
25PT The 2001 response rate calculations previously presented (Felstead et al., 2002: 90-93) have been
recalculated according to BMRB protocols. This treats selected individuals who were screened but not contacted for interview as ‘non-contact with selected adult’ and therefore treated as part of the unproductive but eligible for interview sample. Therefore, the previously published figures have been revised to allow comparisons to be made between the 2001 and 2006 Skills Surveys.

187
to provide information on the UK labour market that can then be used to develop, manage, evaluate and report on labour market policies. An analysis of recent response rates to this survey have showed a similar decline in response rates (see Figure A3.1). Over the last three years, the LFS response rate has also fallen by seven percentage points. It is therefore unsurprising to find that the response rate to the skills surveys has also suffered a fall, even though a strategy was put in place to try to counter this tendency. This consisted of a number of measures which included: ensuring the survey design reduced respondent burden sufficiently (advance letters, information leaflet, incentives); ensuring interviewers and the fieldwork process were managed properly; and adopting an intensive reissue strategy.
Figure A3.1 Labour Force Survey (Wave 1), Response Rates, 2003-2006
66
68
70
72
74
76
78
Dec-F
eb03
Mar-May
03
Jun-A
ug03
Sept-N
ov03
Dec-F
eb04
Mar-May
04
Jun-A
ug04
Sept-N
ov04
Dec-F
eb05
Mar-May
05
Jun-A
ug05
Sept-N
ov05
Jan-M
ar06
Apr-Ju
n06
July-
Sep06
Quarter
Res
pons
e ra
te (%
)
Source: Labour Force Survey Performance and Quality Monitoring Report (various)TP
26PT
A3.3 Survey Representativeness
Although the sample design should ensure that it is representative of workers in Britain, we first checked whether the sample is broadly representative. We classified the data against some standard socio-economic variables, and compared the 2006 Skills Survey figures with those from the Spring 2006 Labour Force Survey (LFS). Since the LFS has a substantially larger sample size, and since it gleans information from every member of households, it can be argued that the LFS sample is likely to be closely representative of the workforce.
TP
26PT Available at HTUhttp://www.statistics.gov.uk/StatBase/Product.asp?vlnk=10675 UTH

188
Table A3.4, below, presents this comparison, where the figures in brackets are the figures from the LFS (excluding the Northern Ireland sample). The base is those in employment and aged between 20 and 65 inclusive. We compare the representation of the two samples in terms of sex, age, ethnicity, working time status, occupation, industrial sector and qualification level.

189
Table A3.4 Socio-Economic Distribution of the Sample
All All (%) Males (%) Females (%) All
4800
100
100
100
Sex Male 2365 49.3 (53.5) 100 0 Female 2435 50.7 (46.5) 0 100 Age groups: 20-29 798 16.6 (20.3) 15.9 (19.9) 17.3 (20.7) 30-39 1297 27.0 (25.6) 25.1 (25.8) 28.9 (25.3) 40-49 1378 28.7 (27.1) 28.2 (26.5) 29.2 (27.8) 50-60 1133 23.6 (22.7) 25.5 (22.8) 21.7 (22.6) 61-65 194 4.1 (4.4) 5.3(5.1) 2.9 (3.6) Ethnicity White 4482 93.6 (92.8) 93.5 (92.3) 93.6 (93.3) All non-white 309 6.4 (7.2) 6.5 (7.7) 6.4 (6.7) Working Time Full-Time 3652 76.1 (77.2) 92.4 (92.5) 60.2 (59.5) Part-time 1148 23.9 (22.8) 7.6 (7.5) 39.8 (40.5) Occupation (SOC2000) Managers 722 15.0 (16.0) 19.6 (19.6) 10.6 (11.9) Professionals
586 12.2 (13.8) 10.8 (14.6) 13.5 (12.9)
Associate Professionals
769 16.0 (15.0) 15.4 (13.8) 16.7 (16.4)
Administrative & Secretarial
596 12.4 (12.2) 5.7 (4.8) 19.0 (20.7)
Skilled Trades
538 11.2 (10.7) 19.7 (18.4) 3.0 (1.8)
Personal Services 401 8.4 (7.8) 1.8 (2.2) 14.7 (14.3) Sales
304 6.3 (6.5) 2.8 (3.6) 9.8 (9.8)
Plant & Machine Operatives
394 8.2 (7.7) 13.7 (12.5) 2.9 (2.1)
Elementary 485 10.1 (10.4) 10.5 (10.6) 9.8 (10.1) Industry (SIC92) Agriculture & fishing
54 1.1 (1.2) 1.7 (1.7) 0.6 (0.6)
Energy & water
49 1.0 (1.0) 1.7 (1.5) 0.3 (0.6)
Manufacturing 681 14.3 (13.4) 21.5 (18.6) 7.3 (7.4)

190
Construction
301 6.3 (8.0) 11.2 (13.3) 1.6 (1.9)
Distribution, hotels & restaurants
766 16.1 (17.0) 13.5 (15.5) 18.6 (18.7)
Transport & communication
313 6.6 (7.0) 9.9 (10.0) 3.3 (3.6)
Banking, finance & insurance etc
757 15.9 (16.4) 17.4 (17.3) 14.5 (15.3)
Public admin, education & health
1618 34.0 (30.1) 19.3 (16.7) 48.1 (45.6)
Other services
225 4.7 (5.9) 3.8 (5.4) 5.6 (6.4)
Highest Qualifications Degree or equivalent
1068 22.3 (23.1) 21.4 (23.1) 23.1 (23.2)
No qualification 508 10.6 (8.7) 11.9 (8.7) 9.3 (8.8) Note:
All figures are weighted by a factor that takes into account the differential probability of being sampled; numbers may not add to 100% due to rounding.
We find that, broadly, the achieved sample is indeed representative of Britain. The proportions are remarkably close to those of the LFS on most variables. However, the 2001 Skills Survey sample under-represents males compared to the LFS population by around four percentage points. This finding is broadly to be expected on the basis of previous surveys. It is likely that the difference arises from a slightly higher non-contact rate for males. We therefore add a sex weight to the Kish weight described earlier (see Section A1). The younger age group (those 20-29 years old) are also under-represented in our survey by around four percentage points. The analysis reported here takes account of these discrepancies by using a combined weight that corrects for household size and number of dwelling units at each address (the Kish weight) as well as the under-representation of men and the young in the sample. The result is a new weighting variable, which ensures that the estimated proportions of men, women and the young exactly reproduce the proportions in the LFS sample (this is indicated on the dataset by the variable ‘newwt65’).
This Report also compares the results from previous surveys in the series. However, those surveys were focused on the 20-60 age group. Table A3.5 therefore, evaluates how representative the 2006 Skills Survey is of this age group. A similar picture of broad comparability with under-representation of men and the young emerges. A separate weight was designed to correct for these observed sampling biases. This was used along with the Kish weight when comparisons are made between the 2006 Skills Survey and those which it preceded (this is indicated on the dataset by the variable ‘newwt’).

191
Table A3.5 Socio-Economic Distribution of the Sample (20-60 year olds)
All All (%) Males (%) Females (%) All
4606
100
100
100
Sex Male 2240 48.6 (53.1) 100 0 Female 2365 51.4 (46.9) 0 100 Age groups: 20-29 798 17.3 (21.2) 16.8 (21.0) 17.9 (21.5) 30-39 1297 28.2 (26.7) 26.5 (27.2) 29.7 (26.2) 40-49 1378 29.9 (28.4) 29.8 (27.9) 30.1 (28.9) 50-60 1133 24.6 (23.7) 26.9 (24.0) 22.4 (23.5) Ethnicity White 4297 93.5 (92.6) 93.3 (92.1) 93.6 (93.1) All non-white 301 6.5 (7.4) 6.7 (7.9) 6.4 (6.9) Working Time Full-Time 3526 76.6 (78.0) 93.0 (93.4) 61.0 (60.5) Part-time 1080 23.4 (22.0) 7.0 (6.6) 39.0 (39.5) Occupation (SOC2000) Managers 692 15.0 (16.1) 19.4 (19.6) 10.9 (12.0) Professionals
564 12.3 (13.9) 11. 0 (14.6) 13.4 (13.0)
Associate Professionals
752 16.3 (15.2) 15.8 (14.0) 16.8 (16.6)
Administrative & Secretarial
563 12.2 (12.3) 5.6 (4.8) 18.5 (20.6)
Skilled Trades
517 11.2 (10.6) 19.9 (18.4) 3.1 (1.8)
Personal Services 392 8.5 (7.9) 1.8 (2.2) 14.9 (14.3) Sales
296 6.4 (6.5) 2.9 (3.7) 9.8 (9.8)
Plant & Machine Operatives
367 8.0 (7.5) 13.4 (12.2) 2.9 (2.1)
Elementary 458 10.0 (10.2) 10.2 (10.5) 9.7 (9.9) Industry (SIC92) Agriculture & fishing
51 1.1 (1.1) 1.7 (1.7) 0.6 (0.6)
Energy & water
47 1.0 (1.0) 1.7 (1.4) 0.4 (0.6)
Manufacturing
649 14.2 (13.4) 21.5 (18.6) 7.3 (7.5)

192
Construction
283 6.2 (8.0) 11.1 (13.3) 1.6 (1.9)
Distribution, hotels & restaurants
740 16.2 (17.0) 13.6 (15.6) 18.6 (18.5)
Transport & communication
295 6.4 (7.0) 9.7 (10.0) 3.4 (3.6)
Banking, finance & insurance etc
730 16.0 (16.5) 17.5 (17.4) 14.6 (15.5)
Public admin, education & health
1565 34.2 (30.2) 19.6 (16.7) 48.0 (45.5)
Other services
211 4.6 (5.8) 3.5 (5.4) 5.6 (6.4)
Highest Qualifications Degree or equivalent
1046 22.7 (23.6 ) 22.0 (23.4) 23.4 (23.7)
No qualification 458 10.0 (8.2 ) 11.0 (8.1) 8.9 (8.2)
Note:
All figures are weighted by a factor that takes into account the differential probability of being sampled; numbers may not add to 100% due to rounding.