skim at sawtooth software conference 2013: acbc revisited
TRANSCRIPT
expect great answers
ACBC Revisited 2013 Sawtooth Software Conference
October 2013 | Marco Hoogerbrugge, Jeroen Hardon, Chris Fotenos

ACBC Introduction
2
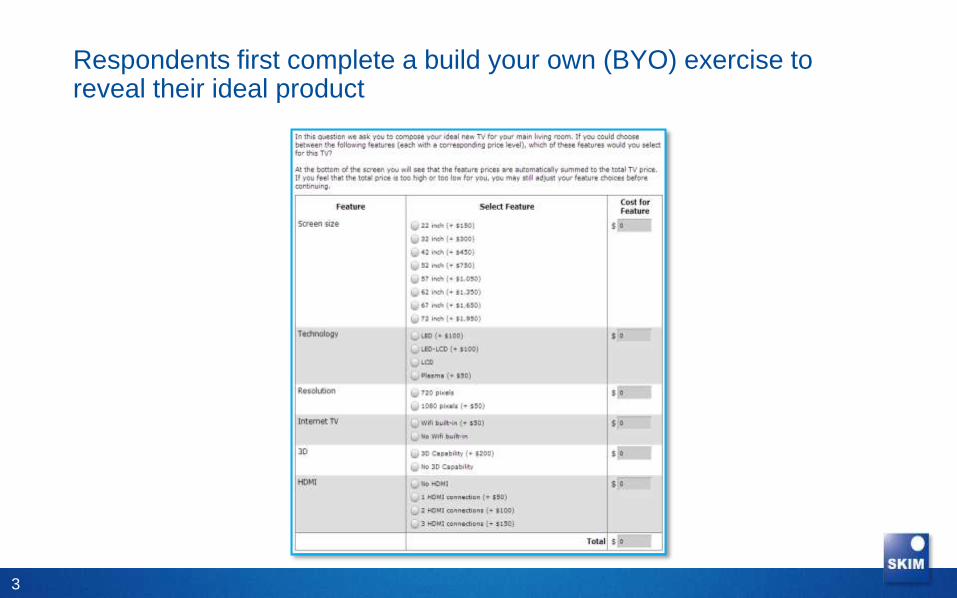
Respondents first complete a build your own (BYO) exercise to reveal their ideal product
3
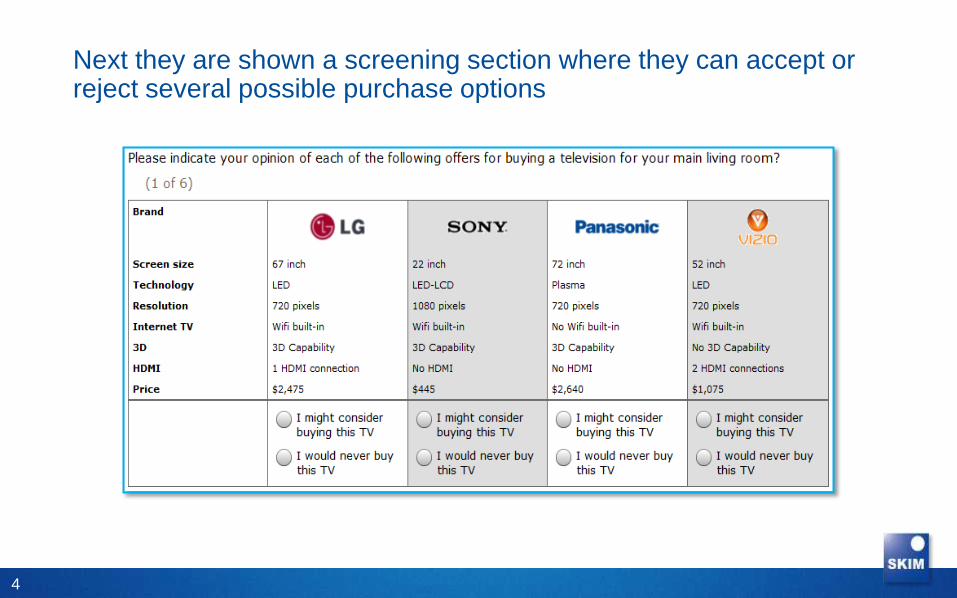
Next they are shown a screening section where they can accept or reject several possible purchase options
4
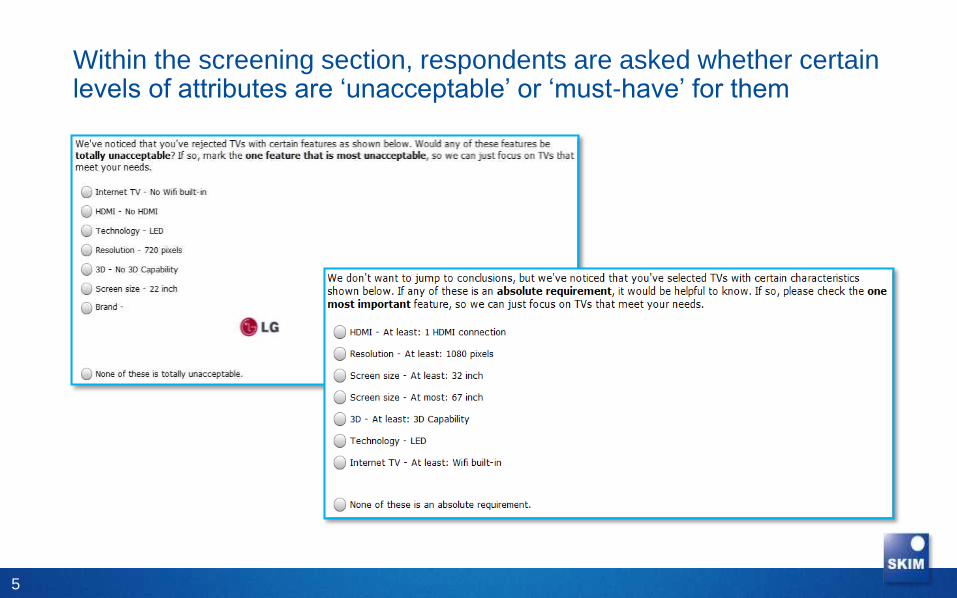
Within the screening section, respondents are asked whether certain levels of attributes are ‘unacceptable’ or ‘must-have’ for them
5
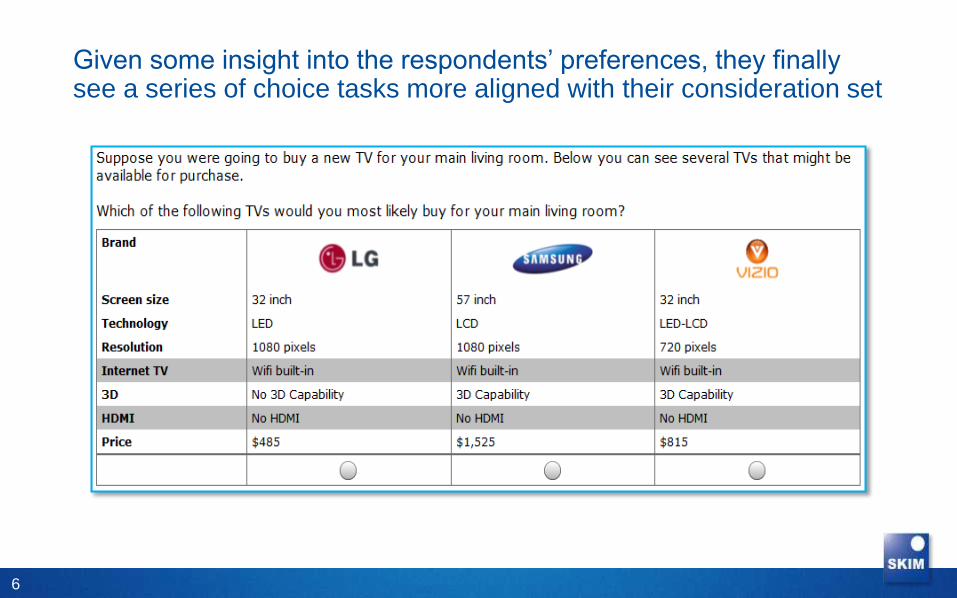
Given some insight into the respondents’ preferences, they finally see a series of choice tasks more aligned with their consideration set
6
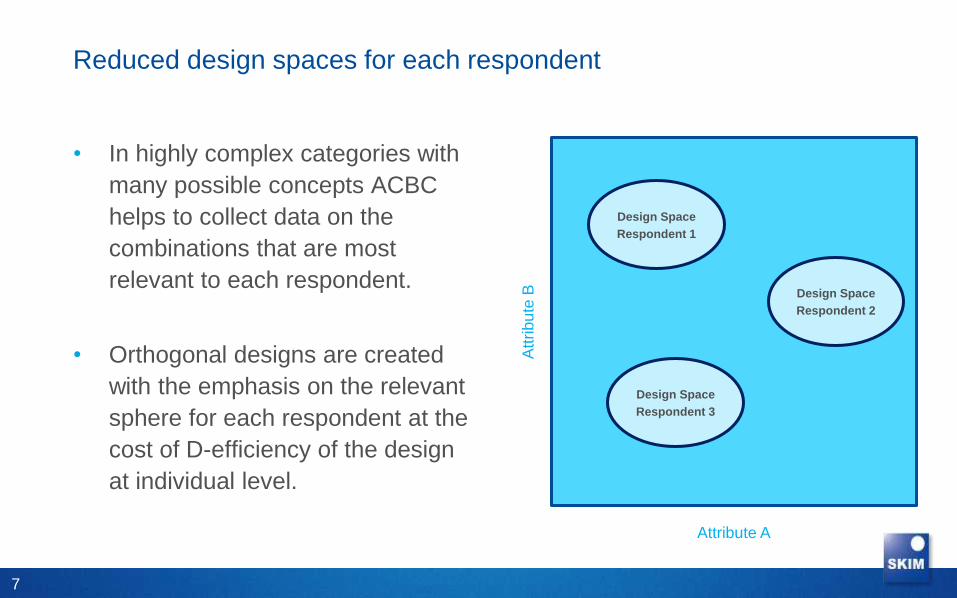
Reduced design spaces for each respondent
• In highly complex categories with
many possible concepts ACBC
helps to collect data on the
combinations that are most
relevant to each respondent.
• Orthogonal designs are created
with the emphasis on the relevant
sphere for each respondent at the
cost of D-efficiency of the design
at individual level.
7
Attribute A A
ttrib
ute
B
Design Space
Respondent 3
Design Space
Respondent 2
Design Space
Respondent 1
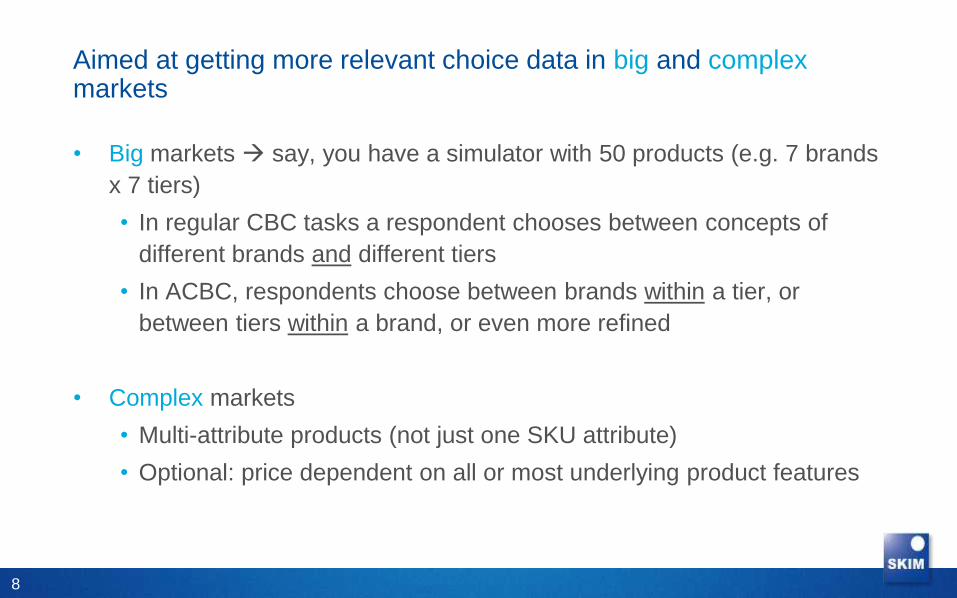
Aimed at getting more relevant choice data in big and complex markets
• Big markets say, you have a simulator with 50 products (e.g. 7 brands
x 7 tiers)
• In regular CBC tasks a respondent chooses between concepts of
different brands and different tiers
• In ACBC, respondents choose between brands within a tier, or
between tiers within a brand, or even more refined
• Complex markets
• Multi-attribute products (not just one SKU attribute)
• Optional: price dependent on all or most underlying product features
8
To assess and search for ways to improve ACBC, we
tested several variations of it along with other
methodologies in the US TV market.
9
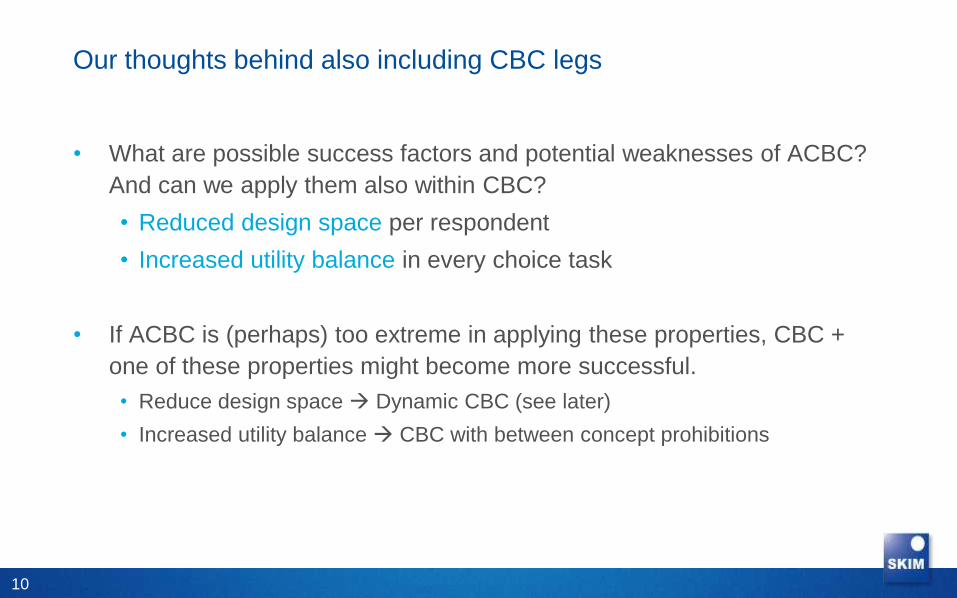
Our thoughts behind also including CBC legs
• What are possible success factors and potential weaknesses of ACBC?
And can we apply them also within CBC?
• Reduced design space per respondent
• Increased utility balance in every choice task
• If ACBC is (perhaps) too extreme in applying these properties, CBC +
one of these properties might become more successful.
• Reduce design space Dynamic CBC (see later)
• Increased utility balance CBC with between concept prohibitions
10
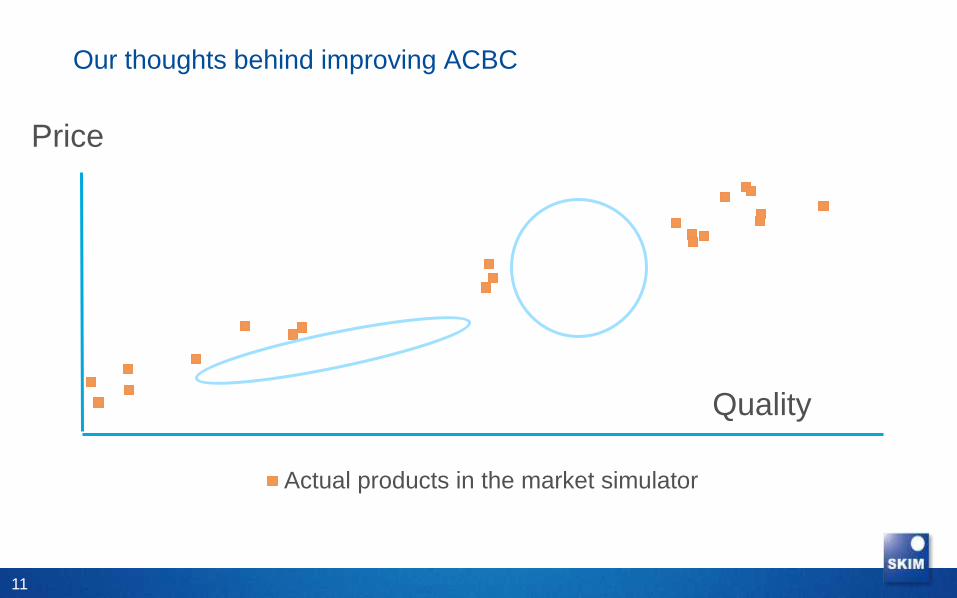
Our thoughts behind improving ACBC
Actual products in the market simulator
11
Quality
Price
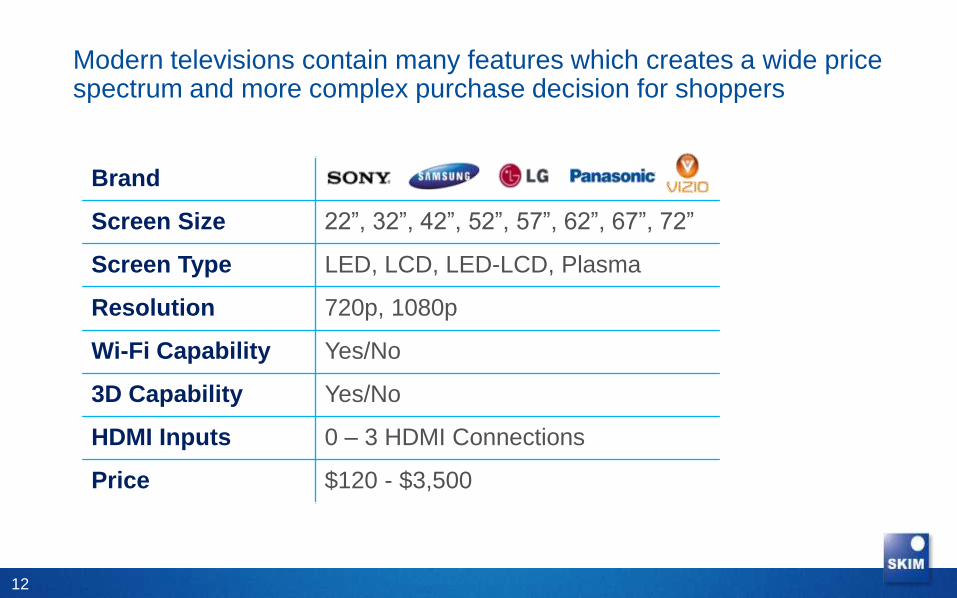
Modern televisions contain many features which creates a wide price spectrum and more complex purchase decision for shoppers
12
Brand
Screen Size 22”, 32”, 42”, 52”, 57”, 62”, 67”, 72”
Screen Type LED, LCD, LED-LCD, Plasma
Resolution 720p, 1080p
Wi-Fi Capability Yes/No
3D Capability Yes/No
HDMI Inputs 0 – 3 HDMI Connections
Price $120 - $3,500
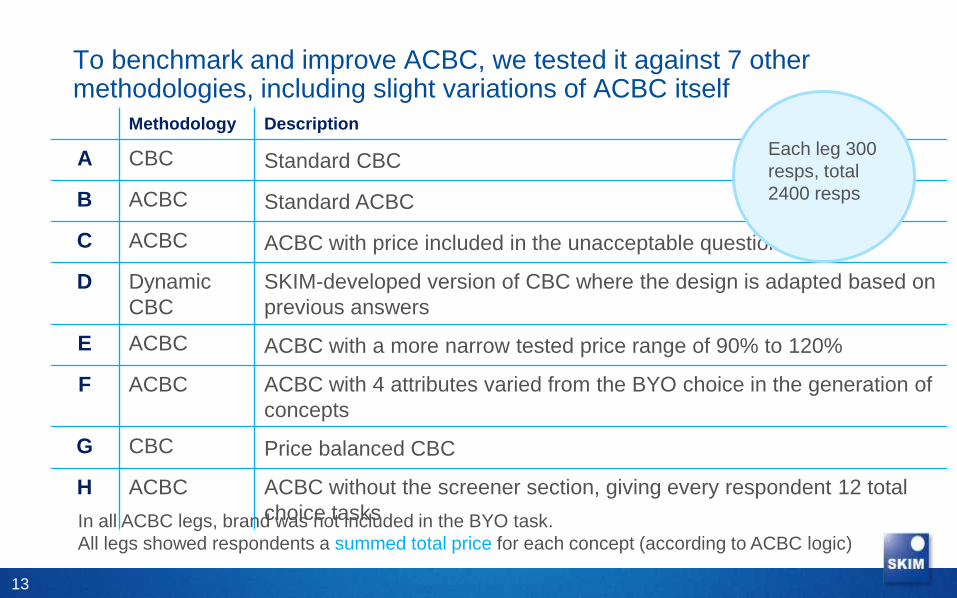
To benchmark and improve ACBC, we tested it against 7 other methodologies, including slight variations of ACBC itself
13
Methodology Description
A CBC Standard CBC
B ACBC Standard ACBC
C ACBC ACBC with price included in the unacceptable questions
D Dynamic
CBC
SKIM-developed version of CBC where the design is adapted based on
previous answers
E ACBC ACBC with a more narrow tested price range of 90% to 120%
F ACBC ACBC with 4 attributes varied from the BYO choice in the generation of
concepts
G CBC Price balanced CBC
H ACBC ACBC without the screener section, giving every respondent 12 total
choice tasks In all ACBC legs, brand was not included in the BYO task.
All legs showed respondents a summed total price for each concept (according to ACBC logic)
Each leg 300
resps, total
2400 resps

Dynamic CBC shows respondents a full set of CBC-like choice tasks with an ACBC-like design that is adapted based on their responses
14
Design Space: Tasks 1-3
Attribute A A
ttrib
ute
B
• Like standard CBC, Dynamic CBC starts
with a near-D-efficient design space for all
respondents.
• Respondents see a full set of choice tasks.
• After 1/3 and 2/3 of the choice tasks, the
design space is narrowed down based on
the respondents’ choices in order to collect
more data on the concepts that are most
relevant to them.
Design Space: Tasks 4-6
Design Space: Tasks 7-9
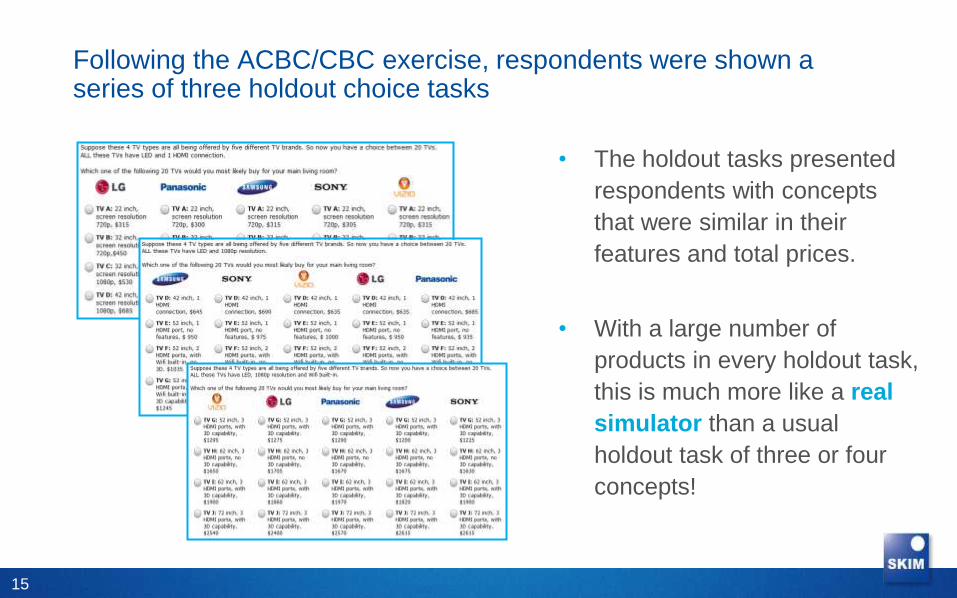
Following the ACBC/CBC exercise, respondents were shown a series of three holdout choice tasks
15
• The holdout tasks presented
respondents with concepts
that were similar in their
features and total prices.
• With a large number of
products in every holdout task,
this is much more like a real
simulator than a usual
holdout task of three or four
concepts!
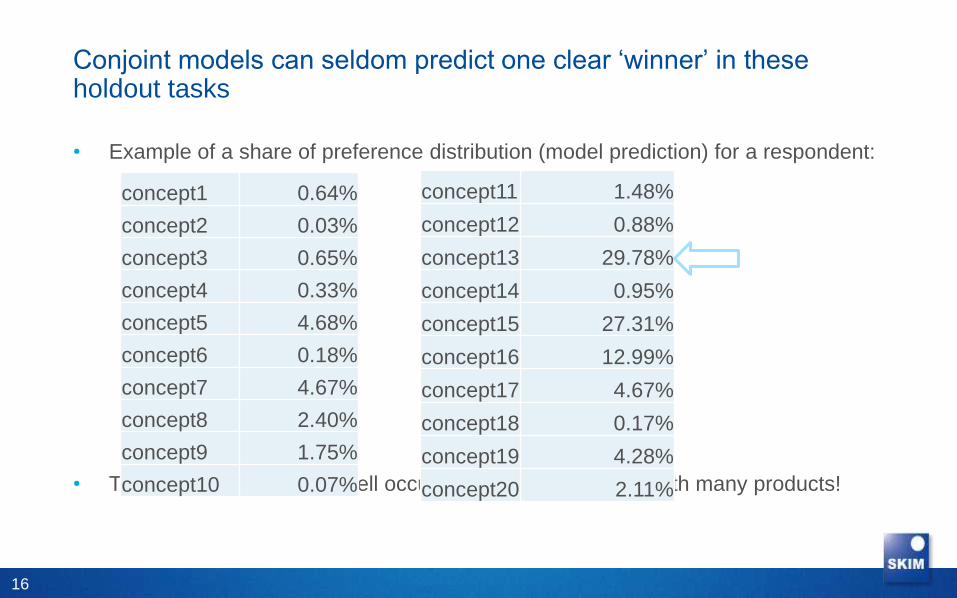
Conjoint models can seldom predict one clear ‘winner’ in these holdout tasks
• Example of a share of preference distribution (model prediction) for a respondent:
• This same problem may well occur with actual simulators with many products!
16
concept1 0.64%
concept2 0.03%
concept3 0.65%
concept4 0.33%
concept5 4.68%
concept6 0.18%
concept7 4.67%
concept8 2.40%
concept9 1.75%
concept10 0.07%
concept11 1.48%
concept12 0.88%
concept13 29.78%
concept14 0.95%
concept15 27.31%
concept16 12.99%
concept17 4.67%
concept18 0.17%
concept19 4.28%
concept20 2.11%
Success metric: mean SoP
So we thought it better to look at the means of the
predicted share of preference
of the
concepts that the respondent chose in the three holdout tasks.
17
First results: respondents enjoy taking a (well
designed) conjoint experience
18
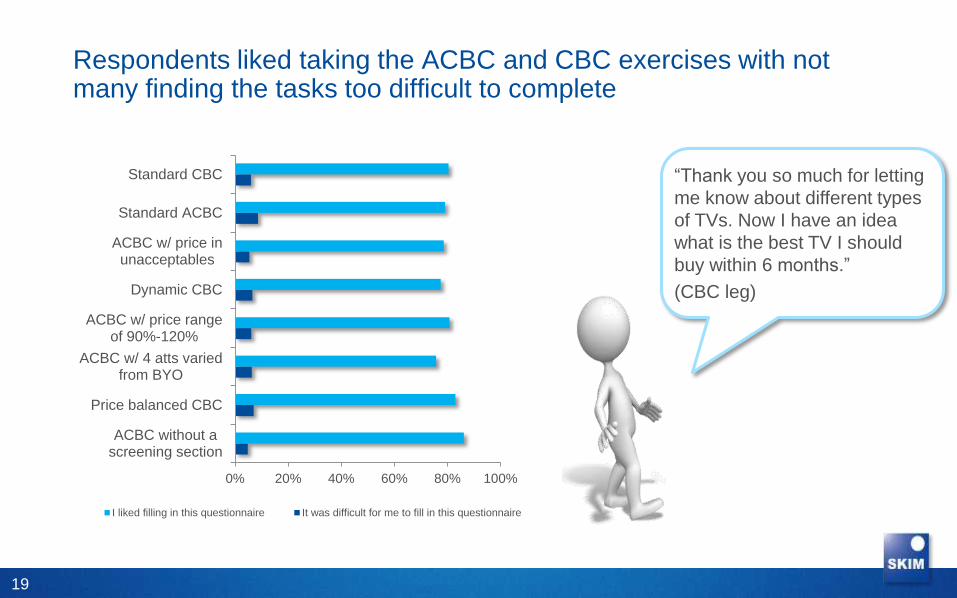
Respondents liked taking the ACBC and CBC exercises with not many finding the tasks too difficult to complete
19
0% 20% 40% 60% 80% 100%
ACBC without ascreening section
Price balanced CBC
ACBC w/ 4 atts variedfrom BYO
ACBC w/ price rangeof 90%-120%
Dynamic CBC
ACBC w/ price inunacceptables
Standard ACBC
Standard CBC
I liked filling in this questionnaire It was difficult for me to fill in this questionnaire
“Thank you so much for letting
me know about different types
of TVs. Now I have an idea
what is the best TV I should
buy within 6 months.”
(CBC leg)
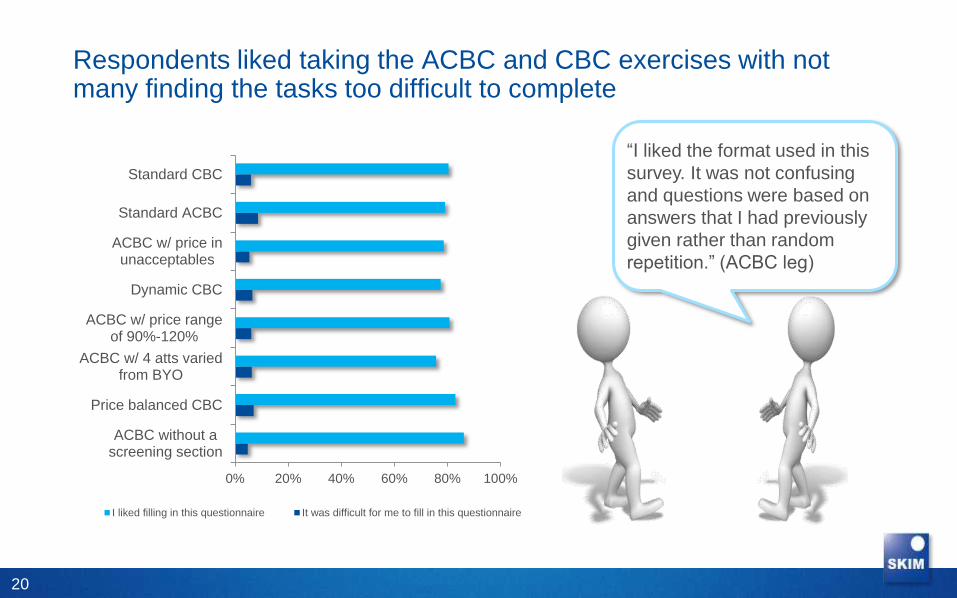
Respondents liked taking the ACBC and CBC exercises with not many finding the tasks too difficult to complete
20
0% 20% 40% 60% 80% 100%
ACBC without ascreening section
Price balanced CBC
ACBC w/ 4 atts variedfrom BYO
ACBC w/ price rangeof 90%-120%
Dynamic CBC
ACBC w/ price inunacceptables
Standard ACBC
Standard CBC
I liked filling in this questionnaire It was difficult for me to fill in this questionnaire
“I liked the format used in this
survey. It was not confusing
and questions were based on
answers that I had previously
given rather than random
repetition.” (ACBC leg)

Main results
21
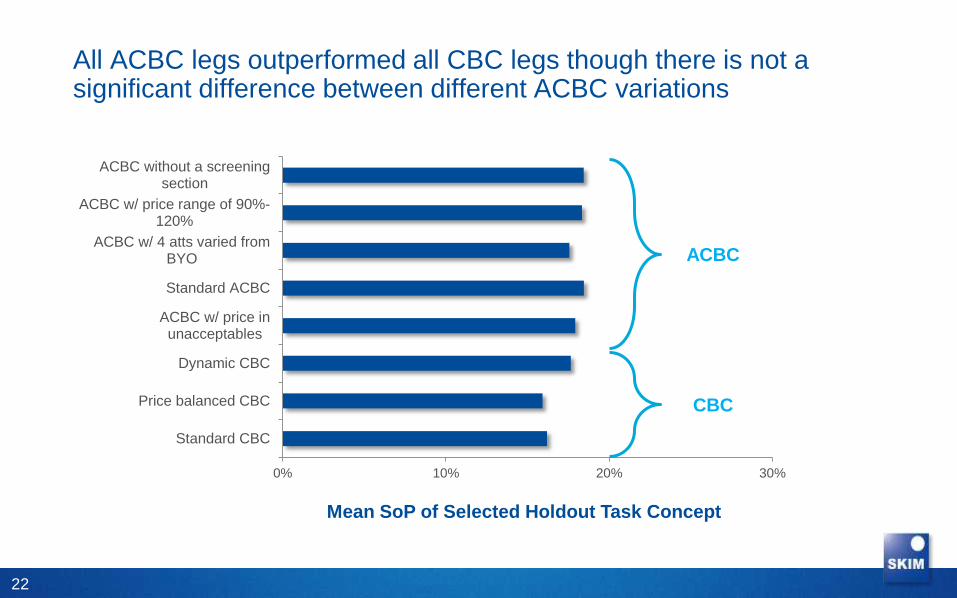
All ACBC legs outperformed all CBC legs though there is not a significant difference between different ACBC variations
22
0% 10% 20% 30%
Standard CBC
Price balanced CBC
Dynamic CBC
ACBC w/ price inunacceptables
Standard ACBC
ACBC w/ 4 atts varied fromBYO
ACBC w/ price range of 90%-120%
ACBC without a screeningsection
Mean SoP of Selected Holdout Task Concept
ACBC
CBC
Intermezzo
All legs showed respondents a summed total price for each concept (according to ACBC logic)
• Summed price = (summed value of attribute levels) * random number
• Price becomes a continuous variable
• Consequently we applied piecewise utility estimation for price in all legs
• Number of cutpoints to be defined before running HB. ACBC allows up
to 12 cutpoints.
23
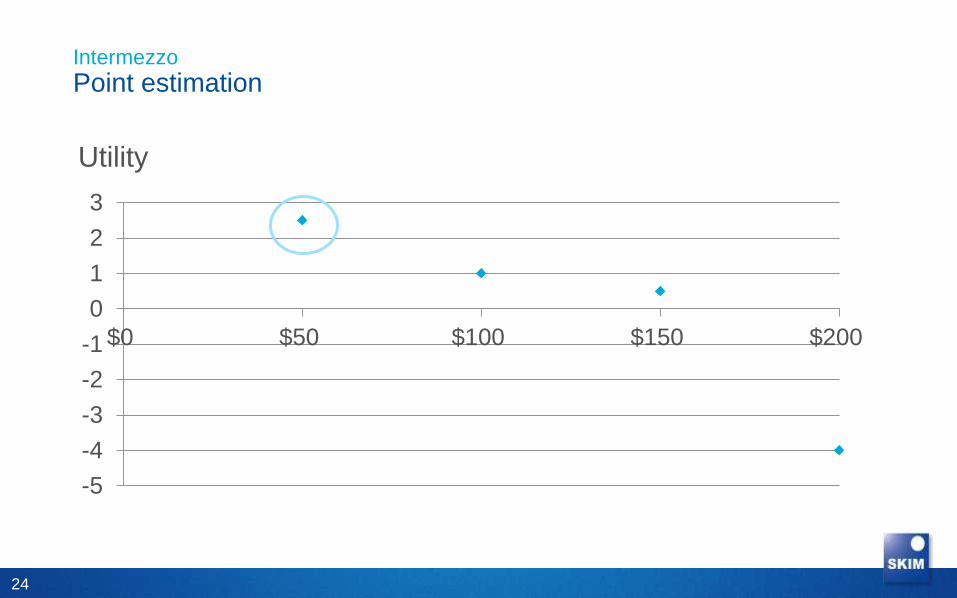
Intermezzo
Point estimation
-5
-4
-3
-2
-1
0
1
2
3
$0 $50 $100 $150 $200
Utility
24
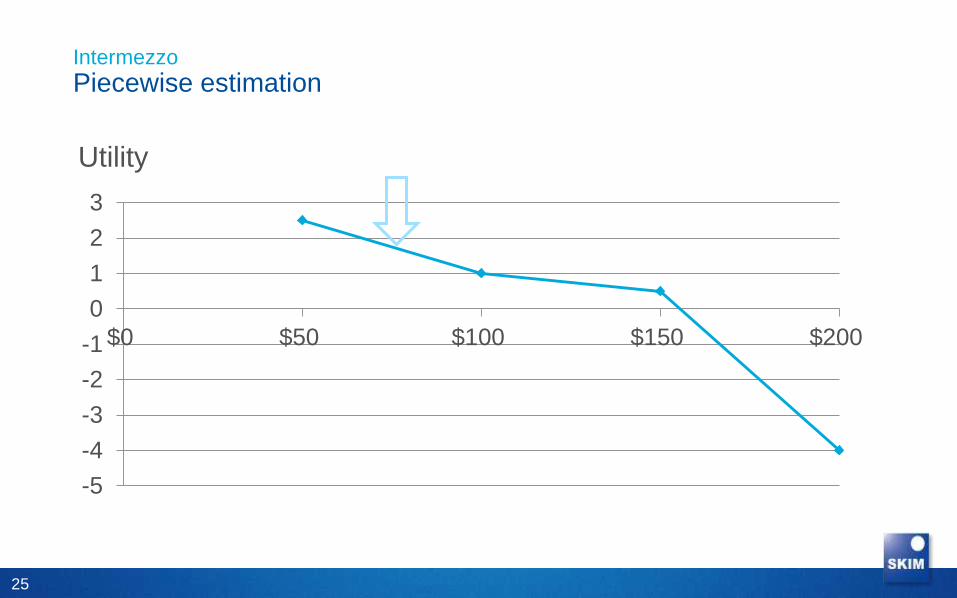
Intermezzo
Piecewise estimation
-5
-4
-3
-2
-1
0
1
2
3
$0 $50 $100 $150 $200
Utility
25
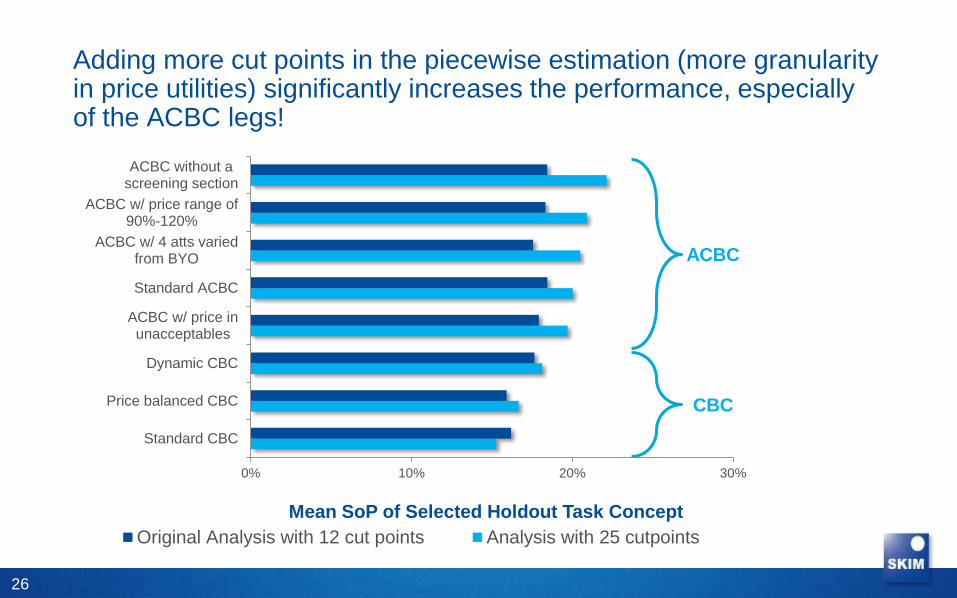
Adding more cut points in the piecewise estimation (more granularity in price utilities) significantly increases the performance, especially of the ACBC legs!
26
0% 10% 20% 30%
Standard CBC
Price balanced CBC
Dynamic CBC
ACBC w/ price inunacceptables
Standard ACBC
ACBC w/ 4 atts variedfrom BYO
ACBC w/ price range of90%-120%
ACBC without ascreening section
Mean SoP of Selected Holdout Task Concept
Original Analysis with 12 cut points Analysis with 25 cutpoints
ACBC
CBC
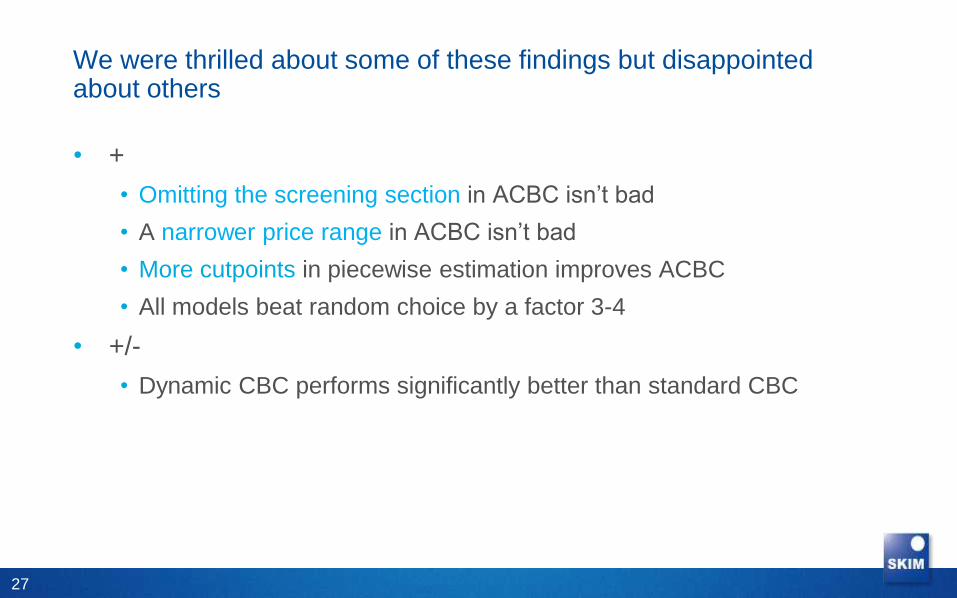
We were thrilled about some of these findings but disappointed about others
• +
• Omitting the screening section in ACBC isn’t bad
• A narrower price range in ACBC isn’t bad
• More cutpoints in piecewise estimation improves ACBC
• All models beat random choice by a factor 3-4
• +/-
• Dynamic CBC performs significantly better than standard CBC
27
We were disappointed about some of these findings but thrilled about others
• -
• None of the alternative ACBC legs outperformed current ACBC
» The flipside of the coin is that ACBC is actually very robust!
• Price balanced CBC didn’t outperform standard CBC
• The absolute value of the mean SoP is actually quite low (~20%)
» This may well be the case in actual simulators with many products too!
28
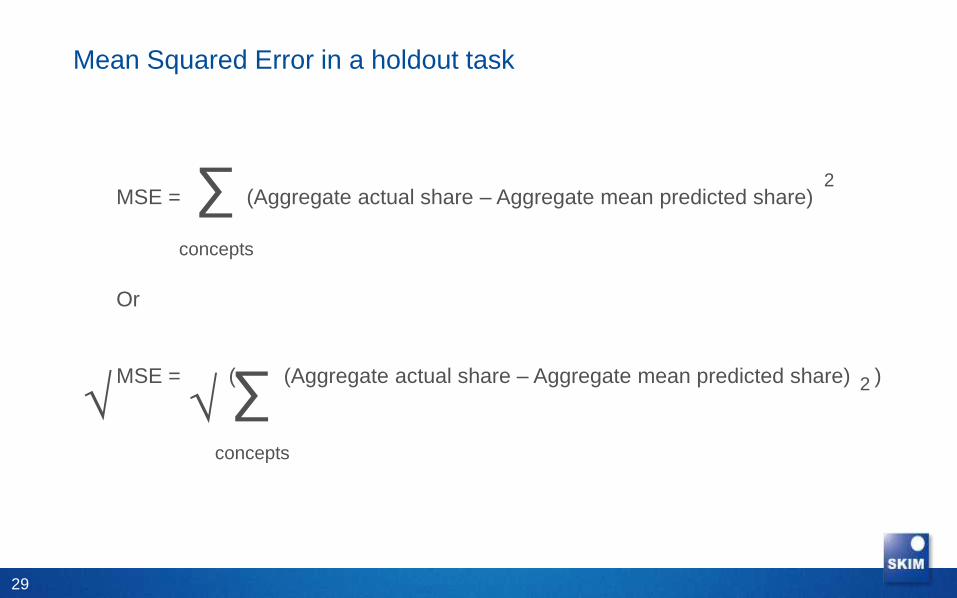
Mean Squared Error in a holdout task
29
∑
concepts
MSE = (Aggregate actual share – Aggregate mean predicted share)
Or
MSE = ( (Aggregate actual share – Aggregate mean predicted share) )
2
∑
concepts
2
√ √
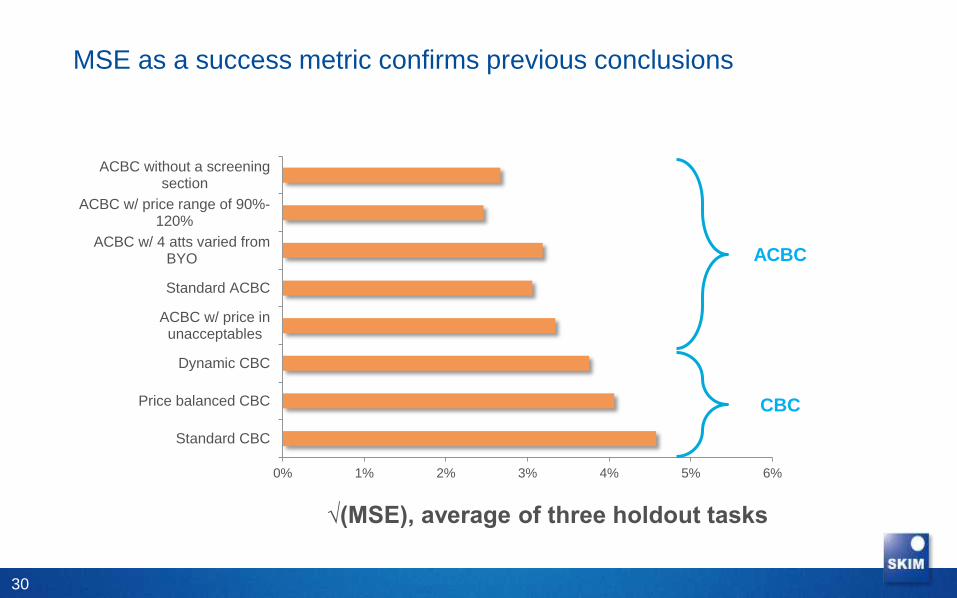
MSE as a success metric confirms previous conclusions
30
0% 1% 2% 3% 4% 5% 6%
Standard CBC
Price balanced CBC
Dynamic CBC
ACBC w/ price inunacceptables
Standard ACBC
ACBC w/ 4 atts varied fromBYO
ACBC w/ price range of 90%-120%
ACBC without a screeningsection
√(MSE), average of three holdout tasks
ACBC
CBC
One concept in one holdout task causes a large amount of the high MSE scores
• Actual holdout share (aggregate level): 43%
• Predicted holdout share:
• Standard CBC leg is worst (predicts 8%)
• CBC with price balance predicts 17%
• ACBC modules are better don’t come very close (avg prediction 27%)
31
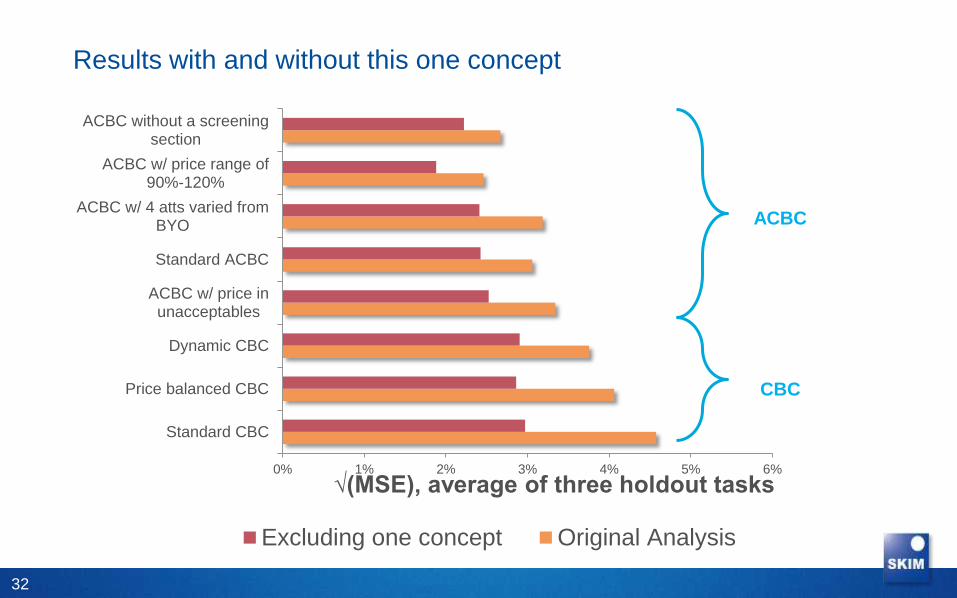
Results with and without this one concept
32
0% 1% 2% 3% 4% 5% 6%
Standard CBC
Price balanced CBC
Dynamic CBC
ACBC w/ price inunacceptables
Standard ACBC
ACBC w/ 4 atts varied fromBYO
ACBC w/ price range of90%-120%
ACBC without a screeningsection
√(MSE), average of three holdout tasks
Excluding one concept Original Analysis
ACBC
CBC
A step aside
Cluster analysis on SoP predictions leads to a
conclusion but not to a solution
33
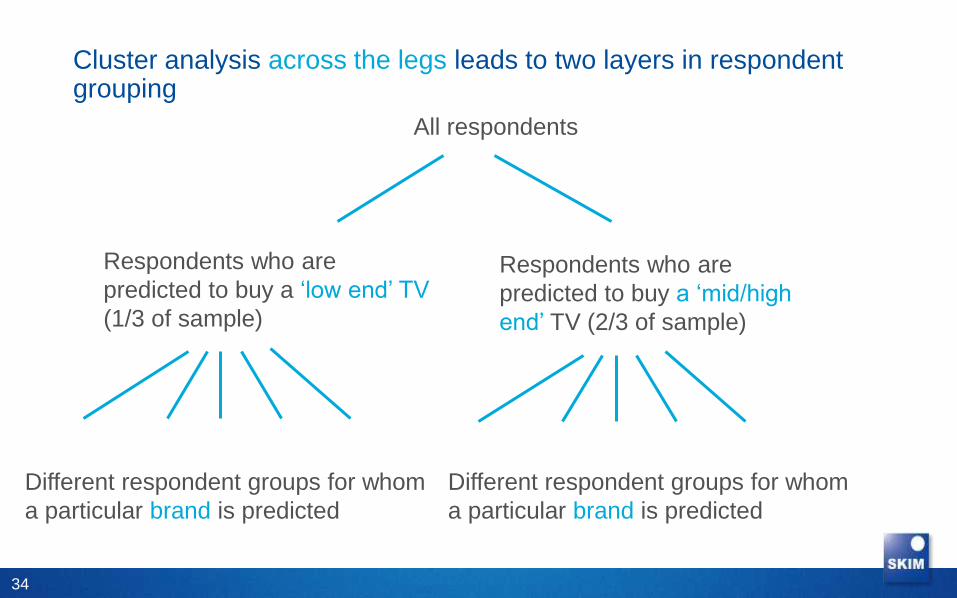
Cluster analysis across the legs leads to two layers in respondent grouping
34
Respondents who are
predicted to buy a ‘low end’ TV
(1/3 of sample)
Respondents who are
predicted to buy a ‘mid/high
end’ TV (2/3 of sample)
Different respondent groups for whom
a particular brand is predicted
Different respondent groups for whom
a particular brand is predicted
All respondents
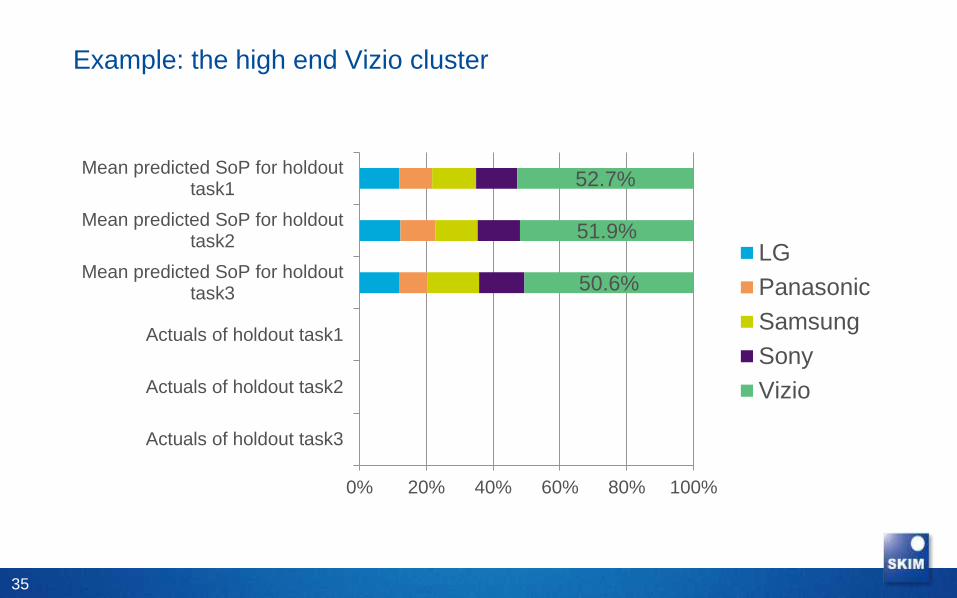
Example: the high end Vizio cluster
50.6%
51.9%
52.7%
0% 20% 40% 60% 80% 100%
Actuals of holdout task3
Actuals of holdout task2
Actuals of holdout task1
Mean predicted SoP for holdouttask3
Mean predicted SoP for holdouttask2
Mean predicted SoP for holdouttask1
LG
Panasonic
Samsung
Sony
Vizio
35
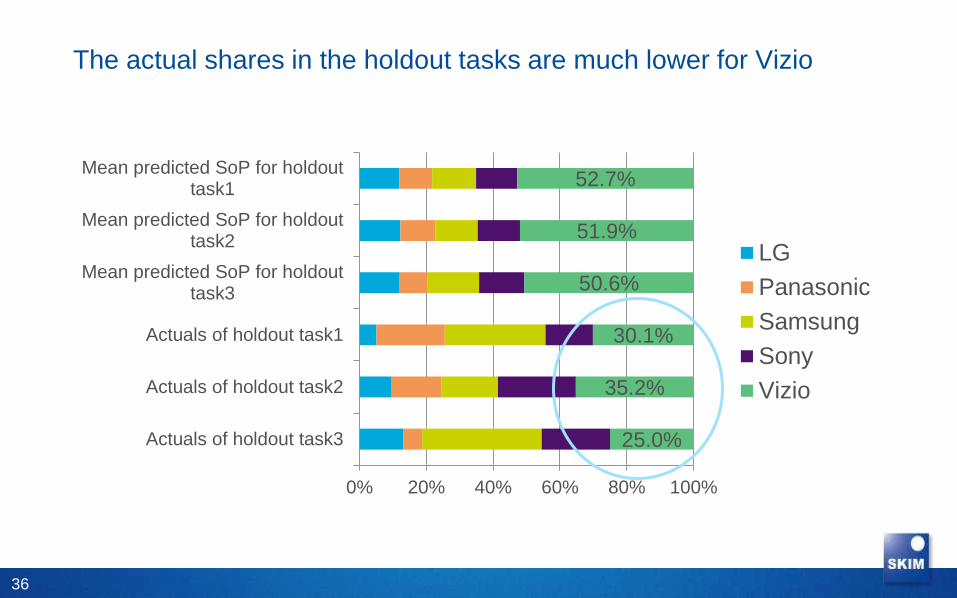
The actual shares in the holdout tasks are much lower for Vizio
25.0%
35.2%
30.1%
50.6%
51.9%
52.7%
0% 20% 40% 60% 80% 100%
Actuals of holdout task3
Actuals of holdout task2
Actuals of holdout task1
Mean predicted SoP for holdouttask3
Mean predicted SoP for holdouttask2
Mean predicted SoP for holdouttask1
LG
Panasonic
Samsung
Sony
Vizio
36
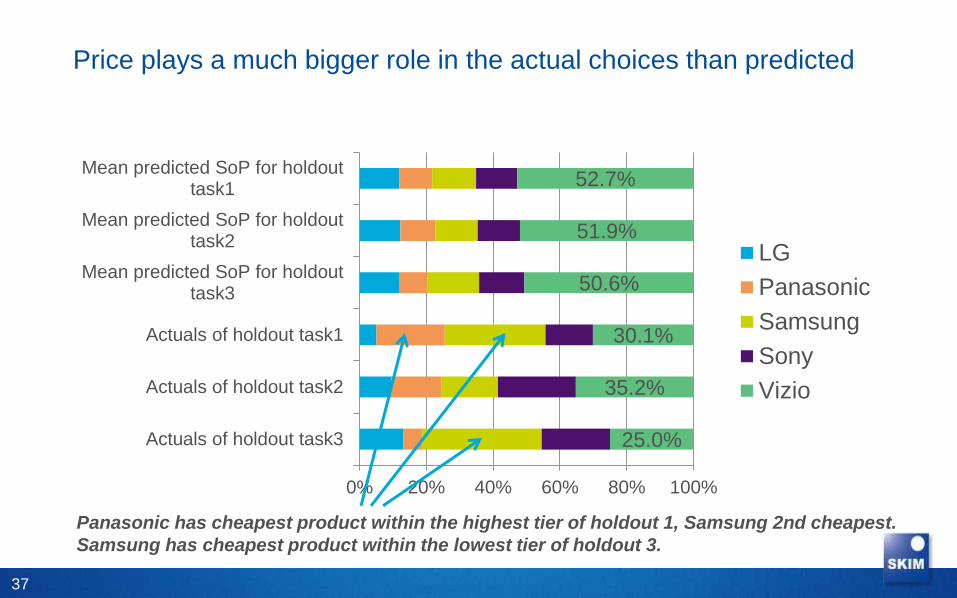
Price plays a much bigger role in the actual choices than predicted
25.0%
35.2%
30.1%
50.6%
51.9%
52.7%
0% 20% 40% 60% 80% 100%
Actuals of holdout task3
Actuals of holdout task2
Actuals of holdout task1
Mean predicted SoP for holdouttask3
Mean predicted SoP for holdouttask2
Mean predicted SoP for holdouttask1
LG
Panasonic
Samsung
Sony
Vizio
37
Panasonic has cheapest product within the highest tier of holdout 1, Samsung 2nd cheapest.
Samsung has cheapest product within the lowest tier of holdout 3.
This same phenomenon applies to all clusters
• Brand is apparently estimated as too important, at the cost of price.
• This is perfectly in line with the most extreme mismatch in a concept that
we saw before in the MSE calculation: the share of the cheapest product
was greatly underestimated in this concept.
38
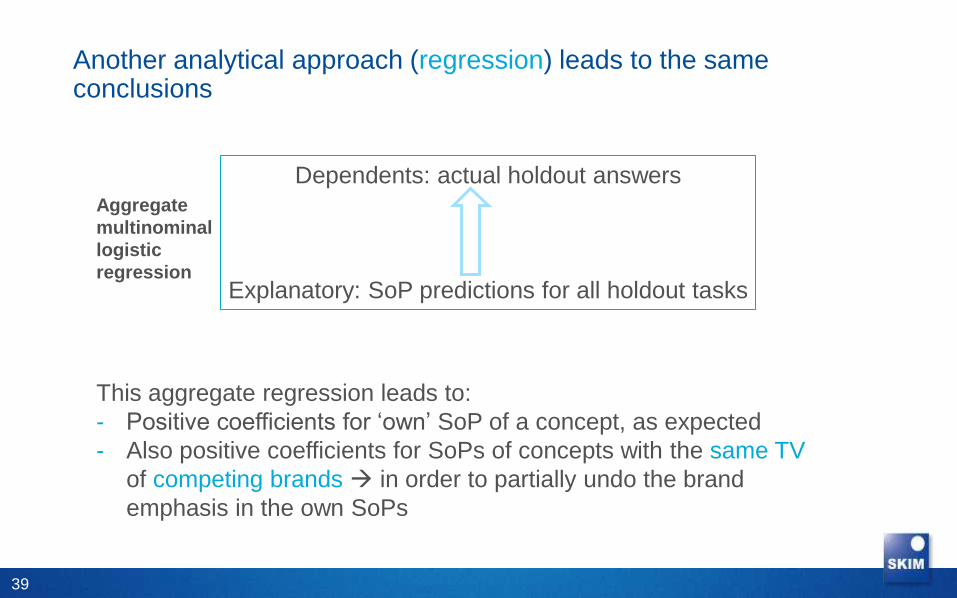
Another analytical approach (regression) leads to the same conclusions
39
Dependents: actual holdout answers
Explanatory: SoP predictions for all holdout tasks
Aggregate
multinominal
logistic
regression
This aggregate regression leads to:
- Positive coefficients for ‘own’ SoP of a concept, as expected
- Also positive coefficients for SoPs of concepts with the same TV
of competing brands in order to partially undo the brand
emphasis in the own SoPs

Conclusions
40
Conclusions
• ACBC again outperforms CBC (in a complex market).
41
Conclusions
• ACBC again outperforms CBC (in a complex market).
• We’ve seen no significant differences within the tested ACBC variations
• This indicates that the performance of ACBC is robust.
• It seems like ACBC can be made more efficient (omitting screener) with the
same performance.
42
Conclusions
• ACBC again outperforms CBC (in a complex market).
• We’ve seen no significant differences within the tested ACBC variations
• Dynamic CBC performs much better than standard CBC; further
refinement may lead to results close to or better than ACBC.
43
Conclusions
• ACBC again outperforms CBC (in a complex market).
• We’ve seen no significant differences within the tested ACBC variations
• Dynamic CBC performs much better than standard CBC; further
refinement may lead to results close to or better than ACBC.
• Performance of ACBC improves quite a lot by increasing the number of
price slopes >11.
44
Conclusions
• ACBC again outperforms CBC (in a complex market).
• We’ve seen no significant differences within the tested ACBC variations
• Dynamic CBC performs much better than standard CBC; further
refinement may lead to results close to or better than ACBC.
• Performance of ACBC improves quite a bit by increasing the cutpoints
for piecewise uitility estimation >11.
• Respondents like a (well designed) conjoint survey better than we had
thought, including standard CBC.
45
Directions for future research
• Finding solutions for the discrepancies that we found between actual
holdout answers and conjoint predictions
• Developing more variants of Dynamic CBC
• Double checking on existing data with holdout tasks
• Increase number of cutpoints in piecewise estimation
• Cluster analysis approach with predicted SoP
46
contact us or follow us online!
Marco Hoogerbrugge
Research Director
Jeroen Hardon
Senior Research Consultant
Chris Fotenos
Project Manager