slide 1 corporate...
TRANSCRIPT

Corporate PresentationSlide 1

Corporate PresentationSlide 2
Except for historical information, the matters discussed in thispresentation are forward-looking statements that are subject to certain risks and uncertainties which could cause the actual results to differ materially from those projected, including industry trends, the timing and strength of the Company's or competitors’ new product and service offerings, the mix of product and service revenues, changes in the Company's or competitors’ business or pricing strategies, changes in the prevailing political and regulatory framework in which the Company operates or in economic or technological trends or conditions, including currency fluctuations, inflation and consumer confidence, on a global, regional or national basis and other risks detailed from time to time in the Company’s SEC reports. The Company assumes no obligation to update the information herein contained.
PRIVATE SECURITIES LITIGATION REFORM ACT OF 1995 SAFE HARBOR
Disclaimer
Corporate PresentationSlide 3
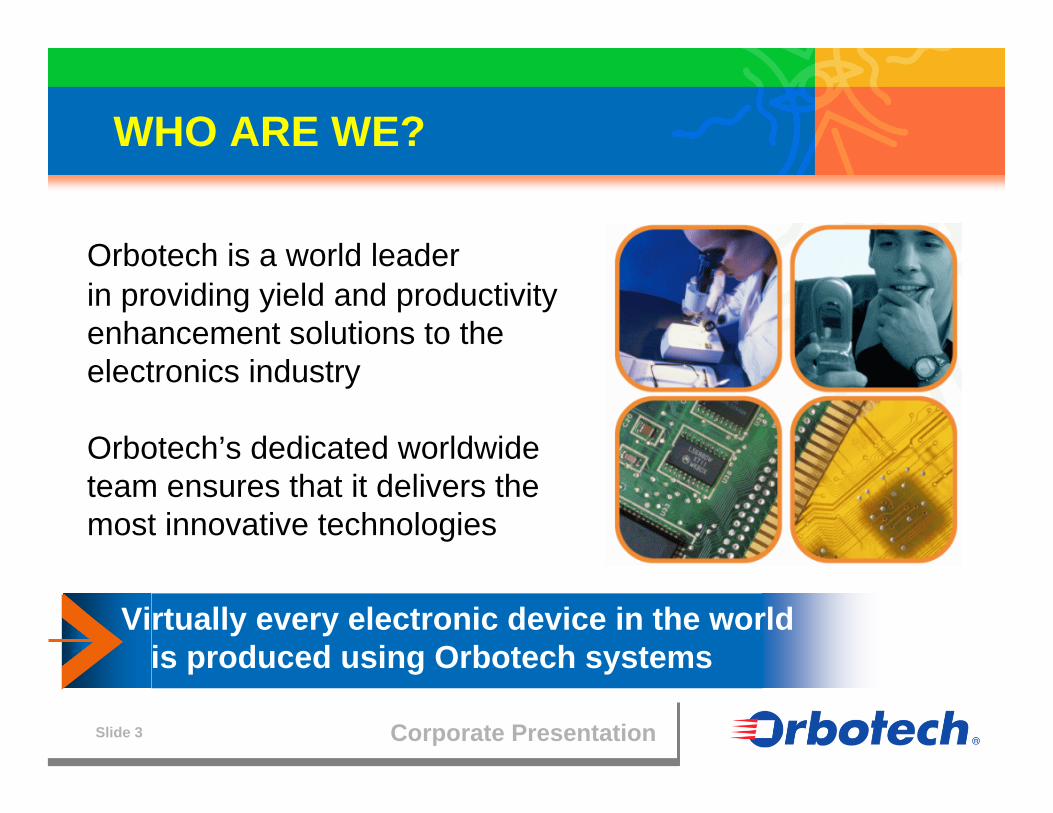
WHO ARE WE?
Orbotech is a world leader in providing yield and productivity enhancement solutions to the electronics industry
Orbotech’s dedicated worldwide team ensures that it delivers the most innovative technologies
Virtually every electronic device in the world is produced using Orbotech systems

Corporate PresentationSlide 4
THE INDUSTRIES WE SERVE
Bare PCB Production5500 systems installed
PCB Assembly1600 systems installed
FPD Manufacturing500 systems installed
Corporate PresentationSlide 5
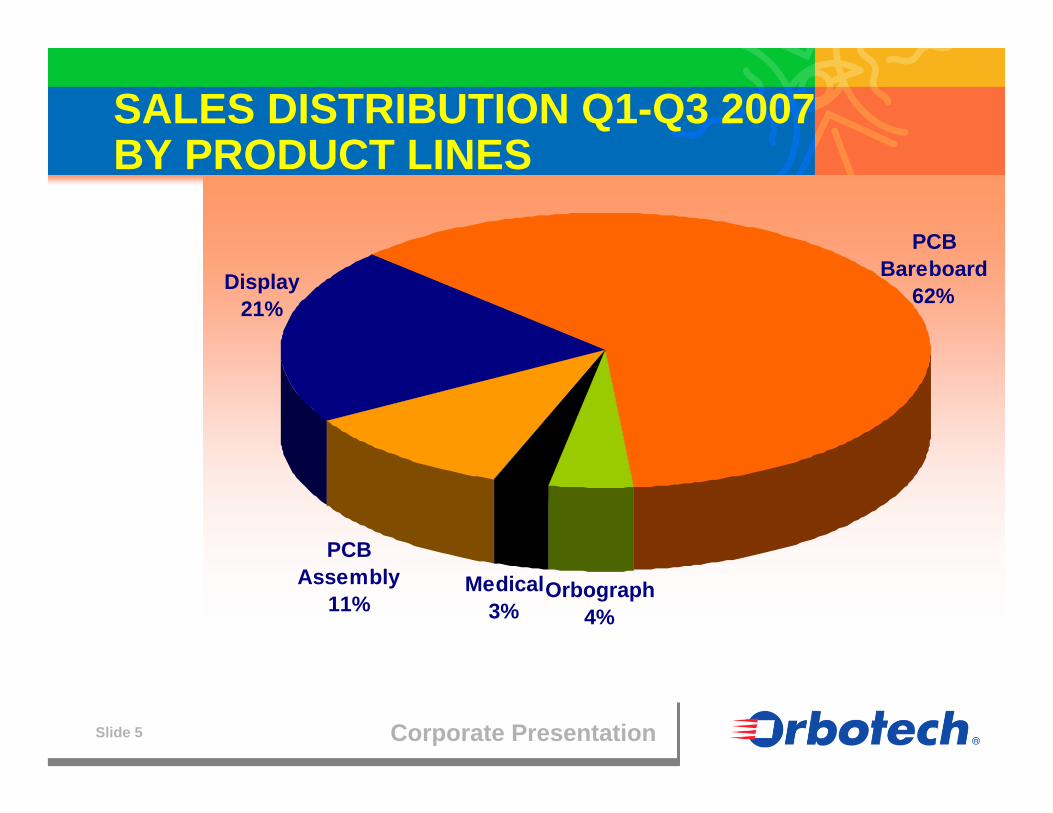
Medical3%
Orbograph4%
PCB Bareboard
62%Display21%
PCB Assembly
11%
SALES DISTRIBUTION Q1-Q3 2007 BY PRODUCT LINES
Corporate PresentationSlide 6
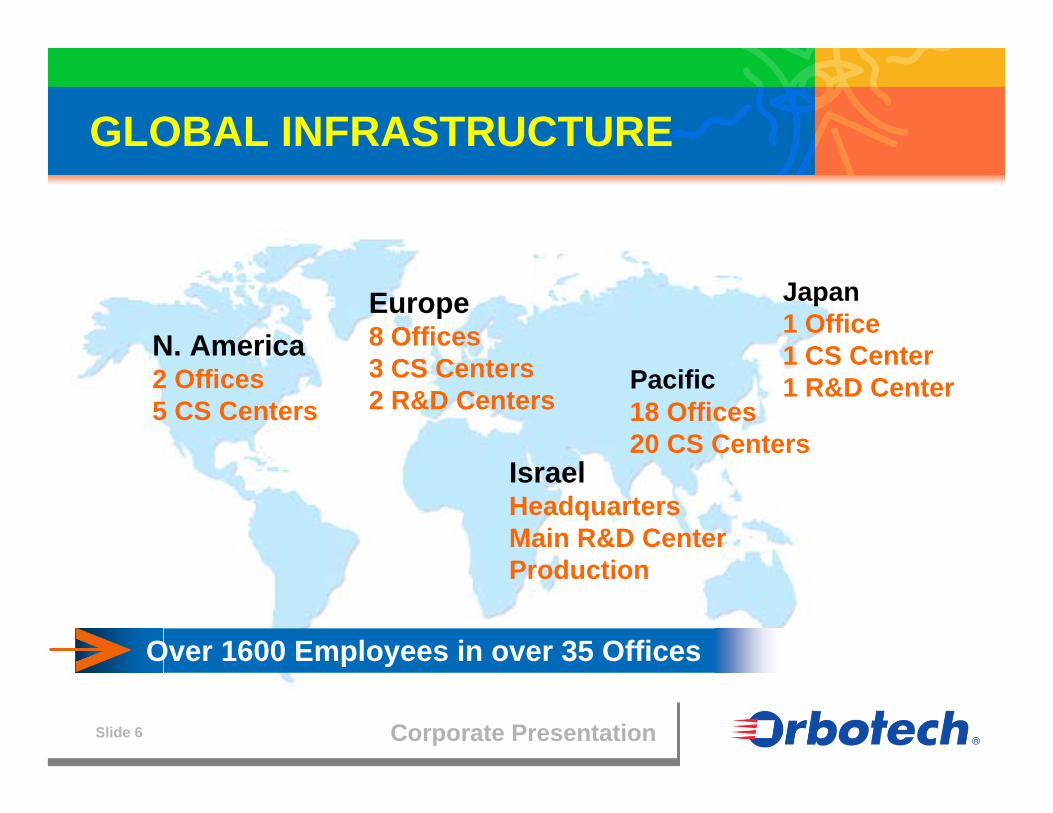
GLOBAL INFRASTRUCTURE
IsraelHeadquartersMain R&D CenterProduction
Europe8 Offices 3 CS Centers2 R&D Centers
N. America2 Offices 5 CS Centers
Japan1 Office1 CS Center 1 R&D CenterPacific
18 Offices 20 CS Centers
Over 1600 Employees in over 35 Offices

Corporate PresentationSlide 7
Europe11%
North America
15%Other
1%
Korea14%
Taiwan18%
Japan10%
China31%
SALES DISTRIBUTION Q1-Q3 2007 BY REGION

Corporate PresentationSlide 8
90% of current product sales are from products introduced over the last 24 monthsOver 400 Scientists and EngineersOver $60M annual R&D budget
R&D INVESTMENT

Corporate PresentationSlide 9
GROWTH STRATEGY

Bare PCB Production

Corporate PresentationSlide 11
BARE PCB PRODUCTION
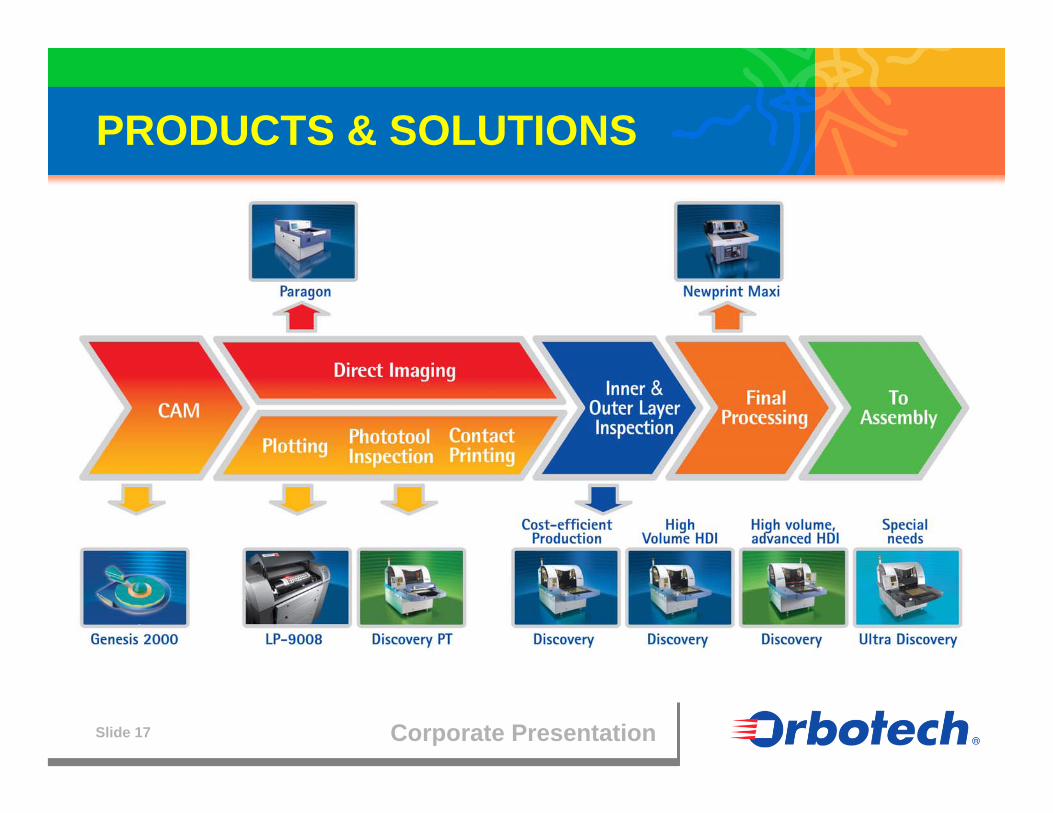
Automated Optical Inspection (AOI)
Laser Direct Imaging (LDI)
Laser Plotting
Computer Aided Manufacturing (CAM)
Orbotech is the world leader in
Corporate PresentationSlide 12
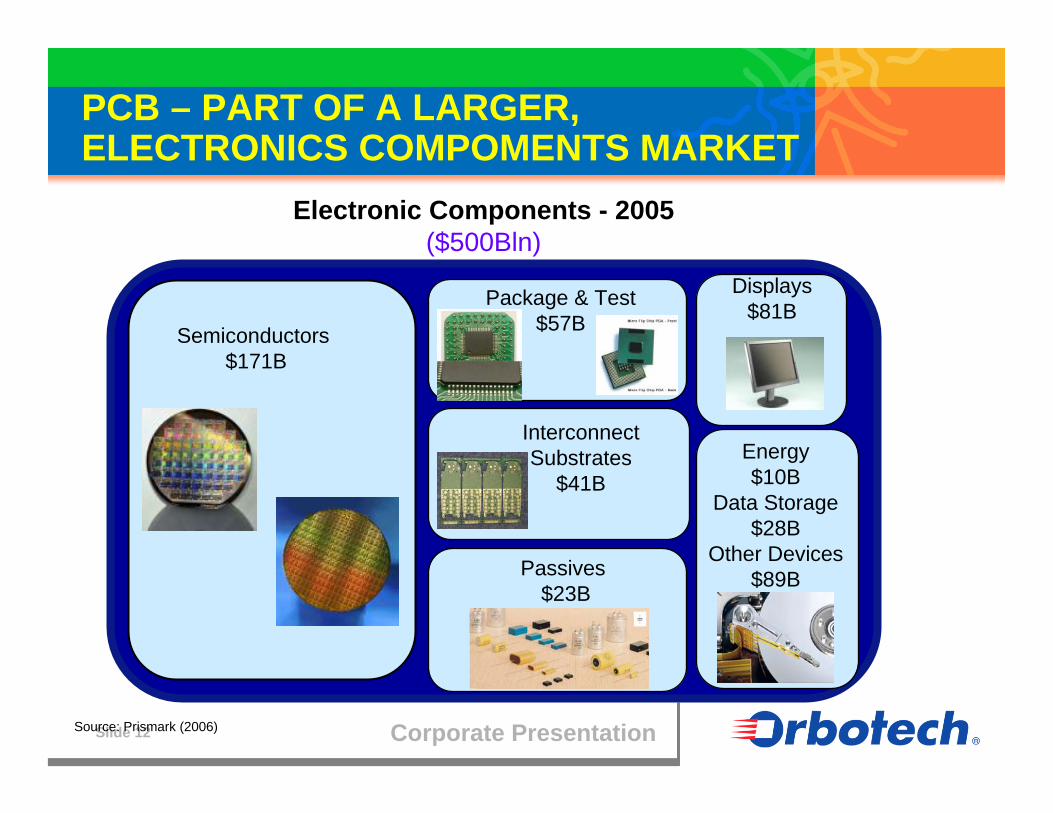
Electronic Components - 2005($500Bln)
Semiconductors $171B
Package & Test $57B
Passives $23B
Displays $81B
Energy $10B
Data Storage $28B
Other Devices $89B
Interconnect Substrates
$41B
PCB – PART OF A LARGER, ELECTRONICS COMPOMENTS MARKET
Source: Prismark (2006)

Corporate PresentationSlide 13
Expected growth of 5-7% in next few years
Over 80% of the market in the Far East
- China is world’s largest PCB producer
Aggressive expansion plans
Cell phones driving the industry
- Over 1BN phones in 2007
Fastest growing segments: microvia, IC substrates, flex
BARE PCB MARKET SUMMARY

Corporate PresentationSlide 14
STRONG GROWTH IN HIGH END SEGMENTS
PCB Value by Segment [$M]
0 2000 4000 6000 8000 10000 12000 14000 16000
SS+DS
4-& 6-layer
MLB
Microvia
Si platform
Flex
20072011
High end
Low end
30%
33%
34%
28%
17%
14%
Source: Prismark (08/’07)
Corporate PresentationSlide 15
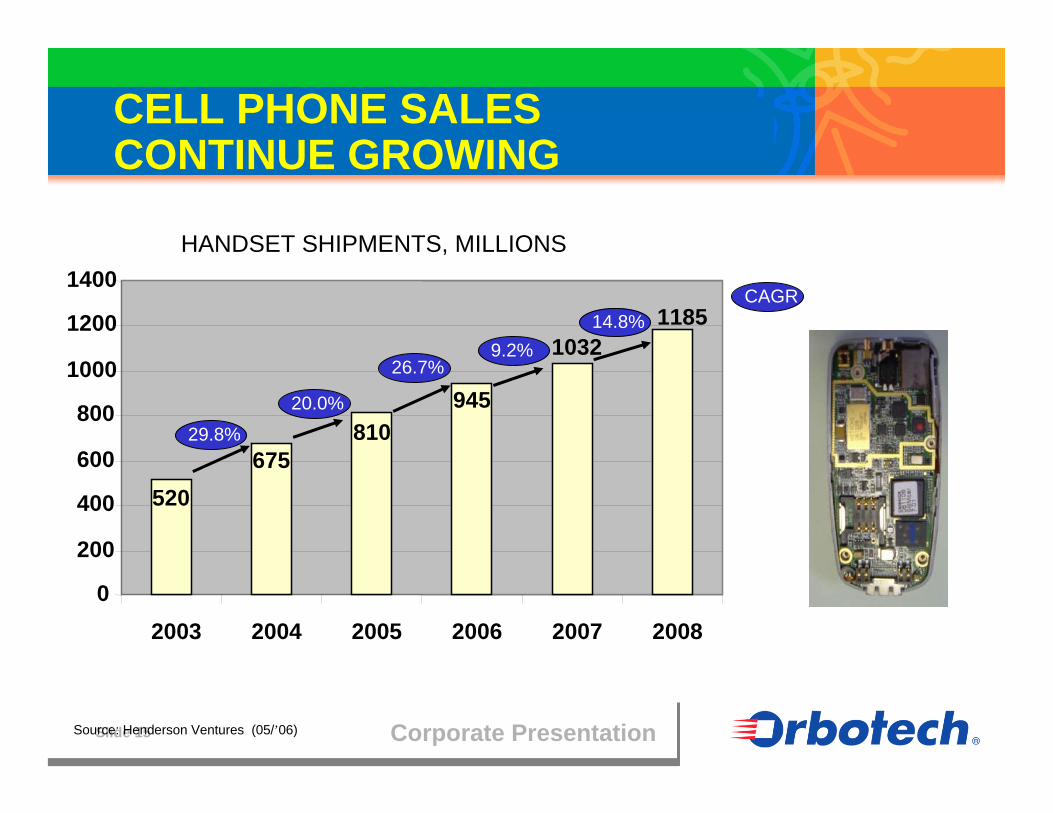
CELL PHONE SALES CONTINUE GROWING
520675
810945
10321185
0
200
400
600
800
1000
1200
1400
2003 2004 2005 2006 2007 2008
29.8%
20.0%
26.7%9.2%
14.8%
HANDSET SHIPMENTS, MILLIONS
Source: Henderson Ventures (05/’06)
CAGR

Corporate PresentationSlide 16
ONE iPhone, TWO MAIN PCBs, SEVERAL FLEX, MANY IC SUBSTRATES
Wireless board Application board
Source: Prismark (06/’07)
Corporate PresentationSlide 17
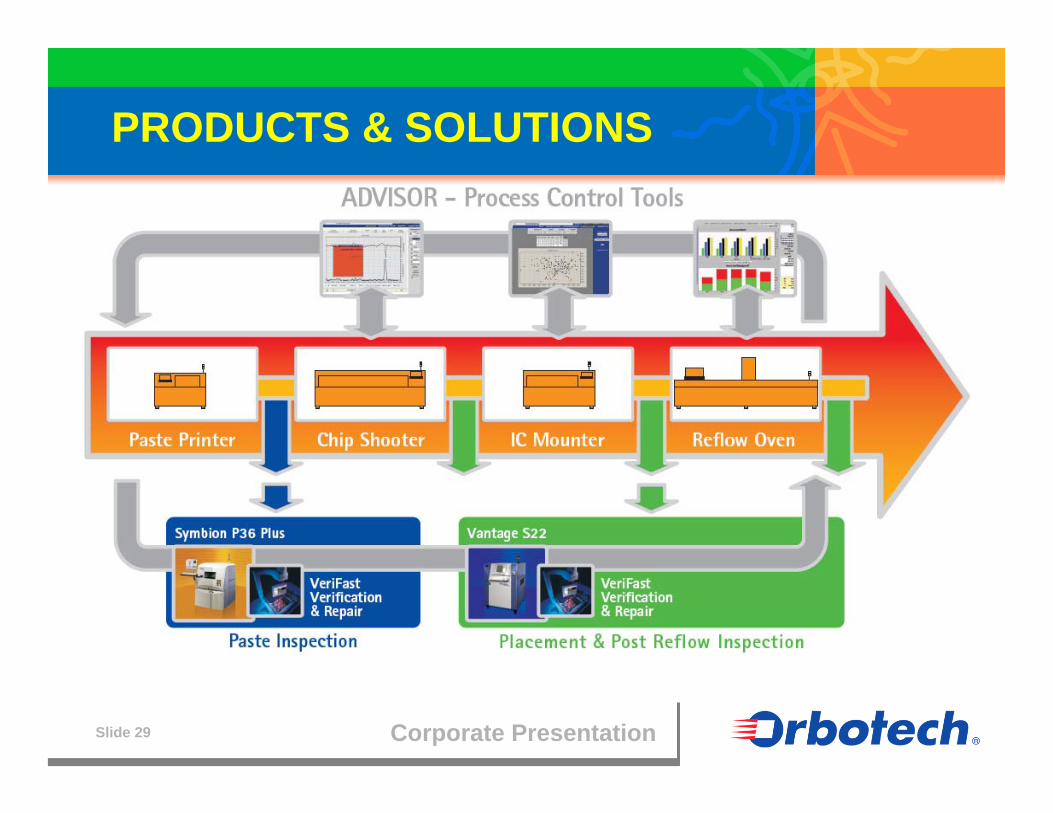
PRODUCTS & SOLUTIONS

Corporate PresentationSlide 18
DISCOVERY™
Industry’s Best Selling AOI
Simple with Push-to-Scan™- The easiest AOI solution in the industry
Intelligent with Visual Intelligence™- Detect all you want and only what you want
Powerful impact with new AOI economics- Maximum output with maximum availability
Over 1000 sold worldwide

Corporate PresentationSlide 19
PARAGON™
Industry’s Only Field Proven Laser Direct Imaging (LDI) SystemEnabling technology for complex and advanced applicationsIncreased adoption for high-end mainstream applicationsUsed in all segments including packaging and solder maskFuture direction: high resolution, high throughput
Over 285 LDI systems sold worldwide
Corporate PresentationSlide 20
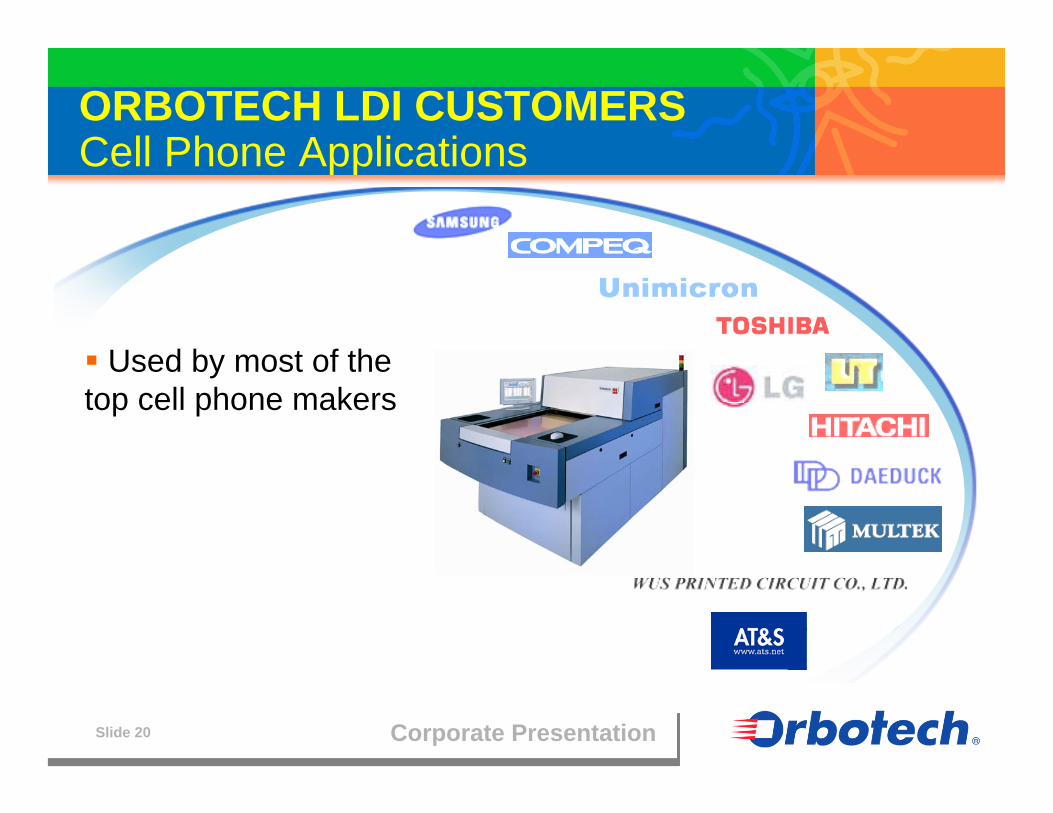
ORBOTECH LDI CUSTOMERS Cell Phone Applications
Used by most of the top cell phone makers

Corporate PresentationSlide 21
NEW SYSTEM
Founded in 1993 - Privately owned company, Headquarters in Gorizia, Italy
13 years of ground-breaking expertise in inkjet for PCB
Unique, leading edge technology
In house, “hands-on” capability across all aspects of inkjet technology for the electronics industry
Main market: Legend inkjet printing in Europe and USA

Corporate PresentationSlide 22
Strategic Level- Acquire world class inkjet know-how and expertise- Provide opportunity for developing future products and markets
Market- Quick entry into inkjet for PCB: Legend, Etch & future products- Complementary to our DI for PCB- Synergetic with inkjet for other industries
Technology- Leading, proprietary technology (UV-based) for PCB- Design-to-cost, “good enough” machines- Complementary to our technologies (panel & data handling, front end, multiple head designs)
ORBOTECH ITALY (NEW SYSTEM) Business & Technology Opportunity
Corporate PresentationSlide 23
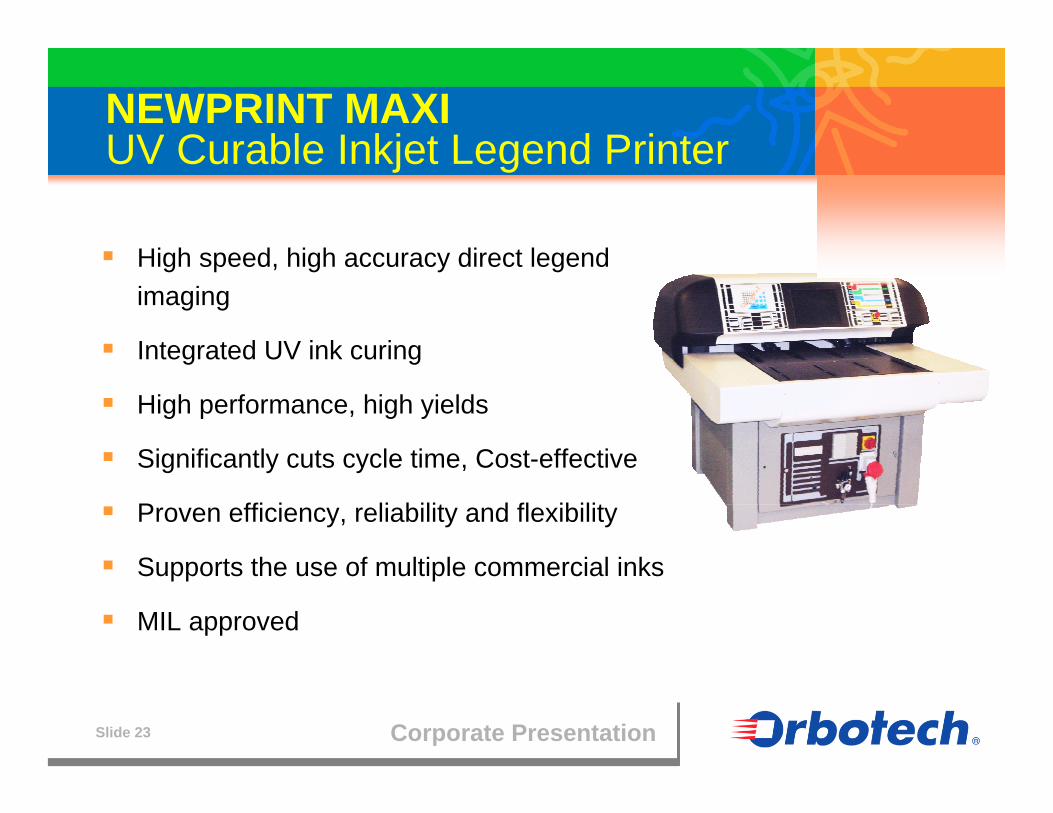
NEWPRINT MAXIUV Curable Inkjet Legend Printer
High speed, high accuracy direct legend imaging
Integrated UV ink curing
High performance, high yields
Significantly cuts cycle time, Cost-effective
Proven efficiency, reliability and flexibility
Supports the use of multiple commercial inks
MIL approved

PCB Assembly

Corporate PresentationSlide 25
PCB ASSEMBLY
Orbotech is a leading provider of
Automated Optical Inspection
Process Control Software
Corporate PresentationSlide 26
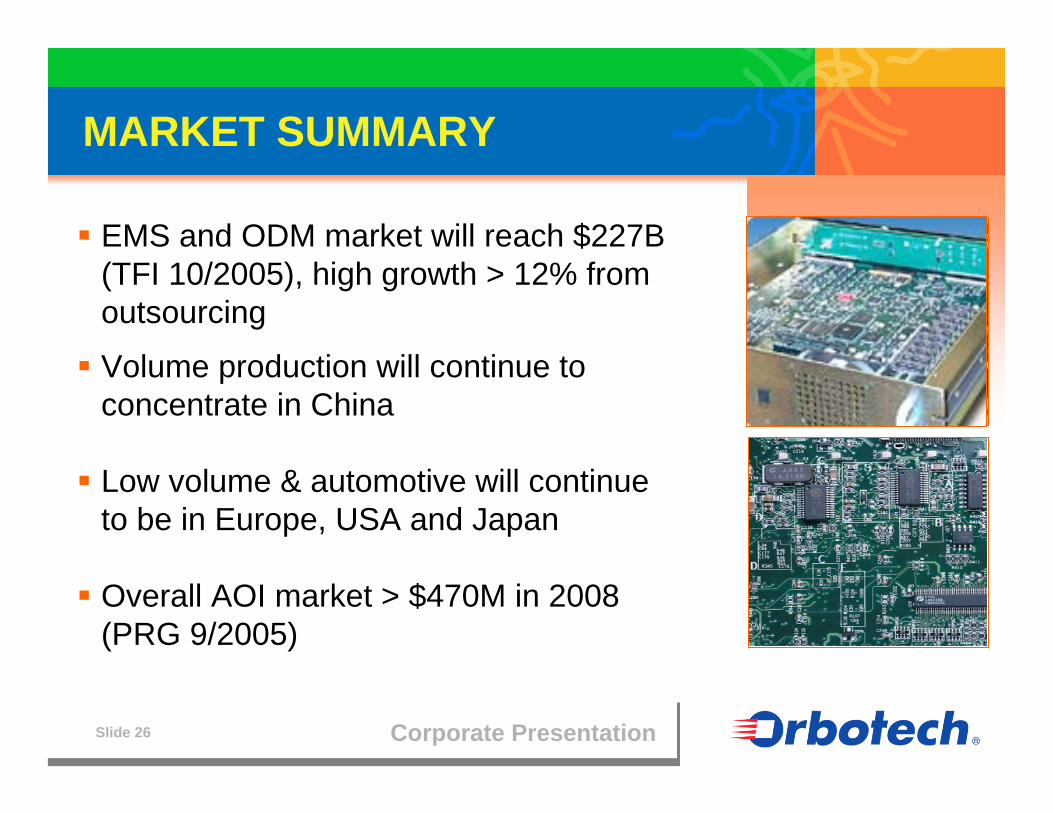
MARKET SUMMARY
EMS and ODM market will reach $227B (TFI 10/2005), high growth > 12% from outsourcing
Volume production will continue to concentrate in China
Low volume & automotive will continue to be in Europe, USA and Japan
Overall AOI market > $470M in 2008 (PRG 9/2005)

Corporate PresentationSlide 27
ASSEMBLY AOI DRIVERS
Smaller components, finer pitch- Impossible to control by visual inspection- Multiple stage inspection is required
Limited access for electrical test
Traceability- Component version and warranties control- Production information and process control
Outsourcing trend (safety margin when not manufactured by OEM)
Corporate PresentationSlide 28
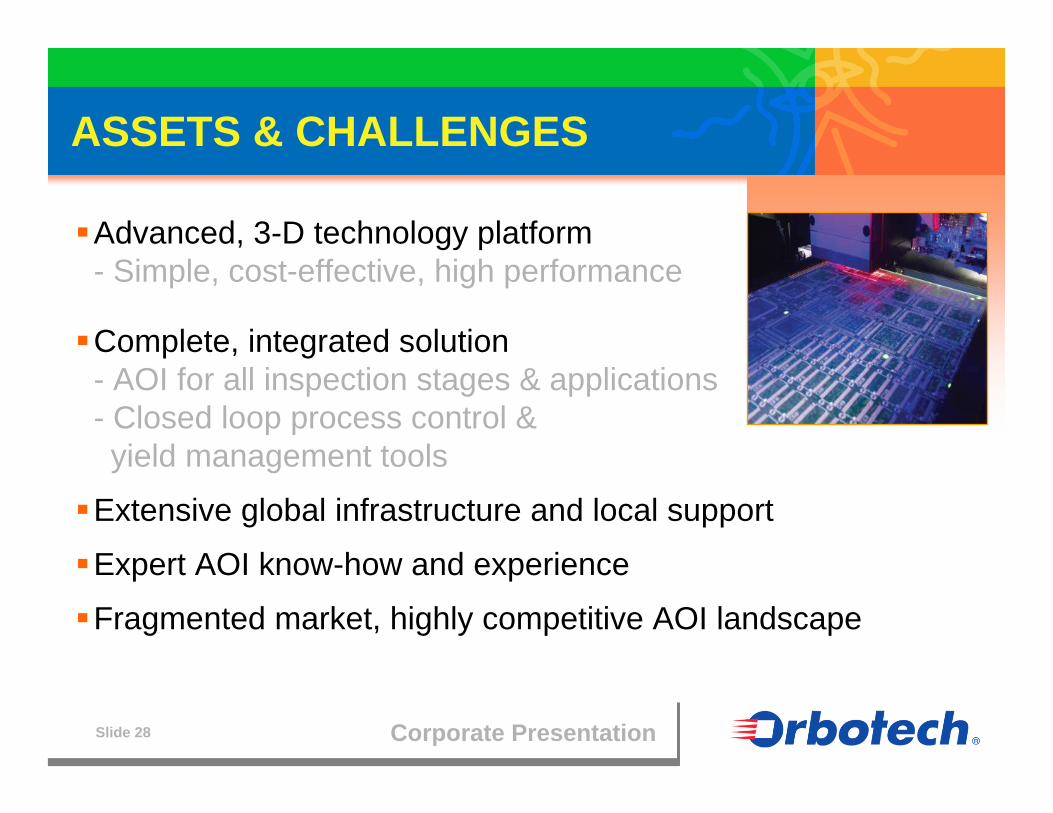
ASSETS & CHALLENGES
Advanced, 3-D technology platform - Simple, cost-effective, high performance
Complete, integrated solution- AOI for all inspection stages & applications- Closed loop process control & yield management tools
Extensive global infrastructure and local support
Expert AOI know-how and experience
Fragmented market, highly competitive AOI landscape
Corporate PresentationSlide 29
PRODUCTS & SOLUTIONS
Corporate PresentationSlide 30
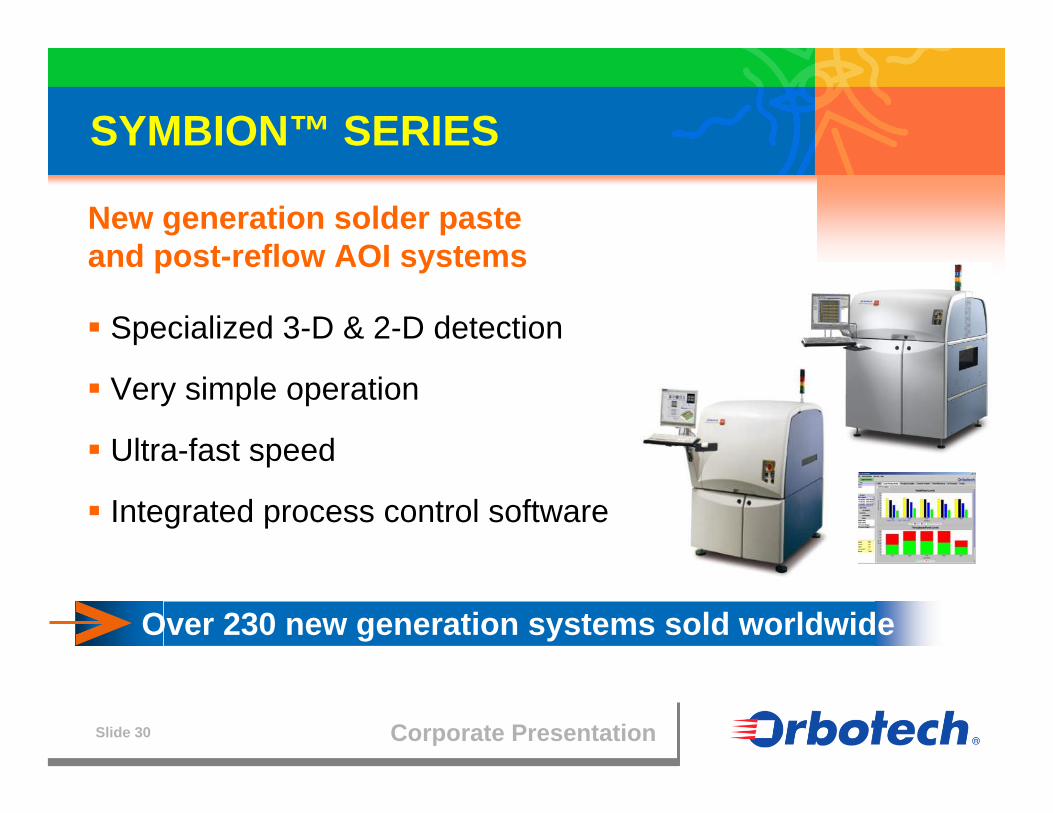
SYMBION™ SERIES
New generation solder paste and post-reflow AOI systems
Specialized 3-D & 2-D detection
Very simple operation
Ultra-fast speed
Integrated process control software
Over 230 new generation systems sold worldwide

Flat Panel Display Manufacturing

Corporate PresentationSlide 32
FPD MANUFACTURING
Orbotech is the world’s leading provider of
Yield Management
Automated Optical Inspection

Corporate PresentationSlide 33
ORBOTECH PRESENCE
Presence at all LCD fabs
Proven solutions for all generations
Future-proof technology: OLED, plastic-based & other specialties

Corporate PresentationSlide 34
INDUSTRY OUTLOOK
FPTV industry outlook - Market will be expanded by 2015 till 200M units for LCD-TV
Significant movement recently- Major brands are to focus on LCD for 40” and up which has:
Very positive impact on LCDNegative impact on the PDP industry
CAPEX impact - Positive outlook – new investments are being announced - Materialize mainly as of H2 ‘08
Long term- New manufacturing technologies are being researched for and
implemented for:Improving panel qualityCost reduction purposes

Corporate PresentationSlide 35
TFT LCD LARGE AREA APPLICATIONS(Units)
Source: DisplaySearch Q3’07 Quarterly Worldwide FPD Forecast Report
TVs grow 32% CAGR from 28.5M in 2005 to 155.2M in 2011Notebook CAGR = 20%, Desktop Monitor CAGR = 11%
0
50,000
100,000
150,000
200,000
250,000
2 0 0 5 2 0 0 6 2 0 0 7 2 0 0 8 2 0 0 9 2 0 1 0 2 0 1 1
Uni
ts
LCD TV Notebook PC Desktop Monitor

Corporate PresentationSlide 36
TV DEMAND FORECAST BY TECHNOLOGY

Corporate PresentationSlide 37
2008-10 NEW 30KG/m FABS FORECAST
Investment plans for the next 3 years are: ~42 new a-Si Fabs~5 new S/M Fabs
Decisions of 2 leading companies have a major impact on the equipment marketThe number of new Fabs is inline with the glass demand for LCD FPD productsSimilar number of Fabs is expected for CF
Corporate PresentationSlide 38
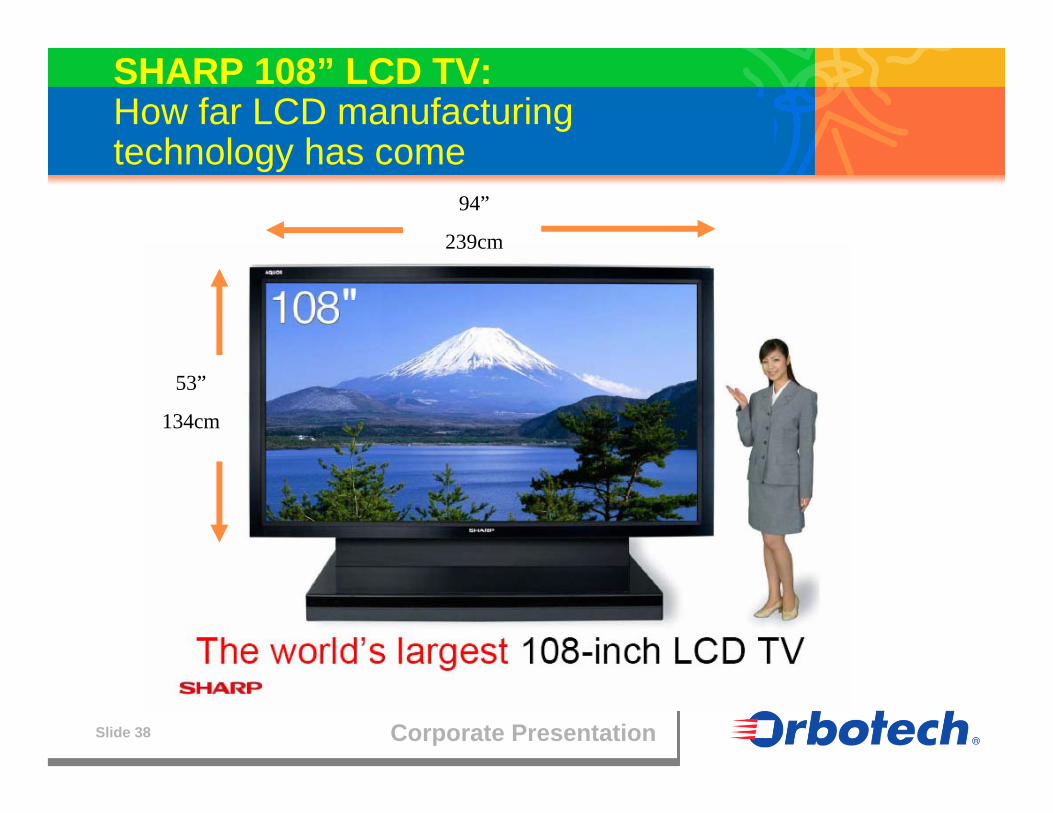
SHARP 108” LCD TV:How far LCD manufacturing technology has come
53”
134cm
94”
239cm

Corporate PresentationSlide 39
THIS IS REAL SIZE

Corporate PresentationSlide 4022366812282424363350x3900G12
2223668121824242950x3450G11
2222368101518242850x3050G10
112223681012182400x2800G9
1122238810152200x2500G8.5
1122238810152160x2460G8
12223688121950x2250G7.5
11223668101870x2200G7
12233681500x1850G6
1222361300x1500G5.5
122231100x1300G5
118"105"95"85"75"65"57"46"42"37"32"Glass Size
16:9Aspect ratio
Generation
SUBSTRATE SIZE – The Way To Reach The Price & Size Goals
Source: ADR Nov., 2006

Corporate PresentationSlide 41
IMPLICATIONS OF LARGE-SIZE TV
TV Market
Image Quality
Cheaper
Larger
Yield Management
More & NewTest Methods
Rigorous QA& Repair
Cost-EffectiveProcess Control
FPD product strategy requires an integrated, multi-function yield management solution
Manufacturing
Complex Design
MinimizeHandling
HugeGlass
Corporate PresentationSlide 42
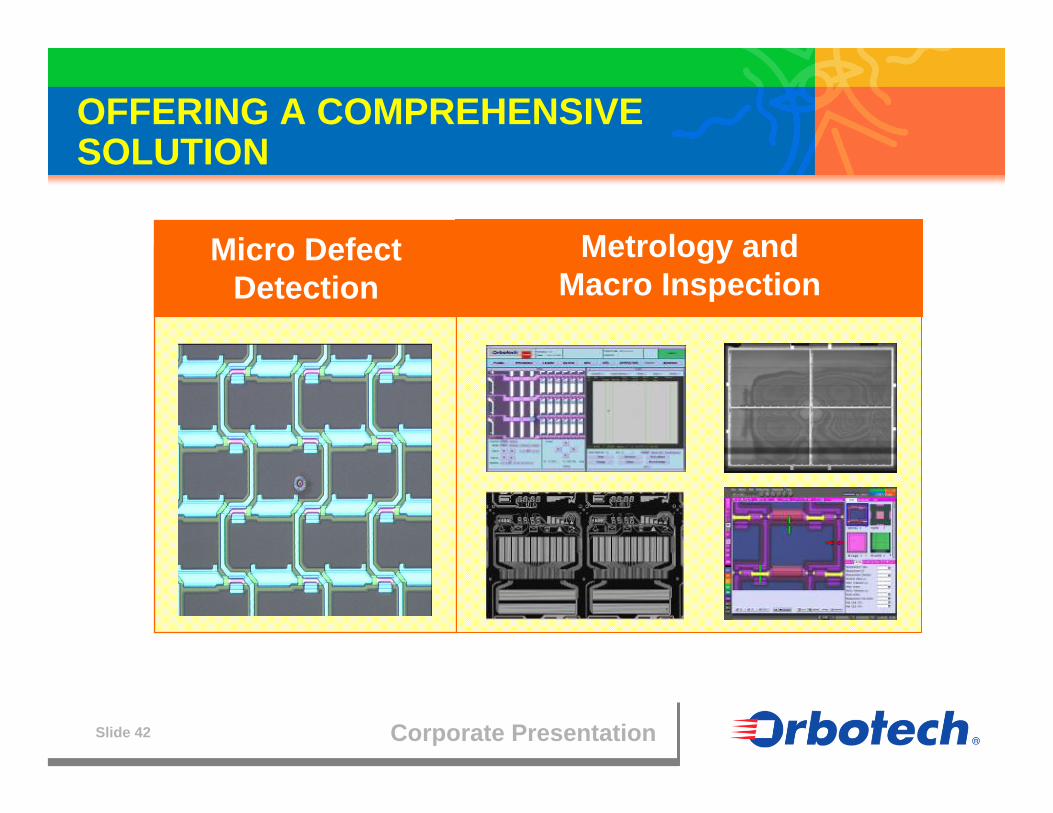
Micro Defect Detection
Metrology and Macro Inspection
OFFERING A COMPREHENSIVE SOLUTION
Corporate PresentationSlide 43
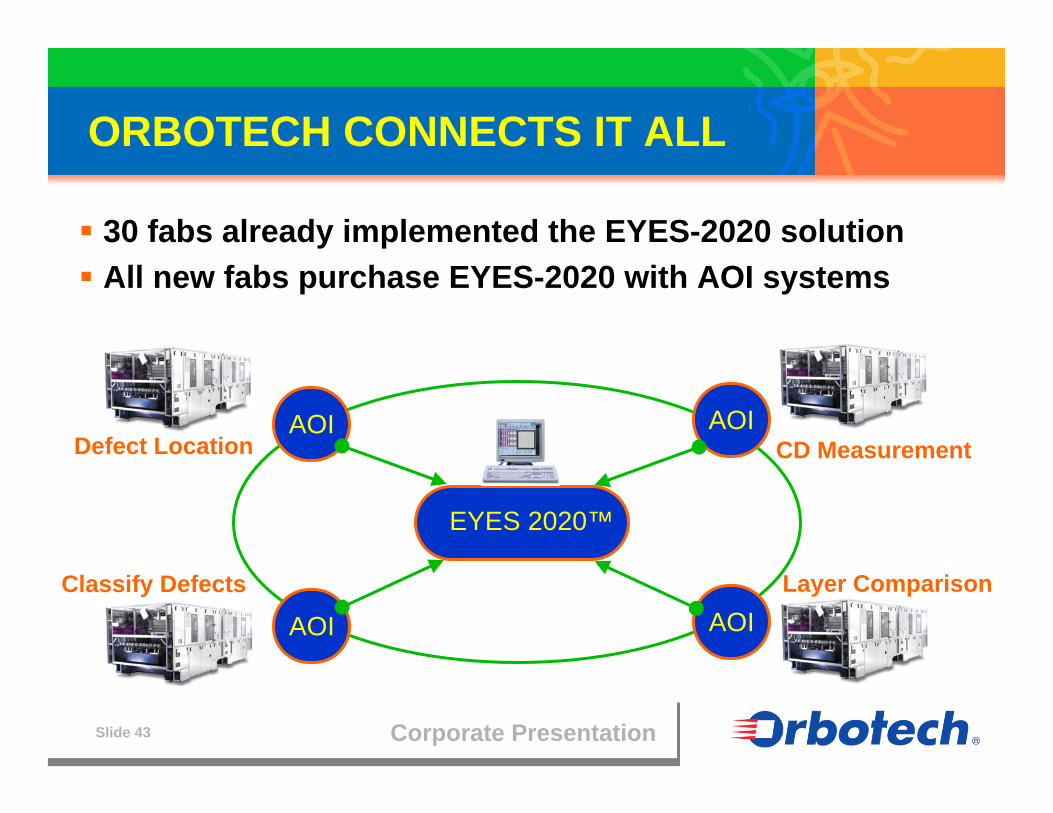
ORBOTECH CONNECTS IT ALL
30 fabs already implemented the EYES-2020 solutionAll new fabs purchase EYES-2020 with AOI systems
EYES 2020™
AOIAOI
AOIAOI
Defect Location
Classify Defects
CD Measurement
Layer Comparison
Corporate PresentationSlide 44
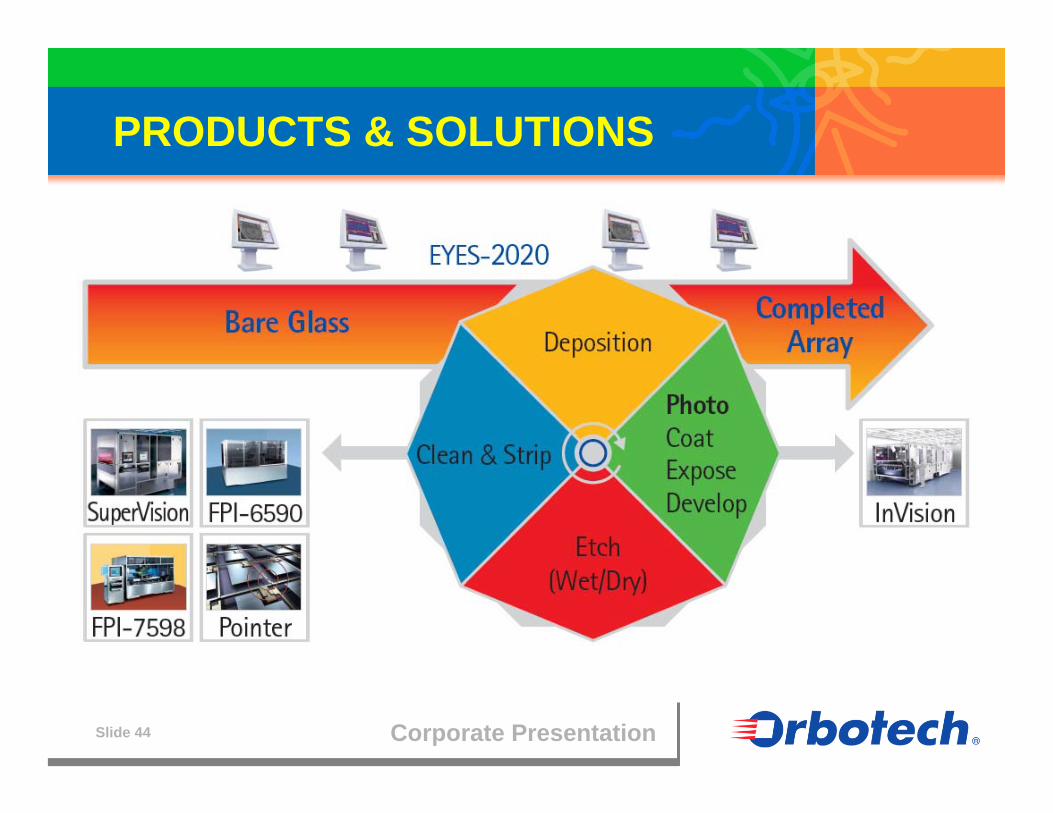
PRODUCTS & SOLUTIONS

Corporate PresentationSlide 45
SAMSUNG AWARD
In appreciation of Orbotech’s dedication and improved performance

Customer Support

Corporate PresentationSlide 47
CUSTOMER SUPPORT
Strategic & necessary for customer relationships
Differentiating factor vs. our competition
20% of our revenue
Source of recurring revenue
Consistent contributor to profitability
On-going presence at customer sites

Corporate PresentationSlide 48
CUSTOMER SUPPORT INFRASTRUCTURE
Over 500 employees in 35 countries
Supporting over5500 AOI systems,650 Plotters, 285 LDI and 4000 CAM stations
5 response centers, 5 customer training centers

Corporate PresentationSlide 49
CUSTOMER SUPPORT SERVICES
Response centersTraining centersRemote accessSoftware upgrades & ECOsSpare parts inventoriesApplication supportConsulting and site auditsPreventive maintenanceLocal satellite officesLocal adaptation

Corporate PresentationSlide 50
CUSTOMER SUPPORT EXAMPLE:RESPONSE CENTERS
Convenient, efficient “hotline”Expert-level staffRemote diagnostic capabilitiesMany calls closed over the phoneDispatched calls for on-site service with diagnostic information
Increases customer satisfaction and our profitability
Medical Imaging
Corporate PresentationSlide 52
Medical Imaging Equipment Market
Synergy with Orbotech’s imaging technology
Large market with continuous high growth
Market paying premiums for differentiating & unique imaging technologies
ENTERING NEW MARKETS
Corporate PresentationSlide 53
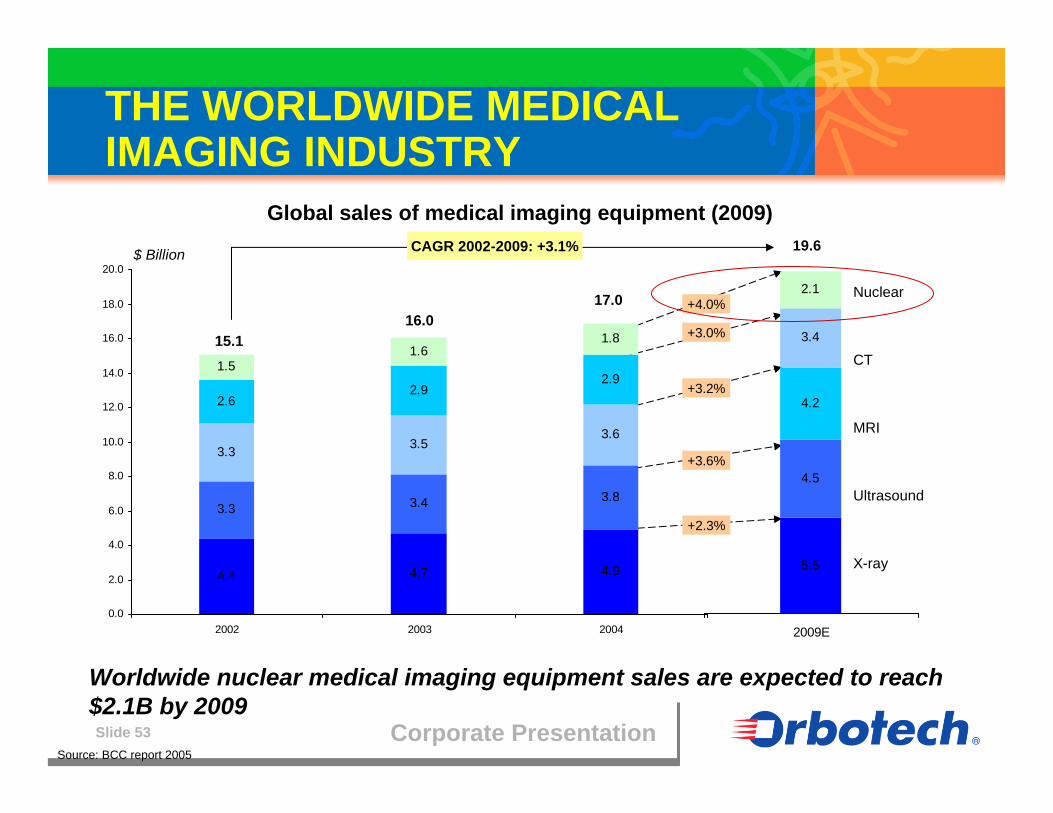
5.5
4.5
4.2
3.4
2.1
2009E
4.4 4.7 4.9
3.3 3.4 3.8
3.3 3.53.6
2.62.9
2.91.5
1.61.8
0.0
2.0
4.0
6.0
8.0
10.0
12.0
14.0
16.0
18.0
20.0
2002 2003 2004
Global sales of medical imaging equipment (2009)
X-ray
Ultrasound
MRI
CT
Nuclear
19.6
+2.3%
+3.6%
+3.2%
+3.0%
+4.0%
Worldwide nuclear medical imaging equipment sales are expected to reach $2.1B by 2009
15.116.0
17.0
$ Billion
Source: BCC report 2005
CAGR 2002-2009: +3.1%
THE WORLDWIDE MEDICAL IMAGING INDUSTRY

Corporate PresentationSlide 54
EXPECTED GLOBAL SALES OF NUCLEAR IMAGING EQUIPMENT (2009)
5.5
4.5
4.2
3.4
2.1
2009E
X-ray
Ultrasound
MRI
CT
Nuclear
19.6
0.8
1.3
Source: BCC report 2005
0.80
0.36
0.12
USA
ROW
Standalone SPECT
SPECT/CT
PET,PET/CT
2.1$ Billion 1.30
The standalone SPECT segment represents $120M from an end-user price standpoint
Corporate PresentationSlide 55
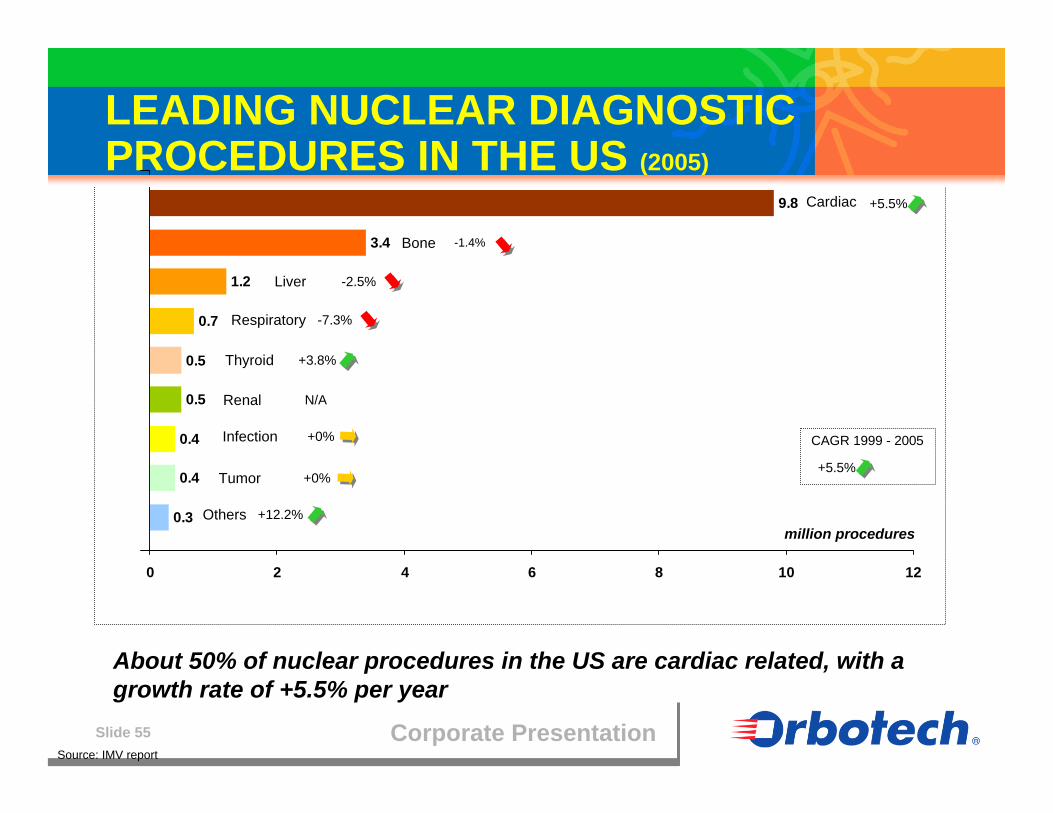
LEADING NUCLEAR DIAGNOSTIC PROCEDURES IN THE US (2005)
0.4
0.5
0.5
0.7
1.2
3.4
9.8
0.3
0.4
0 2 4 6 8 10 12
Source: IMV report
Others
Cardiac
Bone
Liver
Respiratory
Thyroid
Renal
Infection
Tumor
About 50% of nuclear procedures in the US are cardiac related, with a growth rate of +5.5% per year
million procedures+12.2%
-1.4%
+5.5%
-2.5%
-7.3%
+3.8%
N/A
+0%
+0%+5.5%
CAGR 1999 - 2005
Corporate PresentationSlide 56
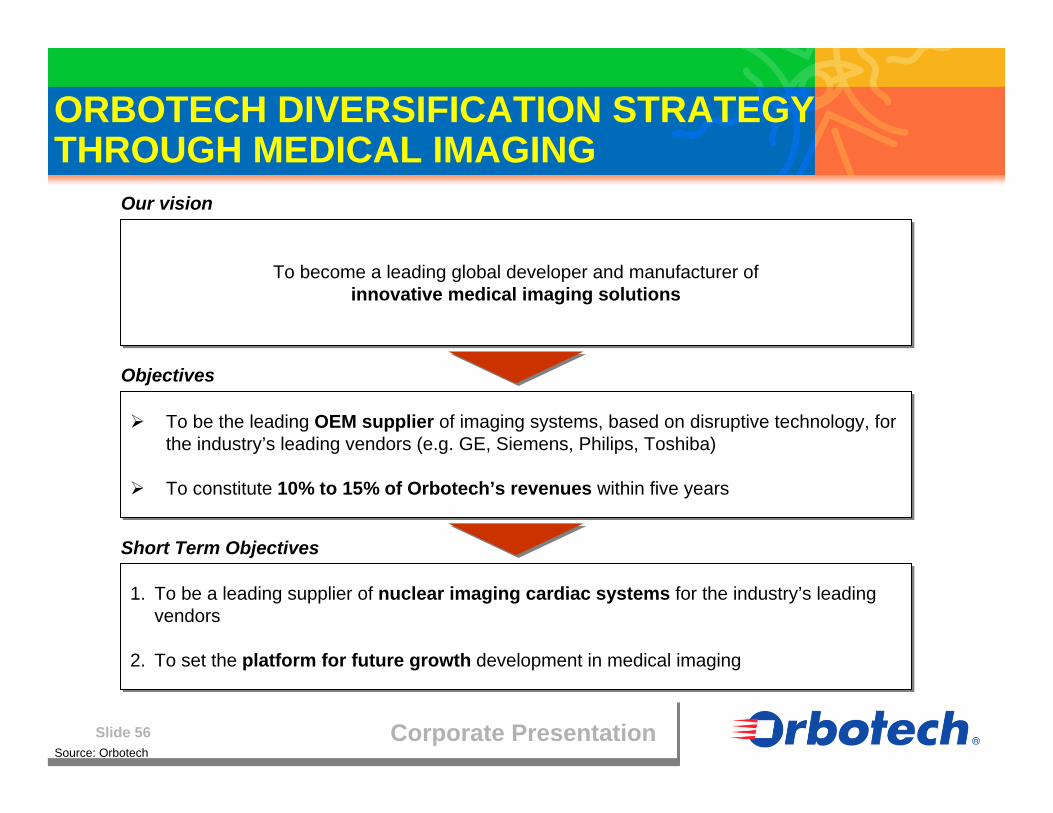
Objectives
Short Term Objectives
To be the leading OEM supplier of imaging systems, based on disruptive technology, for the industry’s leading vendors (e.g. GE, Siemens, Philips, Toshiba)
To constitute 10% to 15% of Orbotech’s revenues within five years
To be the leading OEM supplier of imaging systems, based on disruptive technology, for the industry’s leading vendors (e.g. GE, Siemens, Philips, Toshiba)
To constitute 10% to 15% of Orbotech’s revenues within five years
To become a leading global developer and manufacturer ofinnovative medical imaging solutions
To become a leading global developer and manufacturer ofinnovative medical imaging solutions
1. To be a leading supplier of nuclear imaging cardiac systems for the industry’s leading vendors
2. To set the platform for future growth development in medical imaging
1. To be a leading supplier of nuclear imaging cardiac systems for the industry’s leading vendors
2. To set the platform for future growth development in medical imaging
ORBOTECH DIVERSIFICATION STRATEGY THROUGH MEDICAL IMAGING
Our vision
Source: Orbotech

Corporate PresentationSlide 57
Founded in 1987 by Kai Lange, a prominent figure in the medical imaging industry
Employees: 42 (July 2007)
Headquarters in Hoersholm (Copenhagen), Denmark
Previously owned by: Axcel, Denmark’s largest private equity company
Estimated revenues in 2007: ~$30M
NUCLEAR MEDICAL IMAGING: DANISH DIAGNOSTIC DEVELOPMENT A/S (DDD)
DDD is the leading manufacturer of dedicated imaging equipment for the Nuclear Cardiology segment

Corporate PresentationSlide 58
DDD - BUSINESS DESCRIPTION
DDD mainly sells dedicated medical imaging equipment for nuclear cardiology (~$100M market)
DDD is the leading OEM supplier of dedicated nuclear medicine gamma camera in the US
DDD has the largest installed base (IB) of cardiac cameras worldwide (1,600 units out of 2,400 total IB)
DDD is a supply partner to two out of three major OEMs worldwide (Philips and Siemens)
DDD has a pipeline of new products expected in 2008/09, offering long-term growth potential
Source: Orbotech
Corporate PresentationSlide 59
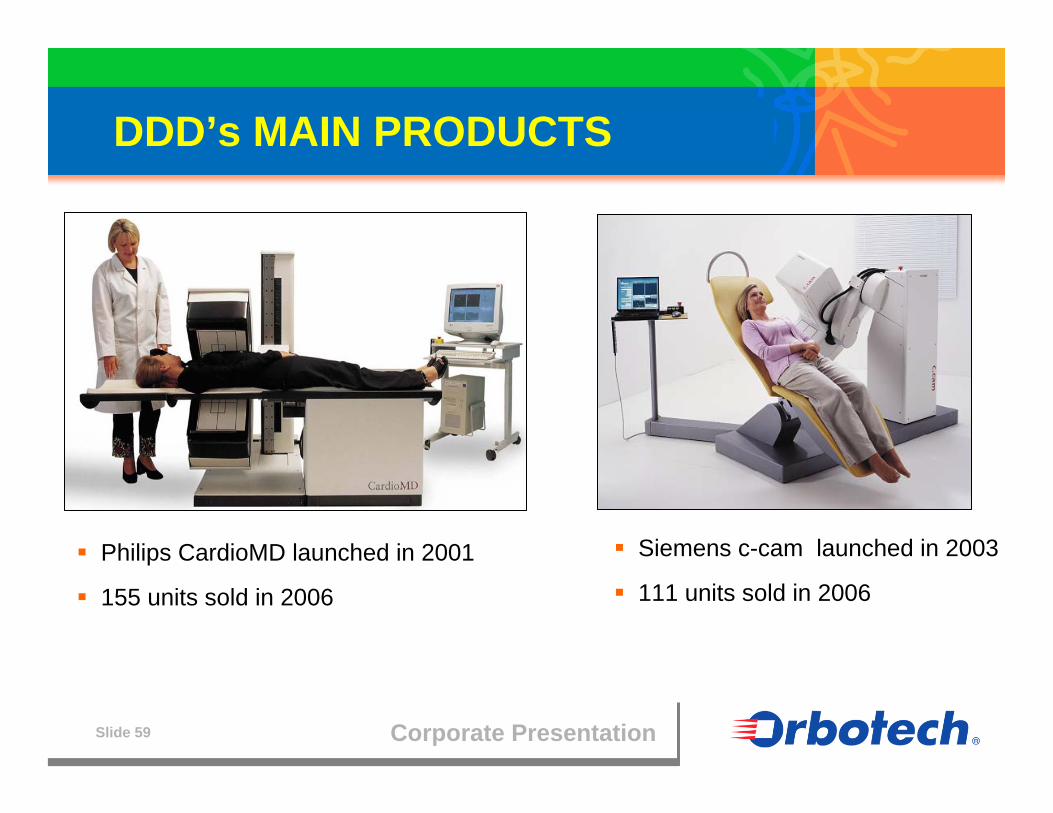
DDD’s MAIN PRODUCTS
Philips CardioMD launched in 2001
155 units sold in 2006
Siemens c-cam launched in 2003
111 units sold in 2006
Corporate PresentationSlide 60
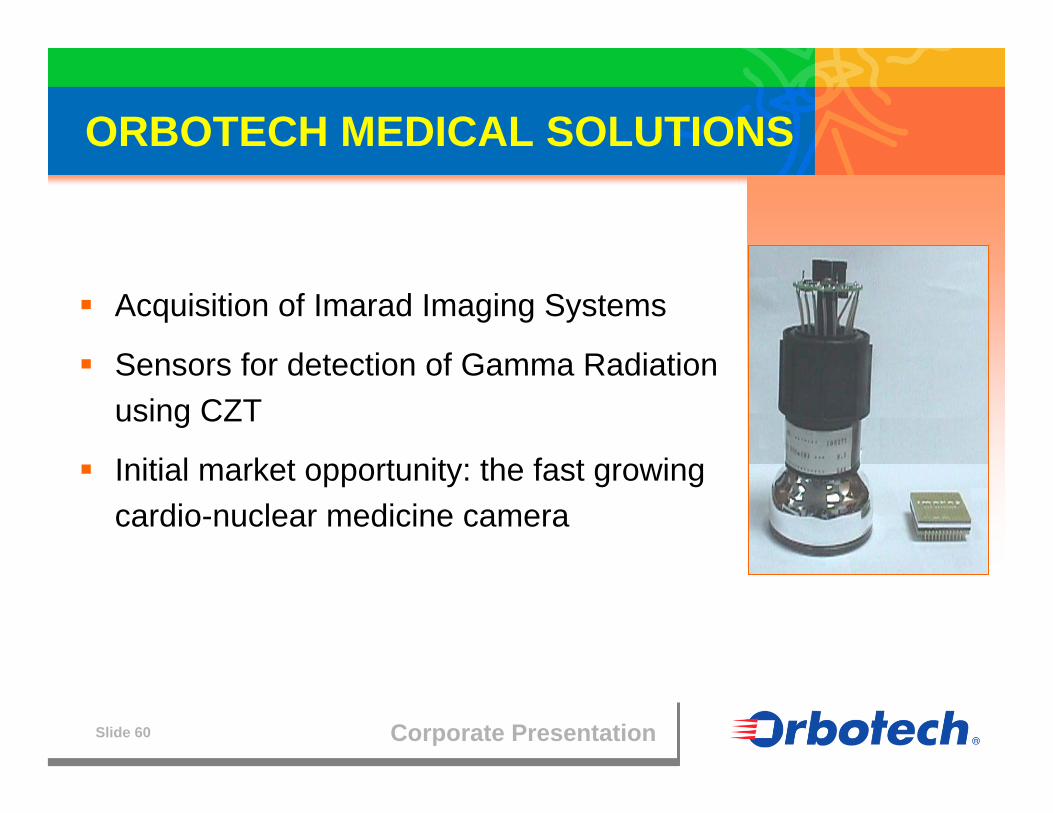
ORBOTECH MEDICAL SOLUTIONS
Acquisition of Imarad Imaging Systems
Sensors for detection of Gamma Radiation using CZT
Initial market opportunity: the fast growing cardio-nuclear medicine camera
Orbograph
Corporate PresentationSlide 62
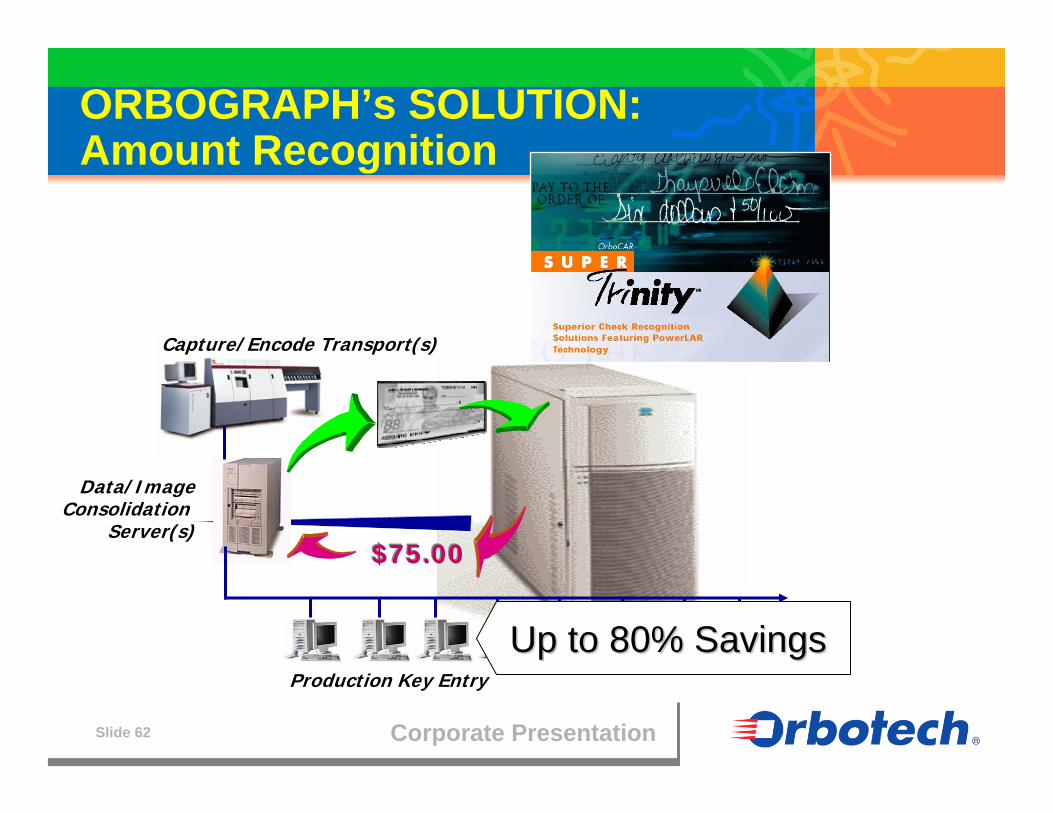
ORBOGRAPH’s SOLUTION: Amount Recognition
Data/ImageConsolidation
Server(s)$75.00$75.00
Production Key Entry
Up to 80% SavingsUp to 80% Savings
Capture/Encode Transport(s)

Corporate PresentationSlide 63
RECO PRODUCT LINE
Amount recognition for checks (Orbocar)
Field recognition (payer, payee, MICR)
Image quality and field usability (IQUA)
Image-based fraud detection
PNV
Forgery
Counterfeit
Data mining for marketing

Corporate PresentationSlide 64
THE KEY-PAY® CONCEPT
Highly-skilled,performance-driven
workforce
Check Image
Document Image(Unstructured, structured
semi-structured)
Audio File
?Image, video, etc.
Digital Objector Source
Secure InternetConnection
Key-PayHubR-BOX
Remote Data Completion
Personnel
Web-based, DistributedHuman Completion providers
AutomatedConversion App.
Corporate PresentationSlide 65
KEY-PAY® PRODUCT LINE
Products:
APEX for checks processing
CONVENE for forms processing
Sales model:
Recurring service revenues (by click charge)
Offer turnkey solution or Infrastructure only

Financials
Corporate PresentationSlide 67
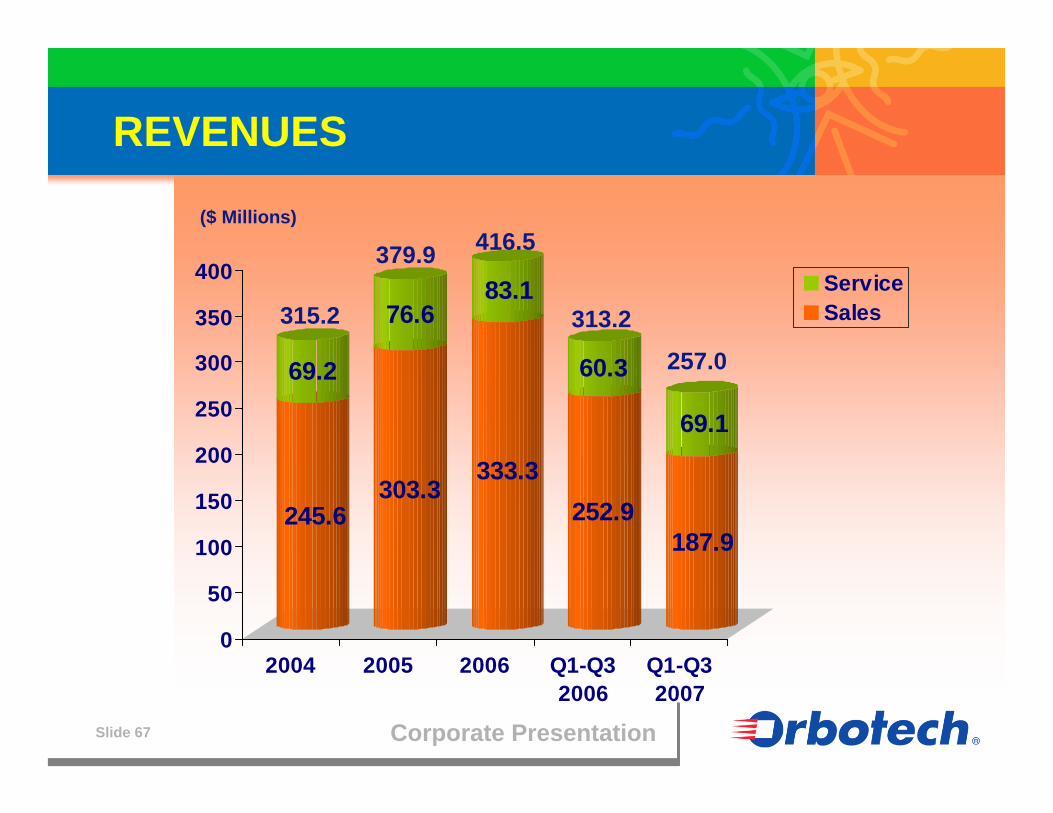
REVENUES
($ Millions)
245.6
69.2
303.3
76.6
333.3
83.1
252.9
60.3
187.9
69.1
0
50
100
150
200
250
300
350
400
2004 2005 2006 Q1-Q32006
Q1-Q32007
ServiceSales315.2
379.9 416.5
313.2
257.0

Corporate PresentationSlide 68
REVENUES BY QUARTER
($ Millions)
100.5101.4
86.1 89.3
104.9
88.693.7
106.9
82.3
96.4103.3
0
20
40
60
80
100
120
Q1 Q2 Q3 Q4
200520062007
Corporate PresentationSlide 69
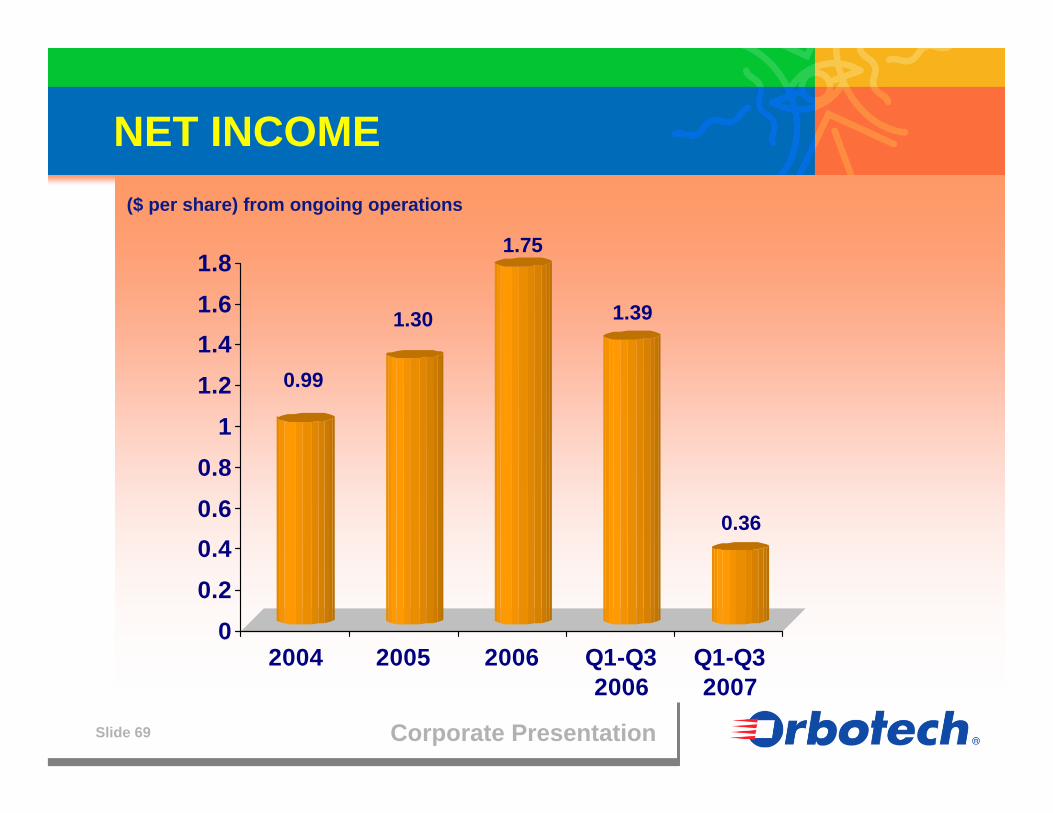
NET INCOME
0.99
1.30
1.75
1.39
0.36
00.20.40.60.8
11.21.41.61.8
2004 2005 2006 Q1-Q32006
Q1-Q32007
($ per share) from ongoing operations
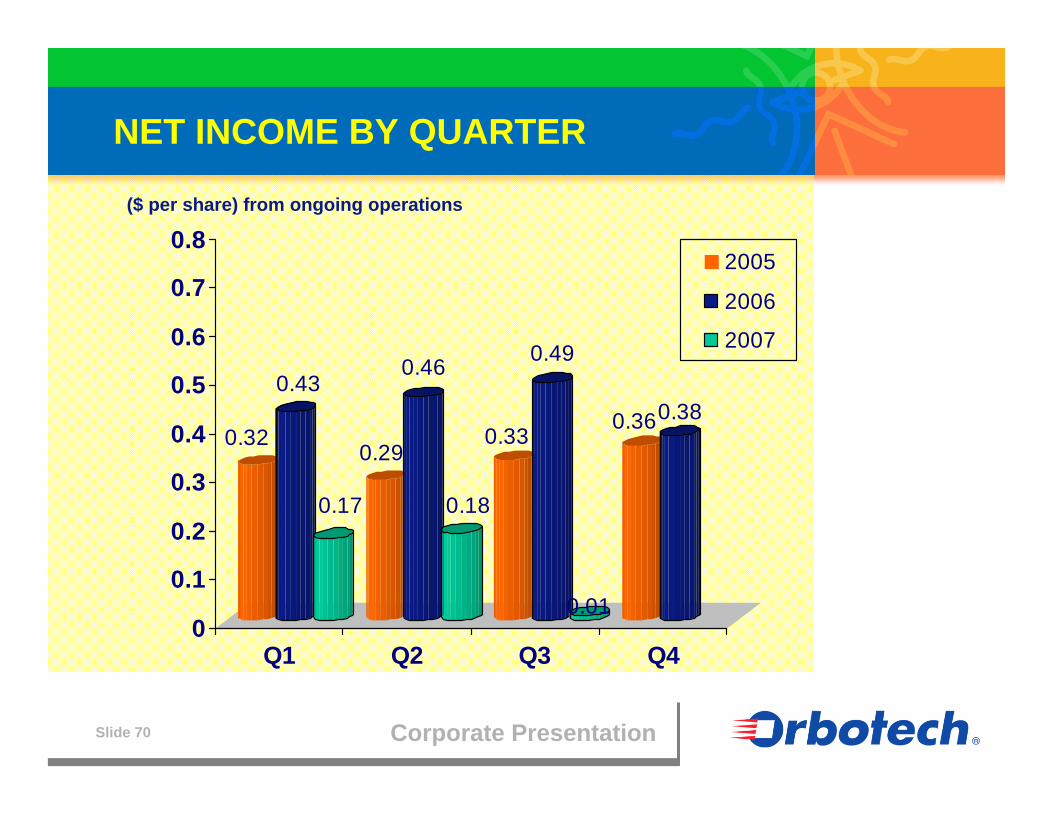
Corporate PresentationSlide 70
NET INCOME BY QUARTER
($ per share) from ongoing operations
0.32
0.43
0.17
0.29
0.46
0.18
0.33
0.49
0.01
0.360.38
0
0.1
0.2
0.3
0.4
0.5
0.6
0.7
0.8
Q1 Q2 Q3 Q4
2005
2006
2007
Corporate PresentationSlide 71
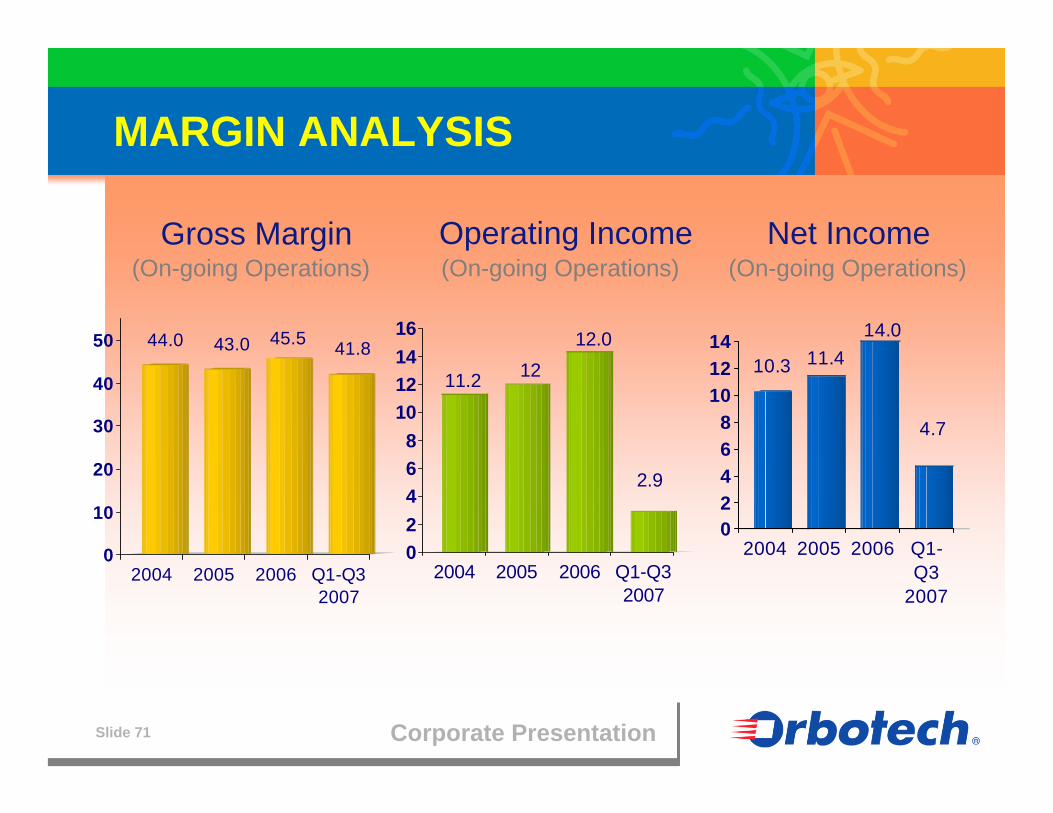
MARGIN ANALYSIS
44.0 43.0 45.5 41.8
0
10
20
30
40
50
2004 2005 2006 Q1-Q32007
11.2 1212.0
2.9
02468
10121416
2004 2005 2006 Q1-Q32007
10.3 11.414.0
4.7
02468
101214
2004 2005 2006 Q1-Q3
2007
Gross Margin(On-going Operations)
Operating Income(On-going Operations) (On-going Operations)
Net Income
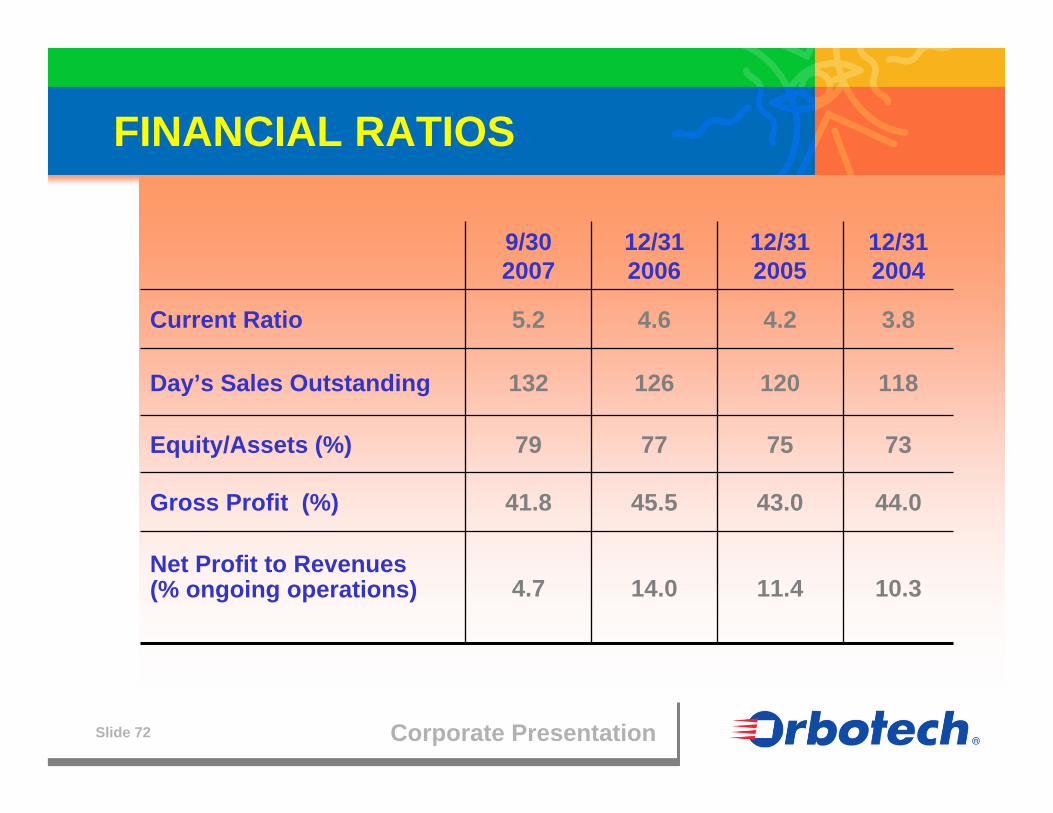
Corporate PresentationSlide 72
14.0
45.5
77
126
4.6
12/312006
10.3
44.0
73
118
3.8
12/312004
11.4
43.0
75
120
4.2
12/31 2005
4.7Net Profit to Revenues(% ongoing operations)
41.8Gross Profit (%)
79Equity/Assets (%)
132Day’s Sales Outstanding
5.2Current Ratio
9/302007
FINANCIAL RATIOS

Corporate PresentationSlide 73