slide 3.1- 1 copyright © 2007 pearson education, inc. publishing as pearson addison-wesley
TRANSCRIPT

Slide 3.1- 1 Copyright © 2007 Pearson Education, Inc. Publishing as Pearson Addison-Wesley
Copyright © 2008 Pearson Education, Inc. Publishing as Pearson Addison-Wesley
OBJECTIVES
Quadratic Functions
Learn to graph a quadratic function in standard form.
Learn to graph a quadratic function.
Learn to solve problems modeled by quadratic functions.
SECTION 3.1
1
2
3
Slide 3.1- 3 Copyright © 2007 Pearson Education, Inc. Publishing as Pearson Addison-Wesley
QUADRATIC FUNCTION
A function that can be defined by an equation of the form
where a, b, and c, are real numbers with a ≠ 0, is called a quadratic function.
f x ax2 bx c ,
Slide 3.1- 4 Copyright © 2007 Pearson Education, Inc. Publishing as Pearson Addison-Wesley
THE STANDARD FORM OFA QUADRATIC FUNCTION
The quadratic function
is in standard form. The graph of f is a parabola with vertex (h, k). The parabola is symmetric with respect to the line x = h, called the axis of the parabola. If a > 0, the parabola opens up, and if a < 0, the parabola opens down.
f x a x h 2 k , a 0

Slide 3.1- 5 Copyright © 2007 Pearson Education, Inc. Publishing as Pearson Addison-Wesley
EXAMPLE 1 Finding a Quadratic Function
Find the standard form of the quadratic function whose graph has vertex (–3, 4) and passes through the point (–4, –7).
Let y = f (x) be the quadratic function.
Solution
y a x h 2 k
y a x 3 2 4
y a x 3 2 4
7 a –4 3 2 4
a 3
Hence,
y 3 x 3 2 4
Slide 3.1- 6 Copyright © 2007 Pearson Education, Inc. Publishing as Pearson Addison-Wesley
PROCEDURE FOR GRAPHING f (x) = a(x – h)2 + k
Step 1 The graph is a parabola. Identify a, h, and k.
Step 2 Determine how the parabola opens. If a > 0, the parabola opens up. If a < 0, the parabola opens down.
Step 3 Find the vertex. The vertex is (h, k). If a > 0 (or a < 0), the function f has a minimum (or a maximum) value k at x = h.
Slide 3.1- 7 Copyright © 2007 Pearson Education, Inc. Publishing as Pearson Addison-Wesley
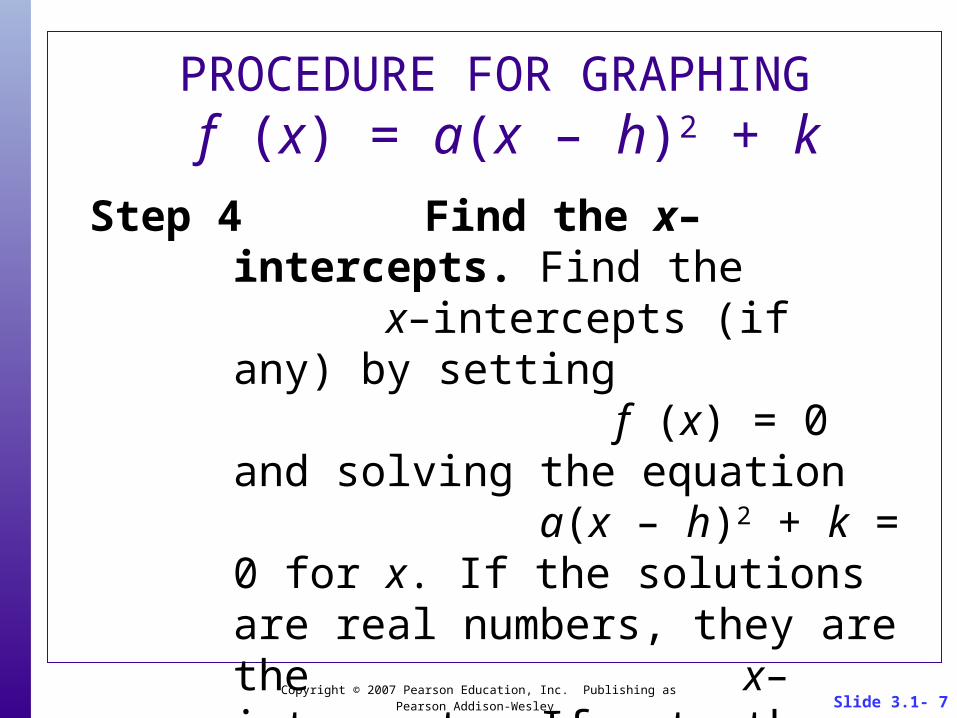
PROCEDURE FOR GRAPHING f (x) = a(x – h)2 + k
Step 4 Find the x–intercepts. Find the x–intercepts (if any) by setting f (x) = 0 and solving the equation a(x – h)2 + k = 0 for x. If the solutions are real numbers, they are the x–intercepts. If not, the parabola either lies above the x–axis (when a > 0) or below the x–axis (when a < 0).
Slide 3.1- 8 Copyright © 2007 Pearson Education, Inc. Publishing as Pearson Addison-Wesley
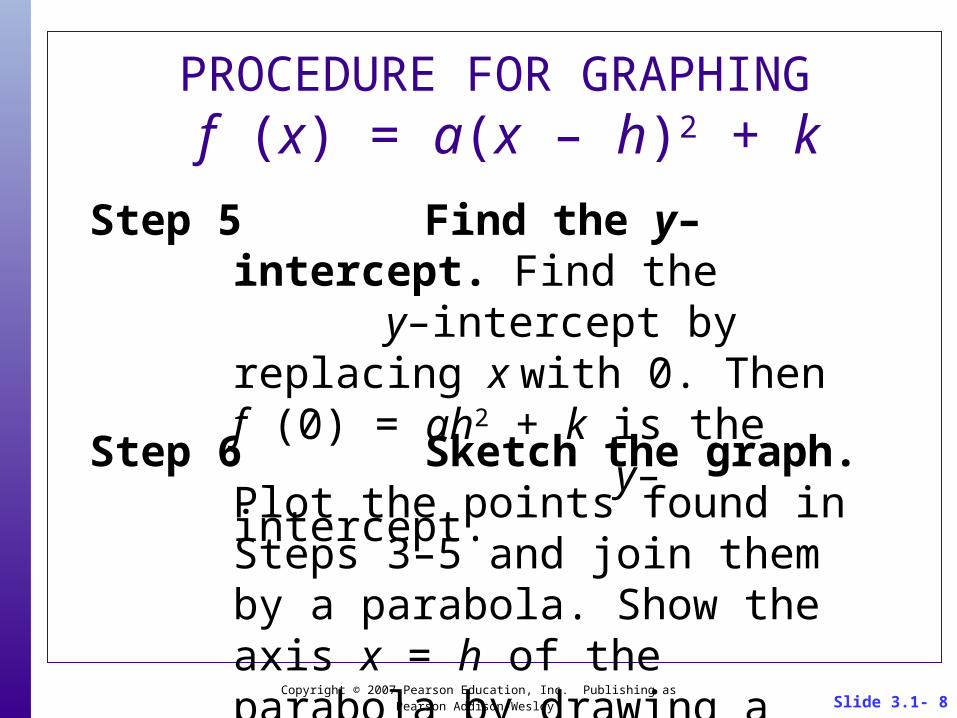
PROCEDURE FOR GRAPHING f (x) = a(x – h)2 + k
Step 6 Sketch the graph. Plot the points found in Steps 3–5 and join them by a parabola. Show the axis x = h of the parabola by drawing a dashed line.
Step 5 Find the y–intercept. Find the y–intercept by replacing x with 0. Then f (0) = ah2 + k is the y–intercept.
Slide 3.1- 9 Copyright © 2007 Pearson Education, Inc. Publishing as Pearson Addison-Wesley
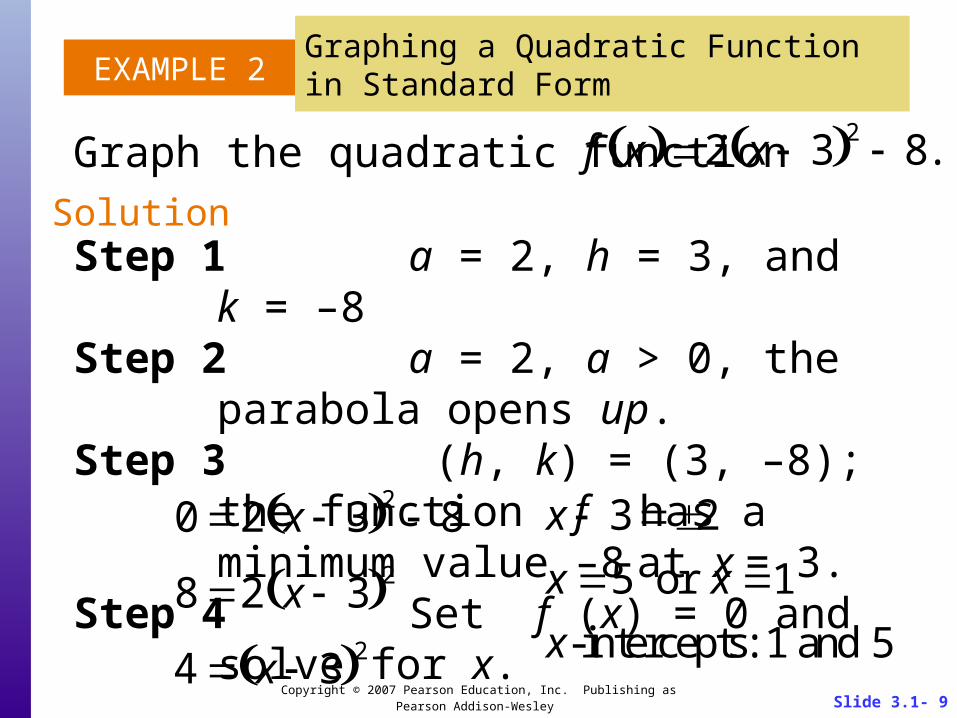
EXAMPLE 2Graphing a Quadratic Function in Standard Form
Graph the quadratic function f x 2 x 3 2 8.
SolutionStep 1 a = 2, h = 3, and k = –8Step 2 a = 2, a > 0, the parabola opens up.Step 3 (h, k) = (3, –8); the function f has a
minimum value –8 at x = 3.Step 4 Set f (x) = 0 and solve for x.
0 2 x 3 2 8
8 2 x 3 2
4 x 3 2
x 3 2
x 5 or x 1
x-intercepts: 1 and 5
Slide 3.1- 10 Copyright © 2007 Pearson Education, Inc. Publishing as Pearson Addison-Wesley
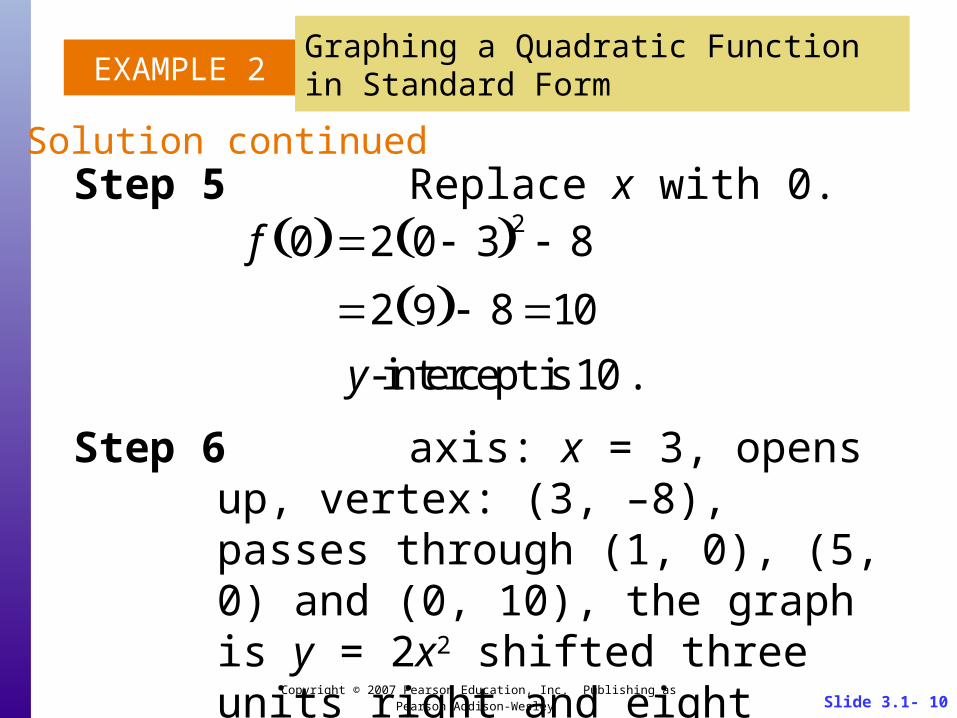
EXAMPLE 2Graphing a Quadratic Function in Standard Form
Solution continuedStep 5 Replace x with 0.
f 0 2 0 3 2 8
2 9 8 10
y-intercept is 10 .
Step 6 axis: x = 3, opens up, vertex: (3, –8), passes through (1, 0), (5, 0) and (0, 10), the graph is y = 2x2 shifted three units right and eight units down.

Slide 3.1- 11 Copyright © 2007 Pearson Education, Inc. Publishing as Pearson Addison-Wesley
EXAMPLE 2Graphing a Quadratic Function in Standard Form
Solution continued
f x 2 x 3 2 8.

Slide 3.1- 12 Copyright © 2007 Pearson Education, Inc. Publishing as Pearson Addison-Wesley
PROCEDURE FOR GRAPHING f (x) = ax2 + bx + c
Step 1 The graph is a parabola. Identify a, b, and c.
Step 2 Determine how the parabola opens. If a > 0, the parabola opens up. If a < 0, the parabola opens down.
Step 3 Find the vertex (h, k). Use the formula:
h, k b
2a, f
b
2a
.
Slide 3.1- 13 Copyright © 2007 Pearson Education, Inc. Publishing as Pearson Addison-Wesley
PROCEDURE FOR GRAPHING f (x) = a(x – h)2 + k
Step 4 Find the x–intercepts. Let y = f (x) = 0. Find x by solving the equation ax2 + bx + c = 0. If the solutions are real numbers, they are the x–intercepts. If not, the parabola either lies above the x–axis (when a > 0) or below the x–axis (when a < 0).
Slide 3.1- 14 Copyright © 2007 Pearson Education, Inc. Publishing as Pearson Addison-Wesley
PROCEDURE FOR GRAPHING f (x) = a(x – h)2 + k
Step 5 Find the y–intercept. Let x = 0. The result f (0) = c is the y–intercept.
Step 7 Draw a parabola through the points found in Steps 3–6.
Step 6 The parabola is symmetric with
respect to its axis,
Use this symmetry to find additional
points.
x b
2a.
Slide 3.1- 15 Copyright © 2007 Pearson Education, Inc. Publishing as Pearson Addison-Wesley
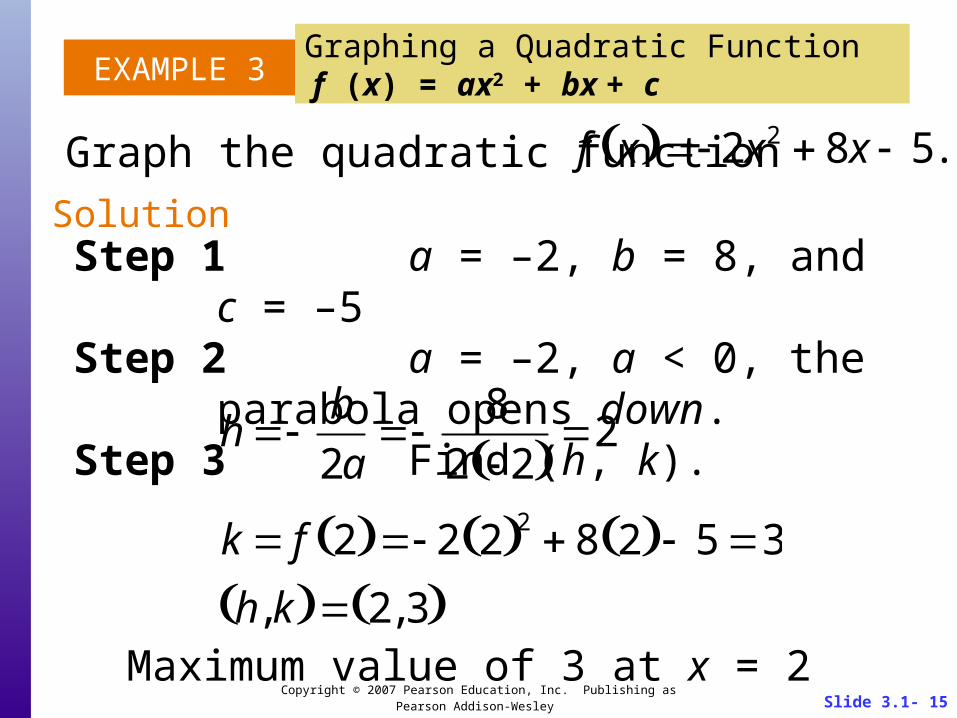
EXAMPLE 3Graphing a Quadratic Function f (x) = ax2 + bx + c
Solution
Graph the quadratic function f x 2x2 8x 5.
Step 1 a = –2, b = 8, and c = –5Step 2 a = –2, a < 0, the parabola opens down.Step 3 Find (h, k).
h b
2a
8
2 2 2
k f 2 2 2 2 8 2 5 3
h, k 2, 3 Maximum value of 3 at x = 2

Slide 3.1- 16 Copyright © 2007 Pearson Education, Inc. Publishing as Pearson Addison-Wesley
EXAMPLE 3Graphing a Quadratic Function f (x) = ax2 + bx + c
Solution continuedStep 4 Let f (x) = 0.
f 0 2 0 2 8 0 5
y-intercept is 5 .
Step 5 Let x = 0.
2x2 8x 5 0
x 8 8 2 4 2 5
2 2 4 6
2
x-intercepts are 4 6
2 and
4 6
2.
Slide 3.1- 17 Copyright © 2007 Pearson Education, Inc. Publishing as Pearson Addison-Wesley
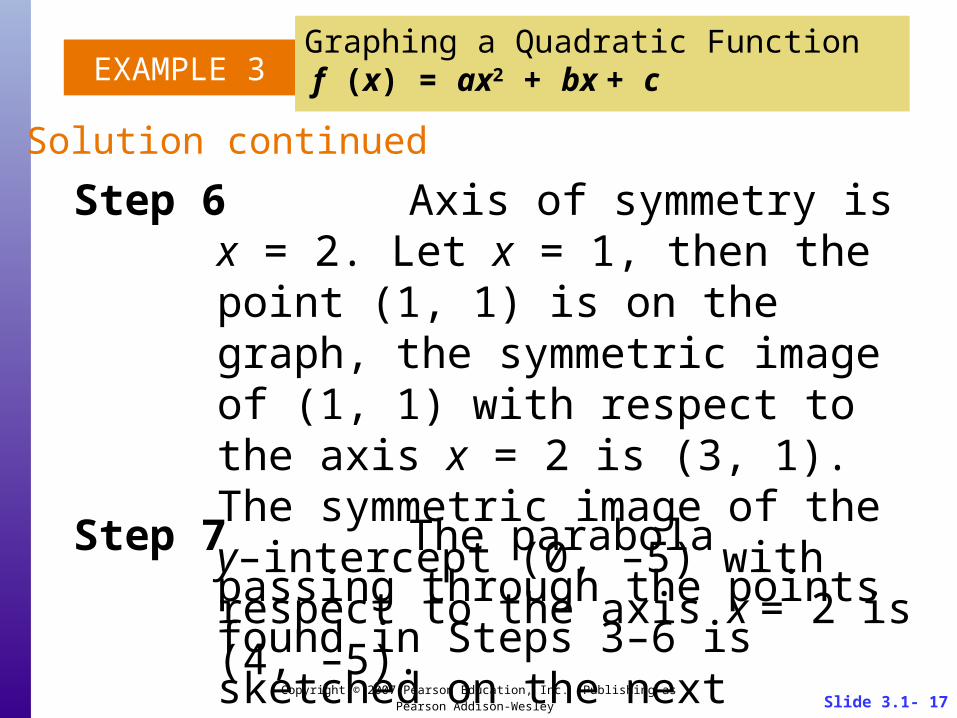
EXAMPLE 3Graphing a Quadratic Function f (x) = ax2 + bx + c
Solution continued
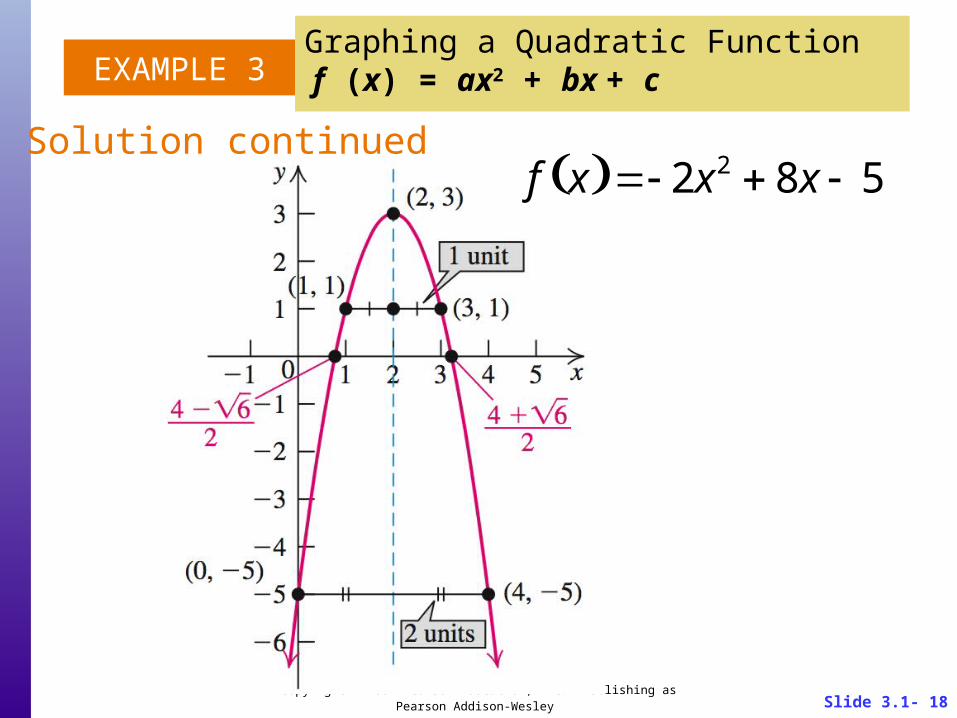
Step 6 Axis of symmetry is x = 2. Let x = 1, then the point (1, 1) is on the graph, the symmetric image of (1, 1) with respect to the axis x = 2 is (3, 1). The symmetric image of the y–intercept (0, –5) with respect to the axis x = 2 is (4, –5).
Step 7 The parabola passing through the points found in Steps 3–6 is sketched on the next slide.
Slide 3.1- 18 Copyright © 2007 Pearson Education, Inc. Publishing as Pearson Addison-Wesley
EXAMPLE 3Graphing a Quadratic Function f (x) = ax2 + bx + c
Solution continuedf x 2x2 8x 5

Slide 3.1- 19 Copyright © 2007 Pearson Education, Inc. Publishing as Pearson Addison-Wesley
EXAMPLE 4Identifying the Characteristics of a Quadratic Function from Its Graph
The graph of f (x) = –2x2 +8x – 5 is shown.• Find the domain and range of f.• Solve the inequality –2x2 +8x – 5 > 0.
b. The graph is above the x-axis in the interval
4 6
2,4 6
2
.
Solution
a. The domain is (–∞, ∞). The range is (–∞, 3].
Slide 3.1- 20 Copyright © 2007 Pearson Education, Inc. Publishing as Pearson Addison-Wesley
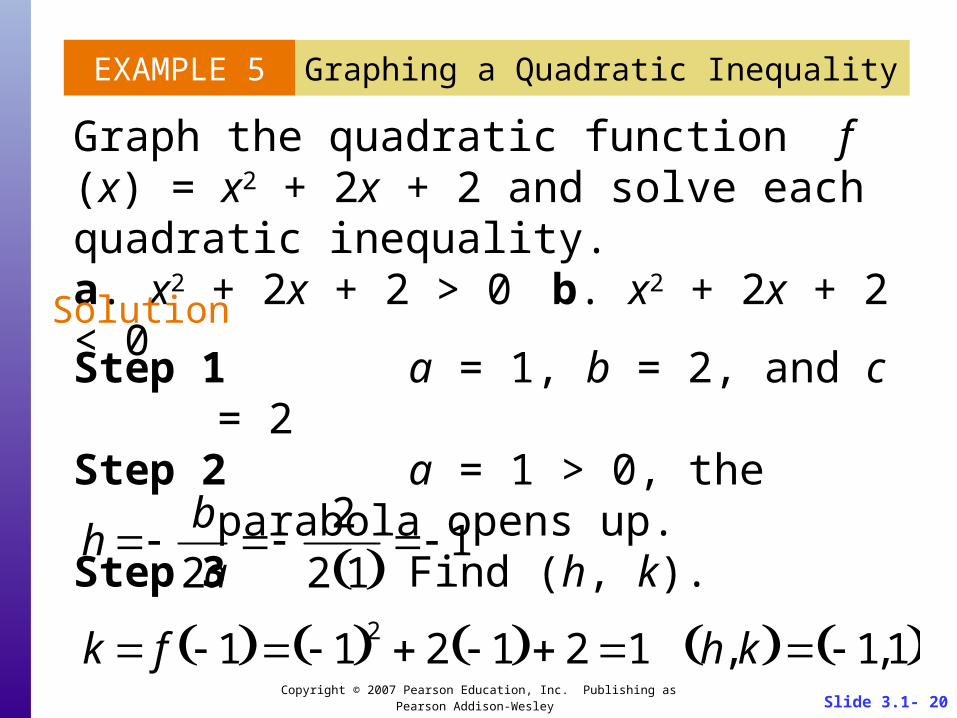
EXAMPLE 5 Graphing a Quadratic Inequality
Graph the quadratic function f (x) = x2 + 2x + 2 and solve each quadratic inequality.a. x2 + 2x + 2 > 0 b. x2 + 2x + 2 < 0
Solution
Step 1 a = 1, b = 2, and c = 2Step 2 a = 1 > 0, the parabola opens up.Step 3 Find (h, k).
h b
2a
2
2 1 1
k f 1 1 2 2 1 2 1 h, k 1,1
Slide 3.1- 21 Copyright © 2007 Pearson Education, Inc. Publishing as Pearson Addison-Wesley
EXAMPLE 5 Graphing a Quadratic Inequality
Solution continued
Minimum value of 1 at x = –1
Step 4 Set f (x) = 0.
f 0 0 2 2 0 2 2
y-intercept is 2 .
Step 5 Set x = 0.
x2 2x 2 0
x 2 2 2 4 1 2
2 1 2 4
2
x-intercepts are 1i .
real, the graph does not intersect the x–axis.
The solutions are not
Slide 3.1- 22 Copyright © 2007 Pearson Education, Inc. Publishing as Pearson Addison-Wesley
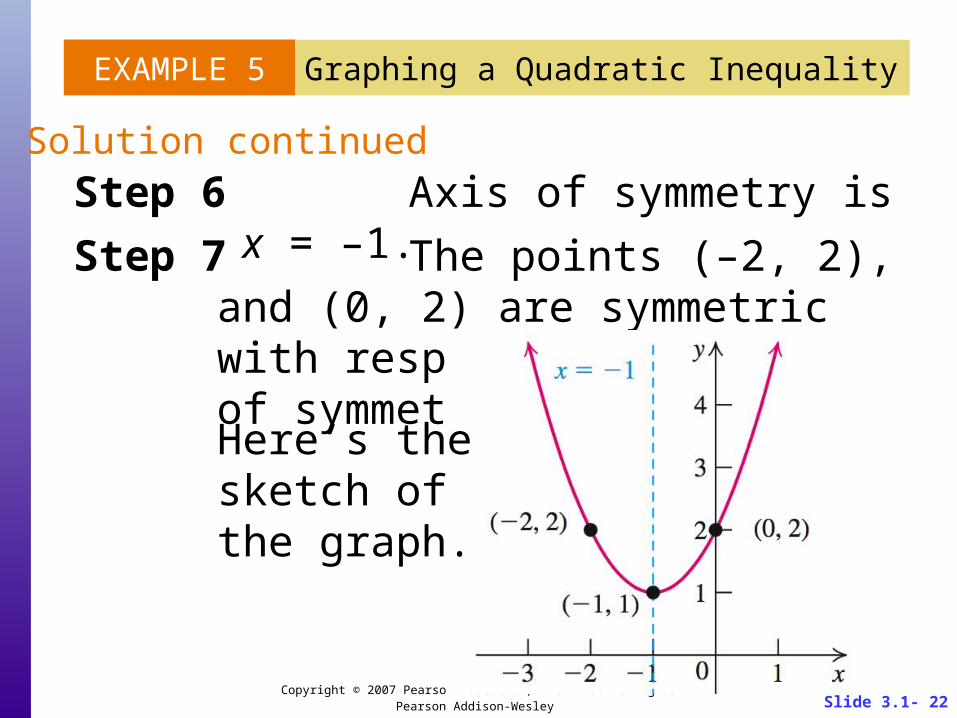
EXAMPLE 5 Graphing a Quadratic Inequality
Solution continued
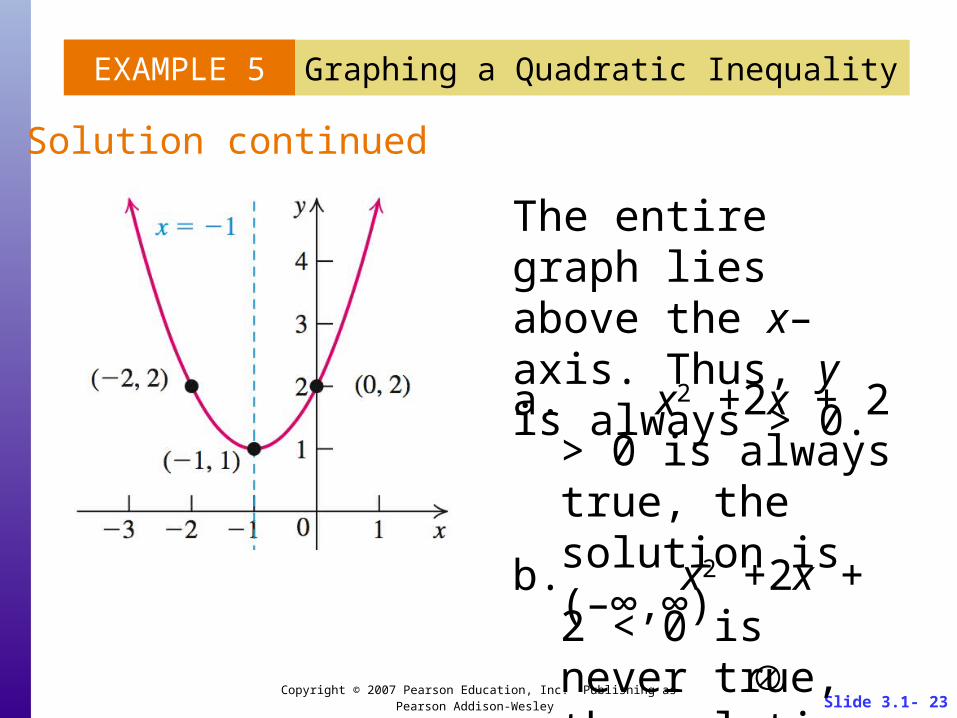
Step 6 Axis of symmetry is x = –1.
Step 7 The points (–2, 2), and (0, 2) are symmetric with respect to the axis of symmetry.
Here’s the sketch of the graph.
Slide 3.1- 23 Copyright © 2007 Pearson Education, Inc. Publishing as Pearson Addison-Wesley
EXAMPLE 5 Graphing a Quadratic Inequality
Solution continued
The entire graph lies above the x–axis. Thus, y is always > 0.
a. x2 +2x + 2 > 0 is always true, the solution is (–∞,∞)
b. x2 +2x + 2 < 0 is never true, the solution is

Slide 3.1- 24 Copyright © 2007 Pearson Education, Inc. Publishing as Pearson Addison-Wesley
EXAMPLE 6 Yours, Mine, and Ours
A widower with 10 children marries a widow who also has children. After their marriage, they have their own children. If the total number of children is 24, and we assume that the children of the same parents do not fight, find the maximum possible number of fights among the children. (In this example, a fight between Sean and Misty, no matter how many times they fight, is considered as one fight.)
Slide 3.1- 25 Copyright © 2007 Pearson Education, Inc. Publishing as Pearson Addison-Wesley
EXAMPLE 6 Yours, Mine, and Ours
Solution
Suppose the widow had x number of children before marriage. Then the couple has24 – 10 – x = 14 – x additional children after their marriage. Since the children of the same parents do not fight, there are no fights among the 10 children the widower brought into the marriage, among the x children the widow brought into the marriage, or among the 14 – x children of the couple (widower and widow).
Slide 3.1- 26 Copyright © 2007 Pearson Education, Inc. Publishing as Pearson Addison-Wesley
EXAMPLE 6 Yours, Mine, Ours
Solution continued
The possible number of fights among the children of
(i) the widower (10 children) and the widow (x children) is 10x.
(ii) the widower (10 children) and the couple (14 – x children) is 10(14 – x), and
(iii) the widow (x children) and the couple (14 – x children) is x(14 – x).
Slide 3.1- 27 Copyright © 2007 Pearson Education, Inc. Publishing as Pearson Addison-Wesley
EXAMPLE 6 Yours, Mine, Ours
Solution continued
The possible number y of all fights is given byy 10x 10 14 x x 14 x 10x 140 10x 14x x2
140 14x x2
In the quadratic function y = f (x) = –x2 +14x + 140, we have a = –1, b = 14, and c = 140.
Slide 3.1- 28 Copyright © 2007 Pearson Education, Inc. Publishing as Pearson Addison-Wesley
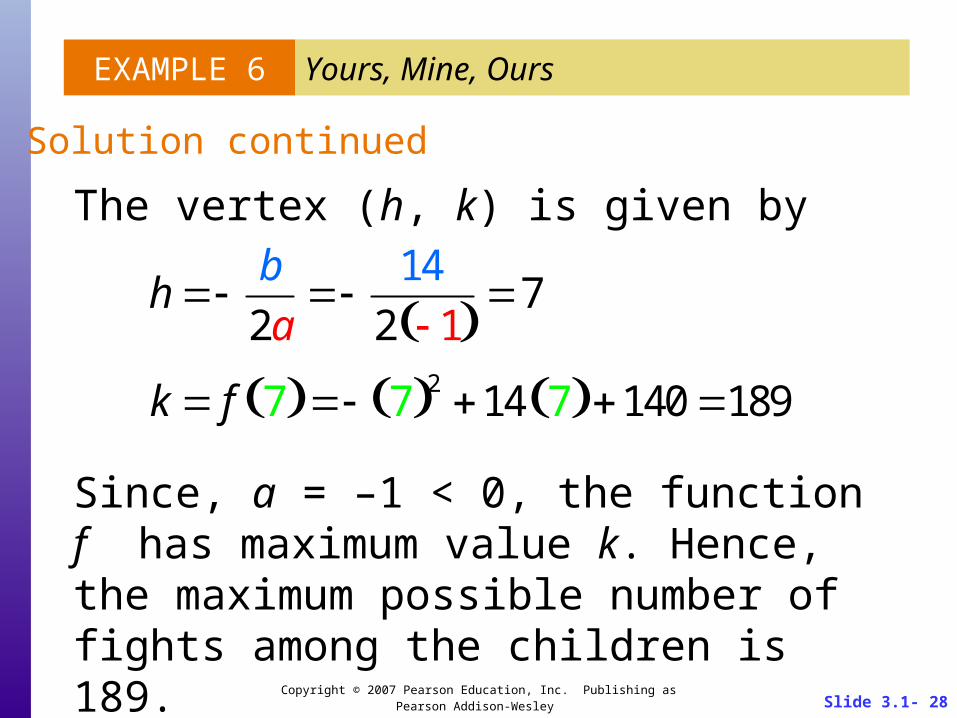
EXAMPLE 6 Yours, Mine, Ours
Solution continued
The vertex (h, k) is given by
h b
2a
14
2 1 7
k f 7 7 2 14 7 140 189
Since, a = –1 < 0, the function f has maximum value k. Hence, the maximum possible number of fights among the children is 189.