slides developed by: pamela l. hall, western washington university risk and return chapter 8
TRANSCRIPT

Slides developed by:Pamela L. Hall, Western Washington University
Risk and Return
Chapter 8
2
Why Study Risk and Return?
Returns to equity investments (stock) have historically been much higher than the return to debt investments Equity returns averaged more than 10% while debt
returns average between 3% and 4%• Inflation also averaged about 3% during the same time
period
Returns on equity investments are much more volatile than the returns on debt instruments in the short-run

3
Why Study Risk and Return?
Since equity earns a much higher return but with higher risk, it would be nice if we could invest and earn a high return but reduce the risk associated with such investments Investing in portfolios of securities can help manage
risk• A portfolio is a collection of financial assets by investors
We wish to capture the high average returns of equity investing while limiting the associated risk as much as possible
4
The General Relationship Between Risk and Return Risk in finance is defined as the probability of
losing some or all of the money invested in a deal Generally investments that offer higher returns
involve higher risks Suppose you could invest in a stock that would
either return you 15% or a loss of everything (-100%) Also, suppose the chance of losing everything is 1%
and the chance of earning 15% is 99% The risk associated with this investment is the 1%
chance of losing everything
5
The General Relationship Between Risk and Return Investors more or less expect to receive a
positive return but they realize that there is risk associated with these investments and the chance that they can lose their money
Stocks offering a higher likely return also have higher probabilities of total loss
It is difficult to determine how much risk is associated with a given level of return Need to define risk in a measurable way
• The definition has to include all the probabilities of loss Have to relate that measurement to return

6
Portfolio Theory—Modern Thinking about Risk and Return Portfolio theory defines investment risk in
a measurable way and relates it to the expected level of return from an investment
Has had major impact on practical investing activities
7
The Return on an Investment
The rate of return allows an investment's return to be compared with other investments
One-Year Investments The return on a debt investment is
• K = interest paid loan amount• A return is what the investor receives divided by what is
invested
The return on a stock investment is • K = D1 + (P1 – P0) P0
8
Returns, Expected and Required The expected return on a stock is the
return investors feel is most likely to occur based on currently available information Anticipated return based on the dividends
expected as well as the future expected price No rational person makes any investment
without some expectation of return

9
Returns, Expected and Required The required return on a stock is the minimum
rate at which investors will purchase or hold a stock based on their perceptions of its risk People will only invest in an asset if they believe the
expected return is at least equal to the required return• Different people have different levels of both expected and
required return• Significant investment in a stock occurs only if the expected
return exceeds the required return for a substantial number of investors
10
Risk—A Preliminary Definition
A preliminary definition of investment risk is the probability that return will be less than expected This definition includes both positive and negative returns that
are lower than expected
Feelings About Risk Most people have negative feelings about bearing risk Risk averse investors prefer lower risk when expected returns
are equal Most people see a trade-off between risk and return However risk isn't to be avoided, but higher risk investments
must offer a higher expect return to encourage investment

11
Portfolio Theory
Review of the Concept of a Random Variable In statistics a random variable is the outcome
of a chance process and has a probability distribution
Discrete variables can take only specific variables
Continuous variables can take any value within a specified range

12
Review of the Concept of a Random Variable The Mean or Expected Value
The most likely outcome for the random variable
For symmetrical probability distributions the mean is the center of the distribution
Statistically it is the weighted average of all possible outcomes
n
i ii=1
X = XP X

13
Portfolio Theory
Variance and Standard Deviation Variability relates to how far a typical observation of
the variable is likely to deviate from the mean• There's is a great deal of difference in variability around the
mean for different distributions• Telephone poles don't vary much in height from pole to pole—
actual pole heights are closely clustered around the mean
• Office buildings do vary a great deal in terms of height—widely dispersed around the mean
• The standard deviation gives an indication of how far from the mean a typical observation is likely to fall

14
Portfolio Theory
Variance and Standard Deviation Variance Formula
n 22
x i ii=1
Var X X X P X
n 2
X x i ii=1
SD X X P X
• Variance is the average squared deviation from the mean
Standard deviation formula

15
Portfolio Theory—Example
1.0000
0.06254
0.25003
0.37502
0.25001
0.06250
P(X)X
The mean of this distribution is 2, since it is a symmetrical distribution.
Exa
mpl
e
Q:If you toss a coin four times what is the chance of receiving heads (x)?

16
Portfolio Theory—Example
1.00SD X =
1.00Var X =
0.250.0625424
0.250.2500113
0.000.3750002
0.250.25001-11
0.250.06254-20
(Xi – )2 x P(Xi)P(Xi)(Xi – )2(Xi – )Xi X
Since the variance is 1.0, the
standard deviation is also 1.0. E
xam
ple
A: The Variance and Standard Deviation of the distribution is:
17
Review of the Concept of a Random Variable The Coefficient of Variation
A relative measure of variation—the ratio of the standard deviation of a distribution to its mean
• CV = Standard Deviation Mean• For example, if the CV = 0.5, then the typical variation is
50% the size of the mean, or ½
Continuous Random Variable Can take on any numerical value within some range We talk about the probability of an actual outcome
being within a range of values rather than being an exact amount

18
The Return on a Stock Investment as a Random Variable In financial theory, the return on a stock investment is
considered a random variable Return is influenced by the future price of the stock and the
expected dividends• There is an element of uncertainty in both of these variables
Return is a continuous random variable with a low value of -100% but no limit to the high value
The mean of the distribution of returns is the stock's expected return
The variance and standard deviation show how likely it is that an actual return will be some distance from the expected value Actual return in a distribution with a large variance is likely to be
different from the mean

19
Figure 8.4: Probability Distributions With Large and Small Variances

20
Risk Redefined as Variability
In financial theory risk is defined as variability in return
A risky stock has a high probability of earning a return that significantly differs from the mean of the distribution While a low-risk stock is more like to earn a return
similar to the expected return
In practical terms risk is the probability that return will be less than expected
21
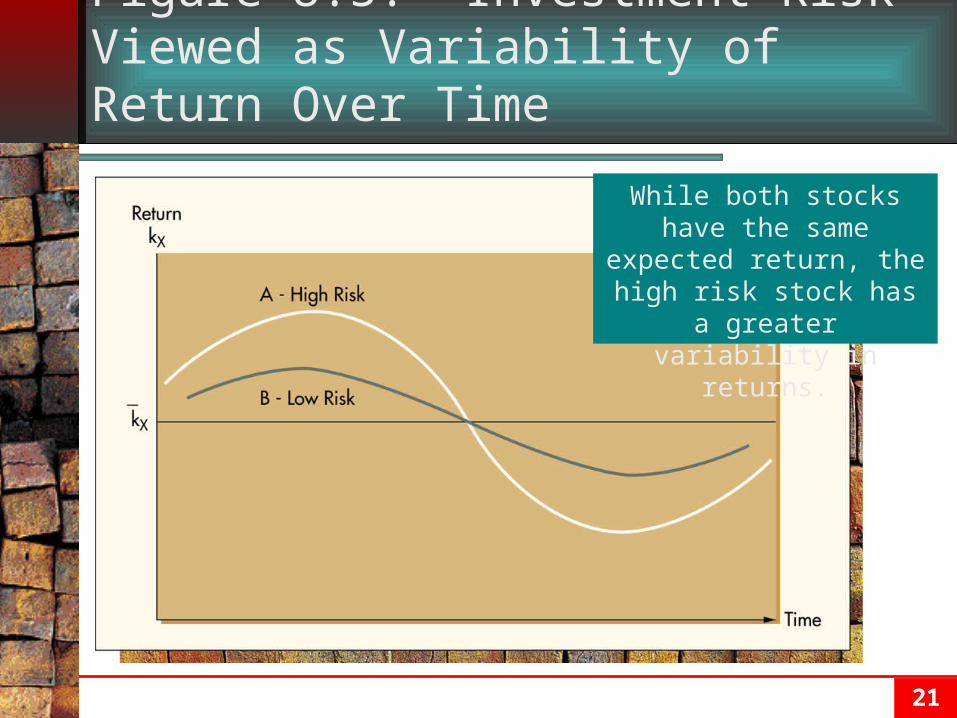
Figure 8.5: Investment Risk Viewed as Variability of Return Over Time
While both stocks have the same expected return, the
high risk stock has a greater variability in
returns.

22
Risk Aversion
Risk aversion means investors prefer lower risk when expected returns are equal
When expected returns are not equal the choice of investment depends on the investor's tolerance for risk

23
Figure 8.6: Risk Aversion

24
Portfolio Theory—Example
Q: Harold MacGregor is considering buying stocks for the first time and is looking for a single company in which he'll make a major investment. He's narrowed his search to two firms, Evanston Water Inc. (a public utility) and Astro Tech Corp. (a new high-tech company).
Public utilities are low-risk stocks because they are regulated monopolies
High tech firms are high-risk because new technical ideas can succeed tremendously, fail completely or end up in-between
Harold has studied the history and prospects of both firms and their industries, and with the help of his broker has made a discrete estimate of the probability distribution of returns for each stock as follows:
Exa
mpl
e

25
Portfolio Theory—Example
Evaluate Harold's options in terms of statistical concepts of risk and return.
Exa
mpl
e
0.151300.0514
0.20300.1512
0.30150.6010
0.2000.158
0.15-100%0.056%
P(kA)kAP(kE)kE
Astro
Tech
Evanston Water
26
Portfolio Theory—Example
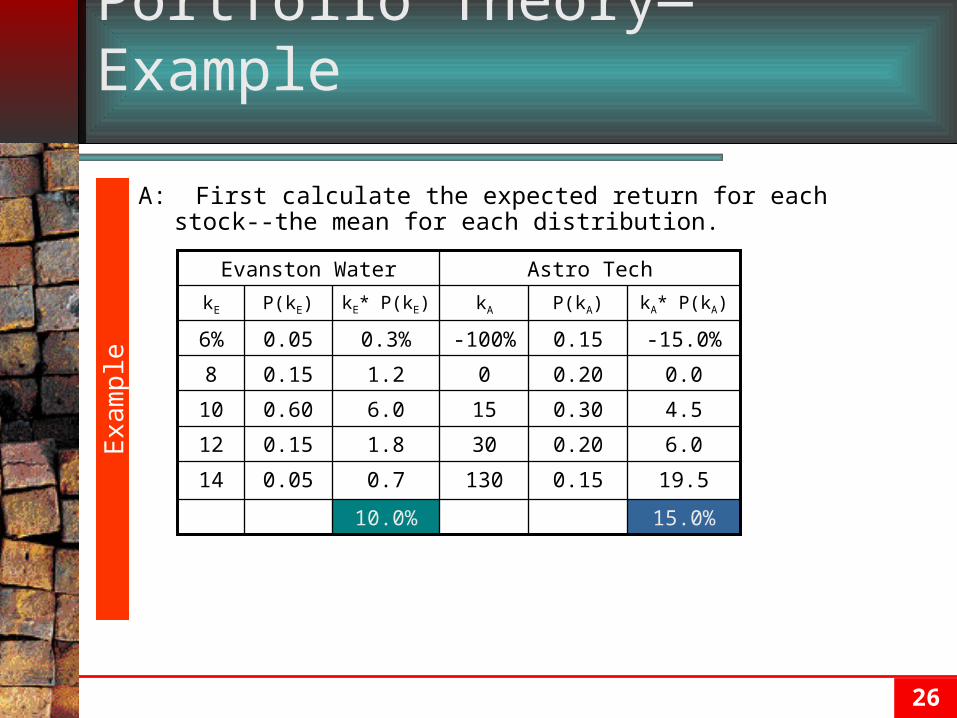
A: First calculate the expected return for each stock--the mean for each distribution.
Exa
mpl
e
15.0%10.0%
130
30
15
0
-100%
kA
0.7
1.8
6.0
1.2
0.3%
kE* P(kE)
19.50.150.0514
6.00.200.1512
4.50.300.6010
0.00.200.158
-15.0%0.150.056%
kA* P(kA)P(kA)P(kE)kE
Astro TechEvanston Water
27
Portfolio Theory—ExampleE
xam
ple
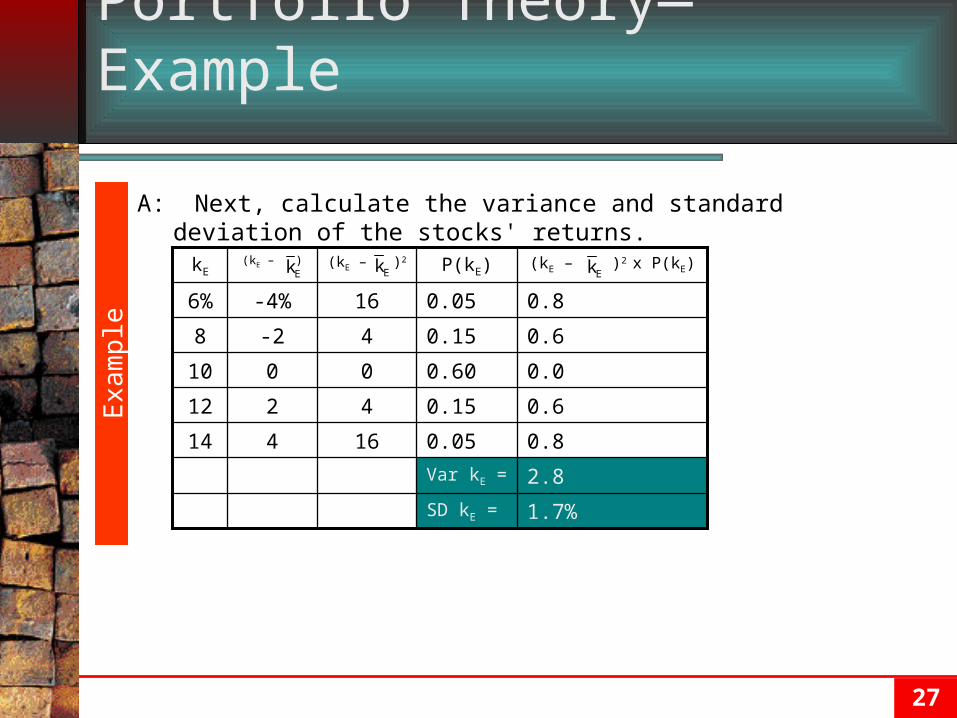
1.7%SD kE =
2.8Var kE =
0.80.0516414
0.60.154212
0.00.600010
0.60.154-28
0.80.0516-4%6%
(kE – )2 x P(kE)P(kE)(kE – )2(kE – )kE Ek Ek Ek
A: Next, calculate the variance and standard deviation of the stocks' returns.

28
Portfolio Theory—ExampleE
xam
ple
63.7SD kA =
4,058Var kA =
1,9840.1513,225115130
450.202251530
00.300015
450.20225-150
1,9840.1513,225-115%-100%
(kA – )2 x P(kA)P(kA)(kA – )2(kA – )kA Ak Ak Ak
E AE A
E A
σ σ1.7 63.7CV = = = 0.17 CV = = = 4.25
10.0 15.0k k
A: Finally, calculate the coefficient of variation for each stock's return.

29
Portfolio Theory—Example
A: If Harold only considers expected return, he’ll certainly choose Astro. However, with Evanston his investment is relatively safe while with Astro there is a substantial chance he’ll lose everything.
No one but Harold can make the decision as to which investment he should choose. It depends on his degree of risk aversion.
Exa
mpl
e

30
Decomposing Risk—Systematic (Market) and Unsystematic (Business-Specific) Risk
Fundamental truth of the investment world The returns on securities tend to move up and down
together• Not exactly together or proportionately
Events and Conditions Causing Movement in Returns Some things influence all stocks (market risk)
• Political news, inflation, interest rates, war, etc. Some things influence only particular firms (business-
specific risk)• Earnings reports, unexpected death of key executive, etc.
Some things affect all companies within an industry• A labor dispute, shortage of a raw material

31
Decomposing Risk—Systematic (Market) and Unsystematic (Business-Specific) Risk
Comparison of IBM, Boeing and the S&P500
020406080
100120140
10/1
0/20
00
11/1
0/20
00
12/1
0/20
00
1/10
/200
1
2/10
/200
1
3/10
/200
1
4/10
/200
1
5/10
/200
1
6/10
/200
1
7/10
/200
1
8/10
/200
1
9/10
/200
1
10/1
0/20
01
Date
Sto
ck
Pri
ce
02004006008001000120014001600
IBM Boeing S&P500
Ind
ex V
alu
e
Market reopens after World Trade
Center collapses.
32
Decomposing Risk—Systematic (Market) and Unsystematic (Business-Specific) Risk
Movement in Return as Risk The total movement in a stock's return is the total risk
inherent in the stock
Separating Movement/Risk into Two Parts A stock's risk can be separated into systematic or
market risk and unsystematic or business-specific risk
33
Portfolios
A portfolio is an investor's total stock holding Risk and Return for a Portfolio
Each stock in a portfolio has its own expected return and its own risk
Portfolios have their own risks and returns• The return on a portfolio is a weighted average of the returns
of the individual stocks in the portfolio• The risk is the variance or standard deviation of the
probability distribution of the portfolio's return• Not the same as the weighted average of the standard
deviations or variances of the individual stocks within the portfolio
34
Portfolios
The Goal of the Investor/Portfolio Owner Goal of investors: to capture the high
average returns of equities while avoiding as much risk as possible
• Generally done by constructing diversified portfolios to minimize portfolio risk for a given return
Investors are concerned with how stocks impact portfolio performance, not with the stocks' stand-alone characteristics
35
Diversification—How Portfolio Risk Is Affected When Stocks Are Added
Diversification means adding different (diverse) stocks to a portfolio Can reduce (but not eliminate) risk in a portfolio
Business-Specific Risk and Diversification Business-specific risk is a series of essentially
random events that push the returns of individual stocks up or down
• Their effects simply cancel when added together over a substantial number of stocks
• Is essentially random and can be diversified away• For this to work, the stocks within the portfolio must be from
fundamentally different industries

36
Diversification—How Portfolio Risk Is Affected When Stocks Are Added Systematic (Market) Risk and Diversification
If the returns of all stocks move up and down more or less together, it's not possible to reduce risk completely
• Systematic risk can be reduced but never entirely eliminated
The Portfolio If we have a portfolio that is as diversified as the market, its
return will move in tandem with the market The Impact on Portfolio Risk of Adding New Stocks
If we add a stock to the portfolio which has returns perfectly positively correlated with the portfolio, it will generally add risk to the diversified portfolio
If we add a stock that is perfectly negatively correlated with the portfolio, it will decrease the risk of the portfolio
37
Diversification—How Portfolio Risk Is Affected When Stocks Are Added The Risk of the New Additions By Themselves and in
Portfolios Stocks with equal stand-alone risk can have opposite risk
impacts on a portfolio because of the timing of the variation in their returns
A stock's risk in a portfolio sense is its market risk Choosing Stocks to Diversify for Market Risk
How do we diversify to reduce market risk in a portfolio• Theoretically it's simple: just add stocks that move counter
cyclically with the market• Unfortunately it's difficult to find stocks that move in that direction• However numerous stocks exist that have returns that are less than
positively correlated with the market• Adding these stocks to the portfolio will generally reduce risk
somewhat, but will not eliminate it
38
Diversification—How Portfolio Risk Is Affected When Stocks Are Added
The Importance of Market Risk Modern portfolio theory is based on the
assumption that investors focus on portfolios rather than on individual stocks
• How stocks affect portfolios depends only on market risk
For the small investor with a limited portfolio, these concepts do not apply

39
Measuring Market Risk—The Concept of Beta Market risk is a crucial concept in investing, so we need
a way to measure it for individual stocks A stock's beta measures its market risk
It measures the variation of a stock's return which accompanies the market's variation in return
Developing Beta Beta is developed by determining the historical relationship
between a stock's return and the return on a market index, such as the S&P500
• The stock's characteristic line reflects the average relationship between its return and the market
• Beta is the slope of the characteristic line
Projecting Returns with Beta Knowing a stock's beta enables us to estimate changes in its
return given changes in the market's return
40
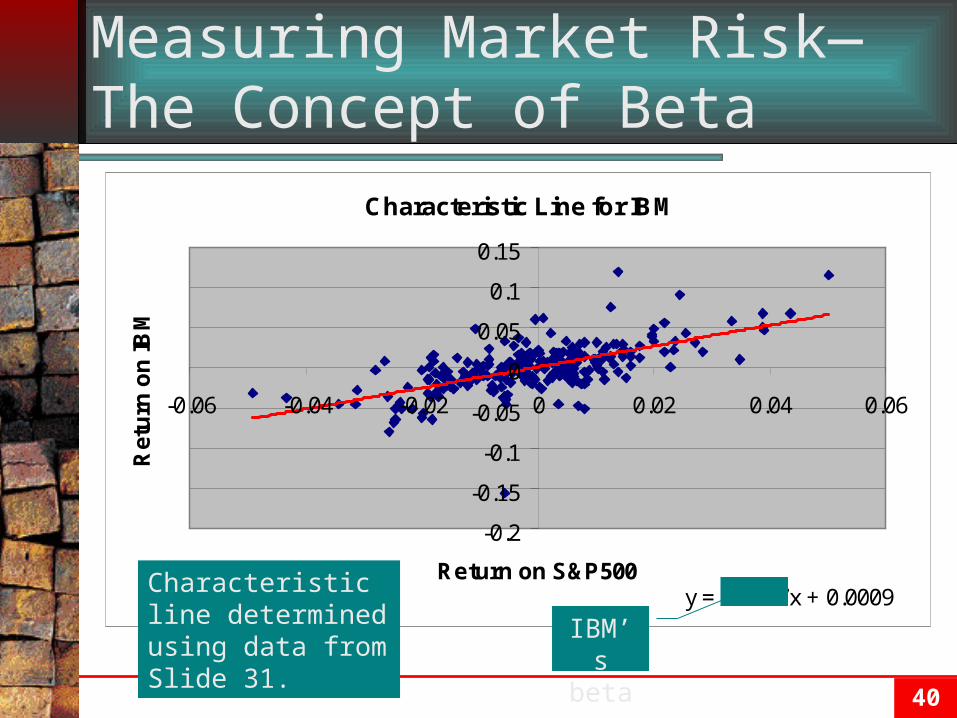
Measuring Market Risk—The Concept of Beta
Characteristic Line for IBM
y = 1.3037x + 0.0009
-0.2
-0.15
-0.1
-0.05
0
0.05
0.1
0.15
-0.06 -0.04 -0.02 0 0.02 0.04 0.06
Return on S&P500
Ret
urn
on
IBM
Characteristic line determined using data from Slide 31.
IBM’s beta
41
Measuring Market Risk—The Concept of Beta
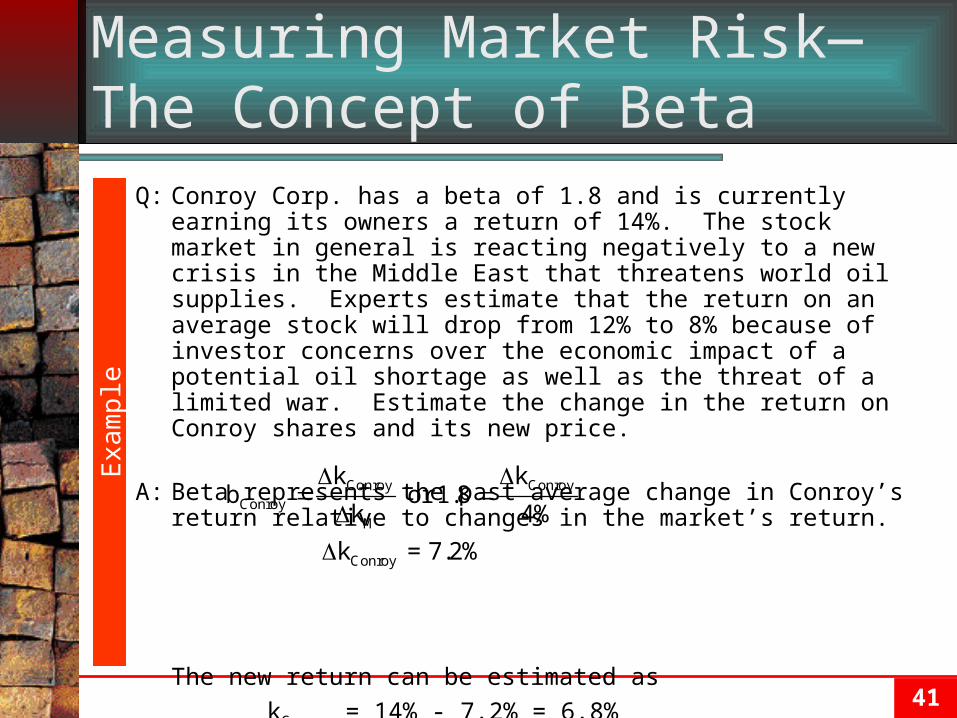
Q: Conroy Corp. has a beta of 1.8 and is currently earning its owners a return of 14%. The stock market in general is reacting negatively to a new crisis in the Middle East that threatens world oil supplies. Experts estimate that the return on an average stock will drop from 12% to 8% because of investor concerns over the economic impact of a potential oil shortage as well as the threat of a limited war. Estimate the change in the return on Conroy shares and its new price.
A: Beta represents the past average change in Conroy’s return relative to changes in the market’s return.
The new return can be estimated as
kConroy = 14% - 7.2% = 6.8%
Exa
mpl
e
Conroy ConroyConroy
M
Conroy
k kb or 1.8
k 4%
k = 7.2%
42
Measuring Market Risk—The Concept of Beta Betas are developed from historical data
May not be accurate if a fundamental change in the business environment occurs
Small investors should remember that beta doesn't measure total risk
A beta > (<) 1.0 implies the stock moves more (less) than the market
Beta < 0 means the stock tends to move against the market Stocks in gold mining companies are a real-world example of
negative beta stocks Beta for a Portfolio
Beta for a portfolio is the weighted average of the betas of the individual stocks within the portfolio

43
Using Beta—The Capital Asset Pricing Model (CAPM) The CAPM helps us determine how stock prices
are set in the market Developed in 1950s and 1960s by Harry Markowitz
and William Sharpe
The CAPM's Approach People won't invest unless a stock's expected return
is at least equal to their required return The CAPM attempts to explain how investors'
required returns are determined
44
Using Beta—The Capital Asset Pricing Model (CAPM) Rates of Return, The Risk-Free Rate and Risk
Premiums The risk-free rate (kRF) is a rate for which there is no
chance of receiving less than what is expected• Returns on federally insured bank accounts and short-term
Treasury debt are examples of risk-free investments Investing in any other investment is a risky venture;
thus investors will require a return greater than the risk-free rate
• Investors want to be compensated for the extra risk taken via a rate known as the risk premium (KRP)
• The CAPM purports to explain how the risk premium in required rates of return are formed
• The Security Market Line (SML) is the heart of the CAPM

45
The Security Market Line (SML) The SML proposes that required rates of return
are determined by:
The Market Risk Premium• Is a reflection of the investment community's level of risk aversion• It is the risk premium for an investment in the market as a whole
The Risk Premium for Stock X• The beta for Stock X times the risk premium of the market• Says that the risk premium for a stock is determined only by the
stock's relationship with the market as measured by beta
X RF M RF X
Market Risk Premium
Stock X's Risk Premium
k k k k b
46
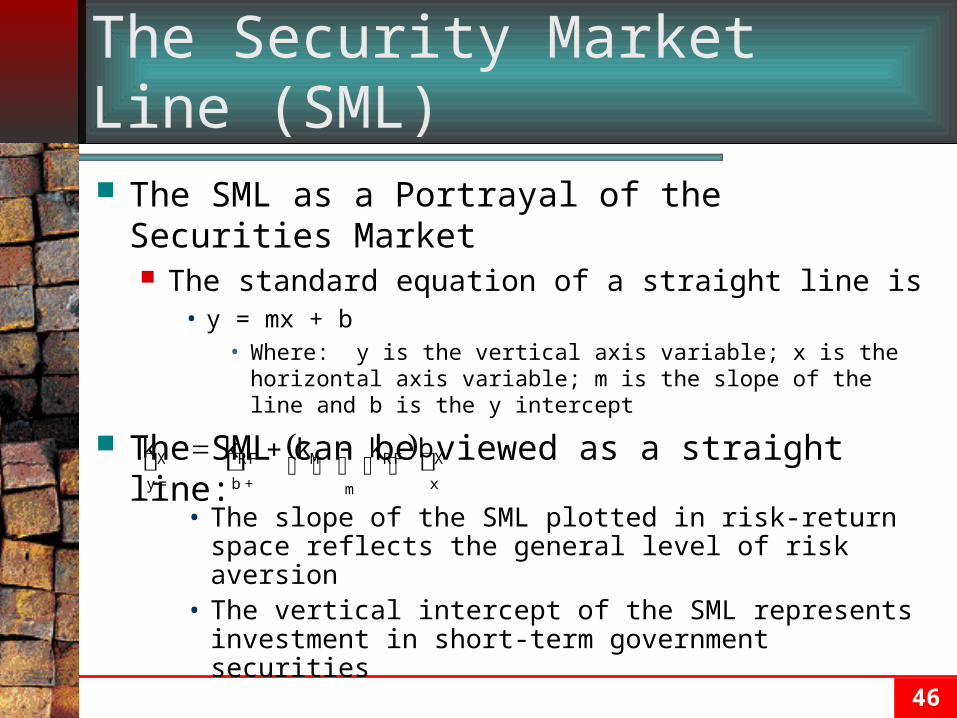
The Security Market Line (SML) The SML as a Portrayal of the Securities Market
The standard equation of a straight line is• y = mx + b
• Where: y is the vertical axis variable; x is the horizontal axis variable; m is the slope of the line and b is the y intercept
The SML can be viewed as a straight line:
X RF M RF X
y = b + xm
k k k k b
• The slope of the SML plotted in risk-return space reflects the general level of risk aversion
• The vertical intercept of the SML represents investment in short-term government securities

47
The Security Market Line (SML) The SML as a Line of Market Equilibrium
If, for every stock, its expected return equals its required return, the SML represents equilibrium
Suppose that a stock's expected return now becomes less than its required return
• Investors would no longer desire that stock and owners of the stock would sell while potential buyers would no longer be interested
• The stock price would drop because supply would exceed demand
• Since the stock price is dropping, its expected return is increasing, driving it back toward equilibrium
• The SML represents a condition of stable equilibrium

48
The Security Market Line (SML) Valuation Using Risk-Return Concepts
The SML allows us to calculate the minimum required rate of return for a stock
This return can then be used in the Gordon model to determine an intrinsic value for a stock
The Impact of Management Decisions on Stock Prices Since managers can influence a stock's beta and
future growth rates, management's decisions impact the price of the stock
49
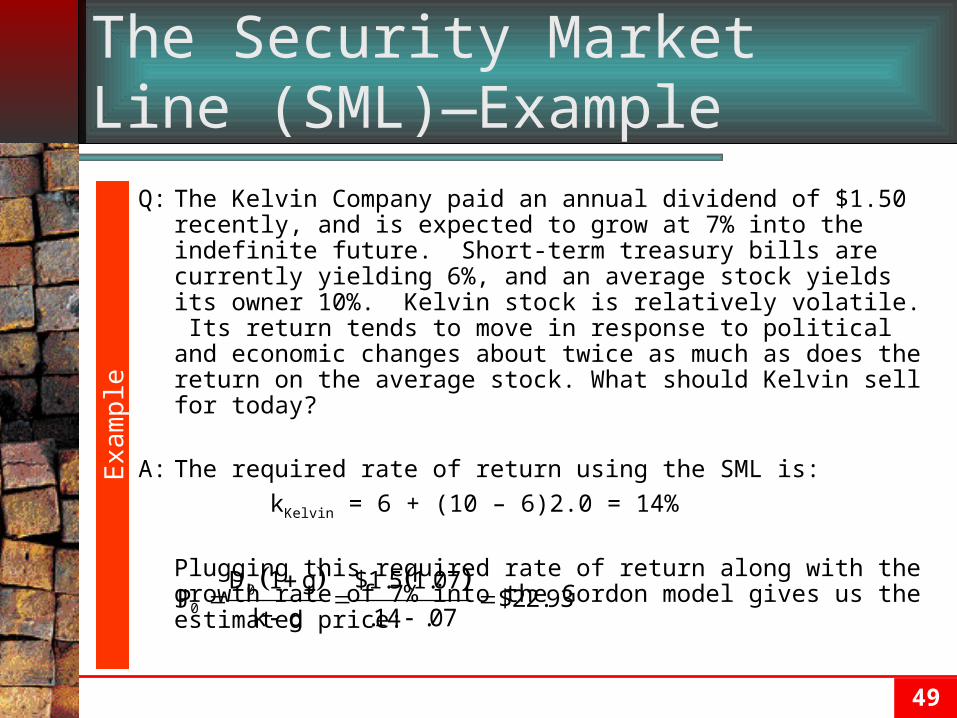
The Security Market Line (SML)—Example
Q: The Kelvin Company paid an annual dividend of $1.50 recently, and is expected to grow at 7% into the indefinite future. Short-term treasury bills are currently yielding 6%, and an average stock yields its owner 10%. Kelvin stock is relatively volatile. Its return tends to move in response to political and economic changes about twice as much as does the return on the average stock. What should Kelvin sell for today?
A: The required rate of return using the SML is:
kKelvin = 6 + (10 – 6)2.0 = 14%
Plugging this required rate of return along with the growth rate of 7% into the Gordon model gives us the estimated price:
Exa
mpl
e
00
D 1 g $1.5 1.07P $22.93
k g .14 .07

50
The Security Market Line (SML)—Example
Q: The Kelvin Company has an exciting new opportunity. The firm has identified a new field into which it can expand using technology it already possesses. The venture promises to increase the firm's growth rate to 9% from the current 7%. However, the project is new and unproven, so there's a chance it will fail and cause a considerable loss. As a result, there's some concern that the stock market won't react favorably to the additional risk. Management estimates that undertaking the venture will raise the firm's beta to 2.3 from its current level of 2.0. Should Kelvin undertake the new project if the firm’s current stock price is $22.93?
A: The objective of the firm’s management should be to maximize
shareholder wealth. If growth is expected to increase, this will have a positive impact on stock price; however, if an increase in beta is expected, stockholders will demand a higher rate of return which will cause an offsetting drop in the stock price. The expected price of the stock given both the increase in the growth rate and the increase in the firm’s beta must be calculated.
Exa
mpl
e
51
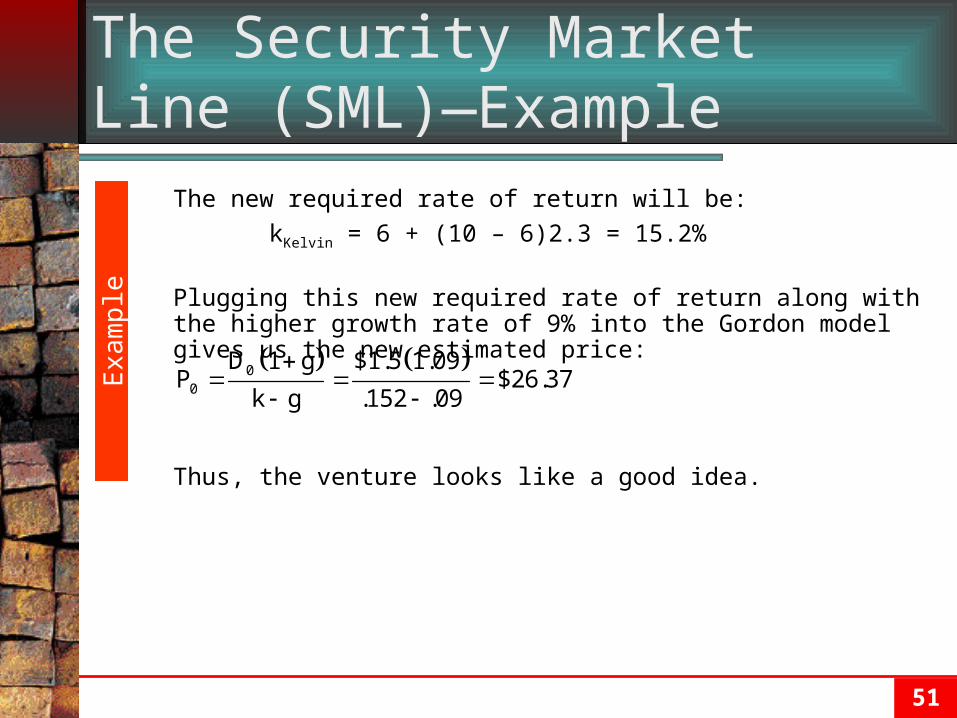
The Security Market Line (SML)—Example
The new required rate of return will be:
kKelvin = 6 + (10 – 6)2.3 = 15.2%
Plugging this new required rate of return along with the higher growth rate of 9% into the Gordon model gives us the new estimated price:
Thus, the venture looks like a good idea.
Exa
mpl
e
00
D 1 g $1.5 1.09P $26.37
k g .152 .09
52
The Security Market Line
Adjustments to Changing Market Conditions The response to a change in the risk-free rate
• If all else remains the same, a change in the risk-free rate causes a parallel shift in the SML
• The slope of the SML remains the same which means KM must increase by the amount of the change in kRF
The response to a change in risk aversion• Changes in attitudes toward risk are reflected by rotations of
the SML around its vertical intercept

53
The Validity and Acceptance of the CAPM and SML CAPM is an abstraction of reality designed to
help make predictions Its simplicity has lead to its popularity
• It relates risk and return in an easy-to-understand concept
However, CAPM is not universally accepted Continuing debate exists as to its relevance and
usefulness• Fama and French found no historical relationship between
the returns on stocks and their betas