small business lending in the united states, 2014-2015 · this version of the “small business...
TRANSCRIPT
1
Small Business Lending in the United States, 2014-2015
Office of Advocacy
U.S. Small Business Administration Release Date: June 2017
This report was developed under a contract with the U.S. Small Business Administration, Office of Advocacy, and contains information and analysis that were reviewed by officials of the Office of Advocacy. However, the final conclusions of the report do not necessarily reflect the views of the Office of Advocacy.

2
Created by Congress in 1976, the Office of Advocacy of the U.S. Small Business Administration (SBA) is an independent voice for small business within the federal government. Appointed by the President and confirmed by the U.S. Senate, the Chief Counsel for Advocacy directs the office. The Chief Counsel advances the views, concerns, and interests of small business before Congress, the White House, federal agencies, federal courts, and state policymakers. Economic research, policy analyses, and small business outreach help identify issues of concern. Regional Advocates and an office in Washington, D.C., support the Chief Counsel’s efforts. For more information on the Office of Advocacy, visit http://www.sba.gov/advocacy or call 202-205-6533. Receive email notices of new Office of Advocacy information by signing up at https://public.govdelivery.com/accounts/USSBA/subscriber/new?topic_id=USSBA_184.

3
Foreword The small business sector is central to the U.S. economy’s growth. It is evident that small businesses play a crucial role in innovation and in creating new jobs. This edition of the “Small Business Lending in the United States” combines two years of reports and reviews national and local small business lending trends using information mainly from depository lenders. Small businesses are gradually regaining their foothold as evident in several economic indicators. Analysis from both the Call Reports and CRA report data show small gradual improvements in small business lending during the 2014 and 2015 period as small business lending by traditional lenders continued to stabilize and remain positive. The banking sector is among the most heavily regulated industries under the goal of guaranteeing its constituents access to the banking system. Developments in the financing industry are reshaping how small businesses access credit. Anecdotal evidence suggests that small businesses have been increasingly relying on nontraditional sources to finance their businesses.Thus, the banking industry is going through an evolution as nontraditional lenders are offering traditional products and services to small businesses. Traditional lenders continue to be the chief supplier of small business credit, although they might be losing a portion of their market share. In addition, the banking industry continues to be affected by mergers and acquisitions. A total of 5,971 consolidated depository institutions filed Call Reports in June 2015, 272 fewer than in 2014. These institutions had roughly $600 billion in outstanding loans in 2015, a number that has slightly improved since the financial crisis, but remains well below that of pre-crisis years. As in previous reports, this report discusses recent developments in small business credit markets and analyzes patterns in small business lending using predominantly publicly available sources of information on U.S. bank data. This report has two new changes. First, a brief examination of minority depository lending institutions not covered in previous reports is included. Second, the section of the report which previously provided detailed listing and information on all individual lenders is now found solely on Advocacy’s webpage with summary charts incorporated throughout the report. As always, we welcome your feedback. Questions and other input should be addressed to Victoria Williams, economist, at 202-205-6533 or [email protected].

4
Acknowledgments
This version of the “Small Business Lending in the United States,” which addresses changes in 2014 and 2015, was written and compiled by Victoria Williams, Economist. George Haynes of Montana State University prepared the data for the analysis under contract SBAHQ-15-M-0120 to the Office of Advocacy. Victoria Carlborg edited and prepared the report for online dissemination.

5
Table of Contents
Contents Foreword ........................................................................................................................................................ 3
Acknowledgments.......................................................................................................................................... 4
Table of Contents ........................................................................................................................................... 5
Definitions...................................................................................................................................................... 6
Introduction .................................................................................................................................................... 8
Purpose. .................................................................................................................................................. 8
Structure and Coverage. ......................................................................................................................... 8
Data. ........................................................................................................................................................... 9
Comparison of Call Report and CRA Data................................................................................................ 9
Accessing the Data ................................................................................................................................... 10
Recent Developments in the Small Business Financial Credit Market ....................................................... 11
I. Findings from the June 2014 and June 2015 Call Reports ....................................................................... 14
A. Small Business Loans Outstanding from all Reporting Lending Institutions ..................................... 14
B. Loan Sizes ........................................................................................................................................... 17
C. Lending by Size of Lender .................................................................................................................. 17
D. Small Business Lending Measures: The Total Asset Ratio and Total Small Business Loan Ratio ... 21
The Total Asset Ratio. ......................................................................................................................... 21
The Total Small Business Loan Ratio. ................................................................................................ 22
E. All Small Loans Outstanding from Multibillion Dollar Lending Institutions ..................................... 24
F. Small Business Loans and Minority Lending Institutions ................................................................... 24
II. Findings from 2014 CRA Reporting Institutions .................................................................................... 27
A. Small Business Lending by CRA Reporting Lending Institutions ..................................................... 27
B. Loans $100K or less and Loans $100K to $1 Million by CRA Lending Institutions ......................... 31
Conclusion ................................................................................................................................................... 32
Data Sources and Limitations .................................................................................................................. 32
Data Sources ........................................................................................................................................ 32
Data Limitations................................................................................................................................... 33
Methodology ............................................................................................................................................ 34
References ................................................................................................................................................ 35

6
Definitions
Small business loan. A loan of $1 million or less.
Large business loan. A loan greater than $1 million.
Bank. Any national bank and state bank, and any federal branch and insured branch; includes any former savings association.
BHC—bank holding company. A company that owns and/or controls one or more U.S. banks or one that owns, or has controlling interest in, one or more banks. A bank holding company may also own another bank holding company, which in turn owns or controls a bank; the company at the top of the ownership chain is called the top holder.
Call Report. The report is officially known as the Report of Condition and Income and must be filed by all regulated financial institutions in the United States on a quarterly basis. Banks are required to file no later than 30 days after the end of each quarter.
C&I loan. Commercial and industrial loan; one of the two categories of a business loan.
CRA. The Community Reinvestment Act.
CRE loan. Commercial real estate loan; one of the two categories of a business loan.
Commercial bank. A financial institution that is owned by stockholders, operates for a profit, and engages in various lending activities.
Depository lending institution. A financial institution in the United States that is legally allowed to accept monetary deposits from consumers into safekeeping and use them to make loans to other customers. Important categories are savings banks, commercial banks, savings and loan associations, and credit unions. This report covers all of these categories except credit unions and refers to them collectively as “lenders.”
FDIC. Federal Deposit Insurance Corporation.
Mega lender. Bank holding company with more than $50 billion in assets.
MDI—Minority Depository Institution. A federally insured depository institution where 51 percent or more of the voting stock is owned by minority individuals; insured depository institutions may choose MDI status if a majority of the Board of Directors is made up of minority individuals and the community that the institution serves is predominantly minority.

7
Online lending. A term used interchangeable with “marketplace lending” generally includes any internet platform that connects lenders and borrowers.
Other depository institution. Those financial institutions not specifically listed with authority to accept deposits of funds.
Savings bank. Banking institution organized to encourage thrift by paying interest dividends on savings. Savings banks can have state and federal affiliations, for example, state savings banks and federal savings banks.
State bank. The term “state bank” means any bank, banking association, trust company, savings bank, industrial bank (or similar depository institution which the board of directors finds to be operating substantially in the same manner as an industrial bank), or other banking institution which is engaged in the business of receiving deposits, other than trust funds (as defined in this section), and is incorporated under the laws of any state.
Small business. A firm with fewer than 500 employees.
Traditional Lender. This term refers to a lender that is FDIC insured.

8
Introduction
Purpose. Small business health is essential to the economic well-being of the United States. Small businesses account for 99.7 percent of firms with paid employees1, and annually contribute almost 40 percent of the U.S. private non-farm output (Petkov, 2016). Small businesses are important because they help stimulate local economies by creating new jobs and bringing new ideas to the market. Between 2007 and 2013, small businesses generated 60 percent of net new jobs.2 Yet, because of their size, small businesses typically face challenges when seeking a key ingredient for small business survival and growth — access to credit. This study predominantly uses public sources of information on U.S. banks to analyze the patterns in small business lending by evaluating aggregate data of depository lending institutions. This report has two updates from previous reports. First, a brief examination of minority depository lending institutions not covered in previous reports is included. Second, the section which typically provides detailed listings and information on all individual lenders is found solely on Advocacy’s webpage in a user-friendly format. In addition, most of the information is presented in a more digestible and visual manner within this report in the form of summary tables and figures. Structure and Coverage. This report discusses the recent developments in the small business credit markets. Changes in loan sizes—under $100K, $100K to $1M, and $1M or less—are apparent in both the Call Report and Community Reinvestment Act (CRA) databases. Findings based on the Call Report are presented first, which include a summary on the lending activities by minority lending institutions. This is followed by findings from CRA data. This report uses four performance measures to gauge how lenders are meeting the credit needs of small businesses:
• Number of loans, • Aggregate lending, • Total asset ratio, and • Total small business loan ratio.
These measures are used in the report to evaluate lending at the national level, and, in the listing online, they are used to help recognize individual lenders investing in small businesses. This information helps both parties since small businesses can save precious time by shopping efficiently for credit, and lenders can learn about the competition in their markets, as well as new investment opportunities.
1This information is based on Statistics of United States Small Businesses (SUSB), which is collected by the Census Bureau with partial funding from the U.S. SBA Office of Advocacy. For more on how this data is used see, “Frequently Asked Questions,” Office of Advocacy, U.S. Small Business Administration, 2016. For research purposes, the SBA’s Office of Advocacy defines small businesses as firms with fewer than 500 employees. 2Ibid
9
This report covers all federal insured depository lending institutions filing Call Reports (savings banks, cooperative banks, savings and loan associations, and commercial banks) with the exception of credit unions and foreign banks. It provides analyses for all small business lenders, but the information available does not make it possible to distinguish SBA-guaranteed lenders. Data years presented range from 2010 to 2015, with analyses mostly for 2013-2015. Geographic coverage includes the 50 states, the District of Columbia, and selected U.S. territories.3 Data. This report is based on the Call Reports from June 2010 through June 2015 and the CRA data for calendar year 2013 and 2014.4 These reports are filed by depository lending institutions with their respective regulatory agencies, and cover two types of small business loans:
• Loans secured by non-farm nonresidential properties, or commercial real estate (CRE) loans, and • Commercial and industrial (C&I) loans.
Data are available for the size of the loan — not for the size of the business, thus loan categories reported by lenders are done in three loan sizes listed below:
• Loans of $250,000 through $1 million • Loans of $100,000 through $250,000 • Loans $100,000 or less5 Additional sizes are: • $1 million and under = small business loans • $100,000 to $1 million 6
Comparison of Call Report and CRA Data While the Call Report and CRA data complement each other, they are not comparable. They provide different kinds of loan information, identified by different locations, for different time periods. The Call Reports measure outstanding loan balances by location of the lender’s headquarters on a quarterly basis, with a reporting year of June to June. The CRA data show loans originated in the state in which they are made during the calendar year. Table A summarizes each source’s characteristics.
3 The territories covered are the Federated States of Micronesia, Guam, Puerto Rico, and the U.S. Virgin Islands. 4 See the Appendix for additional information on these data sources. 5 In previous reports, this was referred to as “micro business loan” which differs from other SBA programs and other industry uses of the term. 6 Previously referred to as “macro business loan.”

10
Table A. Comparison of Call Report and CRA Data in the Small Business Lending Study
Call Report Data CRA Data
Data year 2014 & 2015 2013 & 2014
Loan information provided
Stock of outstanding business loan balances, quarterly
Loans originated and purchased over the calendar year
How loan location is identified
State in which lender’s headquarters is located
State in which the lender made the loan.
Lenders reporting All reporting lenders—depository lending institutions and bank holding companies
Depository lending institutions and bank holding companies with approximately $1 billion or more in assets
These databases are the only publicly available sources of information on the small business lending of individual lending institutions. However, they reflect only the supply of loans provided by federally insured lenders. Small firms have access to other sources of credit, such as their suppliers, finance companies, marketplace lenders, family and friends, and others. To fully understand the small business loan market, reliable loan demand data from traditional lenders, non-bank lenders, and marketplace lenders are needed, which this report does not include. Thus, this report should be cautiously interpreted because there is the tendency to attribute all changes in small business lending solely to lenders’ willingness to extend credit.
Accessing the Data Readers can learn about the banks in their own communities and states by visiting Advocacy’s webpage, where a list of all reporting banks in each state can be found. Detailed tables show state rankings of either the top 10 or the top 10 percent of lenders in each state. Visit Advocacy’s webpage at www.sba.gov/advocacy/small-business-lending-united-states for the full listing.

11
Recent Developments in the Small Business Financial Credit Market
Credit conditions improved in the business loan market, banks continued to recover, and alternative lenders are filling the credit gap. Access to credit is fundamental to a business’s success, survival, and growth. This is even more so for small firms because they have limited access to capital markets due to their size. The tightening of credit markets during the recent financial crisis had an adverse impact on bank-dependent firms such as small businesses. A confluence of factors, including the tightening of credit markets for small business during the crisis, helped propel the emergence of the online marketplace lenders. The online lending marketplace has been growing quite rapidly as alternative lenders (such as online lenders, finance companies, trade credit, etc.,) are playing more active roles in the small business lending market after the financial crisis.7 These lenders have begun to compete with banks by issuing small business loans electronically, with minimal processing time, for a range of loan sizes and terms by using leading-edge technologies and new underwriting methods (Jagtiani, and Lemieux, 2015). According to data from California’s Department of Business Oversight (DBO, 2016), online marketplace lending grew by approximately 700 percent, or $13.6 billion, in four years, from $2.0 billion in 2010 to $15.9 billion in 20148; but it represents a relatively small portion of the credit market for businesses.
The largest small business online lending platform originated less than half a billion in small business credit in 2011, and by 2015 generated roughly $1.9 billion, according to a 2016 Department of the Treasury report that examined the benefits, risks and best practices of online marketplace lending. This amount of small business marketplace lending is small when compared to the value of small business loans originated by lending institutions reporting under the Community Reinvestment Act (CRA) data during the same period—$197.5 billion in 2011 and $213.0 billion in 2014.9
7 Marketplace lending, also known as online lending, generally includes any internet platform that connects lenders and borrowers. See “Small Business Finance Frequently Asked Questions,” Office of Advocacy, U.S. Small Business Administration, 2016. 8California’s Department of Business Oversight conducted a survey on the online lending sector, which contained data from 13 major players in market place lending (Affirm, Avant, Bond Street, CAN Capital, Fundbox, Funding Circle, Kabbage, LendingClub, OnDeck, PayPal, Prosper, SoFi and Square). The data includes both consumer and small business transactions. 9 The CRA data is based on data prepared by George Haynes from Montana State University. See previous reports and Table M within this report.

12
Figure1. Percentage of Businesses in Each Revenue Category Reporting Use of Each Credit Source
Note: Respondents could select multiple options. Source: “2015 Small Business Credit Survey Report on Employer Firms,” Federal Reserve Banks Even so, a recent survey by the Federal Reserve Banks from 2016 shows that 20 percent of all owners of small businesses with employees sought credit from an online lender (Figure 1), with 71 percent being approved for some of the credit.10 While other financing options are now available to small firms, the banking system continues to be the key source of financing for small businesses (FRB 2016; NSBA 2016). The National Small Business Association in 2016, showed that small businesses were more likely to seek financing from a traditional source, such as a bank, compared with non-bank sources. 10 This survey was a combined effort of seven Federal Reserve Banks (Atlanta, Boston, Cleveland, New York, Philadelphia, Richmond, Va., and St. Louis, Mo.), unlike the previous survey which only involved four Federal Reserve Banks. The sample included 26 states, compared with 10 for the previous report.

13
Figure 2. Percent of Respondents Using the Three Types of Traditional Startup Capital
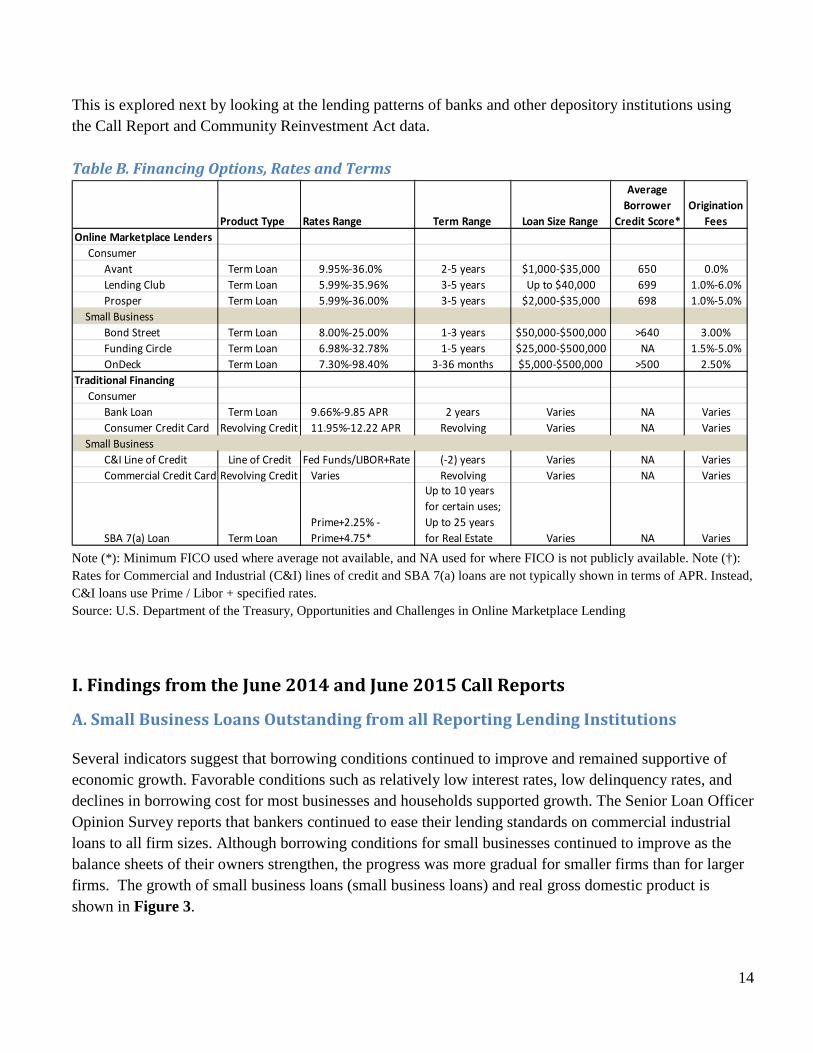
Note: Respondents could select multiple answers. Source: SBA Office of Advocacy from U.S. Census Bureau, Survey of Business Owners 2012 Data from the U.S. Census Bureau indicated that firm size is related to the source of capital that a business is likely to use (SBO 2012). They showed that among small businesses, employer businesses are more likely to use traditional funding than non-employer firms (Figure 2)11. But, the rate at which small businesses apply to online lenders is increasing, according to the Federal Reserve’s Banks survey. In other words, online lenders are filling the gap in the small business credit market, yet these benefits may be costly. For example, the rates charged by online marketplace lenders for a small business loan range from 15 percent for a 36-month peer-to-peer loan, to 45 percent for a traditionally backed loan (Segal 2015). Table B captures financing options and products provided by traditional and online lenders for small businesses and consumers. The growth and survival of U.S. small businesses depends on how depository lending institutions and the credit markets in general are meeting the needs of small firms.
11 Sources listed that are not included in the chart include owner’s personal savings, family and friends, grants, etc. For more details, see American FactFinder, SB0 2012 table SB1200CSCB13.
14
This is explored next by looking at the lending patterns of banks and other depository institutions using the Call Report and Community Reinvestment Act data. Table B. Financing Options, Rates and Terms
Note (*): Minimum FICO used where average not available, and NA used for where FICO is not publicly available. Note (†): Rates for Commercial and Industrial (C&I) lines of credit and SBA 7(a) loans are not typically shown in terms of APR. Instead, C&I loans use Prime / Libor + specified rates. Source: U.S. Department of the Treasury, Opportunities and Challenges in Online Marketplace Lending
Product Type Rates Range Term Range Loan Size Range
Average Borrower
Credit Score*Origination
FeesOnline Marketplace Lenders Consumer Avant Term Loan 9.95%-36.0% 2-5 years $1,000-$35,000 650 0.0% Lending Club Term Loan 5.99%-35.96% 3-5 years Up to $40,000 699 1.0%-6.0% Prosper Term Loan 5.99%-36.00% 3-5 years $2,000-$35,000 698 1.0%-5.0% Small Business Bond Street Term Loan 8.00%-25.00% 1-3 years $50,000-$500,000 >640 3.00% Funding Circle Term Loan 6.98%-32.78% 1-5 years $25,000-$500,000 NA 1.5%-5.0% OnDeck Term Loan 7.30%-98.40% 3-36 months $5,000-$500,000 >500 2.50%Traditional Financing Consumer Bank Loan Term Loan 9.66%-9.85 APR 2 years Varies NA Varies
Consumer Credit Card Revolving Credit 11.95%-12.22 APR Revolving Varies NA Varies Small Business C&I Line of Credit Line of Credit Fed Funds/LIBOR+Rate (-2) years Varies NA Varies Commercial Credit Card Revolving Credit Varies Revolving Varies NA Varies
SBA 7(a) Loan Term LoanPrime+2.25% - Prime+4.75*
Up to 10 years for certain uses; Up to 25 years for Real Estate Varies NA Varies
I. Findings from the June 2014 and June 2015 Call Reports
A. Small Business Loans Outstanding from all Reporting Lending Institutions Several indicators suggest that borrowing conditions continued to improve and remained supportive of economic growth. Favorable conditions such as relatively low interest rates, low delinquency rates, and declines in borrowing cost for most businesses and households supported growth. The Senior Loan Officer Opinion Survey reports that bankers continued to ease their lending standards on commercial industrial loans to all firm sizes. Although borrowing conditions for small businesses continued to improve as the balance sheets of their owners strengthen, the progress was more gradual for smaller firms than for larger firms. The growth of small business loans (small business loans) and real gross domestic product is shown in Figure 3.

15
Figure 3. Percent Change in Small Business Loan Balances and Gross Domestic Product
Note: Real GDP is seasonally adjusted. Source: Small Business Lending, Federal Deposit Insurance Corporation, and Gross Domestic Product, U.S. Department of Commerce, Bureau of Economic Analysis The patterns of lending by depository lending institutions to businesses showed increases in the aggregate number and value of loans from June 2014 to June 2015. This is an improvement over the 2012-2013 periods, when the growth rates for both the number and value of loans were negative. The value of small business outstanding loans ($1 million or less) made by domestic depository lending institutions in 2013, 2014, and 2015 totaled $584.7 billion, $589.8 billion and $599.0 billion, respectively (Tables C & D). This represents an increase of $5.1 billion or 0.9 percent in 2013-2014 compared with a decline of roughly half a percent in the previous year's June 2012-June 2013 period. Small business lending in 2014-2015 was up by $9.3 billion or 1.6 percent from the previous year. The number of small business loans increased steadily between 2013-2015 with each year stronger than the previous, and rose by 5.4 percent during the period (Tables C & D).
16
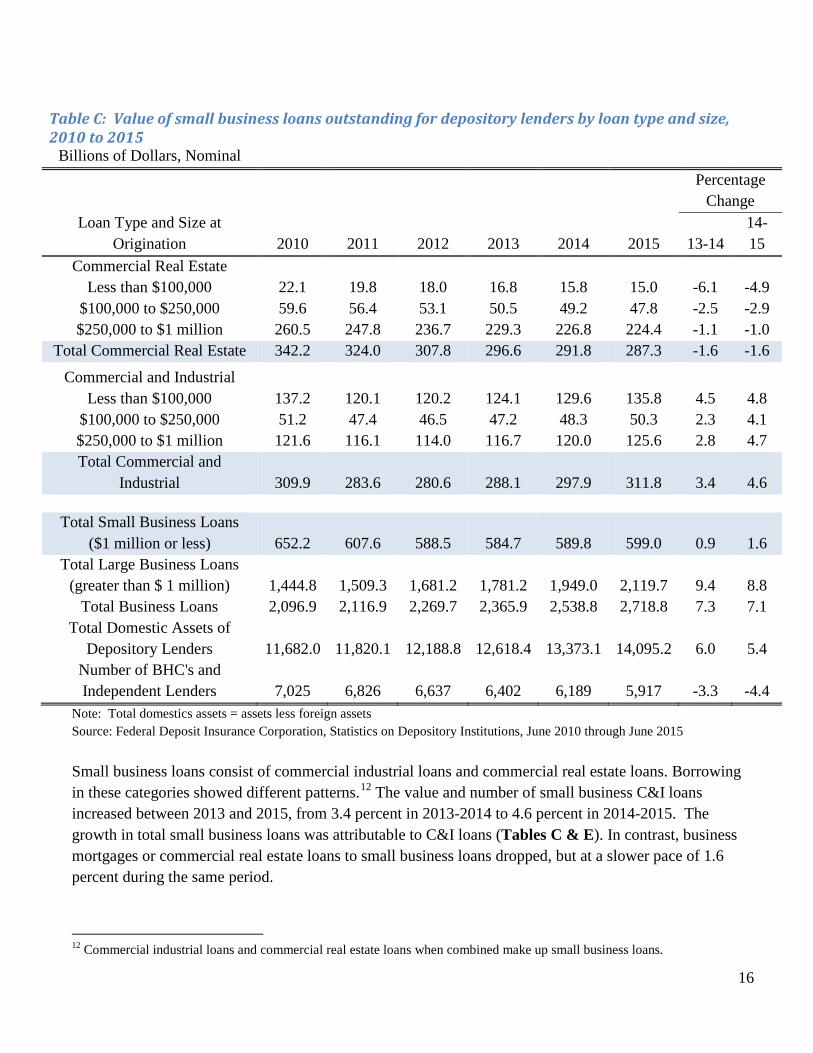
Table C: Value of small business loans outstanding for depository lenders by loan type and size, 2010 to 2015
Billions of Dollars, Nominal
Percentage Change
Loan Type and Size at Origination 2010 2011 2012 2013 2014 2015 13-14
14-15
Commercial Real Estate Less than $100,000 22.1 19.8 18.0 16.8 15.8 15.0 -6.1 -4.9
$100,000 to $250,000 59.6 56.4 53.1 50.5 49.2 47.8 -2.5 -2.9 $250,000 to $1 million 260.5 247.8 236.7 229.3 226.8 224.4 -1.1 -1.0
Total Commercial Real Estate 342.2 324.0 307.8 296.6 291.8 287.3 -1.6 -1.6
Commercial and Industrial Less than $100,000 137.2 120.1 120.2 124.1 129.6 135.8 4.5 4.8
$100,000 to $250,000 51.2 47.4 46.5 47.2 48.3 50.3 2.3 4.1 $250,000 to $1 million 121.6 116.1 114.0 116.7 120.0 125.6 2.8 4.7 Total Commercial and
Industrial 309.9 283.6 280.6 288.1 297.9 311.8 3.4 4.6
Total Small Business Loans ($1 million or less) 652.2 607.6 588.5 584.7 589.8 599.0 0.9 1.6
Total Large Business Loans (greater than $ 1 million) 1,444.8 1,509.3 1,681.2 1,781.2 1,949.0 2,119.7 9.4 8.8
Total Business Loans 2,096.9 2,116.9 2,269.7 2,365.9 2,538.8 2,718.8 7.3 7.1 Total Domestic Assets of
Depository Lenders 11,682.0 11,820.1 12,188.8 12,618.4 13,373.1 14,095.2 6.0 5.4 Number of BHC's and Independent Lenders 7,025 6,826 6,637 6,402 6,189 5,917 -3.3 -4.4
Note: Total domestics assets = assets less foreign assets Source: Federal Deposit Insurance Corporation, Statistics on Depository Institutions, June 2010 through June 2015
Small business loans consist of commercial industrial loans and commercial real estate loans. Borrowing in these categories showed different patterns.12 The value and number of small business C&I loans increased between 2013 and 2015, from 3.4 percent in 2013-2014 to 4.6 percent in 2014-2015. The growth in total small business loans was attributable to C&I loans (Tables C & E). In contrast, business mortgages or commercial real estate loans to small business loans dropped, but at a slower pace of 1.6 percent during the same period.
12 Commercial industrial loans and commercial real estate loans when combined make up small business loans.

17
B. Loan Sizes The combined amount of loans from CRE and C&I in all three sizes ($100K or less, $100K to $250K, and $250K to $1M) reported by lenders in the Call Reports increased between 2013 and 2015. The smallest loans were the most active in the small business credit market; and they had the largest percentage increase of 7.0 percent during this time period. Between 2014 and 2015, the smallest C&I loans represented 43.6 percent of all small C&I loans and 22.7 percent of all small business loans. They had the most increase in the value of loans ($6.2 billion) during this period. On the CRE front, the largest dollar drop was in CRE midsize loans $100K –$250K, which were down about $2.4 billion in 2014 and 2015. They represented just more than 50 percent of the entire decline each year in 2014 and 2015. The largest percentage decline was in the smallest CRE loans, but the rate of decline has been decreasing. The numbers of loans in all loan sizes combined were up between 2013 and 2015, with percentage increases ranging from 2.7 percent for midsized loans to 5.7 percent for the smallest loan size category (Table E). Almost 95 percent of the total number of small business loans are C&I loans.
C. Lending by Size of Lender The lending activity of depository lending institutions varies by lender size. Small business loans outstanding by small lenders with assets of $500 million or less were down in both value and volume while lending by the rest of the lenders increased. Loans made by lenders with assets exceeding $500 million helped offset some of the decline by 5.5 percent or $16.0 billion between 2013 and 2015 (Tables D & F). Large lenders with $10 billion or more continue to dominate the small business loan market with 83 percent of the number of small business loans made by these lenders. Figure 4a lists the five states with the most small business loans outstanding made by large bank holding companies with assets of $10 billion or more in assets. Lenders in these states accounted for over 60 percent of all small business loans outstanding in 2015 made by BHCs with $10 billion or more in assets. Figure 4b shows that these lenders account for almost one-fifth of the total value of the smallest loans outstanding and more than two-thirds of the total value of all small business loans. While small depository lenders experienced declines in small business loans during this period, the average size of loans held by these lenders was roughly 6.5 times more than the amount held by large lenders.

18
Table D: Value of small business loans outstanding by depository lender size, 2010 to 2015 Billions of Dollars, Nominal
Percent Change Lenders by Total Asset Size 2010 2011 2012 2013 2014 2015 13-14 14-15 Less than $100 million 21.9 19.5 17.6 15.8 14.6 12.9 -7.7 -11.7 $100 million to $499.9 million 125.0 116.2 111.0 108.0 105.0 100.0 -2.8 -4.8 $500 million to $999.9 million 62.6 58.4 56.0 55.2 53.5 53.5 -3.0 0.0 $1 billion to $9.9 billion 128.2 124.7 119.8 120.1 125.9 131.7 4.8 4.6 $10 billion to $49.9 billion 62.3 59.5 55.6 58.9 65.3 72.4 10.9 10.8 $50 billion or more 252.4 229.3 228.6 226.6 225.5 228.6 -0.5 1.4 Total Small Business Loans 652.2 607.6 588.5 584.7 589.8 599.0 0.9 1.6
Source: SBA Office of Advocacy, special tabulations of the June 2014 and 2015 Call Reports prepared by George Haynes, Montana State University
Table E: Number of small business loans outstanding for depository lenders by loan type and size, 2010 to 2015 Millions of Loans
Percent Change Loan Type and Size 2010 2011 2012 2013 2014 2015 .13-14 .14-15 Commercial Real Estate
Less than $100,000 0.56 0.47 0.41 0.38 0.36 0.35 -5.22 -3.24 $100,000 to $250,000 0.46 0.43 0.41 0.40 0.39 0.38 -2.67 -1.42 $250,000 to $1 million 0.71 0.60 0.59 0.57 0.57 0.57 -1.01 0.38 Total Commercial Real Estate 1.73 1.50 1.41 1.35 1.31 1.30 -2.68 -1.14
Commercial and Industrial Less than $100,000 19.73 18.97 21.25 20.74 21.20 21.97 2.25 3.60
$100,000 to $250,000 0.51 0.49 0.48 0.48 0.50 0.52 2.34 5.68 $250,000 to $1 million 0.41 0.40 0.39 0.40 0.41 0.43 1.60 6.65 Total Commercial and Industrial 20.66 19.86 22.11 21.62 22.11 22.92 2.24 3.70
Total Small Business Loans ($1 million or less) 22.39 21.36 23.52 22.97 23.42 24.22 1.95 3.43
Source: SBA Office of Advocacy, special tabulations of the June 2014 and 2015 Call Reports prepared by George Haynes, Montana State University

19
Table F: Number of small business loans outstanding by depository lender size, 2010 to 2015 Millions of Loans, Number
Percentage Change
Lenders by Total Asset Size 2010 2011 2012 2013 2014 2015 13-14 14-15 Less than$100 million 0.31 0.28 0.24 0.20 0.19 0.19 -7.17 -1.80 $100 million to $499.9 million 1.23 1.09 1.04 1.00 0.99 0.96 -0.52 -3.73 $500 million to $999.9 million 1.94 1.68 1.56 1.50 1.39 1.43 -7.56 3.10 $1 billion to $9.9 billion 1.15 1.34 1.42 1.38 1.41 1.56 2.41 10.43 $10 million to $49.9 billion 1.55 1.55 1.58 1.72 1.81 1.20 5.06 -33.62 $50 billion or more 16.21 15.41 17.69 17.16 17.62 18.89 2.68 7.16 Total Small Business Loans 22.39 21.36 23.52 22.97 23.42 24.22 1.95 3.43
Note: The dramatic decrease in number of small business loans in the 10B – 49B category in 2015 was because one of these banks moved up from the 10B – 49B to 50B or more category. Given their credit card business, they had about 750,000 loans outstanding (or 63+ percent of loans in the 10B – 49B lender group). Source: SBA Office of Advocacy, special tabulations of the June 2014 and 2015 all Reports prepared by George Haynes, Montana State University

20
Figure 4a. States with Most Small Business Loans Outstanding in 2015 by Large Bank Holding Companies
Note: See Online Appendix Table 1 for bank holding company lenders by state. Source: SBA Office of Advocacy, Call Report Data prepared by George Haynes, Montana State University
Figure 4b. Small Business Loans Outstanding by Bank Size, 2015
Note: See Online Appendix Table 1 for bank holding company lenders by state. Source: SBA Office of Advocacy, Call Report Data prepared by George Haynes, Montana State University

21
D. Small Business Lending Measures: The Total Asset Ratio and Total Small Business Loan Ratio The measures of small business lenders’ performance in this report are based on their small business loans as a percentage of their total assets and total business loans. The ratio of the total amount of small business loans to the lender’s total asset is referred to as the “total asset ratio.”13 The Total Asset Ratio. This ratio represents the percentage of a lender’s assets that is assigned to small business borrowers, with a positive change between periods indicating increased success of a borrower obtaining funds. The trend in Table G shows a steady decline, and the last few years have been no exception. Compared with the previous year, the data suggests that small businesses were less successful in competing with other uses of capital held by these lenders. This was even more so for those borrowers seeking loans in the smallest loan size categories that realized a 3.7 percentage decline for CRE and 2.0 percentage decline for C&I in 2014-2015. During 2013-2015, the total assets ratio declined by 3.5 percent, from 13.7 percent in 2013 to 13.2 percent in 2015.
Table G. Total Asset Ratios, 2010-2015 (value of small business loans outstanding to the value of loan type, percent)
Percentage
Change Loan Type and Size at Origination 2010 2011 2012 2013 2014 2015 13-14 14-15 Commercial Real Estate
Less than $100,000 1.37 1.21 1.13 1.07 1.04 1.00 -3.0 -3.7 $100,000 to $250,000 1.77 1.74 1.66 1.63 1.60 1.56 -1.9 -2.1 $250,000 to $1 million 6.14 6.01 5.82 5.73 5.61 5.47 -2.1 -2.5 Total Commercial Real Estate 9.28 8.97 8.62 8.42 8.24 8.03 -2.2 -2.6
Commercial and Industrial Less than $100,000 2.22 1.99 1.85 1.80 1.79 1.76 -0.2 -2.0
$100,000 to $250,000 1.27 1.21 1.16 1.15 1.14 1.14 -0.4 -0.3 $250,000 to $1 million 2.58 2.47 2.36 2.35 2.32 2.31 -1.0 -0.5 Total Commercial and Industrial 6.06 5.66 5.37 5.29 5.26 5.21 -0.6 -0.9
Total Small Business Loans ($1 million or less) 15.34 14.63 13.99 13.71 13.50 13.24 -1.6 -1.9
Source: SBA Office of Advocacy, special tabulations of the June 2014 and 2015 Call Reports prepared by George Haynes, Montana State University 13 The ratios used in Tables G-J are the mean ratios for all lenders. These ratios are derived by computing the ratio for each lender, then computing the mean for all lenders in each category shown. See the Appendix for additional information.

22
The total assets ratio for bank size shows an inverse relationship in Table H; for example, the largest lenders hold 3 percent of their total assets in small business loans, while the comparable small business loan share for the smallest lenders is roughly 4.3 times that of large lenders at 13.1 percent in 2015. In general, the small business total assets ratio declined by lenders in all sizes categories, but the mega lenders with assets of $50 billion or more had the largest percentage decline during 2013-2015. It is worth noting that although large lenders invest smaller shares of their assets in small business loans, they dominate the small business loan market in the dollar amount of loans they contribute.
Table H. Total Asset Ratio by Lender Size, 2010-2015 (value of small business loans outstanding to the value of lender assets by lender size, percent) Percentage Change Lenders by Total Asset Size 2010 2011 2012 2013 2014 2015 13-14 14-15 Less than$100 million 15.36 14.64 14.09 13.68 13.48 13.11 -1.5 -2.7 $100 million to $499.9 million 16.72 15.94 15.24 14.97 14.77 14.59 -1.3 -1.2 $500 million to $999.9 million 13.75 13.04 12.33 12.34 12.12 12.00 -1.8 -1.0 $1 billion to $9.9 billion 10.24 10.05 9.61 9.54 9.55 9.47 0.1 -0.8 $10 million to $49.9 billion 6.11 5.55 5.28 5.17 5.21 5.24 0.8 0.5 $50 billion or more 4.68 3.75 3.63 3.44 3.29 3.05 -4.1 -7.5
Total Small Business Loans 15.34 14.63 13.99 13.71 13.50 13.24 -1.6 -1.9 Source: SBA Office of Advocacy, special tabulations of the June 2014 and 2015 Call Reports prepared by George Haynes, Montana State University The Total Small Business Loan Ratio. The next gauge of small business performance is the small business loan ratio, which shows the total small business share of total business loans. Tables I and J provide information on this ratio by loan size and lender asset size respectively. This ratio indicates how well small business borrowers are competing for business loans against their counterparts. This ratio has continuously declined for both total CRE and C&I loans. The change in the ratio from 2013-2015 shows declines in all loan sizes excluding C&I loans in the two larger loan size categories, which remained stable during this period. This suggests that small business borrowers seeking larger size C&I loans are starting to have a better outcome in competing for business loans with larger firms. Lenders in all asset size categories had declines in their small business loan ratios. Large lenders with $10 billion or more in assets combined hold about 40 percent of their business loans with small businesses, while small lenders hold twice as much (Table J). In terms of percentage change, lenders in the $10-$49 billion in assets had the most declines in 2015, while mega lenders showed small improvements that helped offset the overall declines with a 2.7 percent increase.

23
Table I. Total Small Business Loan Ratio by Loan Type and Size, 2010-2015 Ratio (percent of total business loans outstanding)
Percentage Change
Loan Type and Size at Origination 2010 2011 2012 2013 2014 2015 13-14 14-15 Commercial Real Estate
Less than $100,000 9.04 8.26 8.26 7.89 7.63 7.29 -3.3 -4.5 $100,000 to $250,000 8.43 8.60 8.62 8.49 8.34 8.20 -1.7 -1.7 $250,000 to $1 million 23.92 24.01 24.04 23.75 23.26 22.76 -2.1 -2.1 Total Commercial Real Estate 41.38 40.87 40.92 40.13 39.24 38.25 -2.2 -2.5
Commercial and Industrial Less than $100,000 13.32 12.37 12.15 11.83 11.78 11.50 -0.4 -2.4
$100,000 to $250,000 5.39 5.38 5.41 5.43 5.45 5.47 0.4 0.4 $250,000 to $1 million 9.75 9.73 9.64 9.64 9.58 9.65 -0.6 0.8 Total Commercial and Industrial 28.46 27.48 27.20 26.89 26.80 26.62 -0.3 -0.7
Total Small Business Loans ($1 million or less) 69.85 68.34 68.12 67.03 66.04 64.87 -1.5 -1.8
Source: SBA Office of Advocacy, special tabulations of the June 2014 and 2015 Call Reports prepared by George Haynes, Montana State University
Table J. Total Small Business Loan Ratio by Lender Size, 2010-2015 Ratio (percent of total business loans outstanding)
Percentage
Change Lenders by Total Asset Size 2010 2011 2012 2013 2014 2015 13-14 14-15 Less than$100 million 88.79 88.21 89.45 88.62 88.39 88.05 -0.3 -0.4 $100 million to $499.9 million 67.00 65.62 65.62 65.18 64.65 64.29 -0.8 -0.6 $500 million to $999.9 million 49.34 47.90 46.66 46.16 45.86 44.82 -0.6 -2.3 $1 billion to $9.9 billion 37.50 36.86 36.48 35.31 34.05 32.74 -3.6 -3.9 $10 million to $49.9 billion 27.12 25.13 25.68 25.03 24.43 21.68 -2.4 -11.2 $50 billion or more 26.71 23.69 22.43 20.77 19.73 20.26 -5.0 2.7
Total Small Business Loans 69.84 68.34 68.12 67.03 66.04 64.87 -1.5 -1.8 Source: SBA Office of Advocacy, special tabulations of the June 2014 and 2015 Call Reports prepared by George Haynes, Montana State University

24
E. All Small Loans Outstanding from Multibillion Dollar Lending Institutions The share of small business loans and total assets by type of loan and lender size is captured in Table K. The largest lenders, those with assets exceeding $10 billion, held 80 percent of the industry’s assets and provided half of the total value of small business loans in 2015. Yet, these giants numbered 104 lenders and represented about 2 percent of the 5,917 consolidated reporting institutions during that year. Their small business loan share has increased since 2010 by a mere 1.9 percentage points, from 48.3 percent to 50.2 percent in 2015. The small business loans of these large lenders are concentrated in the smallest size of commercial and industrial loans, where they secure almost 78 percent of the market share. To get a better perspective of other players within the small business credit market, another aspect of the Call Report is explored, examining the contribution of Minority Depository Institutions (MDIs) in small business lending. Table K: Share of Business Loans and Total Assets by Size of Depository Institution, 2015 Total Asset Size of the Lending Institution or Bank Holding Company
Year and Loans by Size >50B 10B-50B >10B
1B-10B
500M-1B
100M-500M <100M Total
2015 (percentage) Total Assets of the Institution 70.1 10.2 80.2 10.9 3.2 5.0 0.7 100.0
Commercial Real Estate Less than $100,000 11.8 6.6 18.4 21.1 12.3 37.5 10.6 100.0
$100,000 to $250,000 20.6 10.7 31.3 27.6 12.4 25.5 3.2 100.0 $250,000 to $1 million 26.1 12.2 38.3 28.1 11.4 20.3 1.9 100.0
Commercial and Industrial Less than $100,000 71.2 6.7 77.9 8.9 3.9 7.5 1.8 100.0
$100,000 to $250,000 34.8 15.6 50.3 22.1 8.6 16.7 2.3 100.0 $250,000 to $1 million 35.2 17.4 52.6 23.1 8.4 14.2 1.6 100.0
Total Small Business Loans 38.2 12.1 50.2 22.0 8.9 16.7 2.2 100.0 Total Large Business Loans 61.2 14.7 75.9 16.2 3.7 4.0 0.1 100.0 Total Business Loans 56.1 14.1 70.3 17.5 4.9 6.8 0.6 100.0 Number of Institutions 37 67 104 565 646 2,988 1,614 5,917
Source: SBA Office of Advocacy, special tabulations of the June 2014 and 2015 Call Reports prepared by George Haynes, Montana State University
F. Small Business Loans and Minority Lending Institutions Minority Depository Lending institutions play an important role in providing access to credit in the communities they serve. The number of MDIs over the years has continuously declined, a trend similar to

25
that of all other depository lending institutions.14 Of the 5,917 bank holding companies and independent lenders reporting in 2015, 163 or 2.8 percent were designated as minority owned institutions. These minority lenders represented 1.3 percent ($183 billion) of the industry’s total assets, and about 2.5 percent (or $13.8 billion) of all small business loans.
Figure 5. Percent Share of Small Business Outstanding Loans by MDIs, 2015
Source: SBA, Office of Advocacy, based on FDIC data prepared by George Haynes from Montana State University Analysis of MDIs shows that Asian/Pacific Islanders own about half of all MDI lending institutions followed by Hispanic Americans, who owned over a fifth of these institutions. These two groups dominate the small business lending MDI market, and hold nearly 90 percent of the value of outstanding small business loans (Figure 5). The number of small business loans outstanding by MDIs increased during 2013-2015 by 1.7 percent while the dollar amount of these loans fell by 4.6 percent during this period. A large share of a minority lender’s small business lending portfolio is in commercial real estate loans. Minority lenders held 70 percent ($9.7 billion) of their small business loans in commercial real estate (CRE) loans, but compared with the entire small business CRE loan market they represented less than 5 percent of these loans in 2015. C&I loans represented about a third or $4.1 billion of MDI small business loans during this period (Table L). Minority lenders hold about the same percentage (around 20 percent) of their total business portfolio in small businesses loans, which is similar to non-MDI depository lenders
14 MDIs are defined as a federally insured depository institutions where 51 percent or more of the voting stock is owned by minority individuals, but to also allows insured depository institutions to choose MDI status if a majority of the board of directors is made up of minority individuals and the community that the institution serves is predominantly minority. Minority is as defined African-American, Asian and Pacific Islander-American, Hispanic-American, Native American, or Multi-racial American. See https://www.fdic.gov/regulations/resources/minority/MDI_Definition.html or https://www.fdic.gov/regulations/resources/minority/MDI.html.

26
(22 percent) — a percent which has gradually declined in the last 5 years for both groups. The percent change for the value of small business loans outstanding declined between 2014 and 2015, but remained positive for the smallest loans and for those from $100K-$250K.
Table L. Value of Business Loans Outstanding for Minority Depository Lenders, 2011-2015 Billions of Dollars, Nominal
Percentage change
Loan Type and Size at Origination 2011 2012 2013 2014 2015 13-14 14 -15 Less than $100,000 1.8 1.8 0.9 0.8 0.8 -15.0 1.0 $100,000 to $250,000 2.9 2.8 2.1 1.9 1.9 -8.1 0.2 $250,000 to $1 million 14.5 14.8 11.5 11.7 11.1 1.6 -4.8
Total Commercial Real Estate 12.9 13.0 10.1 9.7 9.7 -3.9 -0.7 Total Commercial and Industrial 6.4 6.5 4.4 4.6 4.1 6.4 -10.4 Total Small Business Loans ($1 million or less) 19.3 19.5 14.5 14.4 13.8 -0.8 -3.9
Total Large Business Loans (greater than $ 1 million) 56.7 61.0 48.3 51.2 54.9 6.0 7.3 Total Business Loans 75.9 80.5 62.8 65.6 68.8 4.5 4.9 Total Assets of Depository Lenders 229.6 232.1 168.9 174.4 183.3 3.3 5.1 Number of BHC's and Independent Lenders 182 177 171 168 163 -1.8 -3.0
Source: SBA Office of Advocacy, special tabulations of the June 2014 and 2015 Call Reports prepared by George Haynes, Montana State University Nearly 90 percent of minority depository lenders are small BHCs or independent lenders with $1 billion or less in total assets, and they account for less than 40 percent of total small business loans. The largest minority lenders, with assets exceeding $1 billion, hold 79 percent of the total MDI assets and represent over 60 percent of the MDI small business loans outstanding (Table M). Of the total 163 MDI institutions, only 17 or 10.4 percent of bank holding company or independent banks submitted reports to the Community Reinvestment Act (CRA) in 2014. Thus, analysis for MDI lenders in the CRA is not presented here due to the small number of MDIs reporting.
Table M: Share of Business Loans and Total Assets by Minority Lender Size, 2015
Total Asset Size of the Lending Institution or Bank Holding
Company Year and Loans by Size >50B 10B- >10B 1B- 500M-1B 100M- <100M Total

27
50B 10B 500M 2015 (percentage)
Total Assets of the Institution 0 54.0 54.0 25.0 9.0 10.9 1.2 100
Total Small Business Loans 0 30.4 30.4 29.8 13.0 22.9 3.8 100 Total Large Business Loans 0 51.7 51.7 29.3 9.4 9.0 0.5 100 Total Business Loans 0 47.4 47.4 29.4 10.2 11.8 1.2 100
Number of Institutions 0 5 5 14 23 85 36 163 Source SBA Office of Advocacy, special tabulations of the June 2014 and 2015 Call Reports prepared by George Haynes, Montana State University
II. Findings from 2014 CRA Reporting Institutions
A. Small Business Lending by CRA Reporting Lending Institutions This section uses the Community Reinvestment Act (CRA) data to assess lending activity of depository institutions during a calendar year. CRA information is categorized by the location of the borrower instead of the location where the bank is headquartered. This data presents an indication of the geographic activities of small business lending in an area, but it does not specify the amount or represent the overall credit demand for that area. CRA uses the same definition as the Call Report for a small business (loans of $1 million or less). Only lending depository institutions with assets of $1 billion or more are required to report CRA information, so smaller banks are not identified in these data. Readers should be cautious about deriving conclusions solely using the CRA data as differences in loan volume across areas may reflect differences in local demand for credit.15 In addition, CRA data contain information on loans to businesses with annual revenues of $1 million or less. This measure provides a way for separating small business borrowers from their counterparts, and indicates that 34.6 percent of the value of all CRA small business loans was extended to firms with a $1 million or less in revenues.16 The corresponding percentage for the number of loans was 45.6 percent. CRA data are composed primarily of loan originations, and loan purchases are normally a small share (less than 5 percent) of the reported activity. Both numbers are combined and reported in the two tables (Tables N and O) showing the lending activities of small business lenders in the CRA. Table N compares
15 See notes from the FFIEC at https://www.ffiec.gov/hmcrpr/cra_fs14.htm. 16 For details, see https://www.ffiec.gov/hmcrpr/cra15tables1-5.pdf#table1.

28
the Call Report data with CRA against all lenders required to report under the CRA, while Table O shows the dollar value and number of loans made by lenders in the CRA program.
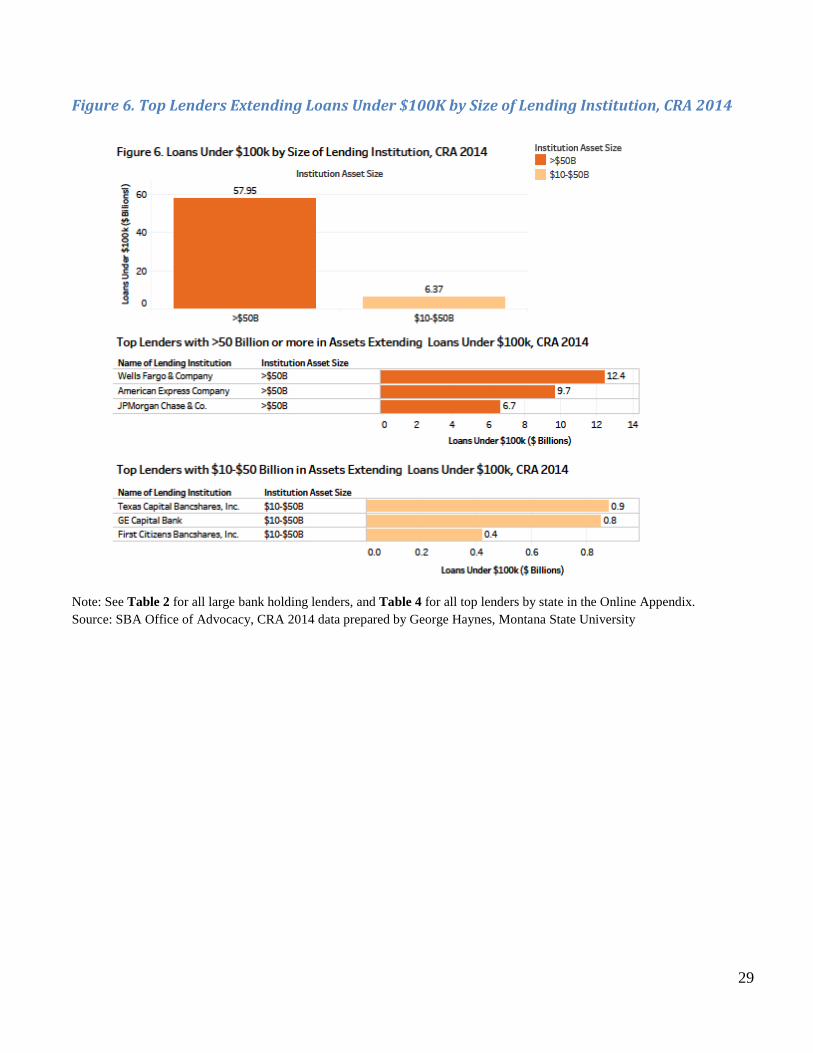
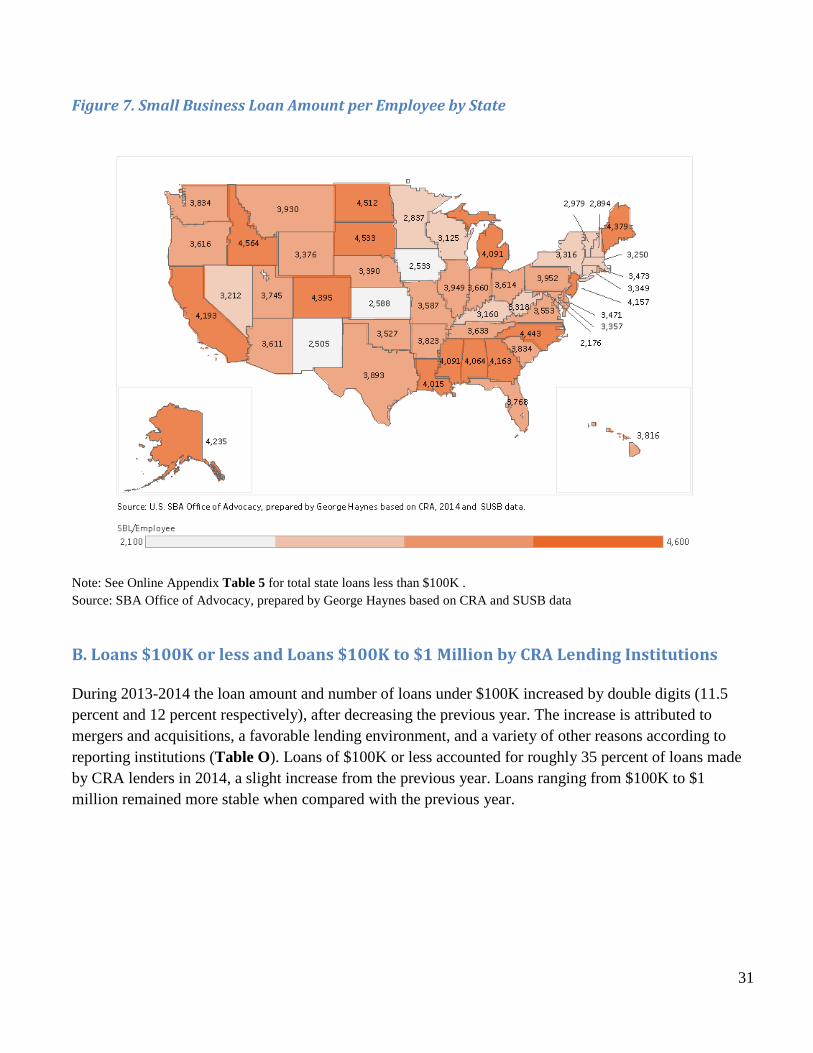
A total of 633 lenders submitted CRA reports in 2014. These reporting institutions were actively involved in issuing loans of$100K or less, where they accounted for 81 percent of the smallest loans. The analysis from the Call Reports shows that lenders in the CRA program account for roughly 70 percent of the value of small business loans outstanding, and 85 percent of total domestic assets in the industry (Table N). These institutions extended a total of $213 billion in 5.6 million small business loans under $1 million compared with $206 billion for 5.0 million loans the previous year (Table O). Figure 6 shows the top six large lenders making new loans in the smallest size category (loans $100K or less). These lenders made about 30 percent of all CRA loans under $100K, and 24.2 percent of total small business loans in 2014. The value of small business loans per small business employee by state is shown in Figure 7. This amount ranges roughly from $2,100 to $4,600.
29
Figure 6. Top Lenders Extending Loans Under $100K by Size of Lending Institution, CRA 2014
Note: See Table 2 for all large bank holding lenders, and Table 4 for all top lenders by state in the Online Appendix. Source: SBA Office of Advocacy, CRA 2014 data prepared by George Haynes, Montana State University

30
Table N. Comparison of Assets and Business Loans of Depository Lending Institutions
Call Report Information Percentage of Call Report
Institutions
(Loans and Assets in Billions of Dollars)
Submitting CRA Information
June 2015 December 2014
Description All Institutions CRA Institutions 2014 2013 2012 2011 2010 Small Business Loans
Less than $100,000 150.8 122.4
81 79 76 76 88 $100,000 to $1 million 448.2 298.5
67 66 66 63 69
Total Small Business Loans 599.0 421.0
70 69 68 66 73
Total Business Loans 2,973.8 2,322.1
85 86 81 73 73 Total Assets, June 2015 14,094.8 11,980.6
85 85 80 84 82
Number of Lending Institutions 5,917 633
Source: SBA Office of Advocacy, special tabulations of the June 2014 and 2015 Call Reports prepared by George Haynes, Montana State University
Table O. Value and Number of Loan Originations and Purchases by CRA Reporting Institutions, 2012 to 2014 (dollar values in billions, number in millions)
Percent Change
Loan Size and Assets 2012 2013 2014 12-13 13-14 Value of Small Business Loans
Less than $100,000 68.4 66.0 73.6
-3.6 11.5 $100,000 to $1 million 137.4 139.8 139.4
1.7 -0.3
Total Value of Small Business Loans 205.9 205.8 213.0 0.0 3.5
Number of Small Business Loans Less than $100,000 5.5 4.6 5.2
-16.3 13.0
$100,000 to $1 million 0.4 0.4 0.4
1.4 1.0 Total Number of Small Business Loans 5.9 5.0 5.6 -15.2 12.0
Number of Lending Institutions (BHC's and Independents) 678 652 633 -3.8 -2.9
Source: SBA Office of Advocacy, special tabulations of the CRA reports prepared by George Haynes, Montana State University
31
Figure 7. Small Business Loan Amount per Employee by State
Note: See Online Appendix Table 5 for total state loans less than $100K . Source: SBA Office of Advocacy, prepared by George Haynes based on CRA and SUSB data
B. Loans $100K or less and Loans $100K to $1 Million by CRA Lending Institutions During 2013-2014 the loan amount and number of loans under $100K increased by double digits (11.5 percent and 12 percent respectively), after decreasing the previous year. The increase is attributed to mergers and acquisitions, a favorable lending environment, and a variety of other reasons according to reporting institutions (Table O). Loans of $100K or less accounted for roughly 35 percent of loans made by CRA lenders in 2014, a slight increase from the previous year. Loans ranging from $100K to $1 million remained more stable when compared with the previous year.

32
Conclusion
The small business credit market is undergoing a transformation as marketplace lenders are providing traditional products and services to small businesses. Marketplace lenders are gaining share of the small business credit market. Nonetheless, traditional lenders continue to hold the largest small business market share. Data from both the Call Reports and CRA for the last few years confirm that the value of small business lending is improving. The Call Reports show that increases in small business C&I loans helped offset the decline in small CRE loans. Meanwhile, a review of both databases on the volume of loans yielded mixed results. For example, the number of loans increased between 2010 and 2014/2015 for the CRA and the Call Report. But further analysis shows that the average small business loan size has gradually declined between these time periods for both databases. The CRA data shows a difference in the average loan of roughly $3,400 between 2010 and 2014, whilst the Call Reports shows a slightly higher drop of approximately $3,900 between 2010 and 2014, and even higher between 2010 and 2015. When examining depository lending institutions owned by minorities, the analysis is dominated by lending institutions owned by Asian and Pacific Islanders or Hispanic Americans. These two groups hold a large portion of the value of outstanding small business loans held by MDIs. MDIs also maintain a high concentration of CRE loans in their small business lending portfolios. In general, MDI lenders hold a relatively small percentage of total small business loans—2.3 percent— and their share has been declining since 2011 when MDIs held 3.2 percent of the small business loans. Even though there are other sources of financial capital, the share of small business loans held by these depository lenders is substantially lower than the share of small businesses owned by minorities. The lack of minority ownership in depository institutions may contribute to the lack of access to credit by minority-owned small businesses. Overall, both the Call Report and CRA data show that the downward pressure on small business lending is easing. The largest lenders in general invest much smaller proportions of their assets in small business loans, but they dominate the market in terms of the amount of loan value they provide.
Data Sources and Limitations
Data Sources
Data for this report are compiled by the three federal banking agency members of the Federal Financial Institutions Examination Council (FFIEC): the Board of Governors of the Federal Reserve System, the Federal Deposit Insurance Corporation, and the Office of the Comptroller of the Currency. The report uses Call Report data from the FDIC website http://www2.fdic.gov/sdi/main.asp and Community Reinvestment Act (CRA) data from the FFIEC tabulated for the Office of Advocacy by George Haynes, Ph.D, of Montana State University. See www.ffiec.gov/cra/craflatfiles.htm for CRA data.

33
The Call Reports, officially the Consolidated Reports of Condition and Income, are quarterly reports filed by financial institutions with their appropriate depository regulators. Call Reports provide detailed information on the current status of a financial institution. The Community Reinvestment Act, enacted in 1977, was designed to encourage depository institutions to meet the credit needs of the local communities from which they obtain deposited funds. CRA data are important for understanding small business lending activities by lenders and bank holding companies in a given state. These data show activities of local reporting depository lenders, including large lenders that have a local presence in a state or territory, but are headquartered out of the state. The criteria for CRA lenders filing the reports changed in 2005. For more information, see www.federalreserve.gov/newsevents/press/bcreg/20081217a.htm and www.ffiec.gov/cra/reporter.htm. For detailed information on loan originations and purchases, visit the CRA reporting program at https://www.ffiec.gov/cra/default.htm.
Data Limitations
The Call Report and CRA data provide a useful look at small loans held by all depository institutions, but the picture remains incomplete. On the demand side, the Call Report and CRA data do not provide information on the personal or demographic characteristics of the borrowers, or characteristics of the businesses (such as employment or sales data, income or balance sheet information). Thus, these statistics do not shed light on the demand for financial capital by small business owners. The Call Report and CRA data provide information on the aggregate value and number of loans originated for $1 million or less, including those secured by nonfarm, nonresidential property and commercial and industrial loans. The data do not provide information about whether the loan is a line of credit or an asset-backed loan (such as a capital lease, vehicle, or equipment loan). Small and large firm lending is defined here by the size of the loan; however, there may be some overlap, as some small firms may have originated loans of more than $1 million and some large businesses may have originated loans of less than $1 million. Call Report data likely underestimate the loans originated with larger lenders because these lenders are more likely to securitize loans with SBA loan guarantees; hence, only the unguaranteed portion of the loan will still be reported by the lending institution. Smaller institutions are more likely to hold the entire small business loan in house, even if the loan has an SBA loan guarantee attached.
34
Household assets are often pledged against the debt of the business, and business and household financial assets occasionally are intertwined. Hence, a complete picture of the financial condition of small businesses requires a careful review of income statement and balance sheet information for both the household and the business. Finally, the CRA data provide useful information on current lending primarily for larger depository lenders required to submit CRA reports. While the current size threshold at which lenders must submit a CRA report is total assets of just more than $1 billion, the CRA data set includes lenders with total assets of less than $1 billion. CRA data include originations and purchases of small business loans. Originations are new loans or extensions of lines of credit and purchases are loans purchased from another lending institution in the current year. For more information about the limitations of CRA data, see “A Guide to CRA Data Collection and Reporting,” www.ffiec.gov/cra/guide.htm, and for other limitations of Call Report data, see the “Disclaimer and Notes” section of the FDIC webpage, www2.fdic.gov/sdi/main.asp.
Methodology The data obtained from the Federal Reserve System are linked to the FDIC’s Call report by a common identifier. The BHCs and Independent institutions along with other variables are generated. All foreign banks are excluded, and the data is segmented and aggregated into different bank categories for analysis. The CRA data is then generated. Text Tables G through J employ the total assets ratios (ratios of small business loans to total assets) and the total business loan ratios (ratios of small business loans to total business loans), which are the mean ratios for all lenders. These ratios are derived by computing the ratio for each lender, then computing the mean for all lenders in each category shown.

35
References California Department of Business Oversight, 2016. “Survey of Online Consumer and Small Business Financing Companies–Jan. 1, 2010-June 30, 2015.” http://www.dbo.ca.gov/Press/press_releases/2016/Survey%20Response%20Summary%20Report%2004-08-16.pdf Census Bureau. Survey of Business Owners, 2012. https://factfinder.census.gov/faces/nav/jsf/pages/index.xhtml Department of the Treasury, 2016. “Opportunities and Challenges in Online Marketplace Lending.” https://www.treasury.gov/connect/blog/Documents/Opportunities_and_Challenges_in_Online_Marketplace_Lending_white_paper.pdf Federal Financial Institutions Examination Council, 2014. “Findings from Analysis of Nationwide Summary Statistics for 2013 Community Reinvestment Act Data Fact Sheet (August 2014).” https://www.ffiec.gov/hmcrpr/cra_fs15.htm Federal Reserve Banks, 2016. “2015 Small Business Credit Survey Report on Employer Firms, Federal Reserve banks of Atlanta, Boston, Cleveland, New York, Philadelphia, Richmond, and St. Louis.” www.newyorkfed.org/medialibrary/media/smallbusiness/2015/Report-SBCS-2015.pdf Jagtiani, Julapa and Lemieux Catharine, 2015. “Small Business Lending: Challenges and Opportunities for Community Banks Before, During and After the Financial Crisis.” Paper presented at the Annual Meeting of the Federal Reserve/Conference of State Bank Supervisors Community Banking Research and Policy Conference, St. Louis, Tenn., Sept. 30-Oct., 1. https://www.communitybanking.org/research National Small Business Association, 2016. “2015 End Year Economic Report.” http://www.nsba.biz/wp-content/uploads/2016/02/Year-End-Economic-Report-2015.pdf Petkov, Ivan. 2016. “Small Business Lending and the Bank-Branch Network.” Social Science Research Network Working Paper. https://papers.ssrn.com/sol3/papers.cfm?abstract_id=2754138 Segal, Miriam, 2015. “Peer-to-Peer Lending: A Financing Alternative for Small Businesses.” U.S. Small Business Administration, Office of Advocacy, Issue Brief No.10. https://www.sba.gov/sites/default/files/advocacy/Issue-Brief-10-P2P-Lending_0.pdf U.S. Small Business Administration, Office of Advocacy, 2016. “Small Business Finance Frequently Asked Questions,” https://www.sba.gov/sites/default/files/Finance-FAQ-2016_WEB.pdf and “Small Business Frequently Asked Questions,” https://www.sba.gov/sites/default/files/advocacy/SB-FAQ-2016_WEB.pdf