smart environmental monitoring and assessment technologies
TRANSCRIPT

sensors
Article
Smart Environmental Monitoring and AssessmentTechnologies (SEMAT)mdashA New Paradigm forLow-Cost Remote AquaticEnvironmental Monitoring
Jarrod Trevathan 1 and Ron Johnstone 2
1 School of Information and Communication Technology Griffith UniversityMeadowbrook Logan 4131 Australia
2 School of Earth and Environmental Science University of Queensland St Lucia Brisbane 4067 Australiarjohnstoneuqeduau
Correspondence jtrevathangriffitheduau Tel +61-07-338-21293
Received 14 May 2018 Accepted 10 July 2018 Published 12 July 2018
Abstract Expense and the logistical difficulties with deploying scientific monitoring equipment arethe biggest limitations to undertaking large scale monitoring of aquatic environments The SmartEnvironmental Monitoring and Assessment Technologies (SEMAT) project is aimed at addressingthis problem by creating an open standard for low-cost near real-time remote aquatic environmentalmonitoring systems This paper presents the latest refinement of the SEMAT system in-line with theevolution of existing technologies inexpensive sensors and environmental monitoring expectationsWe provide a systems analysis and design of the SEMAT remote monitoring units and the back-enddata management system The systemrsquos value is augmented through a unique e-waste recycling andrepurposing model which engageseducates the community in the production of the SEMAT unitsusing social enterprise SEMAT serves as an open standard for the community to innovate around tofurther the state of play with low-cost environmental monitoring The latest SEMAT units have beentrialled in a peri-urban lake setting and the results demonstrate the systemrsquos capabilities to provideongoing data in near real-time to validate an environmental model of the study site
Keywords environmental monitoring social enterprise open source technologies internet of thingswireless sensor networks low-cost sensors
1 Introduction
With the continued urbanization of natural habitats the management of precious waterways inand around cities is of paramount importance In addition to the necessity for supplies of potable waterin source catchments there is also the need to ensure that water bodies associated with infrastructureand areas of habitation do not represent a pollutant or health risk to the associated communities [1]
The traditional periodic or episodic monitoring of these waters is increasingly becominginsufficient due to changes in licensing needs for industry and the need for improved predictivecapacity for risk assessment and management Concomitantly environmental managers areprogressively seeking to better understand the dynamic and complex interactions of hydrologicalprocesses and human influences so that they are able to effectively act in a timely manner andmeet community safety expectations As noted in a number of reviews [2ndash4] traditional manual andmany technical monitoring systems continue to be cost prohibitive and require human resourcesthat are often limited Accordingly the spatial and temporal scope of the data collected is similarlylimited Subsequently there continues to be a need for cheaper cost effective monitoring systems
Sensors 2018 18 2248 doi103390s18072248 wwwmdpicomjournalsensors
Sensors 2018 18 2248 2 of 23
capable of delivering real-time information suited to the response requirements of current and futuremanagement agencies
In 2009 the Smart Environmental Monitoring and Assessment Technologies (SEMAT) project [5ndash8] wasconceived SEMAT is an initiative to develop low-cost environmental monitoring systems for aquaticenvironments that can collect data remotely in near real-time The core project aim was to dramaticallyreduce the cost of such systems using existing commercially available ldquooff the shelf rdquo technologies [9]By doing this the intent was to allow managers to increase both the temporal and spatial resolutionof data collection and therefore meet the need to more accurately react to events and also betterdefine the functional attributes of the environment being managed This improved data collectionwould also allow for the development and more accurate validation of predictive models used tounderpin decision-making
The initial SEMAT project clearly demonstrated that a low-cost approach to environmentalmonitoring is indeed possible and that it could deliver the levels of accuracy and system performancerequired by keystone agencies consulted at the time The system was benchmarked throughdeployments at Moreton Bay and Heron Island in Queensland Australia to investigate hazardous algalblooms [278] Since these deployments the SEMAT technology has continued to evolve becomingsmaller and more powerful (in line with Moorersquos Law) Furthermore the push towards programmableelectronics has reduced the breadth of skillsets required to develop such environmental monitoringsystems increasing the access to this type of technology to a wider stakeholder community [910]Furthermore the increasing need to reduce environmental impacts from such technologies and to lessenelectronic waste has driven systems development to consider the use of up-cycled and re-purposedcomponents to reduce waste to landfill [11] This has particular relevance for improving the uptakeof such technologies in poorer countries where e-waste solutions and the need for cheap monitoringsolutions co-exist
This paper discusses a new community engagement paradigm for the development of low-costenvironmental monitoring systems and presents the latest developments for the SEMAT projectfrom a physical and technological perspective We review and refine the key goals for inexpensiveaquatic environmental monitoring analyse the core hardware and software systems and present areproducible design for SEMAT environmental monitoring buoys Furthermore we discuss a newapproach to production that directly aims to reduce the environmental footprint of the technology andalso enhances the social and economic gains from its production and use
The deployment used to test and validate the latest SEMAT system was a lake subject to humanand natural influences typical of the operational landscape for many end-users of the technologyThe range of impacts included polluted water inputs from a nearby motorway car park golf courseand residential properties as well as disturbance by aquatic birds changing water levels and intenseweather events The field test demonstrates that the latest SEMAT buoys achieve the stated goals andthe system is ready to be deployed on a larger scale across wetlands creeks rivers and constructedwater bodies such as water retention basins and aquaculture facilities
This paper is structured as follows Section 2 outlines the related work SEMATrsquos revisedrefocused design goals and describes a new community engagement paradigm for developing low-costremote aquatic monitoring systems Section 3 proposes the SEMAT environmental monitoring openstandard Section 4 presents the results from a field validation deployment in a peri-urban lakeand Section 5 provides some concluding remarks and avenues for future work
2 Developing Low-Cost Remote Aquatic Environmental Monitoring Systems
21 Problem Motivation and Related Work
Expense is the most limiting factor for undertaking aquatic environmental monitoring studiesCurrent approaches involve the use of expensive proprietary devices or human involvement to eithermanually take water samples over a period of time or to physically deploy logging devices which mustbe later retrieved These are all costly and time consuming Expensive proprietary devices greatly limit
Sensors 2018 18 2248 3 of 23
the number of devices that can be deployed and often also involve additional infrastructure to allowfor communication and exchange In the latter cases a logger may have failed (destroying its data)without any indication of its condition until its retrieval (perhaps after several months of deployment)and manually collected data by sampling is time limited or snap shot with some values not beingknown until well after the event Apart from leading to fragmented data sets these approaches providelimited opportunity to react to events as they are unfolding preventing proactive actions to limit theeffects that might be realized in the field
The ability to monitor an aquatic environment remotely and in near real-time (ie 5ndash15 minintervals) is an extremely useful and powerful tool [12] Not only does this reduce the amount oftime humans must spend out in the field (with the associated dangers and costs) but it also allowsenvironmental models to be updated dynamically as new data is received This can empower decisionmakers by informing them of the most appropriate actions to take depending on the phenomenonbeing studied
Table 1 Research-Based Water Quality Monitoring Initiatives
Research Initiative Location
IMOS (Integrated Marine Observing System) [13] Tasmania AustraliaGBROOS (Great Barrier Reef Oceanic Observation System) [14] Great Barrier Reef Queensland Australia
LakeNet [15] St Maryrsquos Lake USAOceanSense [16] Coastal waters of China
Klimat [17] Baltic Sea SwedenSmartCoast [18] River Lee Cork UK
ReCON (Real-time Coastal Observation Network) [19] Lakes Michigan Huron Erie USAGLUCOS (Great Lakes Urban Coastal Observing System) [20] Lake Michigan USA
Over the last decade this capability has become highly sought after and several major projectshave been initiated using Wireless Sensor Network (WSN) [2122] and Internet of Things (IoT) [23]technologies Table 1 presents some examples of research initiatives for water quality monitoringSuch projects typically involved large government organizations significant amounts of funding andsubstantial human resources to realize Alternately other projects were one-off initiatives by researchinstitutions and the projects have since concluded many years ago with no further advancement onthe state-of-the-art While these initiatives were noble in their aspirations expense again became themost significant limiting factor Accordingly the cost of an environmental monitoring unit prohibitedhow many of the units that could be deployed and therefore greatly compromised the spatial coveragethat could be achieved in data collection From an environmental modelling perspective and the needto identify change at multiple scales the level of data acquisition that these initiatives were able toachieve was still quite limiting
Several proprietary products have been made commercially available through scientificinstrumentation companies Table 2 provides some examples of these products While highly precisethese approaches tend to be ridged and costly in the sense that the end user of the system canonly use the equipment in the way determined by the vendor and the capital investment is highFurthermore the end user is reliant on the vendor for all maintenance adaptations and modificationsto the equipment
Table 2 Commercial-Based Water Quality Monitoring Products
Vendor Product(s)
AXYX Technologies [24] TRIAXYS Directional Wave Buoy TRIAXYS Wave and Current Buoy TRIAXYSMini Wave Buoy HydroLevel Buoy
Fondriest Environmental [25] NexSens Data BuoysAanderaa [26] SeaGuard Platform
Fugro [27] SEAWATCH Wavescan Buoy SEAWATCH Midi Buoy SEAWATCH BuoySEAWATCH Mini II Buoy
Aridea [28] Libelium-Aridea Offshore Buoy Kit
Sensors 2018 18 2248 4 of 23
Within this context SEMAT aimed to apply a new paradigm to low-cost aquatic environmentalmonitoring The intent was to see whether off-the-shelf commercially available componentry could beassembled in standardized formats for the purpose of such monitoring A series of prototype SEMATbuoys were constructed using this approach and two whole-of-system deployments were undertakenin Moreton Bay and Heron Island lagoon in Queensland Australia [27829] These deploymentsdemonstrated that it was not only feasible to construct suitable environmental monitoring systemsusing a commodity-based approach but also to obtain the enhanced temporal and spatial resolutionwhich greatly increased the quality and value of the data In addition the SEMAT approach reasonsthat the system is able to provide readings from several lower-cost units to inform the scientist as to thebest locations and times to commit the more expensive highly precise manual investigations shouldthey be required
Concurrent work by Albaladejo et al 2012 [30] also pursued a low-cost sensor buoy system Theydesigned a device for monitoring near-shore shallow marine environments as part of the SpanishNational research project ldquoObservatorio Oceanografico Costero de la Region de Muciardquo Their buoyrecorded temperature water pressure and atmospheric pressure remotely using a light weight butmarine-robust platform The system was the first to use 37 volt LiPo batteries with small form factorsolar panels They deployed the system over several months around the Mar Menor Lagoon inthe Mediterranean Sea with relatively successful results However this initiative appears to haveconcluded with no further studies having been undertaken since 2011
Since 2012 many other initiatives have arisen that attempt to take a different approach to thetraditional methods of environmental monitoring The Cave Pearl Project [10] focuses on usingArduino microcontrollers to construct extremely low power consumption logging devices The loggersuse Arduino-compatible sensors and custom-made logger housings in order to keep the cost downAt the time of writing the project claims that a logger can run for over a year with three AA batteriesfor approximately $100 USD These loggers do not provide telemetry and therefore must be retrievedfrom the site in order to download the data However the project blog contains useful constructionguides for equipment and much anecdotal evidence about the realities of undertaking deployments
Lockridge et al [31] present a low-cost drifting sonde that remotely transmits variousenvironmental and geolocation parameters from its attached sensors and GPS module The sondetook measurements on temperature and conductivity over several weeks while adrift in the oceanHowever the system did not use solar power Similar to the Cave Pearl Project this proposal is basedon the widely available Arduino microcontroller platform Although low-power micro controllerunits exist Arduinorsquos simplicity and open source nature makes it attractive for getting environmentalmonitoring applications running easily
In this vein Sadler et al [9] also proposed an architecture for an environmental monitoring systembased on Arduino They took the SEMAT-approach for selecting off-the-shelf components to achievelower costs They interfaced the Arduino with a DHT22 HumidityTemperature sensor and SDI-12pressure transducer The data was sent via GPRS modem to a server The system was powered bya 4000 mAh lithium ion battery and 6 W solar panel Sadler et al also called for an open-sourceopen-data approach to development However a physical buoy was not constructed for their systemand no actual field validation tests were conducted in water
Although there are still many technical challenges to overcome it is apparent that the technologynow exists to make remote environmental monitoring systems dramatically less expensive and thelow-cost approach is gaining traction
22 SEMATrsquos Design Goals (Revisited)
Trevathan et al [8] outlined the initial goals for SEMAT evolution of the SEMAT buoys and trialdeployments Some associated publications [2932ndash34] go into further detail regarding the ecologicalengineering and IT-related research that was achieved during this period of SEMAT
Sensors 2018 18 2248 5 of 23
However at the time SEMAT was conceived there was still much pull amongst the researchcommunity drawing the project in multiple directions and adding ldquobloated functionalityrdquo to the systemHere bloated functionality refers to features that are peripheral to the basic functional requirements ofthe system or excess to the actual needs of the system end-user This bloated functionality was alsooften research driven pursuing a dedicated thread of its own which did not contribute to creating animmediately operational system serving the needs of environmental monitoring Based on a review ofthe goals outlined in Trevathan et al [8] the post deployment analysis for the Deception Bay and HeronIsland deployments and the advancements in technology since Trevathan et al [8] was publishedwe have refined the goals for SEMAT to be the following
1 Application-driven deployments and reportingmdashData is collected for scientific study purposes andfor client-oriented needs such as validation of compliances or standards in water quality not justfor the sake of collecting data Deployments and data collection are driven by an underlyingapplication where the data informs the user and provides measures of condition or performancerelevant to the end-user
2 Low CostmdashBy utilising suitable ldquooff-the-shelf rdquo elements and an innovative approach to deviceproduction the aim is to deliver a robust sensor network system which is significantly under 40of the cost of similar existing systems on the market
3 Minimal deployment expertisemdashA buoy must be easily deployable without requiring any onsiteconfiguration and specialist equipment and can ideally be done by a single person (eg the buoycan be deployed and its operation immediately checked via a smart phone)
4 The ability to adapt and evolvemdashThe SEMAT system design must be able to evolve withenhancements in technology and community needs Through modularisation and an adaptablearchitecture the core system can be modified ongoing to meet user requirements
5 Remote interface data management and analysis toolsmdashThe SEMAT system needs to provide a userinterface backend data management and set of simple yet powerful tools for an end user to viewand manipulate the data and monitormanage the system
6 RobustnessdurabilitymdashA buoy needs to be robust enough to withstand harsh conditions withoutfailures over an extended period of deployment (eg heavy rain waves strong current hail boatstrikes fishbird attacks bio-fouling submersion etc)
7 Transferabilitysustainability of productmdashThe SEMAT development and production model mustcontinue to move forward rather than stop after a specific projectdeployment or be larger thana single individual and
8 Small environmental footprintmdashThe buoy must be constructed using the minimal possible resourcesand ideally most components can be recycledreused once a deployment is over A buoy mustnot negatively impact on the environment around it in which the buoy is deployed (eg toxicgluespaints or materials being left behind post deployment)
Several goals outlined in Trevathan et al [8] have been removed as they are deemed peripheralandor too superfluous to pursue with limited resources and personnel SEMAT aims to focus onestablishing a practical and sustainable environmental monitoring system that serves the purpose ofproviding data for direct application There is no aspiration to solve all of the more global technicalchallenges facing conceivable WSNs nor the futuristic aspirations of environmental monitoringtechnological research beyond those solved as the system is evolved and tested
Given that sensor buoys will be deployed in remote locations the amount of time servicing themin the field must be kept to a minimum Therefore it is desirable to keep a buoy as simple as possibleldquoWhat can go wrong will go wrongrdquo As such SEMAT aims to follow the ldquoKISSrdquo principlemdashKeep ItSimple and Stupid This means that the technical and functional complexity of a buoy must be kept asminimal as possible to limit the potential for errors Instead the ldquosmart stuffrdquo occurs at the serverlevel which is accessible and scalable the expense logistics and risks of retrieving and servicing amalfunctioning buoy exceeds that of having a programmer fix an issue on a server
Sensors 2018 18 2248 6 of 23
In-line with the SEMAT philosophy the system should be inexpensive so that deploying numerousdevices can cover a large spatial area Furthermore the system is capable of operating for extendeddeployments (ge12 months) with maintenance cycles in the order of three months to address issues suchas bio fouling Purposely the SEMAT system is intended for operation under the rigors of near-shoremarine and estuarine ecosystems as well as rivers creeks wetlands and constructed water bodies
23 The Need for an Open Standard for Constructing Environmental Monitoring Systems
The SEMAT project has necessarily required expertise from multiple disciplines including
bull Data Application and Modelling (environmental and mathematical)bull Application programming (user interface data and content management algorithms)bull Systems programming (networkingcommunications hardware-level details)bull Electrical EngineeringPhysics (electronics and sensor development) andbull FieldDeployment (experience in marine hardening systems testing and deployment)
Only through this multidisciplinary approach have we been able to match end-user requirementswith technical design and the required functionality
In order to address Design Goal 7 (Section 22) the paradigm for creating environmentalmonitoring systems must be inverted To date mainstream approaches taken by scientific companiesor large funded government agencies have not delivered the desired outcomes or a sustainable wayof conducting environmental monitoring especially where the end-users operate under constrainedfunding and human resource conditions At the same time no one company can be expected to crossall aspects As such a community-driven approach would instead seem more applicable and morelikely to deliver an outcome appropriate to and easily assimilated by end-users
Consider the approach for developing 3D printing technology Historically 3D printers wereexpensive and required highly trained staff to operate them The RepRap (httprepraporg) projectintroduced a new paradigm whereby an open source design model was proposed to allow everyone toconstruct a 3D printer (even using 3D printed parts) People could innovate around the RepRap modeland the community drove the development Now 3D printers can be constructed at low-cost (eg $64)with only limited technical expertise required
In this paper we are proposing a similar ldquoOpen Designrdquo based on SEMAT (similar to the initiativeby Sadler et al [9]) Insights from the RepRap project are relevant to solving the challenges of drivingdown the costs of creating environmental monitoring equipment Accordingly the SEMAT projectseeks to allow the community to reproduce and innovate around the core design so that end-usersobtain a system relevant to their specific needs but compliant with a standard suited to comparisonsand exchanges with other similar systems (Design Goal 4 Section 22)
Fundamental to the SEMAT approach is the modularization of the system Beyond the electronicand sensor design elements the monitoring system needs to be easily serviced and maintained undera wide range of operational conditions In this context a modular approach to the design is highlypreferable as it allows the operator to inspect service or replace components with little to no risk ofdamage or degradation due to field conditions
24 Engaging the Community in Production and Education through Social Enterprise
A social enterprise is an organization that addresses a basic unmet need or solves a social problemthrough a market-driven approach [35] In recent years traditional non-profits have become moreentrepreneurial and interested in generating earned revenue to supplement charitable contributionsFurthermore traditional businesses have begun to integrate greater levels of social responsibility andsustainability into their operations The growth of social enterprise is a reflection of this convergenceand helps fill the void between traditional approaches that have focused solely on creating either socialimpact or financial returns
Sensors 2018 18 2248 7 of 23
Substation33 (substation33comau) is a social enterprise located in Logan Australia Substation33was originally established as an electronic waste recycling social enterprise business in an effort toreduce the amount of electronic componentry being dumped as landfill Substation33primes primary charteris to connect with people marginalized from mainstream employment for a variety of reasons (suchas long-term unemployment physical or other disability early school leavers or students at risk ofdisengaging from school) These people are then mentored by community leaders and are engaged ininnovation projects that promote sustainable environmental practices [36]
As previously mentioned this paper seeks to formalize SEMAT as an open standard to tapinto the ideas of the scientific industrial and hobbyist communities to drive the innovation behindenvironmental monitoring technologies As such social enterprise is one mechanism towards thisgoal In 2017 SEMAT formed a relationship with Substation33 whereby Substation33 is engaged inthe production of SEMAT devices using up-cycled e-waste (Design Goal 8 Section 22) In this waythe SEMAT initiative also brings the benefits of social enterprise to community through education andreduced construction costs To our knowledge this is the first time such a development and productionmodel has been proposed for improving environmental monitoring outcomes and is the subject of anensuing publication
3 An Open Standard System for Low-Cost Remote Aquatic Environmental Monitoring
31 System Architecture
SEMAT has taken a hierarchical approach to sensor network architecture The network architecturepresented in Trevathan et al [78] consisted of the individual field units transmitting to a land mountedbase station and then through the Internet via a 3G modem to a back-end server This avoided thecomplexity associated with multi-hop network architectures
While this approach has some merits experience in early deployments highlighted its drawbacksFor example in this configuration all buoys are logically grouped and are dependent on a specific basestation However the base stations reliability represents a central point for failure for the whole systemAdditionally base stations must be repeated to extend the geographic coverage adding significantly tothe systemrsquos expense and level of complexity
It is noted that some local government bodies in Australia are experimenting with IoT providersfor establishing low power wide area networks (eg Taggle (wwwtagglecomau) and Sigfox (wwwsigfoxcom)) However this approach requires a council to be liable for all costs associated withinstalling and maintaining these base stations Base stations must be repeated (every 10ndash15 km) anddirect line of sight is usually required Furthermore such systems have limited spatial coverage whenit comes to monitoring rural or off-shore areas
Due to the aforementioned limitations SEMAT utilizes existing network infrastructure asmaintained by the telecommunications companies (see Figure 1) This greatly reduces both the costand infrastructure required whilst providing a greater spatial coverage and reliability IncreasinglyGSM (Global System for Mobile Communications) technology is at a stage whereby an individual buoyis able to directly communicate with the national network even in most regional locations in manycountries The only trade-off with this approach is an ongoing subscription to a service via a SIM(Subscriber Identity Module) card However the cost of this approach is significantly lower than thepurchase installation and maintenance of an independent communications network Where thisconnectivity is not possible the SEMAT standard also allows any type of communication method to beused based on the userrsquos requirements (eg Zigbee LoRa WiFi)
Sensors 2018 18 2248 8 of 23
Sensors 2018 18 x FOR PEER REVIEW 8 of 22
Figure 1 The Smart Environmental Monitoring and Assessment Technologies (SEMAT) Aquatic
Sensor Network Architecture including data access via mobile devices
32 Physical Components of a SEMAT Buoy
SEMAT has experimented with many buoy designs with varying results Figure 2 shows the
latest SEMAT buoy The physical components of a buoy consist of the following main parts
Floatmdashprovides the main buoyancy and physical structure of the buoy
Lidmdashseals the canister and houses above water sensors solar panels and status LED
Canistermdashhouses the internal electronics components and provides additional buoyancy
Shaftmdashextends from the canister below water to connect the sensor head
Ballastmdashprovides weighting to ensure the buoy maintains upright positioning in the water
Sensor Headmdashhouses the underwater sensors and
Mooring and Anchormdashtethers the buoy in position in a water body
Figure 2 (A) SEMAT Buoy (Top View) (B) Buoy Cross Section (C) Anchor and Mooring System
The main buoyancy element is a modified 250 mm styrene float This provides the buoyancy
required for the canister and associated componentry A 91 mm cylindrical cut is made through the
centre of the buoy to insert the canister and a 40 mm chord is cut from the top of the buoy
perpendicular to the cylindrical cut to facilitate the placement of the lid Primer and weather proof
paint were used to colour the float and provide a thin water proof skin
The lid is a 3D printed design that is 190 mm at its base matching the curved surface of the top
of the float The lid incorporates the solar panel with two penetrations underneath for the wiring to
reach the canister The diffuser and light sensor for surface light readings is also integrated into the
Figure 1 The Smart Environmental Monitoring and Assessment Technologies (SEMAT) Aquatic SensorNetwork Architecture including data access via mobile devices
32 Physical Components of a SEMAT Buoy
SEMAT has experimented with many buoy designs with varying results Figure 2 shows the latestSEMAT buoy The physical components of a buoy consist of the following main parts
bull Floatmdashprovides the main buoyancy and physical structure of the buoybull Lidmdashseals the canister and houses above water sensors solar panels and status LEDbull Canistermdashhouses the internal electronics components and provides additional buoyancybull Shaftmdashextends from the canister below water to connect the sensor headbull Ballastmdashprovides weighting to ensure the buoy maintains upright positioning in the waterbull Sensor Headmdashhouses the underwater sensors andbull Mooring and Anchormdashtethers the buoy in position in a water body
Sensors 2018 18 x FOR PEER REVIEW 8 of 22
Figure 1 The Smart Environmental Monitoring and Assessment Technologies (SEMAT) Aquatic
Sensor Network Architecture including data access via mobile devices
32 Physical Components of a SEMAT Buoy
SEMAT has experimented with many buoy designs with varying results Figure 2 shows the
latest SEMAT buoy The physical components of a buoy consist of the following main parts
Floatmdashprovides the main buoyancy and physical structure of the buoy
Lidmdashseals the canister and houses above water sensors solar panels and status LED
Canistermdashhouses the internal electronics components and provides additional buoyancy
Shaftmdashextends from the canister below water to connect the sensor head
Ballastmdashprovides weighting to ensure the buoy maintains upright positioning in the water
Sensor Headmdashhouses the underwater sensors and
Mooring and Anchormdashtethers the buoy in position in a water body
Figure 2 (A) SEMAT Buoy (Top View) (B) Buoy Cross Section (C) Anchor and Mooring System
The main buoyancy element is a modified 250 mm styrene float This provides the buoyancy
required for the canister and associated componentry A 91 mm cylindrical cut is made through the
centre of the buoy to insert the canister and a 40 mm chord is cut from the top of the buoy
perpendicular to the cylindrical cut to facilitate the placement of the lid Primer and weather proof
paint were used to colour the float and provide a thin water proof skin
The lid is a 3D printed design that is 190 mm at its base matching the curved surface of the top
of the float The lid incorporates the solar panel with two penetrations underneath for the wiring to
reach the canister The diffuser and light sensor for surface light readings is also integrated into the
Figure 2 (A) SEMAT Buoy (Top View) (B) Buoy Cross Section (C) Anchor and Mooring System
The main buoyancy element is a modified 250 mm styrene float This provides the buoyancyrequired for the canister and associated componentry A 91 mm cylindrical cut is made through thecentre of the buoy to insert the canister and a 40 mm chord is cut from the top of the buoy perpendicularto the cylindrical cut to facilitate the placement of the lid Primer and weather proof paint were usedto colour the float and provide a thin water proof skin
Sensors 2018 18 2248 9 of 23
The lid is a 3D printed design that is 190 mm at its base matching the curved surface of the topof the float The lid incorporates the solar panel with two penetrations underneath for the wiringto reach the canister The diffuser and light sensor for surface light readings is also integrated intothe buoy lid A tri-colour status LED is also inserted in the lid and allows the stateoperation of thebuoy to be observed externally in the field (ie Greenmdashsleep Bluemdashawaketransmitting Redmdasherror)The lid is fixed to an underlying flange via six M4 times 16 mm stainless steel 316 screws that compressthe lid onto an O-ring seal with the underlying canister
The canister is a 90 mm PVC pipe sealed on the bottom with a standard PVC end-cap usingtraditional PVC primer and glue A 3D printed flange is adhered to the top in the same manner tofacilitate connection with the lid As noted the flange contains a countersunk O-ring for a watertight seal (coated with silicone grease) A standard irrigation quality flange and pipe connection(20 mm diameter) provide the watertight connection between the canister electronics and the sensorset attached at the end of the 05 m shaft The plastic threads are sealed using PTFE thread tape
The shaft is a 34 rdquo 1
2 rdquo times 300 mm polypropylene riser with a male (top) and female (bottom) BSPthread The shaft hosts an electrical cable (Cat5) that connects the sensor head to the electronics in thecanister The shaft also contains a rod of metal that serves as a ballast bar so that the buoy maintainsan upright position in varying wind and wave conditions Having the ballast within the shaft preventsany corrosion with chemical reactions from the water The ballast can also be recycled for reuse withother buoys
The sensor head is a PCB containing the sensors The sensor head connects to the shaft via a maleBSP thread (The sensor head is described in further detail in Section 335)
The mooring system shown in Figure 2 consists of a secondary float connected to the SEMAT buoyby a tethering line The secondary float is attached to an anchor via a mooring For the deploymentsoutlined in this paper a plastic coated 8 kg weight was used as an anchor The weight has an in-builthandle which provided an attachment point for the mooring line and also aided in deployment andretrieval (a range of low-cost solutions are available for use as an anchor) By tethering the sensorbuoy to a separately moored buoy there was no interference between the anchor line and the sensorsAlso the SEMAT buoy was able to remain upright as the ballast and tether line counter balanced theinfluence of water currents and wind This also reduced the possible interference of additional foulingfrom having an anchor line in close proximity to the sensors Other mooring systems may be moreapplicable in different situations and conditions
Note that this physical buoy design represents one of many options we are experimenting withA newer more compact and sturdier design with a twist on lid is being tested at the time of writingthis paper The overall design consideration is to make the buoy as low-cost as possible usingreadily available materials and reducing the amount of labour required for construction deploymentand maintenance
33 Electronics Subsystems of a SEMAT Buoy
A systems approach has been taken in the development of the SEMAT buoy electronics Thisallows the complexity to be managed and related functionality so it can be grouped according to aparticular subsystem Table 3 shows the subsystems for a SEMAT buoy The following sections outlinethe functional requirements for each of these subsystems the current technologies employed and therationale for the design approach
Figure 3 illustrates the internal electronics for a SEMAT buoy (front and back) Each of the majorcomponents is described in each respective section below
Sensors 2018 18 2248 10 of 23
Table 3 Electronics Subsystems
Subsystem Description
Microcontroller System controlPower Batteries and power management logic
Solar Charging Solar panels and solar charge controllerTiming Real time clock to control duty cyclingSensors Sensor head connections sampling calibration
Communications Transmissions of sensor samples and system status to the serverCleaning Self-cleaning mechanisms to reduce the impacts of bio fouling
Sensors 2018 18 x FOR PEER REVIEW 10 of 22
Figure 3 illustrates the internal electronics for a SEMAT buoy (front and back) Each of the major
components is described in each respective section below
Figure 3 SEMAT Electronics
331 Microcontroller Subsystem
The microcontroller subsystem is essentially the brain of the buoy Once awake the
microcontroller initializes all system objects (devices) takes the sensor readings transmits the
readings and then initiates the next sleep cycle As previously mentioned the amount of functionality
on the buoy needs to be kept to a minimum to limit the number of issues that can occur The code on
the microcontroller must always have an end state to ensure that no logic path can result in an infinite
loop or timeout which will run down the battery (by preventing the system from entering a sleep
state) Section 334 outlines in detail the various system states
We chose the Arduino microcontroller primarily due to its simplicity and widely known
properties While other more powerful microcontroller platforms such as Raspberry Pi can be used
these tend to consume more powermdashwhich is a scarce resource Other ultra-low power draw
microcontrollers tend to be more complicated to operate and require intricate memory management
manipulation We used an Arduino Pro Mini ATmega328P (5 v 16 MHz) for the deployments
outlined in this paper This board was chosen due to its compact form factor and low power
consumption
332 Power Subsystem
Arduino and associated sensors offer two voltage logic levels 33 v or 5 v reflecting the shift in
hobby electronics towards 33 v logic in order to reduce battery sizes the 33 v also lends itself
naturally to LiPo and Li-ion voltage levels (ie around 37 v) Whilst trials were undertaken using
33 v logic it became apparent that many sensors and other devices such as servos require 5 v logic
in order to operate Therefore the decision was made to make the system operate at 5 v to avoid
having to complicate the system using logic level shifting electronics
In light of this and the gains made through the use of up-cycled LiPo or Li-ion batteries (from
social enterprise collaboration) it was necessary to utilize a DC-DC converter to achieve 5 v from the
37 v to 42 v available This component serves two purposes Firstly the DC-DC converter takes the
battery voltage and boosts it up to the required 5 v Secondly the DC-DC converter creates a smooth
5 v signal regardless of the battery voltage and potential current spikes on the system The current
design uses four recycled AA Li-Ion batteries operating at approximately 37 vndash42 v providing 8000
mAh
Figure 3 SEMAT Electronics
331 Microcontroller Subsystem
The microcontroller subsystem is essentially the brain of the buoy Once awake themicrocontroller initializes all system objects (devices) takes the sensor readings transmits the readingsand then initiates the next sleep cycle As previously mentioned the amount of functionality on thebuoy needs to be kept to a minimum to limit the number of issues that can occur The code on themicrocontroller must always have an end state to ensure that no logic path can result in an infiniteloop or timeout which will run down the battery (by preventing the system from entering a sleepstate) Section 334 outlines in detail the various system states
We chose the Arduino microcontroller primarily due to its simplicity and widely known propertiesWhile other more powerful microcontroller platforms such as Raspberry Pi can be used these tendto consume more powermdashwhich is a scarce resource Other ultra-low power draw microcontrollerstend to be more complicated to operate and require intricate memory management manipulationWe used an Arduino Pro Mini ATmega328P (5 v 16 MHz) for the deployments outlined in this paperThis board was chosen due to its compact form factor and low power consumption
332 Power Subsystem
Arduino and associated sensors offer two voltage logic levels 33 v or 5 v reflecting the shiftin hobby electronics towards 33 v logic in order to reduce battery sizes the 33 v also lends itselfnaturally to LiPo and Li-ion voltage levels (ie around 37 v) Whilst trials were undertaken using33 v logic it became apparent that many sensors and other devices such as servos require 5 v logic in
Sensors 2018 18 2248 11 of 23
order to operate Therefore the decision was made to make the system operate at 5 v to avoid havingto complicate the system using logic level shifting electronics
In light of this and the gains made through the use of up-cycled LiPo or Li-ion batteries (fromsocial enterprise collaboration) it was necessary to utilize a DC-DC converter to achieve 5 v from the37 v to 42 v available This component serves two purposes Firstly the DC-DC converter takes thebattery voltage and boosts it up to the required 5 v Secondly the DC-DC converter creates a smooth 5 vsignal regardless of the battery voltage and potential current spikes on the system The current designuses four recycled AA Li-Ion batteries operating at approximately 37 vndash42 v providing 8000 mAh
As the system does not need to sample continuously duty cycling is desirable as a way to conservebattery power While there are ways to place an Arduino into a quiescent state through various sleepoptions this does not power down all of the peripheral electronics (eg the DC-DC converter varioussensors etc) As such there is a significant continual power drain on the system To overcome this issuean additional timing circuit was installed to actively turn off all system devices Our design uses aMOSFET N-Channel and JK flip-flop in conjunction with the systemrsquos clock (described in Section 334)The Arduino sets an alarm on the clock to wake up in 15 min and turns on the green sleep status lightby sending a voltage high signal on the appropriate pin of the status LED This triggers the flip-flopto change state and the MOSFET powers the system down When the real time clock alarm signal isdetected by a rising edge triggered on its SQW pin the flip-flop changes state again and the MOSFETpowers the system up to take the next round of sensor samples This process repeats indefinitely
333 Solar Charging Subsystem
A 6 v 1 W solar panel is used to recharge the batteries A CN3083 SOP8 high efficiency solarcharging circuit chip is required to convert 6 v down to the appropriate level for the Li-ion batterypack Optimally the batteries operate in the range of 37 vndash42 v Overcharge or extreme dischargeof the battery pack is undesirable So critical is the role of the battery in the system that voltage ismeasured via one of the Arduinorsquos analogue pins and transmitted back to the server along with theother sensor samples Creative ways to allow the buoy to adjust its sampling time to improve batterylife can be used when low voltage conditions are present For example when a low voltage conditionis detected the system will sample less often until the battery voltage recharges to an acceptable levelAdditional circuitry (a voltage divider and MOSFET) was added to prevent overcharge and dischargeon each battery cell
334 Timing Subsystem
System timing is critical for determining when to take samples and correctly time stamping thesamples There are three sources of timing for the system
bull A Real Time Clock (RTC) located on the buoybull Obtaining the time from the GSM network andbull The time on the backend server database when a transmission is received
The RTC provides a way to keep track of the time (either 24-h or 12-h format) so that sensorreadings can be time stamped SEMAT employs the DS3231 RTC by Texas Instruments The RTCcontains a CR2032 coin-cell battery to allow it to keep track of the current time The RTC is independentof the Arduino The battery cell can cast for up to 5 years The time set in the RTC is synchronizedwith the computer that loads the script onto the Arduino However over time we observed that thereis quite significant time drift and variation in alarm timing between different DS3231 RTCs If a buoyis relied on to timestamp its own sensor samples then there is the definite likelihood that all deployedbuoys will not be sampling at a common time in synchrony As such apart from setting an alarm tocontrol duty cycling the RTC should not be relied upon for time stamping sensor samples
A common time can be obtained via the GSM network Here the time of transmission can belogged but the RTC cannot be easily updated to resynchronize all buoys Ultimately the easiest
Sensors 2018 18 2248 12 of 23
approach is to have the backend server log the time a sample is received from each buoy uses thedatabasersquos common timestamp This removes the responsibility of time stamping from the buoys(and the need for the CR2032 battery) but does not fix issues of buoy synchronization Experienceindicates that on a 15-min sample interval all buoys will transmit within 7 1
2 minutes of each otherGeneralized this means that for an n-minute sample interval all buoys are synchronized to transmitwithin n2 min of each other
Figure 4 illustrates the various states of the buoy based on the timing Upon initially turning onthe buoy by connecting it to the power system the buoy will cycle between two major statesmdashAwakeor Sleep When an Awake state is triggered the microcontroller subsystem will enter into a Startupstate and initialize all system objects in memory and check all attached hardware Next the systemwill take sensor samples in the Sample state then enters in to the Transmit state to send the readingsto the web server If at any stage an error occurs the system will momentarily enter the Error stateand notify the user either via a red status LED indicator transmit status information and write anerror to the Arduinorsquos EEPROM Finally the system will enter a Set Alarm state to set the alarm on theRTC The system then enters into the Sleep state until the alarm wakes the system up again and theprocess repeats
Sensors 2018 18 x FOR PEER REVIEW 12 of 22
Figure 4 illustrates the various states of the buoy based on the timing Upon initially turning on
the buoy by connecting it to the power system the buoy will cycle between two major states mdashAwake
or Sleep When an Awake state is triggered the microcontroller subsystem will enter into a Startup
state and initialize all system objects in memory and check all attached hardware Next the system
will take sensor samples in the Sample state then enters in to the Transmit state to send the readings
to the web server If at any stage an error occurs the system will momentarily enter the Error state
and notify the user either via a red status LED indicator transmit status information and write an
error to the Arduinorsquos EEPROM Finally the system will enter a Set Alarm state to set the alarm on
the RTC The system then enters into the Sleep state until the alarm wakes the system up again and
the process repeats
Figure 4 SEMAT Buoy States
335 Sensor Subsystem
The core electronic sensors on a SEMAT buoy included Temperature Photosynthetically Active
Radiation (PAR) (equivalent) Turbidity and Depth
We have primarily focused on these parameters as they are fundamental to water quality
management Based on these parameters other readings from chemical sensors can be approximated
The problem with chemical sensors (apart from expense) is their long-term instability and need for
regular maintenance in order to maintain accuracy Most sensors need to take water samples mix
chemicals and then interpret colours or other types of readings The membranes in such devices are
usually the first point of failure
Sensors must be approximately 05 m below the water surface The reason being that surface-
only readings are insufficient The readings must be taken deep enough in the water column to ensure
proper mixing and hydrological processes to occur PAR is taken at the surface and 05 m below the
surface to determine the light attenuation curve (ie the change in light between the surface and
underwater)
For the deployments outlined in this paper we used the Adafruit MCP9808 Precision I2C
Temperature Sensor (httpswwwadafruitcomproduct1782) This sensor can operate between minus40
degC to +125 degC with accuracy of +-025 degC Less expensive temperature sensors such as the Maxim
DS18B20 are also sufficient for the task
With regard to light the most widely useful measurement type in environmental management
is that of PAR which spans wavelengths from 400 to 700 nanometres Rather than use an expensive
proprietary PAR sensor we employed the Adafruit TSL2591 High Dynamic Digital Light Sensor
(httpswwwadafruitcomproduct439) This sensor can detect light intensities from 188 microLux to
88000 Lux and is able to detect light across the spectrum covered by PAR As such we are able to
calibrate this sensor against a PAR sensor to provide a PAR equivalent Slightly less expensive
versions of this sensor can be sourced on eBay However in our experience most alternatives were
hard wired to a single I2C address whereas the Adafruit TSL2591 allows up to three I2C addresses
To measure water clarity our turbidity sensor was based on components salvaged from the
Gravity Analog Turbidity Sensor (httpswwwdfrobotcomproduct-1394html) This sensor is able
to detect suspended particles in the water by measuring the light transmittance and scattering rate
which changes with the amount of total suspended solids in the water Once calibrated this sensor
is able to provide a derived Nephelometric Turbidity Unit (NTU) value We used the Gravityrsquos existing
Figure 4 SEMAT Buoy States
335 Sensor Subsystem
The core electronic sensors on a SEMAT buoy included Temperature Photosynthetically ActiveRadiation (PAR) (equivalent) Turbidity and Depth
We have primarily focused on these parameters as they are fundamental to water qualitymanagement Based on these parameters other readings from chemical sensors can be approximatedThe problem with chemical sensors (apart from expense) is their long-term instability and needfor regular maintenance in order to maintain accuracy Most sensors need to take water samplesmix chemicals and then interpret colours or other types of readings The membranes in such devicesare usually the first point of failure
Sensors must be approximately 05 m below the water surface The reason being that surface-onlyreadings are insufficient The readings must be taken deep enough in the water column to ensureproper mixing and hydrological processes to occur PAR is taken at the surface and 05 m belowthe surface to determine the light attenuation curve (ie the change in light between the surface andunderwater)
For the deployments outlined in this paper we used the Adafruit MCP9808 Precision I2CTemperature Sensor (httpswwwadafruitcomproduct1782) This sensor can operate betweenminus40 C to +125 C with accuracy of +-025 C Less expensive temperature sensors such as the MaximDS18B20 are also sufficient for the task
With regard to light the most widely useful measurement type in environmental managementis that of PAR which spans wavelengths from 400 to 700 nanometres Rather than use an expensiveproprietary PAR sensor we employed the Adafruit TSL2591 High Dynamic Digital Light Sensor(httpswwwadafruitcomproduct439) This sensor can detect light intensities from 188 microLux to88000 Lux and is able to detect light across the spectrum covered by PAR As such we are able to
Sensors 2018 18 2248 13 of 23
calibrate this sensor against a PAR sensor to provide a PAR equivalent Slightly less expensive versionsof this sensor can be sourced on eBay However in our experience most alternatives were hard wiredto a single I2C address whereas the Adafruit TSL2591 allows up to three I2C addresses
To measure water clarity our turbidity sensor was based on components salvaged from theGravity Analog Turbidity Sensor (httpswwwdfrobotcomproduct-1394html) This sensor is ableto detect suspended particles in the water by measuring the light transmittance and scattering ratewhich changes with the amount of total suspended solids in the water Once calibrated this sensor isable to provide a derived Nephelometric Turbidity Unit (NTU) value We used the Gravityrsquos existinginfrared sender and receiver and some of its physical housing We then added our own low pass filtercircuit determined the optimal operating voltage for sensing and calibrated the modified turbiditysensor against a highly accurate certified turbidity sensor and calibration standards
Normally water depth measurement is performed by a transducer in conjunction with somemarine computing device Anything electronic that has to be near water always comes with a higherldquomarine graderdquo price The proposed solution was to find something low cost and already in abundanceWhile not the most scientific application a ldquowaterproofrdquo reversing sensor that is normally installed onthe bumper of a car was trialled for suitability as a depth sounder
Along with its resistance to being wet key elements that made this a promising solution withinan aquatic senor network was the potential distance it could reach Since the density of water is morethan 4 times greater than air the sounding signal could potentially reach as far as 16 m before timingout Coincidentally the frequency at which a purpose-built depth sounder uses to find the waters bedis about 50 kHz which is rather close to that of the reversing sensor The reverse sensor kit used is aJSN-SR04T operating at an ultrasonic frequency of 40 kHz Used in its intended environment it has aminimum range of 200 mm a maximum range of 4000 mm and has an accuracy of plusmn50 mm An airtest showed a 6 error tolerance over its entire range and the tolerance was found to be less than 3after the first meter of measurement
The performance tests underwater showed that there is little to no impact on the effectiveness ofthe reverse sensor when the ultrasonic frequency was traveling through a different medium waterThe raw value provided by the hardware was converted into a standard measurement and calibrated tothe travel medium This sensor was deployed in water for several days with no further waterproofingand there was no degradation found in its performance indicating long term durability
Other potential Arduino-based sensors that can be added to the system include SalinityConductivity Dissolved Oxygen and pH These sensors are available from Atlas Scientific (wwwatlas-scientificcom) (Note that these latter sensors are not used in the deployments outlined in this paper)
The underwater sensors were consolidated into a single sensor head (Figure 5) This is a customdesigned PCB that provides all of the appropriate electrical pathways and turbidity sensor circuitryThe sensor head is encased in a 3D printed enclosure and contains a male BSP thread to allow it to beattached to the shaft of the buoy
Sensors 2018 18 x FOR PEER REVIEW 13 of 22
infrared sender and receiver and some of its physical housing We then added our own low pass filter
circuit determined the optimal operating voltage for sensing and calibrated the modified turbidity
sensor against a highly accurate certified turbidity sensor and calibration standards
Normally water depth measurement is performed by a transducer in conjunction with some
marine computing device Anything electronic that has to be near water always comes with a higher
ldquomarine graderdquo price The proposed solution was to find something low cost and already in
abundance While not the most scientific application a ldquowaterproofrdquo reversing sensor that is
normally installed on the bumper of a car was trialled for suitability as a depth sounder
Along with its resistance to being wet key elements that made this a promising solution within
an aquatic senor network was the potential distance it could reach Since the density of water is more
than 4 times greater than air the sounding signal could potentially reach as far as 16 m before timing
out Coincidentally the frequency at which a purpose-built depth sounder uses to find the waters
bed is about 50 kHz which is rather close to that of the reversing sensor The reverse sensor kit used
is a JSN-SR04T operating at an ultrasonic frequency of 40 kHz Used in its intended environment it
has a minimum range of 200 mm a maximum range of 4000 mm and has an accuracy of plusmn50 mm An
air test showed a 6 error tolerance over its entire range and the tolerance was found to be less than
3 after the first meter of measurement
The performance tests underwater showed that there is little to no impact on the effectiveness
of the reverse sensor when the ultrasonic frequency was traveling through a different medium water
The raw value provided by the hardware was converted into a standard measurement and calibrated
to the travel medium This sensor was deployed in water for several days with no further
waterproofing and there was no degradation found in its performance indicating long term
durability
Other potential Arduino-based sensors that can be added to the system include
SalinityConductivity Dissolved Oxygen and pH These sensors are available from Atlas Scientific
(wwwatlas-scientificcom) (Note that these latter sensors are not used in the deployments outlined
in this paper)
The underwater sensors were consolidated into a single sensor head (Figure 5) This is a custom
designed PCB that provides all of the appropriate electrical pathways and turbidity sensor circuitry
The sensor head is encased in a 3D printed enclosure and contains a male BSP thread to allow it to be
attached to the shaft of the buoy
Figure 5 Sensor Head
-Sensor Calibration-
Inexpensive sensors need to be calibrated against more expensive highly accurate sensors prior
to deployment or by means of direct physicochemical methods
To approximate realistic operational conditions the light sensors were calibrated against a
certified and calibrated LiCor reg light meter using a dedicated LI-190R Quantum PAR sensor head The
SEMAT light sensor was simultaneously exposed to the same range of calibration light regimes as
Figure 5 Sensor Head
Sensors 2018 18 2248 14 of 23
-Sensor Calibration-
Inexpensive sensors need to be calibrated against more expensive highly accurate sensors priorto deployment or by means of direct physicochemical methods
To approximate realistic operational conditions the light sensors were calibrated against a certifiedand calibrated LiCorreg light meter using a dedicated LI-190R Quantum PAR sensor head The SEMATlight sensor was simultaneously exposed to the same range of calibration light regimes as the LiCorreg
device to produce a response and calibration curve Different light intensities and frequency rangeswere established using standard light frequency filters This method allowed for rapid checking of thesensors as they are produced and also provides a means of field-based checking of sensor performanceover time
As with light measurement calibration the turbidity sensors were calibrated against a certified andcalibrated ALEC-Rinkoreg turbidity sensor As illustrated in Figure 6 the SEMAT turbidity sensor wassimultaneously exposed to the same range of calibration turbidity regimes as the ALEC-Rinkoreg deviceto produce a response and calibration curve Different turbidity level intensities were establishedusing turbidity standards Again this method allowed for rapid checking of the sensors as they areproduced and for field-based checking of sensor performance over time
Sensors 2018 18 x FOR PEER REVIEW 14 of 22
the LiCorreg device to produce a response and calibration curve Different light intensities and
frequency ranges were established using standard light frequency filter s This method allowed for
rapid checking of the sensors as they are produced and also provides a means of field-based checking
of sensor performance over time
As with light measurement calibration the turbidity sensors were calibrated against a certified
and calibrated ALEC-Rinkoreg turbidity sensor As illustrated in Figure 6 the SEMAT turbidity sensor
was simultaneously exposed to the same range of calibration turbidity regimes as the ALEC-Rinkoreg
device to produce a response and calibration curve Different turbidity level intensities were
established using turbidity standards Again this method allowed for rapid checking of the sensors
as they are produced and for field-based checking of sensor performance over time
Figure 6 Turbidity Calibration Setup
336 Communications Subsystem
As noted previously the SEMAT standard allows for any type of communication method to be
used based on the userrsquos requirements (eg Zigbee LoRa WiFi etc) Current deployments utilize
the existing GSM network to take advantage of existing infrastructure and the cost savings this
provides in terms of removing the need for additional infrastructure and maintenance
Initial trials utilized the Adafruit FONA 808 MiniGSM + GPS
(httpswwwadafruitcomproduct2542) This breakout board comes with full data support for
HTTP and also GPS However while this version of FONA was sufficient for the task it only provides
frequencies for operating on the 2G network In countries such as Australia the 2G network has now
been turned off and no longer supported by all telecommunications companies Notably however a
number of developing nations will continue to support 2G for several more years making the FONA
808 a viable intermediate option
More recently Adafruit has released the FONA 3G Cellular + GSM
(httpslearnadafruitcomadafruit-fona-3g-cellular-gps-breakoutoverview) using the SIM5320
chip This module works on all of the 3G frequencies supported by the Australian
telecommunications companies TinySine (httpswwwtinyosshopcom) has created a less expensive
version of the FONA 3G As stated on the Adafruit website there is limited support for the data
component of their SIM5320 chip However at the time of writing to our knowledge we are the first
to reliably send data using the HTTP protocol via 3G
337 Cleaning Subsystem
As the PAR lens and turbidity sensor are subject to fowling a mechanism is required for cleaning
[37] Several wiper arm approaches can be used depending on the type of fouling A servo is timed
to control the wiper arm to periodically wipe across the surface of the lens There are also chemical-
Figure 6 Turbidity Calibration Setup
336 Communications Subsystem
As noted previously the SEMAT standard allows for any type of communication method to beused based on the userrsquos requirements (eg Zigbee LoRa WiFi etc) Current deployments utilize theexisting GSM network to take advantage of existing infrastructure and the cost savings this providesin terms of removing the need for additional infrastructure and maintenance
Initial trials utilized the Adafruit FONA 808 MiniGSM + GPS (httpswwwadafruitcomproduct2542) This breakout board comes with full data support for HTTP and also GPS Howeverwhile this version of FONA was sufficient for the task it only provides frequencies for operating onthe 2G network In countries such as Australia the 2G network has now been turned off and no longersupported by all telecommunications companies Notably however a number of developing nationswill continue to support 2G for several more years making the FONA 808 a viable intermediate option
More recently Adafruit has released the FONA 3G Cellular + GSM (httpslearnadafruitcomadafruit-fona-3g-cellular-gps-breakoutoverview) using the SIM5320 chip This module works onall of the 3G frequencies supported by the Australian telecommunications companies TinySine(httpswwwtinyosshopcom) has created a less expensive version of the FONA 3G As stated on theAdafruit website there is limited support for the data component of their SIM5320 chip However
Sensors 2018 18 2248 15 of 23
at the time of writing to our knowledge we are the first to reliably send data using the HTTP protocolvia 3G
337 Cleaning Subsystem
As the PAR lens and turbidity sensor are subject to fowling a mechanism is required forcleaning [37] Several wiper arm approaches can be used depending on the type of fouling A servois timed to control the wiper arm to periodically wipe across the surface of the lens There are alsochemical-based approaches including anti-fouling paints and surface applied repellents For thedeployments outlined in this paper we did not employ any cleaning mechanism other than periodicmanual cleaning We intend to pursue this in future work
34 User Interface
As presented in Figure 7 a web-based user interface was developed to present data and to allowthe end-user to view deploymentsensor node locations on a Googlereg Map (Design Goal 5 Section 22)An individual sensor node can be selected and its corresponding sensors are displayed The userthen has the option of charting andor downloading any sensorrsquos data (Figure 8) Information is alsoavailable to the user about power supply status and alerts are issued if data is incomplete or a buoyfails to transmit A user is also able to set flags to be alerted when certain environmental parameterschange suddenly reach a threshold value or a combination of parameters indicate an imminent changein environmental conditions
Sensors 2018 18 x FOR PEER REVIEW 15 of 22
based approaches including anti-fouling paints and surface applied repellents For the deployments
outlined in this paper we did not employ any cleaning mechanism other than periodic manual
cleaning We intend to pursue this in future work
34 User Interface
As presented in Figure 7 a web-based user interface was developed to present data and to allow
the end-user to view deploymentsensor node locations on a Googlereg Map (Design Goal 5 Section
22) An individual sensor node can be selected and its corresponding sensors are displayed The user
then has the option of charting andor downloading any sensorrsquos data (Figure 8) Information is also
available to the user about power supply status and alerts are issued if data is incomplete or a buoy
fails to transmit A user is also able to set flags to be alerted when certain environmental parameters
change suddenly reach a threshold value or a combination of parameters indicate an imminent
change in environmental conditions
Figure 7 Web-Based User Interface
Figure 8 Charted Data from a Buoy
Figure 7 Web-Based User Interface
Figure 9 summarizes the SEMAT software architecture A buoy transmits its data as a JSONstring to the web server The web server uses PHP as the scripting language to process and store theincoming data into the MySQL database An environmental model consumes the data A user thenviews the data via a web browser that uses a combination of JavaScript and Google Maps The fullsoftware design will be documented in future work
Sensors 2018 18 2248 16 of 23
Sensors 2018 18 x FOR PEER REVIEW 15 of 22
based approaches including anti-fouling paints and surface applied repellents For the deployments
outlined in this paper we did not employ any cleaning mechanism other than periodic manual
cleaning We intend to pursue this in future work
34 User Interface
As presented in Figure 7 a web-based user interface was developed to present data and to allow
the end-user to view deploymentsensor node locations on a Googlereg Map (Design Goal 5 Section
22) An individual sensor node can be selected and its corresponding sensors are displayed The user
then has the option of charting andor downloading any sensorrsquos data (Figure 8) Information is also
available to the user about power supply status and alerts are issued if data is incomplete or a buoy
fails to transmit A user is also able to set flags to be alerted when certain environmental parameters
change suddenly reach a threshold value or a combination of parameters indicate an imminent
change in environmental conditions
Figure 7 Web-Based User Interface
Figure 8 Charted Data from a Buoy Figure 8 Charted Data from a Buoy
Sensors 2018 18 x FOR PEER REVIEW 16 of 22
Figure 9 summarizes the SEMAT software architecture A buoy transmits its data as a JSON
string to the web server The web server uses PHP as the scripting language to process and store the
incoming data into the MySQL database An environmental model consumes the data A user then
views the data via a web browser that uses a combination of JavaScript and Google Maps The full
software design will be documented in future work
Figure 9 Software Architecture
4 Environmental Study and Field Test Deployments
41 Lake Ellerslie
Lake Ellerslie is an artificial lake that is part of Griffith Universityrsquos Logan Campus (Figure 10)
The lake consists of two partsmdashthe north and south lakes The lake depth varies between 2 and 6 m
across different areas Both components of the lake are connected via a conduit under an intersecting
road (ie University Drive) and collectively serve to detain storm water flows from the adjacent
motorway as well as to assist in local flood mitigation The two lakes become detached during long
periods of low rainfall such that the respective water bodies then have no interaction Also the north
lake drains via a waterway through a golf course to Slacks Creek when water levels exceed drain
height
Figure 10 Lake Ellerslie Griffith University Logan Campus
As indicated the south lake receives input from the Logan Motorway and adjacent car park
whilst the north lake is impacted by nutrient run-off from the sports fields residential premises and
golf course The lake system is only flushed during continuous or high intensity rainfall ev ents so
that aspects such as water depth are important considerations for local waterways managers In this
context the lake system reflects a typical situation for many peri-urban water bodies in Australia and
similar locations internationally
From a waterwayrsquos management perspective Lake Ellerslie serves two purposes
1 To filter sediment and contaminants from the motorway and surrounds and
2 To relieve and redirect flooding from Slacks Creek
Figure 9 Software Architecture
4 Environmental Study and Field Test Deployments
41 Lake Ellerslie
Lake Ellerslie is an artificial lake that is part of Griffith Universityrsquos Logan Campus (Figure 10) Thelake consists of two partsmdashthe north and south lakes The lake depth varies between 2 and 6 m acrossdifferent areas Both components of the lake are connected via a conduit under an intersecting road(ie University Drive) and collectively serve to detain storm water flows from the adjacent motorwayas well as to assist in local flood mitigation The two lakes become detached during long periods oflow rainfall such that the respective water bodies then have no interaction Also the north lake drainsvia a waterway through a golf course to Slacks Creek when water levels exceed drain height
As indicated the south lake receives input from the Logan Motorway and adjacent car parkwhilst the north lake is impacted by nutrient run-off from the sports fields residential premises andgolf course The lake system is only flushed during continuous or high intensity rainfall events sothat aspects such as water depth are important considerations for local waterways managers In thiscontext the lake system reflects a typical situation for many peri-urban water bodies in Australia andsimilar locations internationally
From a waterwayrsquos management perspective Lake Ellerslie serves two purposes
1 To filter sediment and contaminants from the motorway and surrounds and2 To relieve and redirect flooding from Slacks Creek
Sensors 2018 18 2248 17 of 23
Sensors 2018 18 x FOR PEER REVIEW 16 of 22
Figure 9 summarizes the SEMAT software architecture A buoy transmits its data as a JSON
string to the web server The web server uses PHP as the scripting language to process and store the
incoming data into the MySQL database An environmental model consumes the data A user then
views the data via a web browser that uses a combination of JavaScript and Google Maps The full
software design will be documented in future work
Figure 9 Software Architecture
4 Environmental Study and Field Test Deployments
41 Lake Ellerslie
Lake Ellerslie is an artificial lake that is part of Griffith Universityrsquos Logan Campus (Figure 10)
The lake consists of two partsmdashthe north and south lakes The lake depth varies between 2 and 6 m
across different areas Both components of the lake are connected via a conduit under an intersecting
road (ie University Drive) and collectively serve to detain storm water flows from the adjacent
motorway as well as to assist in local flood mitigation The two lakes become detached during long
periods of low rainfall such that the respective water bodies then have no interaction Also the north
lake drains via a waterway through a golf course to Slacks Creek when water levels exceed drain
height
Figure 10 Lake Ellerslie Griffith University Logan Campus
As indicated the south lake receives input from the Logan Motorway and adjacent car park
whilst the north lake is impacted by nutrient run-off from the sports fields residential premises and
golf course The lake system is only flushed during continuous or high intensity rainfall ev ents so
that aspects such as water depth are important considerations for local waterways managers In this
context the lake system reflects a typical situation for many peri-urban water bodies in Australia and
similar locations internationally
From a waterwayrsquos management perspective Lake Ellerslie serves two purposes
1 To filter sediment and contaminants from the motorway and surrounds and
2 To relieve and redirect flooding from Slacks Creek
Figure 10 Lake Ellerslie Griffith University Logan Campus
In the first instance the south lake captures the immediate pollutants from the Logan motorwayand car park via storm water drains This includes all sorts of car fluids road debris and rubbishThere are a series of sediment catchment sites at the entry points of these inputs with the majority ofthe initial non-dissolved contaminants and sediment settling or captured in the south lake When thetwo lakes are connected during periods of high or extended rainfall overflow from the south lakefeeds into the northern lake taking materialscontaminants with it Should this condition persist thenoverflow continues out into the associated Slacks Creek and natural environment
Notably should a significant flood event occur waters can flow in the reverse direction due tothe higher flows and tidal influence forcing waters from Slacks Creek up into the catchment This hasoccurred on numerous occasions over the last 20 years In view of this and the general performanceof the lake system it represents a local focal point for understanding potential issues with watercontamination and flood mitigation
In addition the lake supports significant fish turtle and wetland bird populations The centreisland for example is a roosting sanctuary for several varieties of indigenous birds including largenumbers of ibis who contribute large volumes of faecal material to the lake waters Because of thisthe algal growth it has encouraged and the intermittent detection of significant Escherichia coli (E coli)numbers in lake waters Lake Ellerslie has signage preventing human use of the lake Any use of thelake water for local irrigation requires the water to be chlorinated first
Given this history and the local management situation Lake Ellerslie presents an ideal and locallyrelevant site for test deployments and systems testing In addition the lake has the following attributes
bull AccessibilityConveniencemdashThe lake is part of Griffith University Logan Campus No permits(beyond university approval) are required
bull 3G CoveragemdashThe lake is within range of 3G therefore remote monitoring of the lake can occurwithout using additional network infrastructure
bull Low-CostmdashAs no travel is involved it is relatively inexpensive to deploy and monitorSEMAT buoys
bull UnstudiedmdashSince the lake was constructed throughout 1995ndash2002 there have been nocomprehensive documented studies of the site (Except for an out dated Masters researchdissertation of the south lake from 1999 [38])
Sensors 2018 18 2248 18 of 23
42 Deployment and Environmental Study Results
SEMAT was awarded a Logan City Council EnviroGrant to undertake a study of Lake Ellersliefrom July 2017 to June 2018 During this period the project sought to achieve the SEMAT goals asoutlined in Section 22
Deployment 1mdashSystems Test
The first deployment occurred over five weeks throughout August 2017 involving five buoysThis was largely a systems test using a foam body and flexi-shaft as a precursor to the designsummarized in Section 3 The buoys took light readings (water surface and at 05 m depth) temperature(05 m depth) turbidity (05 m depth) and also measured system power status Readings weretransmitted every 15 min via the now obsolete 2G network The light and turbidity sensors were notcalibrated but used to test systems integration power management and communication strategiesThroughout this deployment the buoys went into a sleep state in between readingstransmissionsmdashbutnot all electronics could be powered down completely
Deployment 2mdashProduction Line and Calibration Test
The second deployment occurred over 10 weeks from March to June 2018 In addition to furthersystems testing this deployment involved significantly enhanced electronics and physical constructionThe actual buoy design was in line with the system and properties outlined in this paper using therevised integrated sensor head design The sensors were also calibrated to allow for focused accuracyand performance assessment A purpose designed printed circuit board was also utilized in this systemto reduce the complexity of the system In addition an improved power management methodologywas developed utilizing a smaller battery pack and the system was upgraded to the 3G network andtrialled a new sensor head design A dynamic systems model was created of the lake (see Figure 11)Turbidity data from the deployment was input into the dynamic systems model of the lake and usedto inform and validate the model to improve its predictive capability
Sensors 2018 18 x FOR PEER REVIEW 18 of 22
construction The actual buoy design was in line with the system and properties outlined in this paper
using the revised integrated sensor head design The sensors were also calibrated to allow for focused
accuracy and performance assessment A purpose designed printed circuit board was also utilized in
this system to reduce the complexity of the system In addition an improved power management
methodology was developed utilizing a smaller battery pack and the system was upgraded to the 3G
network and trialled a new sensor head design A dynamic systems model was created of the lake
(see Figure 11) Turbidity data from the deployment was input into the dynamic systems model of
the lake and used to inform and validate the model to improve its predictive capability
A high school innovation challenge was also undertaken in conjunction with the 2nd
deployment This involved 78 Year 10 students who were tasked with visualizing the data coming
from the sensor network in a more meaningful and intuitive manner The purpose of this innovation
challenge was to promote community engagement and ownership of environmental management
problems at the local level Some of the ideas put forward will be adopted by the SEMAT system and
documented in future publications
Figure 11 Lake Ellerslie Dynamic Systems Model
43 Evaluation of the Deployments and System Against SEMATrsquos Revised Design Goals
This section assesses how the system deployed in the Lake Ellerslie study performed against the
criteria for SEMATrsquos design goals as outlined in Section 22
1 Application-driven deployments and reportingmdashThe application was to investigate the function
of a lake and assess the keystone influences on lake water quality In light of the very limited historic
monitoring for lake waters the deployment was successful in describing water quality responses to
multiple weather events and to changes in human inputs over the study period
2 Low-costmdashTable 4 contrasts potentially similar research and commercially available buoys
against SEMAT The final material cost for the SEMAT buoy is approximately $154 USD The
approximate cost of the recycled components if purchased new would be around $50 A monthly
subscription to a telecommunications company for SIM data is $5 per month We used a cloud-based
server for our web hosting which costs $550 per month During the deployment we were able to
assess the sensitivity and accuracy of the applied sensors over varying water and operational
conditions to show that a low -cost approach to sensor selection is indeed sufficient for the task of
scientific monitoring
Figure 11 Lake Ellerslie Dynamic Systems Model
A high school innovation challenge was also undertaken in conjunction with the 2nd deploymentThis involved 78 Year 10 students who were tasked with visualizing the data coming from the sensornetwork in a more meaningful and intuitive manner The purpose of this innovation challenge wasto promote community engagement and ownership of environmental management problems at the
Sensors 2018 18 2248 19 of 23
local level Some of the ideas put forward will be adopted by the SEMAT system and documented infuture publications
43 Evaluation of the Deployments and System Against SEMATrsquos Revised Design Goals
This section assesses how the system deployed in the Lake Ellerslie study performed against thecriteria for SEMATrsquos design goals as outlined in Section 22
1 Application-driven deployments and reportingmdashThe application was to investigate the function ofa lake and assess the keystone influences on lake water quality In light of the very limited historicmonitoring for lake waters the deployment was successful in describing water quality responses tomultiple weather events and to changes in human inputs over the study period
2 Low-costmdashTable 4 contrasts potentially similar research and commercially availablebuoys against SEMAT The final material cost for the SEMAT buoy is approximately $154 USDThe approximate cost of the recycled components if purchased new would be around $50 A monthlysubscription to a telecommunications company for SIM data is $5 per month We used a cloud-basedserver for our web hosting which costs $550 per month During the deployment we were ableto assess the sensitivity and accuracy of the applied sensors over varying water and operationalconditions to show that a low-cost approach to sensor selection is indeed sufficient for the task ofscientific monitoring
Table 4 Price Comparison of SEMAT against Research and Commercial Buoys
Manufacturer Device Cost
Research BuoysSEMAT 2018 Buoy $154
Albaladejo et al 2012 [30] 2011 Buoy $395
Sadler et al 2017 [9] Telemeted Sensor System (not capableof deployment in water) $181
Cave Pearl Logger [10] Logging Device (no telemetry) $100GBROOS [14] $50000ndash$250000
Commercial Buoys
AXYS Technologies [24]
TRIAXYS Directional Wave BuoyTRIAXYS Wave and Current Buoy
TRIAXYS Mini Wave BuoyHydroLevel Buoy
Price only available upon request
Fondriest Environmental [25] NetSense Data Buoys $1495ndash$19995Aanderaa [26] SeaGuard Platform Price only available upon request
Fugro [27]SEAWATCH Wavescan Buoy
SEAWATCH Midi Buoy SEAWATCHBuoy SEAWATCH Mini II Buoy
Price only available upon request
Aridea [28] Libelium-Aridea Offshore Buoy Kit $13295
The cost for SEMAT does not take into account the research and development effort or thelogistical costs of deployment However unlike a commercial venture development outlays do notneed to be recovered This illustrates the importance and merit of using SEMATrsquos approach to researchand development using a combination of universities and social enterprise to distribute expenses byemploying resources that are part of ordinary work-related duties A more detailed analysis of theSEMAT production methodology is the subject of an ensuing publication (Note that a cost comparisonwith other research buoys is difficult as prices are generally not made available)
3 Minimal deployment expertisemdashThe proposed design allowed for easy deployment and recoveryof buoys Once a buoy was assembled in a controlled environment no on-site configuration wasrequired during deployment No special cranes or equipment were necessary (beyond a boat) fordeployment in contrast to other commercial and research proposals No diving was necessary Retrieval
Sensors 2018 18 2248 20 of 23
of the buoys post deployment only required detaching them from their moorings (note that themoorings were left in situ for future deployments)
4 The ability to adapt and evolvemdashThe modular and simple design allowed individual componentryto be updated based on technological advancements As the design is based on open sourcetechnologies it was not restricted to any proprietary product An example of this flexibility wasevidenced by the easy ability for the system to change from 2G to 3G for deployment 2
5 Remote interface data management and analysis toolsmdashWe provided a web-based interface andback-end data management system based on openly available software We also incorporated adynamic systems model for interpretation of the data The aforementioned high school challenge alsoallowed us to engage the community in the visualization and interpretation of the data to help educatethe students about how their actions impact upon water systems
6 RobustnessmdashDuring deployment 1 one buoy suffered water ingress four days after deploymentdue to an incorrectly fitted O-ring around the lid A second buoy highlighted the potential forinterference from externalities such as water birds and failed after 28 days Notably significantand intense storms occurred during the deployment period with associated winds and rainfallcreating a very robust and dynamic operational situation With this in mind and in view of thedata acquired from the remaining buoys the deployment was considered a success and proved thesystemrsquos viability overall
During deployment 2 one buoy suffered slight water ingress due to poor glue application whichaffected some components after two weeks of operation A second buoy ultimately failed after fourweeks due to losing battery charge from persistent bird deposits on the solar panel The mortality ratefor each deployment was around 40 (ie 2 out of 5) in terms of the number of buoys that did notlast the entire deployment duration Ideally for any size deployment over three months we wouldaspire to reduce the mortality rate to lt10 as the SEMAT system continues to evolve and becomesmore robust
In future deployments we intend to increase the number of buoys to determine how the networkperformance scales with size At present the function of each buoy is independent of the others(ie no reliance on the others for transmission) It is only the web server that is the central point forpotential congestion if too many devices are uploading data at the same time Given the small numberof devices and the asynchrony of the timing between buoys this situation was not an issue for theaforementioned deployments
7 TransferabilitymdashWe proposed an open source standard for SEMAT to allow other individuals toexpand upon this work and innovate around the design to ensure the project endures We alreadyhave a newer model of SEMAT developed which will be documented in a future publication
8 Small environmental footprintmdashThe buoys used 40 recycledupcycled e-waste components inthe form of recycled laptop batteries and salvaged ABS plastic for 3D printer filament After the buoysfrom the deployment were retrieved many of the electronics components were salvageable and the 3Dprinted components could be recycled back into new 3D printer filament
5 Conclusions
This paper presents the latest developments for the SEMAT project from a technologicalperspective and discusses a new community engagement paradigm for the development ofenvironmental monitoring systems We proposed the key goals for low-cost aquatic environmentalmonitoring analysed the core hardware and software systems and presented a reproducible and simpledesign for SEMAT environmental monitoring buoys Furthermore the system has been developedusing upcycled e-waste components and engages the community in its production through socialenterprise such that its environmental footprint is greatly reduced and its gains extend beyond thetechnical and data domains to deliver social and economic benefits
The latest SEMAT buoys have been tested in a peri-urban lake setting to monitor water qualityover several months as impacted by a nearby motorway car park golf course and residential properties
Sensors 2018 18 2248 21 of 23
The field test demonstrates that the latest SEMAT buoys are well suited to this type of applicationand represent a validated niche technology that meets key stakeholder needs This bodes well for thefuture of water quality monitoring across previously unaffordable geographic scales suited to a widerrange of key stakeholders in the environmental management arena Further because of its low costand potential for wider community uptake workshops associated with the reported deployment haveshown how effective the system is as an awareness and engagement tool for schools and the associatedcommunity networks In this context the SEMAT sensor network system has met all of the goals setfor it to date
Future work involves refining the electrical subsystems and physical design and the definition ofa standard for a cleaning mechanism Further field studies are planned as a combination of researchlocal government and private sector-based projects that will expand our operational experience andfurther refine systems design and performance
Author Contributions Conceptualization JT and RJ Methodology JT and RJ SoftwareHardware JTValidation JT and RJ Visualization JT and RJ Investigation JT and RJ Writing Original Draft PreparationJT and RJ Writing Review and Editing JT and RJ Project Administration JT and RJ Funding AcquisitionJT and RJ
Funding This work was supported in part by the Logan City Council EnviroGrant scheme Griffith UniversityInstitute of Integrated and Intelligent Systems and the University of Queensland School of Earth andEnvironmental Sciences
Acknowledgments We would personally like to thank the following Ian Trevathan Tony Sharp Simon SmidkeHeather Gray Lesley Chenoweth Jun Zhou Sharyn Morrow Tony Chiffings John Sharp Clive Nunn Luke HandsJoan Culverhouse Jodi Krueger Barnaby Resch Katie Everett Britt Rogers Joshua Hughes Julie McDonald andall those who directly and indirectly helped to make this project a success
Conflicts of Interest The authors declare no conflict of interest
References
1 World Health Organization Guidelines for Drinking-Water Quality World Health Organization GenevaSwitzerland 2004 Volume 1
2 Hamilton GS Fielding F Chiffings A Hart BT Johnstone RW Mengersen KR Investigating the useof a Bayesian Network to Model the Risk of Lyngbya majuscula Bloom Initiation in Deception Bay QueenslandAustralia Hum Ecol Risk Assess 2007 13 1271ndash1287 [CrossRef]
3 Lovett GM Burns DA Driscoll CT Jenkins JC Mitchell MJ Rustad L Haeuber R Who needsenvironmental monitoring Front Ecol Environ 2007 5 253ndash260 [CrossRef]
4 Salvatore M McCabe MF Miller PE Lucas R Madrigal VP Mallinis G Dor EB On the Use ofUnmanned Aerial Systems for Environmental Monitoring Remote Sens 2018 10 641 [CrossRef]
5 Johnstone R Caputo D Cella U Gandelli A Alippi C Grimaccia F Zich RE Smart EnvironmentalMeasurement amp Analysis Technologies (SEMAT) Wireless sensor networks in the marine environment InProceedings of the Wireless Sensor and Actuator Network Research on Opposite Sides of the Globe (SENSEI)Stockholm Sweden 9 June 2008
6 Alippi C Camplani R Galperti C Roveri M A robust adaptive solar-powered WSN framework foraquatic environmental monitoring IEEE Sens J 2011 11 45ndash55 [CrossRef]
7 Trevathan J Atkinson I Read W Bajema N Lee YJ Scarr A Johnstone R Developing low-costintelligent wireless sensor networks for aquatic environments In Proceedings of the 2010 Sixth InternationalConference on Intelligent Sensors Sensor Networks and Information Processing (ISSNIP) Brisbane QLDAustralia 7ndash10 December 2010 pp 13ndash18
8 Trevathan J Johnstone R Chiffings T Atkinson I Bergmann N Read W Stevens T SEMATmdashThenext generation of inexpensive marine environmental monitoring and measurement systems Sensors 201212 9711ndash9748 [CrossRef] [PubMed]
9 Sadler JM Ames DP Khattar R A recipe for standards-based data sharing using open source softwareand low-cost electronics J Hydroinform 2015 20 jh2015092 [CrossRef]
10 Website The Cave Pearl Project Available online httpsedwardmallonwordpresscomaboutabout-me(accessed on 11 October 2017)
Sensors 2018 18 2248 22 of 23
11 Cucchiella F DrsquoAdamo I Gastaldi M Koh SL Rosa P A comparison of environmental and energeticperformance of European countries A sustainability index Renew Sustain Energy Rev 2017 78 401ndash413[CrossRef]
12 Albaladejo C Saacutenchez P Iborra A Soto F Loacutepez JA Torres R Wireless sensor networks foroceanographic monitoring A systematic review Sensors 2010 10 6948ndash6968 [CrossRef] [PubMed]
13 Hill K Moltmann T Proctor R Allen S The Australian Integrated Marine Observing System Deliveringdata streams to address national and international research priorities Mar Technol Soc J 2010 44 65ndash72[CrossRef]
14 Bainbridge S Steinberg C Furnas M GBROOSmdashAn ocean observing system for the Great Barrier ReefIn Proceedings of the 11th International Coral Reef Symposium Fort Lauderdale FL USA 7ndash11 July 2008National Coral Reef Institute Nova Southeastern University Fort Lauderdale FL USA 2010 pp 529ndash533
15 Seders LA Shea CA Lemmon MD Maurice PA Talley JW LakeNet An integrated sensor networkfor environmental sensing in Lakes Environ Eng Sci 2007 24 183ndash191 [CrossRef]
16 Guo Z Hong F Feng H Chen P Yang X Jiang M OceanSense Sensor Network of RealtimeOcean Environmental Data Observation and Its Development Platform In Proceedings of the 3rd ACMInternational Workshop on UnderWater Networks San Francisco CA USA 15 September 2008 pp 101ndash105
17 Voigt T Osterlind F Finne N Tsiftes N He ZT Eriksson J Dunkels A Bamstedt U Schiller JHjort K Sensor Networking in Aquatic Environments Experiences and New Challenges In Proceedings ofthe 32nd IEEE Conference on Local Computer Networks Dublin Ireland 15ndash18 October 2007 pp 793ndash798
18 OrsquoFlynn B Bellis S Mahmood K Morris M Duffy G Delaney K OrsquoMathuna C A 3D miniaturisedprogrammable transceiver Microelectron Int 2005 22 8ndash12 [CrossRef]
19 Ruberg SA Muzzi RW Brandt SB Lane JC Miller TC Gray JJ Constant SA Downing EJA Wireless Internet-Based Observatory The Real-time Coastal Observation Network (ReCON) In Proceedingsof the IEEE Conference OCEANS Vancouver BC Canada 29 Septemberndash4 October 2007 pp 1ndash6
20 Consi TR Anderson G Barske G Bootsma H Hansen T Janssen J Klump V Paddock RSzmania D Verhein K et al Real time observation of the thermal bar and spring stratification of LakeMichigan with the GLUCOS coastal observatory In Proceedings of the IEEE Conference OCEANS QuebecQC Canada 15ndash18 September 2008 pp 1ndash9
21 Akyildiz IF Su W Sankarasubramaniam Y Cayirci E Wireless sensor networks A survey Comput Netw2002 38 393ndash422 [CrossRef]
22 Oliveira LM Rodrigues JJ Wireless Sensor Networks A Survey on Environmental Monitoring JCM 20116 143ndash151 [CrossRef]
23 Atzori L Iera A Morabito G The Internet of Things A survey Comput Netw 2010 54 2787ndash2805[CrossRef]
24 Website AXYS Technologies Available online wwwaxystechnologiescom (accessed on 8 March 2018)25 Website Fondriest Environmental Available online wwwfondriestcom (accessed on 8 March 2018)26 Website Aanderaa Available online wwwaanderaacom (accessed on 8 March 2018)27 Website Fugro Available online wwwfugrocom (accessed on 8 March 2018)28 Website Aridea Available online wwwthe-iot-marketplacecomlibelium-aridea-offshore-buoy-kit (accessed
on 8 March 2018)29 Hanington P Rose A Johnstone R The potential of benthic iron and phosphorus fluxes to support the
growth of a bloom forming toxic cyanobacterium Lyngbya majuscula Moreton Bay Australia Mar FreshwRes 2016 67 1918ndash1927 [CrossRef]
30 Albaladejo C Soto F Torres R Saacutenchez P Loacutepez JA A low-cost sensor buoy system for monitoringshallow marine environments Sensors 2012 12 9613ndash9634 [CrossRef] [PubMed]
31 Lockridge G Dzwonkowski B Nelson R Powers S Development of a low-cost Arduino-based sonde forcoastal applications Sensors 2016 16 528 [CrossRef] [PubMed]
32 Bergmann NW Juergens J Hou L Wang Y Trevathan J Wireless underwater power and data transferIn Proceedings of the 38th Conference on Local Computer Networks Workshops (LCN Workshops) SydneyAustralia 21ndash24 October 2013 pp 104ndash107
33 Lee YJ Trevathan J Atkinson I Read W The Integration Analysis and Visualization of Sensor Datafrom Dispersed Wireless Sensor Network Systems Using the SWE Framework J Telecommun Inf Technol2015 4 86ndash97
Sensors 2018 18 2248 23 of 23
34 Trevathan J Hamilton L Read W Allocating sensor network resources using an auction-based protocolJ Theor Appl Electron Commer Res 2016 11 41ndash63 [CrossRef]
35 Borzaga C Defourny J (Eds) The Emergence of Social Enterprise Psychology Press Hove UK 2004Volume 4
36 Taylor J Capel T Vyas D Sharp T Facilitating digital participation through design projects witheconomically-marginalized communities In Proceedings of the Workshop Digital Participation EngagingDiverse and Marginalised Communities Launceston Australia 29 Novemberndash2 December 2016
37 OrsquoFlynn B Regan F Lawlor A Wallace J Torres J OrsquoMathuna C Experiences and recommendations indeploying a real-time water quality monitoring system Meas Sci Technol 2010 21 124004 [CrossRef]
38 Chowdhury FH Lake EllersliemdashA Study MSc Dissertation Griffith University Logan QueenslandAustralia 1999
copy 2018 by the authors Licensee MDPI Basel Switzerland This article is an open accessarticle distributed under the terms and conditions of the Creative Commons Attribution(CC BY) license (httpcreativecommonsorglicensesby40)
- Introduction
- Developing Low-Cost Remote Aquatic Environmental Monitoring Systems
-
- Problem Motivation and Related Work
- SEMATrsquos Design Goals (Revisited)
- The Need for an Open Standard for Constructing Environmental Monitoring Systems
- Engaging the Community in Production and Education through Social Enterprise
-
- An Open Standard System for Low-Cost Remote Aquatic Environmental Monitoring
-
- System Architecture
- Physical Components of a SEMAT Buoy
- Electronics Subsystems of a SEMAT Buoy
-
- Microcontroller Subsystem
- Power Subsystem
- Solar Charging Subsystem
- Timing Subsystem
- Sensor Subsystem
- Communications Subsystem
- Cleaning Subsystem
-
- User Interface
-
- Environmental Study and Field Test Deployments
-
- Lake Ellerslie
- Deployment and Environmental Study Results
- Evaluation of the Deployments and System Against SEMATrsquos Revised Design Goals
-
- Conclusions
- References
-
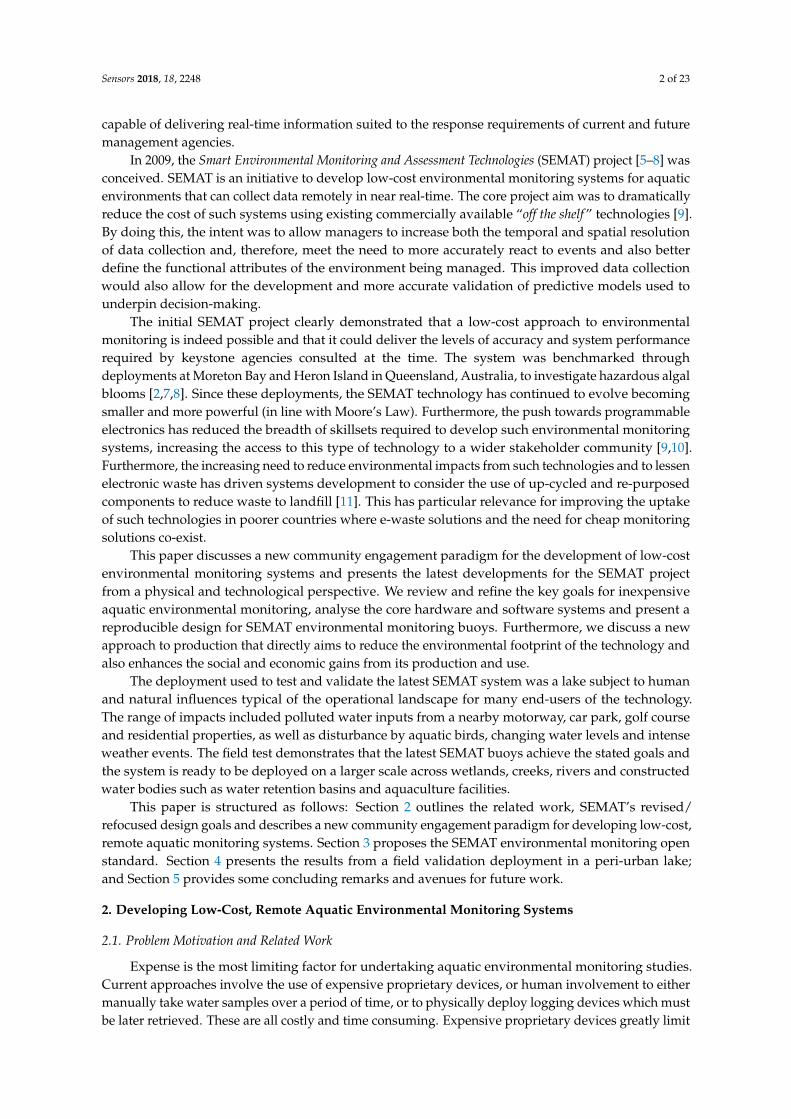
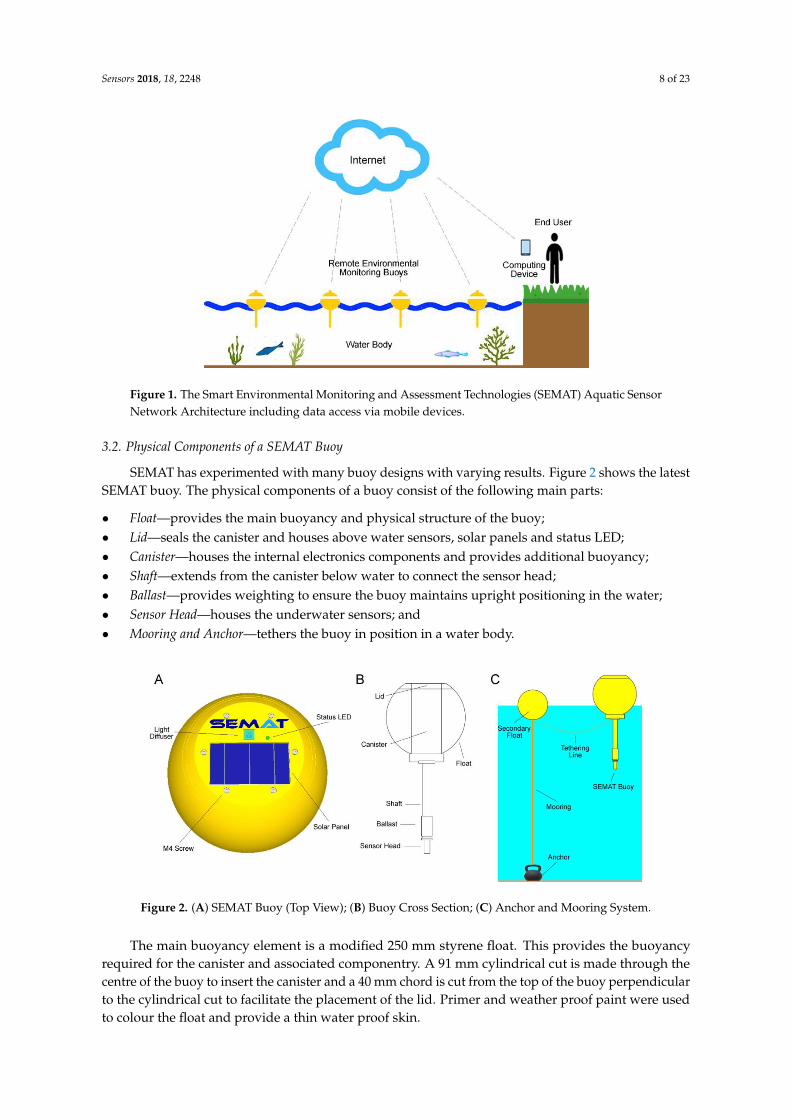
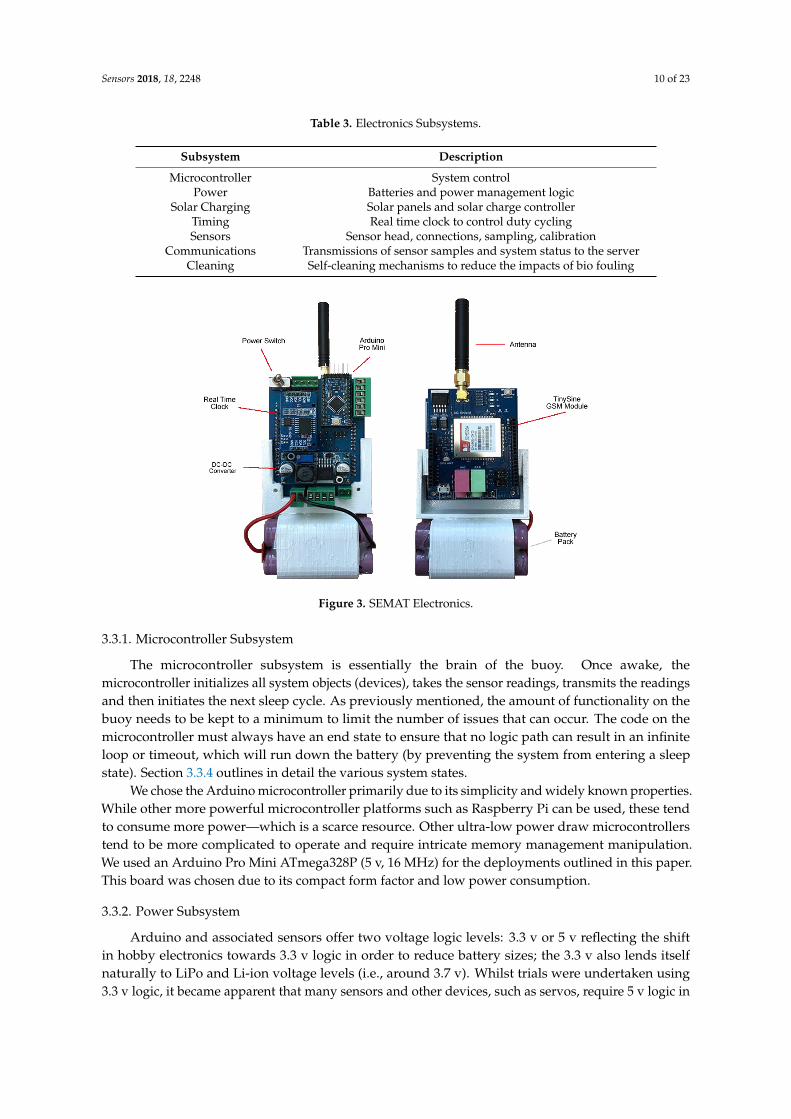
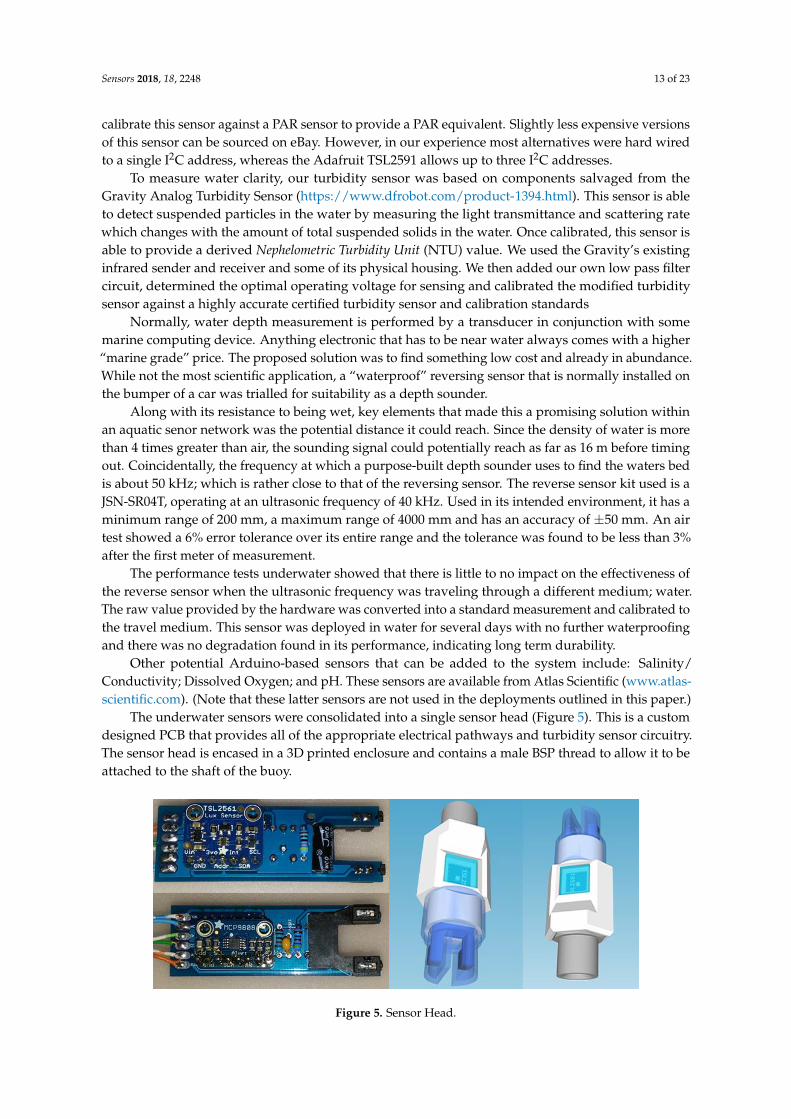