smart growth and economic prosperity: a sourcebook part ii created by smart growth america with...
TRANSCRIPT
Smart Growth and Economic Prosperity: A Sourcebook
Part IICreated by Smart Growth America
with generous support from the William Penn FoundationSeptember, 2010
Two Basic Economic Argumentsfor Smart Growth
1.Smart growth saves money.
2.Smart growth makes money.
2
What is Smart Growth?
• Development and redevelopment in or adjacent to existing cities, towns and villages.
• A mix of uses in one neighborhood and a more compact pattern overall to support more economic and social activity.
• Roads and public spaces designed to support convenient transportation choices.
3
Smart Growth PromotesEconomic Growth
• Attracts private investment• Attracts employers and workers• Supports small businesses• Improves access to jobs• Increases property values• Provides greater stability in times of economic
uncertainty and rising energy costs• Responsive to demographic shifts
4
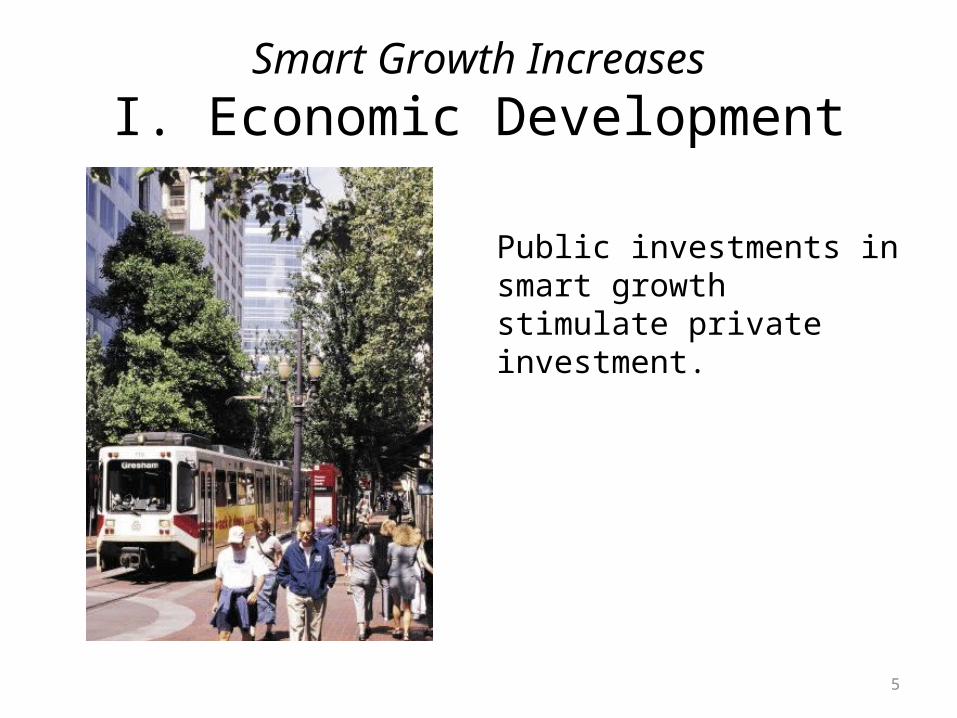
Smart Growth IncreasesI. Economic Development
Public investments in smart growth stimulate private investment.
5
See “Case Studies” for Examples
6
Smart Growth IncreasesI. Economic Development

Smart Growth PromotesVibrant Economies
• Quality-of-place investments give regions a competitive advantage in the new global economy.
• Economic development that incorporates smart growth strategies is more successful at attracting and retaining a talented workforce and new business.
7
Smart Growth II. Attracts Talent
• In the last U.S. census, almost two-thirds (64%) of college-educated 25- to 34-year-olds said they looked for a job after they chose the city where they wanted to live.
• Regions with a competitive advantages are those that can generate, retain and attract the best talent.
8
Attracting Talent:Generation Y Demands Clean, Green
Places• CEOs for Cities conducted focus groups of
college-educated recent movers in the 25 to 34 year-old age group & found a consistent theme:
“They want to live in places that they can be proud of, part of, and that are clean and green”
9
Attracting Talent:Young Professionals Demand…
• Opportunities for social interaction;• Environmental quality—literally, the quality of
one’s surroundings, including both the built and natural environment;
• Abundance of cultural amenities;• Transportation options, including convenient
public transportation.
10
Smart Growth DrawsIII. Successful Businesses
• Blockbuster Entertainment cited the Dallas Area Rapid Transit as a major factor in establishing its headquarters in the central business district near Akard Station. The relocation brought 1,000 employees downtown.
• Software company Fast Enterprises chose Denver over 36 other cities for its headquarters location. The company sought a location near a transit stop with coffee shops and restaurants nearby. Fast Enterprises began hiring software engineers at an average salary of $82,000.
11

Smart Growth DrawsSuccessful Businesses
• United Airlines chose to move its operational headquarters from the Illinois suburb of Elk Grove to downtown Chicago.
• Quicken Loans moved 1700 of its employees to downtown Detroit in August, 2010. The company located its workplace next to the city’s premiere active public space, Campus Martius, which recently received an award as the most outstanding example of a public open space.
• Blue Cross of Michigan has plans to move 3,000 workers to downtown Detroit in mid-2011.
12
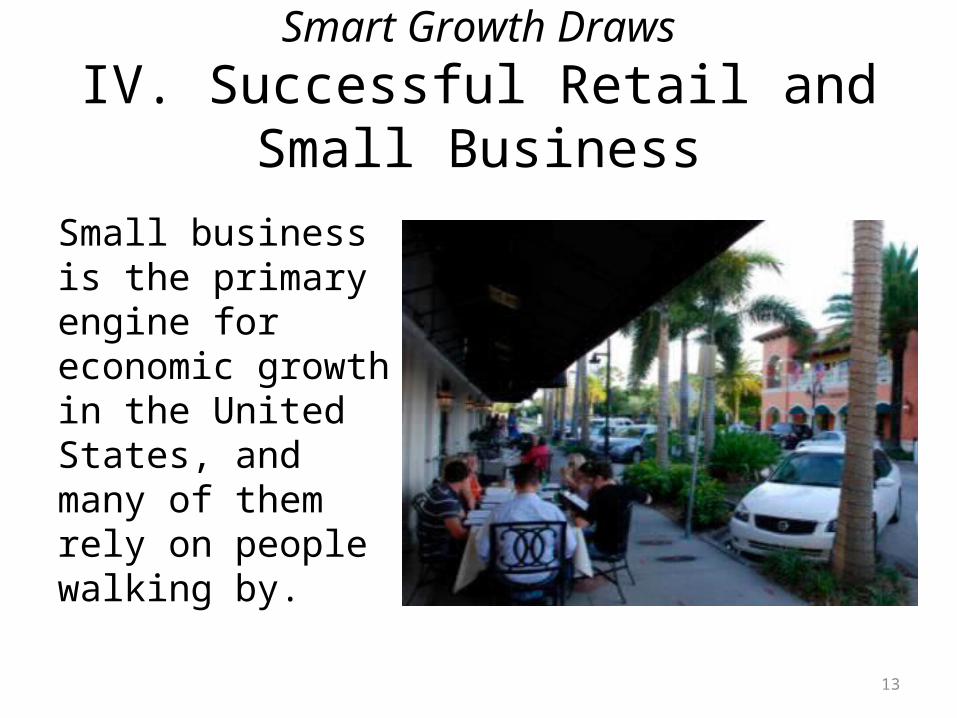
Smart Growth DrawsIV. Successful Retail and Small
Business
Small business is the primary engine for economic growth in the United States, and many of them rely on people walking by.
13
Case Study: Lodi, CA
Walkability Attracts and Sustains Small Business
• Town of 60,000 launched $4.5M pedestrian-oriented project
• Sidewalks widened, intersection curb bulb-outs, street trees, lighting, benches
• Helped attract 60 new businesses, decrease vacancy rate from 18% to 6% and increase downtown sales tax revenue 30%
14
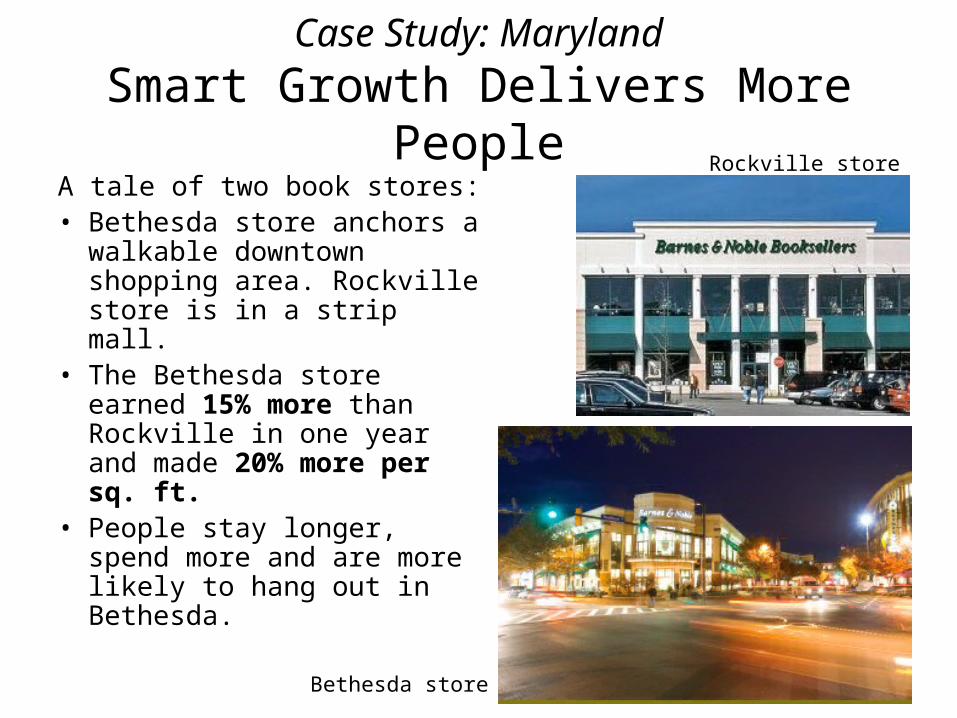
Case Study: MarylandSmart Growth Delivers More People
A tale of two book stores:• Bethesda store anchors a
walkable downtown shopping area. Rockville store is in a strip mall.
• The Bethesda store earned 15% more than Rockville in one year and made 20% more per sq. ft.
• People stay longer, spend more and are more likely to hang out in Bethesda.
15
Rockville store
Bethesda store

Smart Growth Makes Money ByV. Bringing People Together
The competitive advantages of bringing people and businesses closer together include•Larger markets allow producers to specialize, reducing costs;•Increased creativity results from exposure to new ideas and perspectives;•Increases access to labor markets; and•Increases rate of knowledge transfer.
16
Smart Growth PromotesProductivity and Innovation
• Doubling employment density improves productivity by about 6%.
• Doubling of population density also improves productivity by about 6%.
• Doubling employment density in urban areas increases patent activity by 20%.
17
Case Study: Cambridge, MABio-tech Firms Cluster in Kendall Square
• Over 150 biotech firms have located as close as possible to Kendall Square (adjacent to MIT) because of:– Access to pool of talented labor– Connections to research institutions and hospitals– Creation of specialized institutions that provide
services to biotech firms– Access to information/ease of information
transfer
18
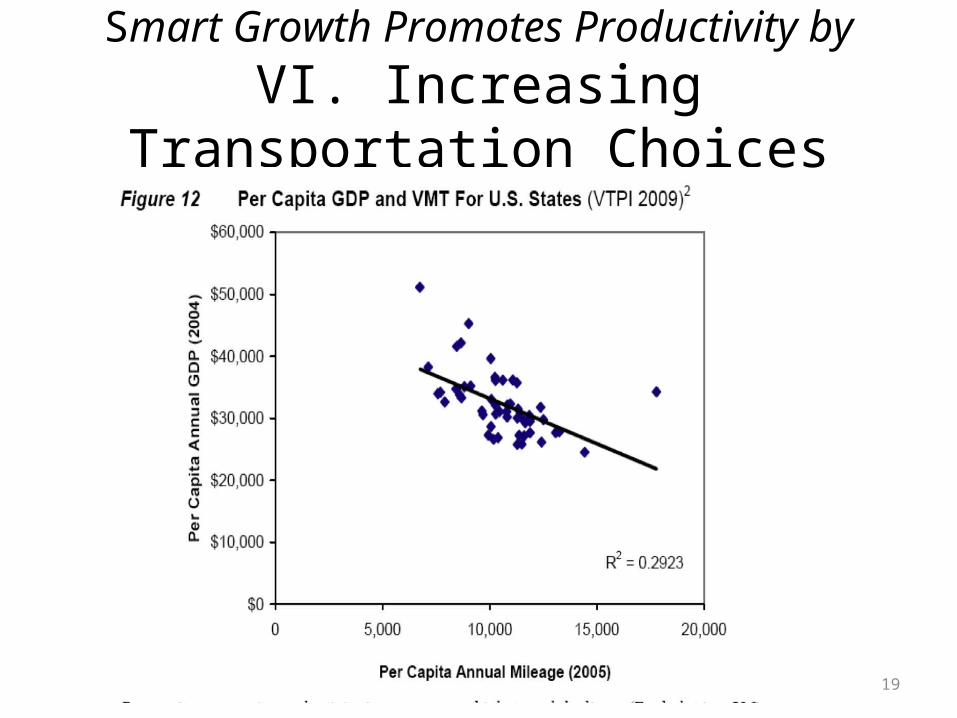
Smart Growth Promotes Productivity byVI. Increasing Transportation Choices
19
Smart Growth Promotes Stronger Economies by Saving Money
on Transportation• Reducing driving by one mile per day per person in
each of the 51 largest metro areas would produce an aggregate annual household savings on direct transportation costs of $29 billion annually ($40 billion when the time value is included).
• In most regions in the county, only a fraction of the money spent on gas and vehicles stays in the local economy. Building more compact, transit oriented communities not only creates value and leverages investment, it assures that more of the savings flows back into the local economy.
20
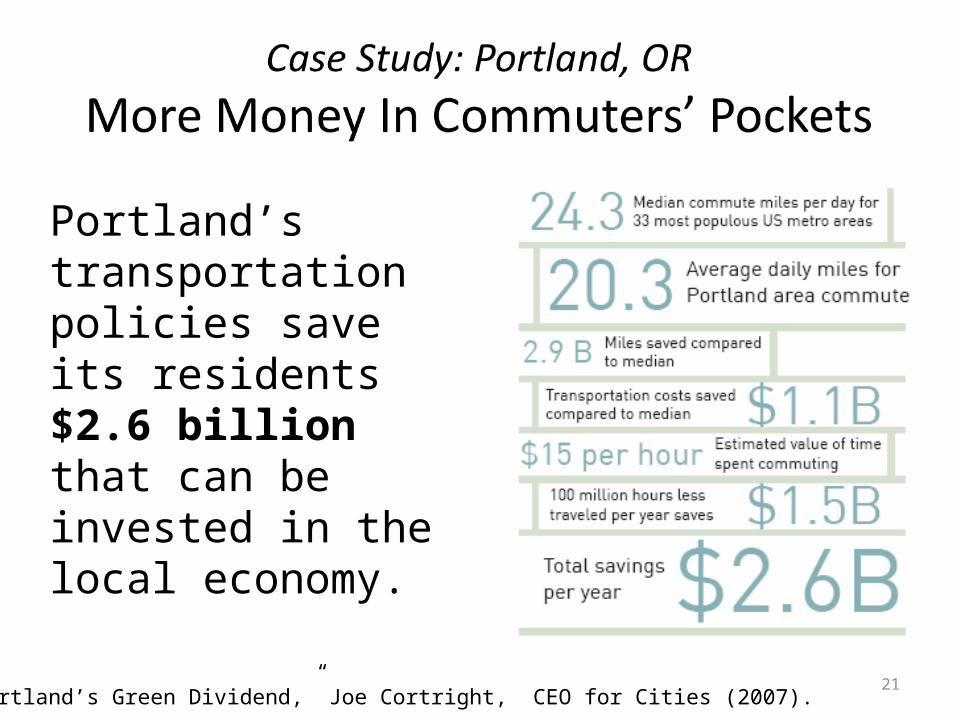
Portland’s transportation policies save its residents $2.6 billion that can be invested in the local economy.
Source: “Portland’s Green Dividend,” Joe Cortright, CEO for Cities (2007).21
Case Study: Chicago, ILMore Money in Commuters’ Pockets
Chicago commuters drive 2.1 miles less than the national average, which translates into direct household savings of $2.3 billion, of which about $2 billion is available to be reinvested in the local economy.
22
Case Study: WisconsinMore Money in Taxpayers’ Pockets
• Public transit use saves Wisconsin riders and taxpayers $730.2 million annually.
• As riders spend their out-of-pocket savings elsewhere, the estimated total indirect effect on the economy includes $1.1 billion in total output, $163.3 million in tax revenue, and 11,671 new jobs created.
23
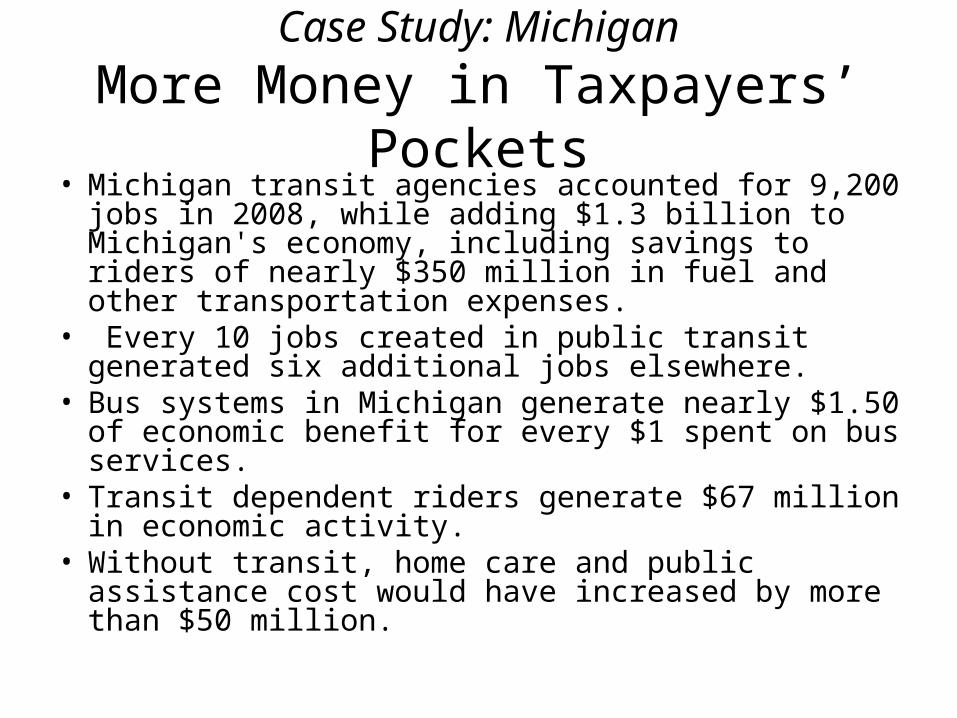
Case Study: MichiganMore Money in Taxpayers’ Pockets
• Michigan transit agencies accounted for 9,200 jobs in 2008, while adding $1.3 billion to Michigan's economy, including savings to riders of nearly $350 million in fuel and other transportation expenses.
• Every 10 jobs created in public transit generated six additional jobs elsewhere.
• Bus systems in Michigan generate nearly $1.50 of economic benefit for every $1 spent on bus services.
• Transit dependent riders generate $67 million in economic activity.
• Without transit, home care and public assistance cost would have increased by more than $50 million.
Smart Growth PromotesVII. Strong Metropolitan Economies
Regions work best with strong central cities. They serve as•Hubs for critical infrastructure networks;•Centers of government, hospitals and schools;•Primary employment centers; and•Primary engines of innovation and economic growth.
25

Smart Growth PromotesRegional Access
Increasing regional accessibility• Reduces unemployment and underemployment
by providing access to jobs;• Spurs local and small business creation by
providing access to retail, recreation and entertainment opportunities; and
• Increases productivity by reducing traffic congestion, delays, productivity losses, accidents and pollution.
26

Smart GrowthVIII. Creates More Jobs
27

Smart Growth Creates Jobsthrough Fix-It-First Investment Policies
Category Direct and Indirect
Plus Induced Domestic Content of Inputs
Energy 11,705 16,763 89.4%
Transportation 13,829 18,930 96.8
Average Roads and Bridges
13,714 18,894 96.8
New Construction 12,638 17,472 96.7
Repair Work 14,790 20,317 96.9
Rail 9,932 14,747 96.9
Mass Transit 17,784 22,849 96.7
Aviation 14,002 19,266 96.9
Inland Waterways 17,416 23,784 97.3
School Buildings 14,029 19,262 96.9
Water 14,342 19,769 96.9
Employment Impacts per $1 Billion in Infrastructure Spending.
28
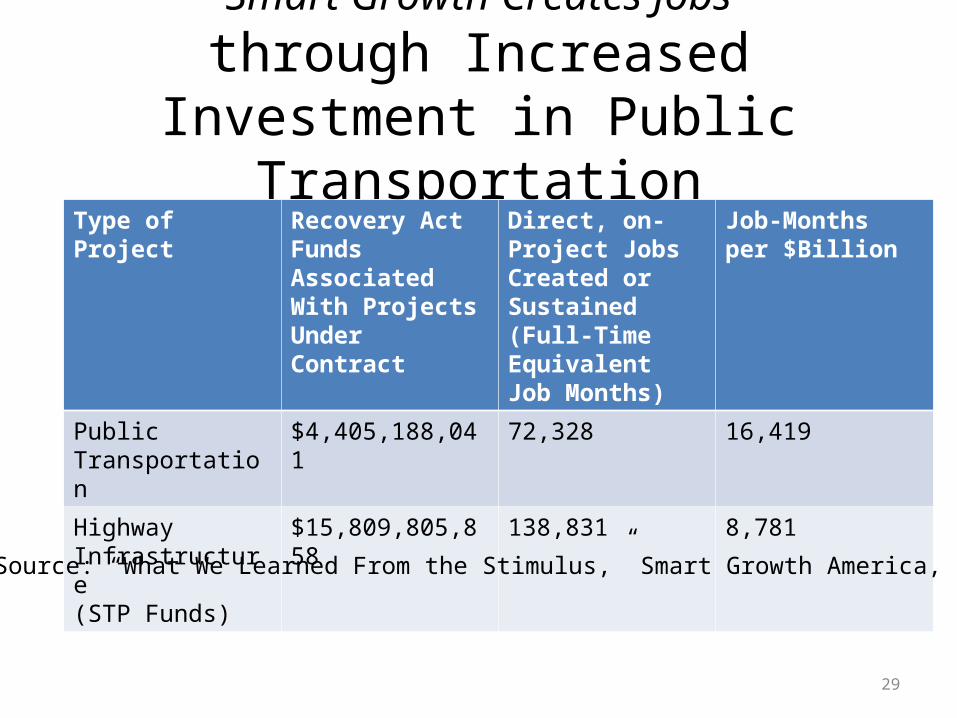
Smart Growth Creates Jobsthrough Increased Investment in
Public TransportationType of Project Recovery Act Funds
Associated With Projects Under Contract
Direct, on-Project Jobs Created or Sustained (Full-Time Equivalent Job Months)
Job-Months per $Billion
Public Transportation
$4,405,188,041 72,328 16,419
Highway Infrastructure(STP Funds)
$15,809,805,858 138,831 8,781
Source: “What We Learned From the Stimulus,” Smart Growth America, 2010
29

Smart Growth Creates Jobsthrough Investment in Rail
Infrastructure• Rail investments create more jobs per dollar spent than highway
investments because more of the money goes to labor-intensive products like rail cars and track rather than land.
• $1 billion of rail capital investment creates about 7,800 green jobs.• Including the re-spending effects, $1 billion of rail investments
creates between 12,300 to 26,600 total jobs.• Rail capital investments create and sustain proportionately more
medium-wage jobs - and fewer low-wage jobs - compared to the broader economy.
• Rail capital investments benefit those hardest hit by the recession, providing a higher proportion of employment to workers without a college degree.
30
Smart Growth Creates Jobsby Improving Access to Jobs
• Unskilled workers are often concentrated in center cities or scattered in outlying suburbs. Because of the lack of public transportation, these workers are isolated from new job centers.
• In some metropolitan areas, lack of access to jobs can actually contribute simultaneously to both labor shortages and unemployment or underemployment.
• These access issues create a drag on regional economies.
31
Smart Growth Creates Jobsby Increasing Transit Access
• Increasing transit frequency provides access to 10 times more jobs for low income workers within the same travel time.
• Increasing transit accessibility to jobs reduces time spent on welfare.
32
Regional AccessImproves Returns on Transit
Investments• Every $1 invested in reverse commute transit
services provides $1.90 in benefits to the average user and $1.50 to society. That’s a return of 340%, and reflects increases in salaries, increased income tax revenues, money saved on social services and avoided external costs of using other forms of transportation.
33
Case Study: WisconsinBenefits of Improved Access to Jobs
By providing better access to jobs, including access to higher paying jobs, public transit programs in Wisconsin saved the state $74 million on employment-related social service costs.
34
Smart Growth PromotesIX. Stability In Times Of Economic
Uncertainty
• Smart growth development holds value better in down-markets.
• Foreclosure risk decreases with proximity to core urban areas and transit nodes.
• Construction downturns in urban areas are less pronounced.
• Risks from rising energy prices are reduced.• Agricultural and forestry base is maintained, which
contributes to diversified economies.• Efficient use of infrastructure capacity reduces fiscal impact
of economic downturns.
35
Smart Growth PromotesStable Property Values
“[T]he subprime crisis was most pronounced in places where poorer people could afford to buy—largely in the distant suburbs where land was cheap and builders were active. In the past decade, empty-nesters and young professionals have returned to cities and have shown a willingness to pay a premium to be close to their offices and to stores, coffee shops, bars, music venues, and other entertainment. Downtowns have come to life while suburban malls are struggling.”
Source: “The Unraveling of the Suburban Fringe,” Bloomberg Business Week, July 12, 2008.
36
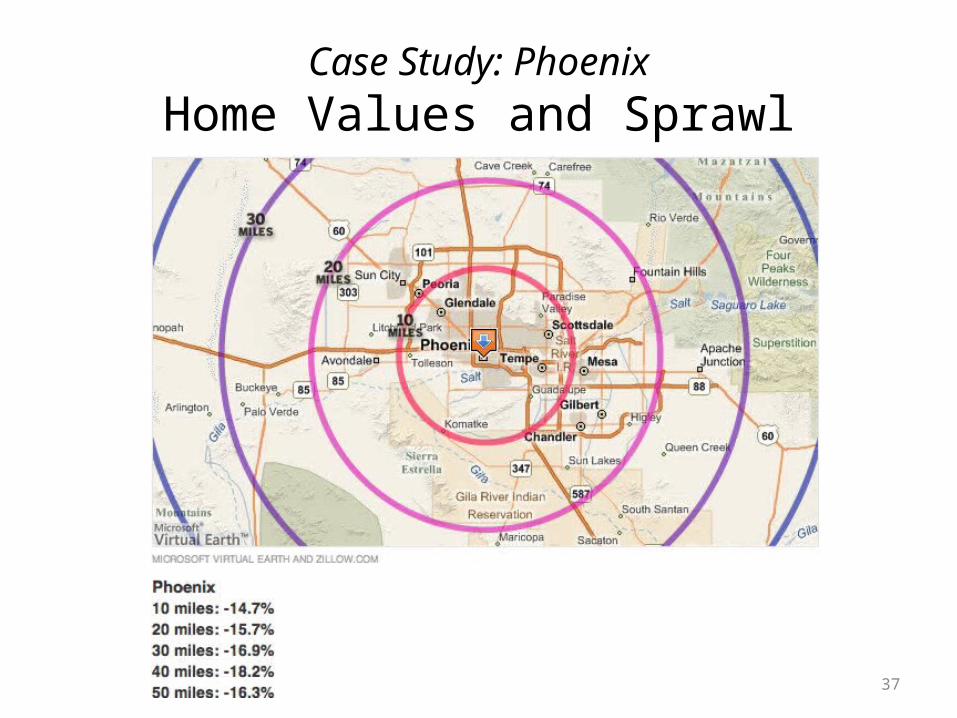
Case Study: PhoenixHome Values and Sprawl
37
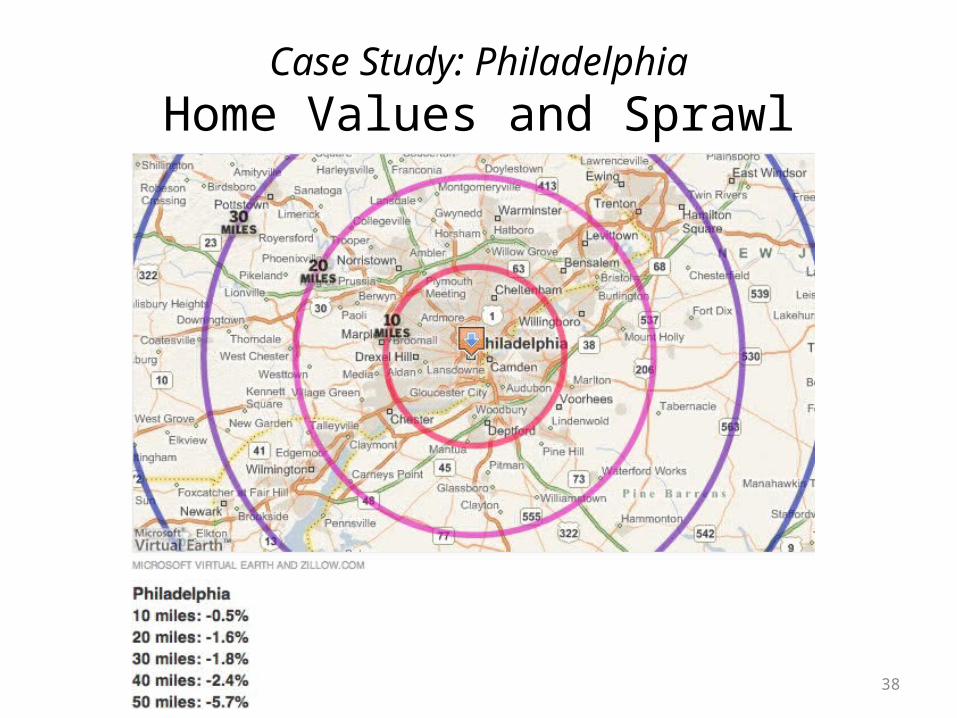
Case Study: PhiladelphiaHome Values and Sprawl
38
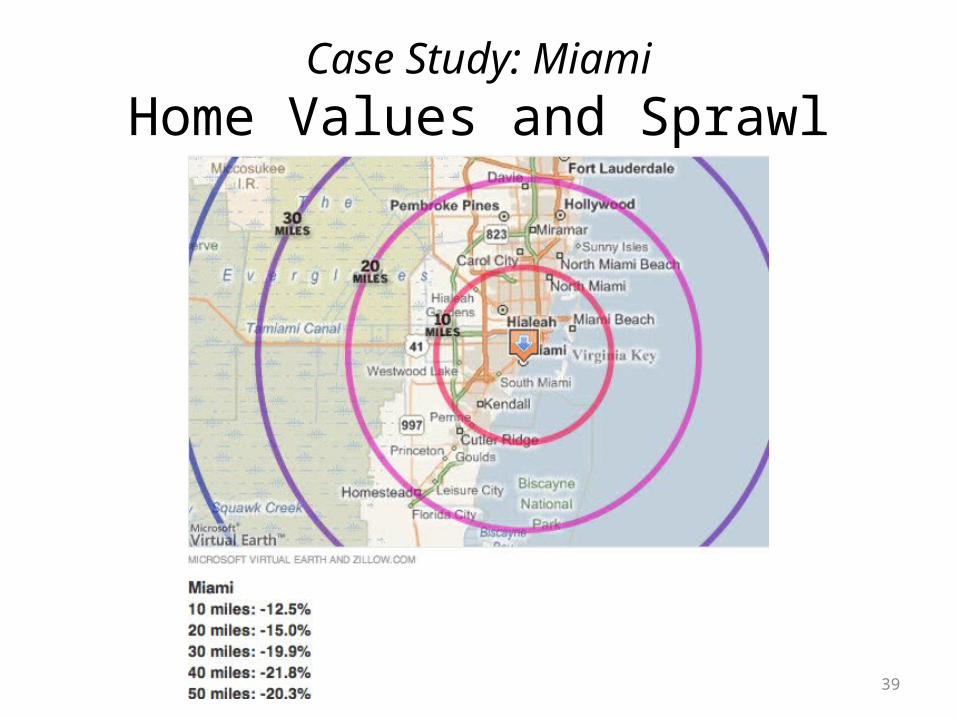
Case Study: MiamiHome Values and Sprawl
39
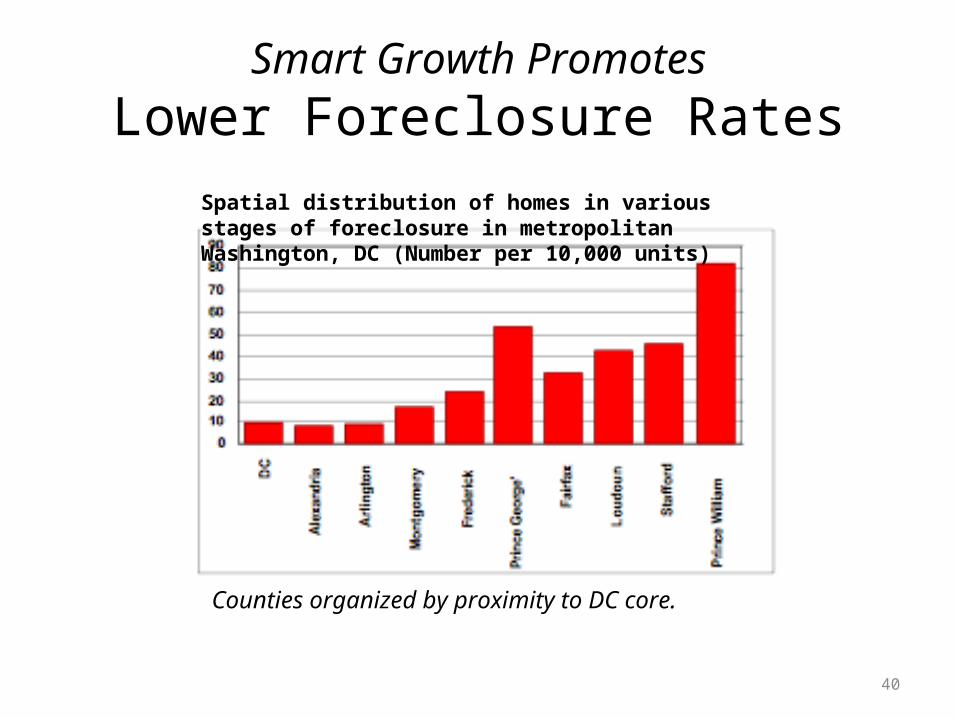
Smart Growth PromotesLower Foreclosure Rates
40
Spatial distribution of homes in various stages of foreclosure in metropolitan Washington, DC (Number per 10,000 units)
Counties organized by proximity to DC core.

Smart Growth PromotesStable Property Values
41
Change in single-family home prices between 2005 and 2007.
Smart Growth NeighborhoodsX. Meet Market Demand
• Consumer surveys consistently show that about one-third of the current home buying market wants the smart growth product.– Demand varies according to geography, age of respondents, and
household status (eg. single, growing family, etc.).
• To meet this demand, about 600,000 units in smart growth neighborhoods would need to be produced annually nationwide.– It is difficult to measure actual production, but real estate experts
conclude that far fewer units come on the market each year.
Source: EPA White Paper: The Market for Smart Growth. Gregg Logan, Robert Charles Lesser & Co. 2007.42

Buyers Prefer Smart Growth
• 55% preferred Community B vs. Community A.• Percent increased to 61% of those thinking of
buying in next 3 years.
Source:Belden Russonello & Stewart, National Community Preference Survey, National Association of Realtors ® and Smart Growth America (2004)
43
Community A: standard suburban development: large lots, no sidewalks, amenities a few miles away, commutes to work of 45 minutes or more, no public transport
Community B: TOD-based, mix of unit types, sidewalks, shopping, schools within walking distance, commutes less than 45 minutes, high-quality transit.
Buyers Prefer Smart Growth
• Downtown and in-town housing has topped the list of hot markets for the ULI Emerging Trends in Real Estate for several years.
• In 2003, sales price per sq. ft. for attached housing was higher than for detached housing for the first time in history.
44
Smart Growth NeighborhoodsMeet the Needs of Older Americans
• A 2008 AARP poll found that 44% of elderly say that they do not have enough access to public transportation.
• 54% said that they would walk, bicycle and take transit more if their streets were improved.
• In 2000, 71% of elderly polled indicated transit access was a priority.
45

Continued sales of low-density, single-use subdivisions are not evidence that it is the only product buyers want.•“People will accept the product they’re offered if they have no other options.” •“If a builder or developer offers choices that better meet consumer preferences, they will have an advantage over other providers, especially where supply is limited as with smart growth products.”
Smart Growth Neighborhoods:Limited Supply
46Source: EPA White Paper: The Market for Smart Growth. Gregg Logan, Robert Charles Lesser & Co. 2007.
Smart Growth NeighborhoodsMeet the Coming Demand
• The US will add about 100 million people in the next 20 years, or about 40 million new households. 35 million households (about 88%) will not have children and about 13 million, or about 1/3, of these new households will be single person households
• By 2025, the demand for attached and small-lot housing will exceed the current supply by 35 million units (71%), while demand for large-lot housing will fall short of current supply.
• By 2030, there will be about 363 million people and at least half of them will want to live near transit.
• These projections were made prior to the recent fluctuations in energy prices and the housing crisis.
47

Smart Growth NeighborhoodsMeet the Needs of Today’s
Households
48Chart Source: National Association of REALTORS training, Smart Growth for REALTORS, Elizabeth Schilling (forthcoming)
Households are smaller and more fluid, with fewer households composed of married couples with or without children. Yard size and schools become less important, while access to jobs and restaurants becomes more important.

Building Permits Bear Out Projected Demand for Smart Growth
Percentage of residential permits pulled in central cities and older suburban cores.
49
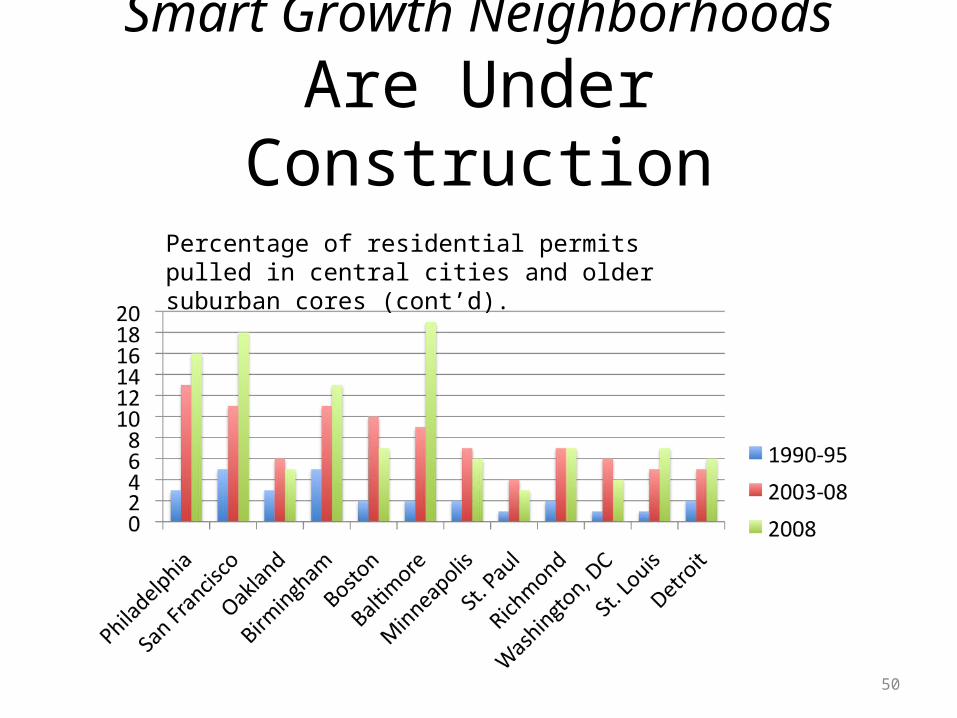
Smart Growth NeighborhoodsAre Under Construction
Percentage of residential permits pulled in central cities and older suburban cores (cont’d).
50
Smart Growth NeighborhoodsAttract Price Premiums
• Home buyers pay a 15.5% premium for a set of six smart growth characteristics, including• pedestrian accessibility to to commercial use;• mixed land use;• proximity to light rail, subways and trolleys;• greater street connectivity;• more streets and shorter dead-end streets; and• more and smaller blocks.
51
Smart Growth NeighborhoodsSustain Value over the Long-term
People pay more for homes in new urban neighborhoods than in conventional suburban neighborhoods. •A smart growth premium of 21% for Kentlands and 18% for Lakelands over surrounding neighborhoods.•The premium was sustained over time. •The smart growth price premium held during the economic downturn.
52

XI. Value of Transit Oriented Development
• See Separate Powerpoint
53

Smart Growth Adds Value throughXII. Walkability
Kalispell, MT Walkscore = 97City average = 65
Knoxville, TN Walkscore = 89City average = 47
Bloomfield, CTWalkscore = 68City average = 49
54
The “walkscore” is a measure of proximity to popular destinations.
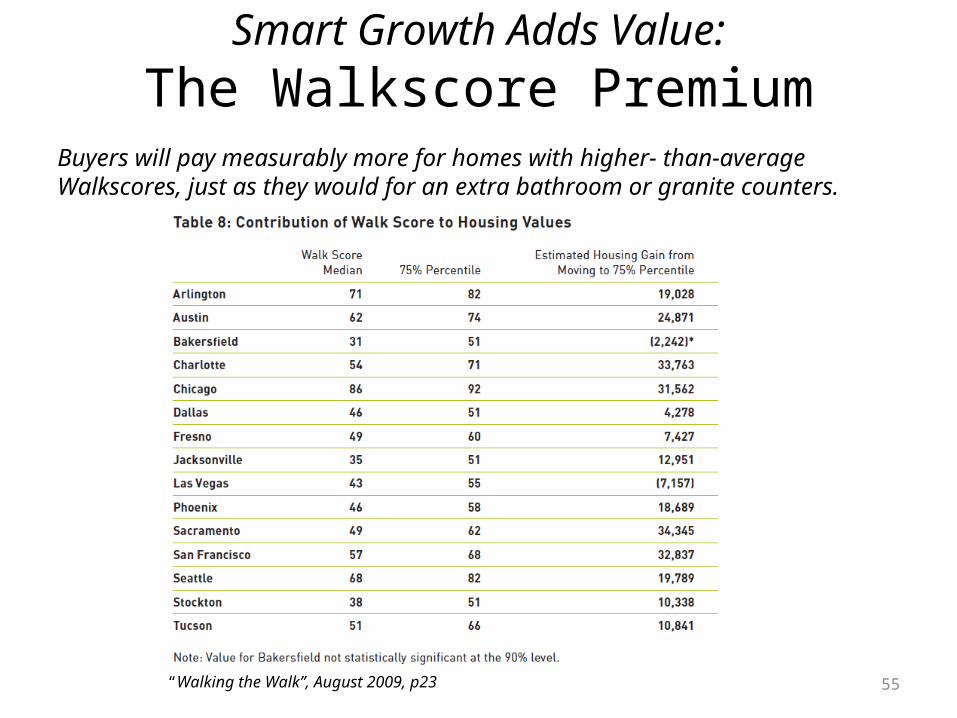
Smart Growth Adds Value:The Walkscore Premium
“Walking the Walk”, August 2009, p23 55
Buyers will pay measurably more for homes with higher- than-average Walkscores, just as they would for an extra bathroom or granite counters.

Smart Adds Value to Commercial Development
Office and retail properties with a Walkscore of 80 were worth between 29% and 40% more than properties with a Walkscore of 20. These properties also had lower capitalization rates and higher incomes.
56