smart mathamatics primary 5 tg
TRANSCRIPT

SmartMathematicsSmartSmartSmartSmartSmartSmartSmartSmartSmartSmartSmartSmartSmartSmartSmartSmartSmartSmartSmartSmartSmartSmartSmartSmart
5PR
IMARY
TEACHE R ’S GUI DE
NEW

Mathematics
Contributor/Reviewer:
F. C. Onabanjo
Smart
5PR
IMARY
TEACHE R ’ S G
UIDE

University Printing House, Cambridge cb2 8bs, United Kingdom
One Liberty Plaza, 20th Floor, New York, ny 10006, USA
477 Williamstown Road, Port Melbourne, vic 3207, Australia
314–321, 3rd Floor, Plot 3, Splendor Forum, Jasola District Centre, New Delhi – 110025, India
79 Anson Road, #06–04/06, Singapore 079906
Cambridge University Press is part of the University of Cambridge.
It furthers the University’s mission by disseminating knowledge in the pursuit of education, learning and research at the highest international levels of excellence.
www.cambridge.org
© Cambridge University Press 2016
This publication is in copyright. Subject to statutory exception and to the provisions of relevant collective licensing agreements, no reproduction of any part may take place without the written permission of Cambridge University Press.
First published 2016New edition published 2018
Contributing authors: Zonja Jooste, Alison JenkinEditor: Shirley SanbyTypesetter: Anne EvansCover image: Andrew Brookes/GettyImages
Every effort has been made to trace copyright holders. Should infringements have occurred, please inform the publishers who will correct these in the event of a reprint.
Cambridge University Press has no responsibility for the persistence or accuracy of URLs for external or third-party internet websites referred to in this publication, and does not guarantee that any content on such websites is, or will remain, accurate or appropriate.
ContentsIntroduction . . . . . . . . . . . . . . . . . . . . . . . . . . . . . . . . . . . . . . . . . . . . . . . . . . . v
The purpose of the curriculum . . . . . . . . . . . . . . . . . . . . . . . . . . . . . . . . . . . v
The role of the teacher . . . . . . . . . . . . . . . . . . . . . . . . . . . . . . . . . . . . . . . . . v
How to use the scheme of work . . . . . . . . . . . . . . . . . . . . . . . . . . . . . . . . . .vi
Planning for the year . . . . . . . . . . . . . . . . . . . . . . . . . . . . . . . . . . . . . . . . . . vii
Scheme of work . . . . . . . . . . . . . . . . . . . . . . . . . . . . . . . . . . . . . . . . . . . . . . .viii
Term 1Theme 1 Numbers and numeration . . . . . . . . . . . . . . . . . . . . . . . . . . . . . . . . 1Topic 1 Whole numbers: Up to millions . . . . . . . . . . . . . . . . . . . . . . . . . . . . 1
Topic 2 Whole numbers: Place value . . . . . . . . . . . . . . . . . . . . . . . . . . . . . . . 7
Theme 2 Basic operations . . . . . . . . . . . . . . . . . . . . . . . . . . . . . . . . . . . . . . 10Topic 3 Addition and subtraction . . . . . . . . . . . . . . . . . . . . . . . . . . . . . . . . 10
Topic 4 Multiplication and division . . . . . . . . . . . . . . . . . . . . . . . . . . . . . . . 13
Theme 1 Numbers and numeration . . . . . . . . . . . . . . . . . . . . . . . . . . . . . . . 20Topic 5 Whole numbers: LCM and HCF . . . . . . . . . . . . . . . . . . . . . . . . . . . . 20
Topic 6 Whole numbers: Square numbers and roots . . . . . . . . . . . . . . . . . 27
Theme 3 Algebraic processes . . . . . . . . . . . . . . . . . . . . . . . . . . . . . . . . . . . . 32Topic 7 Algebraic operations . . . . . . . . . . . . . . . . . . . . . . . . . . . . . . . . . . . . 32
Theme 2 Basic operations . . . . . . . . . . . . . . . . . . . . . . . . . . . . . . . . . . . . . . 35Topic 8 Derived operations . . . . . . . . . . . . . . . . . . . . . . . . . . . . . . . . . . . . . 35
Theme 1 Numbers and numeration . . . . . . . . . . . . . . . . . . . . . . . . . . . . . . . 37Topic 9 Binary numbers . . . . . . . . . . . . . . . . . . . . . . . . . . . . . . . . . . . . . . . . 37
Topic 10 Fractions: Addition and subtraction . . . . . . . . . . . . . . . . . . . . . . . . 43
Topic 11 Decimals . . . . . . . . . . . . . . . . . . . . . . . . . . . . . . . . . . . . . . . . . . . . . . 48
Term 1 Revision . . . . . . . . . . . . . . . . . . . . . . . . . . . . . . . . . . . . . . . . . . . . . 56

Term 2Theme 1 Numbers and numeration . . . . . . . . . . . . . . . . . . . . . . . . . . . . . . . 60Topic 1 Fractions: Percentage . . . . . . . . . . . . . . . . . . . . . . . . . . . . . . . . . . . 60
Topic 2 Fractions: Ratio . . . . . . . . . . . . . . . . . . . . . . . . . . . . . . . . . . . . . . . . 66
Topic 3 Fractions: Ratio and percentage . . . . . . . . . . . . . . . . . . . . . . . . . . . 69
Theme 4 Mensuration and geometry . . . . . . . . . . . . . . . . . . . . . . . . . . . . . . 71Topic 4 Primary measures: Money profit and loss . . . . . . . . . . . . . . . . . . . 71
Topic 5 Primary measures: Money interest . . . . . . . . . . . . . . . . . . . . . . . . . 75
Topic 6 Primary measures: Money transactions . . . . . . . . . . . . . . . . . . . . . 77
Topic 7 Secondary measures: Capacity . . . . . . . . . . . . . . . . . . . . . . . . . . . . 82
Topic 8 Primary measures: Mass . . . . . . . . . . . . . . . . . . . . . . . . . . . . . . . . . . 85
Topic 9 Primary measures: Length . . . . . . . . . . . . . . . . . . . . . . . . . . . . . . . . 88
Topic 10 Primary measures: Time . . . . . . . . . . . . . . . . . . . . . . . . . . . . . . . . . . 93
Topic 11 Primary measures: Temperature . . . . . . . . . . . . . . . . . . . . . . . . . . . 96
Term 2 Revision . . . . . . . . . . . . . . . . . . . . . . . . . . . . . . . . . . . . . . . . . . . . 102
Term 3Theme 4 Mensuration and geometry . . . . . . . . . . . . . . . . . . . . . . . . . . . . . 105Topic 1 Plane shapes: Lines, triangles, quadrilaterals . . . . . . . . . . . . . . . . 105
Topic 2 Plane shapes: Square, rectangle, rhombus . . . . . . . . . . . . . . . . . . 117
Topic 3 Plane shapes: Angles . . . . . . . . . . . . . . . . . . . . . . . . . . . . . . . . . . . 122
Topic 4 Plane shapes: Circles . . . . . . . . . . . . . . . . . . . . . . . . . . . . . . . . . . . 129
Topic 5 Primary measures: Length . . . . . . . . . . . . . . . . . . . . . . . . . . . . . . . 134
Topic 6 Secondary measures: Area . . . . . . . . . . . . . . . . . . . . . . . . . . . . . . 140
Topic 7 3-D shapes (objects): Nets . . . . . . . . . . . . . . . . . . . . . . . . . . . . . . . 143
Topic 8 Secondary measures: Volume, structure of Earth . . . . . . . . . . . . 147
Theme 5 Everyday statistics . . . . . . . . . . . . . . . . . . . . . . . . . . . . . . . . . . . . 153Topic 9 Data collection and presentation: Tallies and graphs . . . . . . . . . 153
Topic 10 Data collection and presentation: Measures of central tendency 162
Topic 11 Chances and events . . . . . . . . . . . . . . . . . . . . . . . . . . . . . . . . . . . . 168
Term 3 Revision . . . . . . . . . . . . . . . . . . . . . . . . . . . . . . . . . . . . . . . . . . . . 172

vIntroduction
Introduction
The purpose of the curriculumThe main objectives of the curriculum are to prepare the pupils to:• acquire the mathematical literacy necessary to function in an
information age• cultivate the understanding and application of mathematical
concepts and skills necessary to thrive in the ever-changing technological world
• develop the essential element of problem-solving, communication, reasoning and connection in the study of Mathematics
• take advantage of the numerous career opportunities provided by Mathematics
• become prepared for further studies in Mathematics and related fields.
The role of the teacherOne of the principal duties of a Mathematics teacher is to prepare and present good lessons to his or her pupils. The teacher needs to:• be as well-informed as possible on the Mathematics scheme
of work• know the aims and objective of each topic• select appropriate content material• decide on the best methods of presentation such as group
work, worksheets, question-answer sessions and debate• remain informed about social and environmental issues and
other current news in Nigeria and the rest of the world• through innovative teaching approaches encourage learning
that will promote creativity and critical thinking in pupils.
To be effective in presentation, the teacher must prepare a written or typed plan for each lesson. This plan must include aims, objectives, resources, time frames, content for the lesson, activities, homework, assessment, and ideas or additional worksheets to cater for pupils who require extension or learning support (remedial).

Introductionvi
The teacher must prepare each topic in advance. Many teachers go into the classroom without adequate preparation. It is the Mathematics teacher’s responsibility to involve all pupils actively in the learning process. It is a proven fact that pupils learn far more by doing than by listening.
Mathematics involves being curious and asking questions. When possible, teachers must ask questions to engage the pupils, encourage independent thought processes and help pupils develop problem-solving skills. Teachers need to start their lessons by asking the pupils to write down answers to a few questions that are related to the lesson. This will help pupils focus on the lesson. Teachers can use different types of questions in lessons:• diagnostic questions enable teachers to determine pupils’ prior
knowledge on a topic• consolidation questions help pupils master challenging
concepts• questions can stimulate pupils’ interest in the subject• questions can be used to help conclude a lesson. This will
help teachers to find out whether pupils have understood concepts and terminology that were used in a lesson. Such questions will also highlight areas that pupils need to revise at home or that teachers will need to revisit in the next lesson.
Teachers must ensure that they do not appear to have favourites in a class. They must devise a system to ensure that they ask questions fairly and are careful not to embarrass pupils who struggle to answer questions.
How to use the scheme of workA scheme of work is defined as the part of the curriculum that teachers are required to teach in their subjects. The primary function of a scheme of work is to provide an outline of the subject matter and its content, and to indicate how much work to cover in a particular class. A scheme of work allows teachers to clarify their thinking about a subject, and to plan and develop particular curriculum experiences that they believe may require more time and attention when preparing lessons. The criteria all teachers should bear in mind when planning a scheme of work are continuity in learning and progression of experience. Teachers can add their own notes to the scheme of work provided on pages viii to xiv.
viiIntroduction
The scheme of work is sequential. The sequence of the scheme of work is aligned with the textbook. Teachers should not be tempted to select material at random. It is better to spend time planning the work for a term to ensure that they adhere to the scheme of work.
Planning for the yearThe year is divided into three terms. Each term is divided into 13 weeks. For Mathematics, there are 11 topics for Term 1, 11 topics for Term 2 and 11 topics for Term 3. At the end of each term, it is important to ensure that there is time for revision and an examination. This time frame may differ depending on the planning of a particular school. The exercises in the Workbook give pupils the opportunity to apply what they have learnt. References in the Pupil’s Book indicate the best time to use the exercises in the Workbook.
Each teacher’s management of each class will have an enormous influence on the teacher’s ability to adhere to the time frames. Focus on effective strategies for discipline. Teachers will have fewer problems regarding discipline if they are punctual, well-prepared, follow a plan (write this on the board at the start of the lesson), keep their word (and do not, for example, make empty threats) and consistently adhere to rules.
A teacher of Mathematics is a professional instructor who facilitates, promotes and influences pupils to achieve the outcomes of the scheme of work. It is the wish of the authors that the pupils will, at the end of each course in the series attain a level of Mathematics proficiency that will equip them for future studies in this field.

Scheme of workviii
Scheme of work
Term 1
Topic Lesson objectivesPupils should be able to:
PB pages
WB pages
Whole numbers: Up to millionsUnit 1: Count, read and write numbers up to millions
1. count in thousands and millions2. apply counting of large numbers such as
in population of states or countries3. solve problems on quantitative aptitude
involving thousands and millions
1–7 1–4
Whole numbers: Place valueUnit 2: Find place value of whole numbers
1. count in thousands and millions 8–12 5–6
Addition and subtractionUnit 3: Add and subtract whole numbers with 3 or more digits
1. add and subtract numbers involving 3 or more digits
13–19 6–8
Multiplication and divisionUnit 4: Multiply and divide whole numbers
1. multiply a 3-digit number by a 3-digit number
2. solve problems on quantitative aptitude involving multiplication
3. apply “of” as multiplication when dealing with fractions of whole numbers
4. multiply numbers by zero and one5. divide numbers by 10 and multiples of 10
up to 906. solve problems on quantitative aptitude
involving division of numbers by 10 and multiples of 10 up to 900
7. divide numbers by 100 and 2008. divide whole numbers by 2-digit numbers
20–31 9–15

ixScheme of work
Topic Lesson objectivesPupils should be able to:
PB pages
WB pages
Whole numbers: LCM and HCFUnit 5: Identify odd, even and prime numbers; find LCM and HCF
1. identify prime numbers less than 100 32–41 15–19
Whole numbers: Square numbers and rootsUnit 6: Calculate square numbers and square roots
1. calculate squares of whole numbers more than 50 and square roots of perfect squares greater than 400
2. solve problems on quantitative aptitude involving squares of numbers more than 50 and square roots of numbers greater than 400
42–49 19–23
Algebraic operationsUnit 7: Solve open sentences
1. find the missing numbers in open sentences
2. use letters to represent boxes in open sentences
3. find the missing numbers that the letters represent
4. interpret each box in a mathematical statement that represents a letter that could be found
5. use letters to represent the missing numbers in quantitative aptitude problems and find their values
50–55 23–25
Derived operationsUnit 8: Add and subtract integers on number lines
1. add and subtract numbers using a number line
2. solve problems on quantitative aptitude involving adding and subtracting on a number line
56–58 25–27
Binary numbersUnit 9: Identify binary numbers in base 2*Enrichment
1. identify numbers in base 22. convert from base 10 to base 2 and vice
versa3. add numbers in base 24. subtract numbers in base 2 5. solve problems on quantitive aptitude
involving adding and subtracting numbers in base 2
59–64 27–29

Scheme of workx
Topic Lesson objectivesPupils should be able to:
PB pages
WB pages
Fractions: Addition and subtractionUnit 10: Add and subtract fractions
1. add and subtract mixed fractions2. solve problems on quantitative aptitude
involving addition and subtraction of fractions
65–72 29–32
DecimalsUnit 11: Add, subtract, multiply and divide decimals
1. add and subtract decimals2. solve problems on quantitative aptitude
involving division of numbers by 100 and 200
3. divide decimals by multiples of 10 up to 900
4. solve problems on quantitative aptitude involving decimals
5. divide decimals by 100 and 2006. multiply decimals by whole numbers7. multiply decimals by whole numbers
73–85 32–38
Term 1 Revision 86–93
Term 2
Topic Lesson objectivesPupils should be able to:
PB pages
WB pages
Fractions: PercentageUnit 1: Solve problems involving percentages
1. change fractions to decimals, decimals to percentages, and vice versa
2. solve problems on quantitative aptitude involving percentages
94–106 39–45
Fractions: RatioUnit 2: Determine ratio
1. state the relationship between fractions and ratios
2. solve problems on quantitative aptitude involving ratio
107–113 45–48
Fractions: Ratio and percentageUnit 3: Express values as ratio and percentage
1. change fractions to decimals, decimals to percentages, and vice versa
2. solve problems on quantitative aptitude involving percentages
3. state the relationship between fractions and ratios
4. solve problems on quantitative aptitude involving ratio
114–116 48–49

xiScheme of work
Topic Lesson objectivesPupils should be able to:
PB pages
WB pages
Primary measures: Money profit and lossUnit 4: Compare currencies; calculate profit and loss
1. compare Nigerian units of money with pounds sterling, American dollars and some West African countries
2. solve problems on profit and loss3. solve problems on quantitative reasoning
involving money
117–123 49–52
Primary measures: Money interestUnit 5: Find simple interest
1. solve problems on simple interest2. solve problems on quantitative reasoning
involving money
124–129 53–54
Primary measures: Money transactionsUnit 6: Calculate commission, discount and social transactions
1. solve problems on commission, discount and transactions at the post office, market etc.
2. solve problems on quantitative reasoning involving money
130–136 54–58
Secondary measures: CapacityUnit 7: Work with capacity
1. find the relationship between litres and cubic centimetres
2. identify the use of litre as a unit of capacity and the established relationship between ℓ and cm3
137–142 59–61
Primary measures: MassUnit 8: Work with mass
1. solve word problems on mass2. solve problems on quantitative aptitude
involving mass
143–149 61–63
Primary measures: LengthUnit 9: Measure height and distance*Enrichment
1. use hand and leg spans to measure2. use a tape measure to find dimensions of a
classroom and longer distances3. measure and compare heights of people,
buildings, trees and distances
150–156 64–66
Primary measures: TimeUnit 10: Solve problems involving speed
1. calculate average speed of a moving object
157–161 66–68

Scheme of workxii
Topic Lesson objectivesPupils should be able to:
PB pages
WB pages
Primary measures: TemperatureUnit 11: Compare and convert temperature
1. compare degrees of hotness and various objects and areas (locations) in degrees Celsius
2. identify the usefulness of temperature in our daily lives
162–169 69–71
Term 2 Revision 170–177
Term 3
Topic Lesson objectivesPupils should be able to:
PB pages
WB pages
Plane shapes: Lines, triangles and quadrilateralsUnit 1: Work with lines, triangles and quadrilaterals
1. identify parallel and perpendicular lines2. solve problems on quantitative aptitude
involving plane shapes3. solve problems on quantitative aptitude
involving triangles
178–189 72–79
Plane shapes: Square, rectangle, rhombusUnit 2: Define the properties of a square, rectangle and rhombus
1. state some properties of triangles including equilateral, isosceles and right-angled triangles
190–193 80–84
Plane shapes: AnglesUnit 3: Define different angles*Enrichment
1. state some properties of triangles including equilateral, isosceles and right-angled triangles
194–204 84–88
Plane shapes: CirclesUnit 4: Identify parts of a circle
1. identify the radius, diameter and circumference of a circle
2. solve problems on quantitative aptitude involving circles
205–211 88–91

xiiiScheme of work
Topic Lesson objectivesPupils should be able to:
PB pages
WB pages
Primary measures: LengthUnit 5: Find the perimeter and circumference
1. identify and determine a radius on the diameter of the circumference of a circle
2. find the perimeter of regular shapes such as a square, rectangle, trapezium and polygon
3. find the circumference of a circle when the radius is given
4. establish the relationship between c _ d and
π and find the circumference
212–218 91–95
Secondary measures: AreaUnit 6: Find the area of a right-angled triangle
1. calculate the area of a right-angled triangle
219–222 95–96
3-D shapes (objects): NetsUnit 7: Make 3-D shapes (objects) using nets
1. state the properties of 3-D shapes such as cubes, cuboids, pyramids etc.
2. solve problems on quantitative aptitude involving 3-D shapes such as cubes, cuboids, pyramids etc.
223–229 97–101
Secondary measures: Volume, structure of EarthUnit 8: Calculate volume; define the structure of Earth
1. use cubes to find the volume of a cuboid and a cube
2. use a formula to find the volume of cuboids
3. identify the difference between cubes and cuboids
4. describe the shape of Earth5. compare the volumes of a sphere and
a cuboid
230–238 101–105
Data collection and presentation: Tallies and graphsUnit 9: Represent data in tallies and graphs
1. prepare a tally of data2. draw bar graphs and pictograms of
information collected locally
239–251 106–114

Scheme of workxiv
Topic Lesson objectivesPupils should be able to:
PB pages
WB pages
Data collection and presentation: Measures of central tendencyUnit 10: Find measures of central tendency
1. find the mode of given data2. identify the mode as applicable in daily
life activities3. calculate the mean of given data4. identify the mean of a set of data in daily
life activities5. solve problems on quantitative aptitude
involving the mode and mean of data6. calculate the mean of given data7. appreciate the concept of the mean of a
set of data in daily life activities
252–263 115–120
Chances and eventsUnit 11: Experiment with tossing coins and throwing dice
1. record data from experiments in coin tossing and dice throwing
2. identify various chance events in daily life activities
264–271 121–124
Term 3 Revision 272–284

1Theme 1: Numbers and numeration – Whole numbers: Up to millions
1THEME Numbers and numeration
Whole numbers: Up to millionsTerm
1
Unit 1: Count, read and write numbers up to millions
Teaching guidelines and solutions
Instructional resourcesPlace value tables/charts; maps; abaci; counting grids; number lines; flow diagrams; number cards; number chains
Read and write numbers up to millionsAsk the class where they use counting in millions in real life and what the population of Nigeria is. Ask them to write the number on the board. Discuss the population of Nigeria in 2010, 2014, and 2015. Write the numbers on the board and ask the class to read them.
Ask the pupils to explore the population of Nigeria in the place value table in the first example. They read the numbers aloud again and give the values and place values of each digit.
Show the pupils how to write the number 183 523 432 in words. Let them write the populations in 2014 and 2010 in words on the board. Draw their attention to the spaces between the millions, hundred thousands and hundreds in the numbers.
Pupils work through the example on page 2 and discuss the different states of Nigeria and their populations. For extra practice they can write all the numbers in words.
The pupils work on their own to complete the workbook exercises either in class or as homework.
Exercise 1 (pb page 3)1. Enugu State (722 664); Edo State (1 147 188); Rivers State
(1 320 214); Kaduna State (1 652 844); Oyo State (2 550 593); Kano State (3 626 068); Lagos State (13 400 000)

2 Term 1: Unit 1: Count, read and write numbers up to millions
2. Enugu State – seven hundred and twenty-two thousand six hundred and sixty-four Edo State – one million one hundred and forty-seven thousand one hundred and eighty-eight Rivers State – one million three hundred and twenty thousand two hundred and fourteen Kaduna State – one million six hundred and fifty-two thousand eight hundred and forty-four Oyo State – two million five hundred and fifty thousand five hundred and ninety-three Kano State – three million six hundred and twenty six thousand and sixty-eightLagos State – thirteen million four hundred thousand
3. 13 000 000 − 4 000 000 = 9 000 000 more people
Exercise 2 (pb page 3)1. a) six hundred and forty-five thousand seven hundred
and fiftyb) eight hundred and sixty-five thousand two hundred
and fiftyc) one million one hundred and fifteen thousand five hundredd) three million six hundred and seventy-five thousande) ten million one hundred and four thousand one hundred
and fourf) eighteen million one hundred and twenty-three thousand
three hundred and twenty-oneg) one hundred and thirty-five million eight hundred and
sixty-nine thousand eight hundredh) nine hundred million three thousand and forty
2. a) 1 200 000 b) 895 000 c) 25 781 640 d) 659 325 e) 100 014 150 f) 4 025 000
Exercise 3 (pb page 3)1. a) 698 866; 775 421; 815 336; 928 002
b) 1 482 869; 1 696 122; 1 784 231; 1 832 146c) 3 357 298; 3 375 298; 5 677 125; 5 767 125d) 13 635 726; 14 621 826; 15 228 503; 16 468 183e) 33 242 242; 34 809 809; 36 175 175; 38 998 998

3Theme 1: Numbers and numeration – Whole numbers: Up to millions
2. a) i) 2 235 312 ii) two million two hundred and thirty-five thousand three
hundred and twelve b) i) 2 016 354 ii) two million sixteen thousand three hundred and
fifty-four c) i) 6 450 113 ii) six million four hundred and fifty thousand one
hundred and thirteen
3. a) Blue SUV b) Blue SUV: ₦7 500 000; yellow car: ₦5 650 000;
green motorbike: ₦450 000; red bicycle: ₦75 000 c) red bicycle
4. a) The number must have six digits and the first digit of the six-digit number must be 7. Some possible answers are: 714 452, 725 414, 741 254, 751 442. Note that there are many more valid answers.
b) A valid answer must be a six-digit number with first digit 7 and second digit 5. Some possible answers are: 754 412, 751 424, 752 144, 754 241. Note that there are many more valid answers.
c) The number may be 6 digits or less (it is not specified whether all given digits must be used). Any six-digit number must have 1 or 2 as the first digit. For numbers with less than five digits, they may have any combination of the given digits. Examples of possible answers are: 254 174, 7 144, 52 714, 174 254.
Workbook: Exercise 1 (wb page 1)1. a) 746 411 b) 2 581 014 c) 9 103 020
2. a) 9 542 b) 322 110 c) 9 987 421
3. a) 30 003; 33 033; 33 302; 30 333b) 17 126; 17 261; 171 260; 1 712 600
4. a) 3 002 500 b) 25 040 200 c) 7 060 215
4 Term 1: Unit 1: Count, read and write numbers up to millions
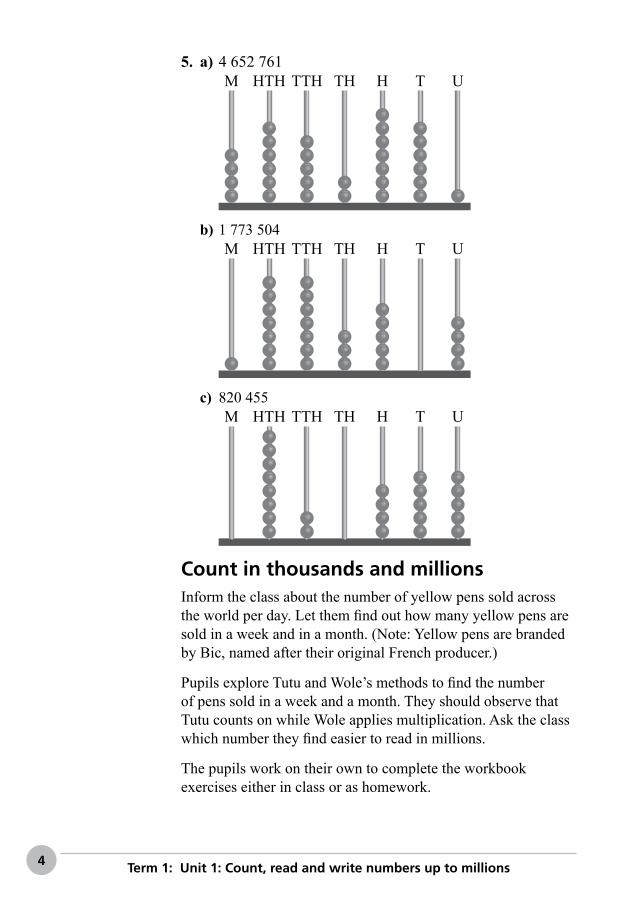
5. a) 4 652 761M HTH TTH TH H T U
b) 1 773 504M HTH TTH TH H T U
c) 820 455M HTH TTH TH H T U
Count in thousands and millionsInform the class about the number of yellow pens sold across the world per day. Let them find out how many yellow pens are sold in a week and in a month. (Note: Yellow pens are branded by Bic, named after their original French producer.)
Pupils explore Tutu and Wole’s methods to find the number of pens sold in a week and a month. They should observe that Tutu counts on while Wole applies multiplication. Ask the class which number they find easier to read in millions.
The pupils work on their own to complete the workbook exercises either in class or as homework.

5Theme 1: Numbers and numeration – Whole numbers: Up to millions
Exercise 4 (pb page 5)1. (10 × 10) × (10 × 10) × 2 = 20 000 dots2. 1 000 × 10 = 10 000 coins3. a) 12 × 10 000 cm2 = 120 000 cm2
b) 15 × 10 000 cm2 = 150 000 cm2
4. a) 59 997; 60 997; 61 997; 62 997; 63 997; 64 977, 65 997; … 67 997
b) 800 300; 801 300; 802 300; 803 300; 804 300; 805 300; … 807 300
c) 8 564 510; 10 564 510; 11 564 510; 12 564 510; 14 564 510d) 48 010 232; 49 010 232; 50 010 232; 52 010 232; 54 010 232
Exercise 5 (pb page 6)1. a) 9 000; 10 000; 11 000
b) 29 100; 30 100; 31 100c) 99 000 000; 100 000 000; 101 000 000d) 128 500; 129 500; 130 500e) 400 453 012; 401 453 012; 402 453 012
2. a) seven thousand and fiftyb) eleven million and twentyc) nineteen thousand four hundredd) seven hundred thousand and ninety
3. a) 4 050; 5 050; 6 050; 7 050b) 8 000 020; 9 000 020; 10 000 020; 11 000 020c) 17 400; 18 400; 19 400d) 500 090; 600 090; 700 090
4. a) 18 000 b) 74 000 000 c) 49 000 000 d) 876 000 e) 350 000 000 f) 1 050 000 000
Quantitative reasoning5. a) 25 000; 250 b) 2 000; 80 000
6. a) No, 5 000 × 12 (60 000) visitors in a year is less than 1 _ 4 million visitors.
b) 250 000 ÷ 12 = 20 834 people
7. 108 000 tickets
8. a) 4 800 beadsb) Zainab has 799 more beads than Adaeze.

6 Term 1: Unit 1: Count, read and write numbers up to millions
Workbook: Exercise 2 (wb page 3)1. a) 2 000 000; 2 500 000; 3 000 000
b) 1 000 000; 1 250 000; 1 500 000c) 20 800; 22 000; 23 200d) 5 400 000; 6 000 000; 6 600 000
2. 996 999; 997 999; 998 999; 999 999; 1 000 999
3. a) twenty hundred and ten; twenty hundred and twentyb) forty-eight hundred; forty-nine hundred
4. a) 1 980; 1 990; 2 000; 2 010; 2 020b) 4 500; 4 600; 4 700; 4 800; 4 900
5. a) 500 000 b) 750 000 c) 400 000 d) 125 000 e) 500 000 f) 875 000

7Theme 1: Numbers and numeration – Whole numbers: Place value
1THEME Numbers and numeration
Whole numbers: Place value
Term 1
Unit 2: Find place value of whole numbers
Teaching guidelines and solutions
Instructional resourcesOverlay cards; place value table/chart; abacus; number cards; problem cards; banknotes
Ask the pupils to explore the pictures and name the amounts that each person is banking. They find out each amount in units (U), tens (T), hundreds (H), thousands (TH), ten thousands (TTH), hundred thousands (HTH) and millions (M).
Explain to the class that they have written the number in expanded notation using the values of the digits.
Place values and values of digits in numbersLet the class explore the different ways of represent the amount ₦2 763 895 in expanded notation using values and place values in the diagrams and overlay cards. Let them read the values and place values of the digits.
Pupils read the numbers on the cards and write the numbers in words on the board.
Draw the place value table on the board and ask pupils to represent the numbers in the table. Let them give the place value and value of each digit.
The pupils work on their own to complete the workbook exercises either in class or as homework.
Exercise 1 (pb page 10)
1. a) 300 000 + 50 000 + 4 000 + 300 + 70 + 6b) 600 000 + 70 000 + 400 + 80 + 1c) 4 000 000 + 200 000 + 50 000 + 6 000 + 90 + 1

8 Term 1: Unit 2: Find place value of whole numbers
2. a) 753 921 b) 3 611 093 c) 874 064 d) 292 321 e) 7 080 905 f) 610 000
3. a) 300 000; 300 b) 70 000; 80 c) 4 000 000; 1 d) 20 000; 100
Exercise 2 (pb page 10)1. a) 10 b) 5 000 c) 500 d) 5 e) 80 000 f) 800 g) 7 h) 1 000 i) 3 000 000 j) 0 k) 800 000 l) 50 000
2. a) 600 000 + 70 000 + 800 + 20 + 1b) 300 000 + 50 000 + 2 000 + 900 + 80 + 6c) 500 000 + 100 + 20 + 3d) 10 000 + 6 000 + 700 + 9e) 4 000 000 + 600 000 + 8 000 + 200 + 4f) 900 000 + 50 000 + 8 000 + 900 + 90 + 9g) 20 000 + 3 000 + 500 + 70 + 3h) 70 000 + 6 000 + 800 + 10 + 2
3. a) 40 000 + 1 000 + 70 + 6b) 600 000 + 90 000 + 6 000 + 400 + 30 + 1c) 500 000 + 40 000 + 2 000 + 90 + 8d) 2 000 000 + 800 000 + 8 000 + 900 + 10 + 7e) 70 000 + 9 000 + 100 + 90f) 700 000 + 60 000 + 4 000 + 400 + 30 + 3
Exercise 3 Quantitative reasoning (pb page 11)1. a) 1 000 × ₦1 000 notes b) 1 000 × ₦100 notes c) 5 000 × ₦200 notes d) 20 × ₦500 notes
2. 22 222 − 16 976 = 5 246 km
3. 102, 120, 210
4. 2 + 5 + 32 + 193 + 18 + 10 + 100 = 360
5. A = 7; B = 1; C = 80 000; D = 5
6. a) Trueb) Number A: 80 000; Number B: 8 000c) 20 000 000d) Digit 5 in both numbers has a value of 5 000 000. Digit 7 in both numbers has a value of 700 000. Digit 1 in both numbers has a value of 10.

9Theme 1: Numbers and numeration – Whole numbers: Place value
Workbook: Exercise 1 (wb page 5)1. a) 3; 6; 1; 8; 4 b) 4; 2; 7; 6; 2
2. a) 800 b) 800 000 c) 8 000 000 d) 8 000 e) 80 f) 8
3. a) 203 568 b) 930 832
4. a) 60; 600; 6 000; 60 000b) 750; 7 500; 75 000; 750 000c) 6 910; 69 100; 691 000; 6 910 000d) 43 020; 430 200; 4 302 000; 43 020 000
5. W = 40 000, X = 2 000, Y = 6, Z = 9
6. 5 384 834
34 837 849
6 962 189
1 764 823
653 853
23 544 365
700 000
50
300
2 000
80 000
4 000 000

10 Term 1: Unit 3: Add and subtract whole numbers with three or more digits
2THEME Basic operations
Addition and subtraction
Term 1
Unit 3: Add and subtract whole numbers with three or more digits
Teaching guidelines and solutions
Instructional resourcesObjects in pictures; overlay cards; place value table/chart; number cards; abacus; flow diagrams
Ask the class to explore the number of sweets in the packets in example 1. They explore and discuss the representation of the addition (without renaming) and subtraction (with renaming) to calculate the total number of sweets and the difference between the number of red and orange sweets. Pupils should observe that the number of counters are put together to get the total number of sweets. The digits in the number of red sweets are taken from the orange counters and the difference is the numbers represented by the remaining counters.
2 325 + 1 660 = 3 985 sweets altogether2 325 − 1 660 = 665 more orange than red sweets
Ask the pupils why there are no red counters in abacus B. They should realise the red counters were removed (subtracted).
Ask the class to explore and discuss the addition (without renaming) and subtraction (with renaming) in the place value chart in example 2. They should notice digits are added in place value columns and digits are carried in subtraction when the digits in the subtrahend are not enough to subtract the digits in the minuend.
Pupils explore and discuss the addition and subtraction with renaming in the column method. They notice the names of the parts of the addition and subtraction calculations. Encourage pupils to use the terminology when they explain calculations.

11Theme 2: Basic operations – Addition and subtraction
The pupils work on their own to complete the workbook exercises either in class or as homework.
Exercise 1 (pb page 15)1. a) 4 897 b) 2 999 c) 4 997 d) 5 962 e) 4 778 f) 4 729 g) 4 085 h) 2 668
2. a) 4 786 b) 3 935 c) 4 552 d) 4 525 e) 4 666 f) 8 488 g) 9 778 h) 6 258
Exercise 2 (pb page 16)1. a) 1 351 b) 2 122 c) 2 106 d) 441 e) 1 143 f) 3 251 g) 1 525 h) 1 534
2. a) 982 b) 4 383 c) 1 943 d) 1 095 e) 2 238 f) 2 951 g) 1 518 h) 934
3. a) 1 521 b) 2 831 c) 1 695 d) 320 e) 717 f) 2 129 g) 1 490 h) 2 460
Exercise 3 Quantitative reasoning (pb page 17)1. 3 572 + 1 775 = 5 347 bottles
2. 1 982 + 2 799 = 4 781 bags
3. 1 768 + 2 675 = 4 443 pupils
4. 2 750 + 4 950 = 7 700 eggs
5. 4 978 − 3 623 = 1 355 seats
6. 2 593 − 1 727 = 866 pupils
7. a) 350 b) 575 c) 180 d) 180
8. 4 050; 4 500; 6 300; 9 300; 11 500
9. a) 5 178 b) 9 425
10. A = 965; B = 681; C = 85; D = 397
Workbook: Exercise 1 (wb page 6)1. a) 2 798 b) 3 979 c) 4 999
2. a) 1 032 b) 4 383 c) 1 943
3. a) 2 410 tickets b) 590 tickets

12 Term 1: Unit 3: Add and subtract whole numbers with 3 or more digits
4. a) 345 + 894 = 1 239 b) 4 158 + 3 243 + 332 = 7 733c) 7 363 − 5 328 = 2 035
5. a) 4 500; 5 750; 7 000; 8 250 b) 10 525; 12 625; 12 625; 14 725c) 7 050; 8 600; 10 150; 11 700
6. a) W = 500, X = 1 192, Y = 968, Z = 744b) M = 309, N = 1 214, P = 1 153, Q = 1 475, R = 570
1 7 735 35 2121 1
1 20 66 15 15 1
1 10 10 55 1
1 4 46 1
1 3 3 1
1 2
7.
1
1 1
1
13Theme 2: Basic operations – Multiplication and division
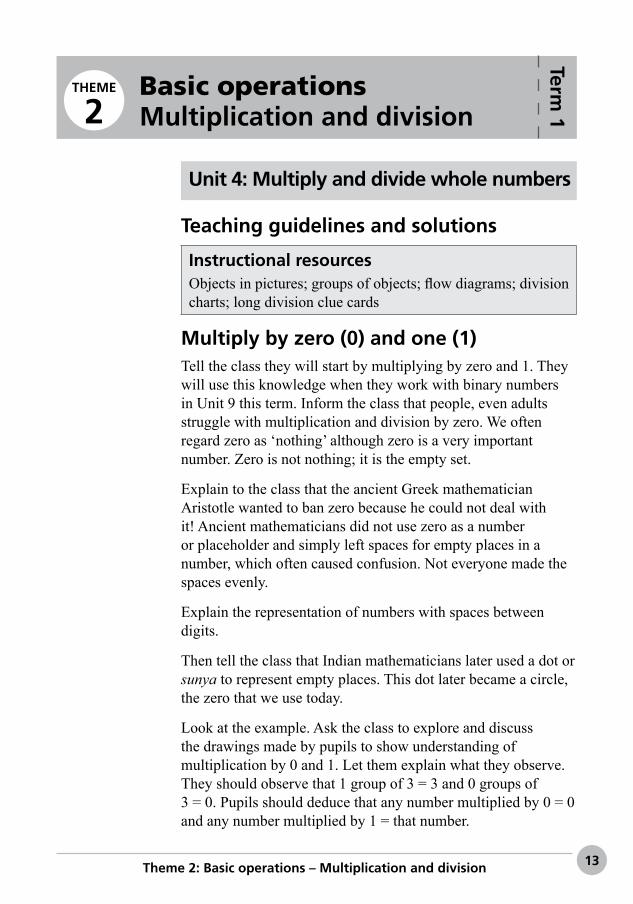
2THEME Basic operations
Multiplication and division
Term 1
Unit 4: Multiply and divide whole numbers
Teaching guidelines and solutions
Instructional resourcesObjects in pictures; groups of objects; flow diagrams; division charts; long division clue cards
Multiply by zero (0) and one (1)Tell the class they will start by multiplying by zero and 1. They will use this knowledge when they work with binary numbers in Unit 9 this term. Inform the class that people, even adults struggle with multiplication and division by zero. We often regard zero as ‘nothing’ although zero is a very important number. Zero is not nothing; it is the empty set.
Explain to the class that the ancient Greek mathematician Aristotle wanted to ban zero because he could not deal with it! Ancient mathematicians did not use zero as a number or placeholder and simply left spaces for empty places in a number, which often caused confusion. Not everyone made the spaces evenly.
Explain the representation of numbers with spaces between digits.
Then tell the class that Indian mathematicians later used a dot or sunya to represent empty places. This dot later became a circle, the zero that we use today.
Look at the example. Ask the class to explore and discuss the drawings made by pupils to show understanding of multiplication by 0 and 1. Let them explain what they observe. They should observe that 1 group of 3 = 3 and 0 groups of 3 = 0. Pupils should deduce that any number multiplied by 0 = 0 and any number multiplied by 1 = that number.

14 Term 1: Unit 4: Multiply and divide whole numbers
Let the pupils write number sentences on the board to describe the grouping of the pictures. They use repeated addition and multiplication. Ask the class to look for patterns in the expressions and number sentences to understand that 3 × 1 = 3; 1 × 5 = 5; 3 × 0 = 0 and 0 × 5 = 0.
3 + 3 + 3 → 3 × 3 = 9 5 + 5 + 5 → 3 × 5 = 152 + 2 + 2 → 3 × 2 = 6 5 + 5 → 2 × 5 = 101 + 1 + 1 → 3 × 1 = 3 5 → 1 × 5 = 50 + 0 + 0 → 3 × 0 = 0 0 → 0 × 5 = 0
Remind the class what a number sentence, equation and expression are.
The pupils work on their own to complete the workbook exercises either in class or as homework.
Exercise 1 (pb page 21)1. a) 12; 3; 12 8; 2; 8 4; 1; 4 0; 0; 0
b) 20; 4; 20 15; 3; 15 10; 2; 10 5; 1; 5 0; 0; 0
2. a) 30; 24; 18; 12; 6; 0 b) 40; 32; 24; 16; 8; 0 c) 35; 28; 21; 14; 7; 0 d) 45; 36; 27; 18; 9; 0
3. a) The product is always 0.b) The product is always the multiplicand.
Workbook: Exercise 1 (wb page 9)1. 3 bags of 6 marbles
2 bags of 6 marbles
1 bag of 6 marbles
0 bag of marbles = 0

15Theme 2: Basic operations – Multiplication and division
2. a) 19 b) 19 c) 0 d) 0
3. a) 5 b) 5 c) 6 d) 0 e) 0 f) 0
Exercise 2 (pb page 22)1. a) False b) True c) True d) False e) True f) False g) False h) False i) False
2. a) 1 b) 0 c) 0 d) 18 e) 43 f) 240 g) 0 h) 0 i) 1 j) 1 k) 2 450 l) 0 m) 0 n) 0 o) 64 p) 100
Multiply 3-digit numbers by 3-digit numbersLet the class name the parts in a multiplication calculation. Inform them they will multiply 3-digit by 3-digit numbers. They explore and discuss the real-life problem and explain how they will find the total number of drawing pins in the example.
In the example, remind the pupils they can use estimation to find approximate solutions they can use to check actual solutions for reasonability. They should observe that the factory workers made approximately 30 000 drawing pins. Remind them that the sign ≈ means “approximately equal to”.
Ask the class to explore and discuss the methods to do 3-digit by 3-digit multiplication with renaming. They should notice the use of zeros as placeholders and notice that the actual solution is close to the approximate solution.
Let the pupils use the methods to solve the problems on the board.
146 × 123 = 17 958 216 × 247 = 53 352
The pupils work on their own to complete the workbook exercises either in class or as homework.
Exercise 3 (pb page 23)1. 67 568 2. 174 135 3. 99 129 4. 197 8085. 28 329 6. 93 766 7. 108 810 8. 235 757

16 Term 1: Unit 4: Multiply and divide whole numbers
Workbook: Exercise 2 (wb page 9)1. a) 72 136 b) 104 832 c) 139 725 d) 56 342
2. a) 21 090 bricks b) 134 640 people c) ₦225 750
3. a) Incorrect; 224 × 145 = 32 480 Correct; 562 × 145 = 81 490b) Correct; 573 × 210 = 120 330 Incorrect; 498 × 210 = 104 580
Exercise 4 Quantitative reasoning (pb page 24)1. a) 125 925 newspapers b) 36 960 people c) ₦156 975 d) 43 808 words e) 88 616 photos
2. a) 85 860; 135 432 b) 140 164; 87 636
Divide numbers by 10 and multiples of 10Ask the class to explore and discuss the real-life problem in example 1 to find the number of groups of 10 tomatoes in 30. Let them explore and explain the drawing and equations to realise the connection between repeated addition and multiplication and repeated subtraction and division.
They find the number of groups of 10 in the numbers of tomatoes by making drawings and writing number sentences on the board.
10 ÷ 10 = 1 group of 10 20 ÷ 10 = 2 groups of 1040 ÷ 10 = 4 groups of 10
Ask the class to solve the division by 10 problems on the board. 80 ÷ 10 = 8 400 ÷ 10 = 40 500 ÷ 10 = 50600 ÷ 10 = 60 800 ÷ 10 = 80 460 ÷ 10 = 46520 ÷ 10 = 52 680 ÷ 10 = 68
Pupils explore the short cuts to divide by multiples of 10 in example 2.
They demonstrate the short cut to multiply by multiples of 10 on the board.
490 ÷ 70 → 490 ÷ 10 ÷ 7 → 49 ÷ 7 = 7640 ÷ 80 → 640 ÷ 10 ÷ 8 → 64 ÷ 8 = 8360 ÷ 90 → 360 ÷ 10 ÷ 9 → 36 ÷ 9 = 4

17Theme 2: Basic operations – Multiplication and division
Remind the pupils about the terminology describing the parts in a division calculation. Encourage them to use the terminology when they explain solutions or problems.
The pupils work on their own to complete the workbook exercises either in class or as homework.
Exercise 5 (pb page 25)1. a) 5 b) 9 c) 8 d) 12 e) 7 f) 30 g) 56 h) 60 i) 48 j) 87 k) 70 l) 48
2. a) 72 b) 36 c) 24 d) 18 e) 14.4 f) 12 g) 9 h) 8
Exercise 6 (pb page 26)1. a) 8 b) 4 c) 5 d) 10.29 e) 9 f) 9 g) 3 h) 5 i) 5
Quantitative reasoning2. a) 38 b) 6 c) 20 d) 80
3. a) 18 b) 6
4. a) 140; 14; 7 b) 450; 45; 9 c) 1 320; 66; 11
Workbook: Exercise 3 (wb page 12)1. a) 60 → 6; 90 → 9; 140 → 14; 310 → 31; 390 → 39;
290 → 29b) 60 → 3; 800 → 40; 300 → 15; 600 → 30; 120 → 6;
280 → 14
2. a) 30 b) 12 c) 10 d) 6 e) 109 f) 109
3. a) 248 beans b) 62 beans
Divide numbers by 100 and 200Inform the pupils they will divide numbers by 10, 100 and 200 when they work with decimals in Unit 11. They will now divide whole numbers by 100 and 200.
18 Term 1: Unit 4: Multiply and divide whole numbers
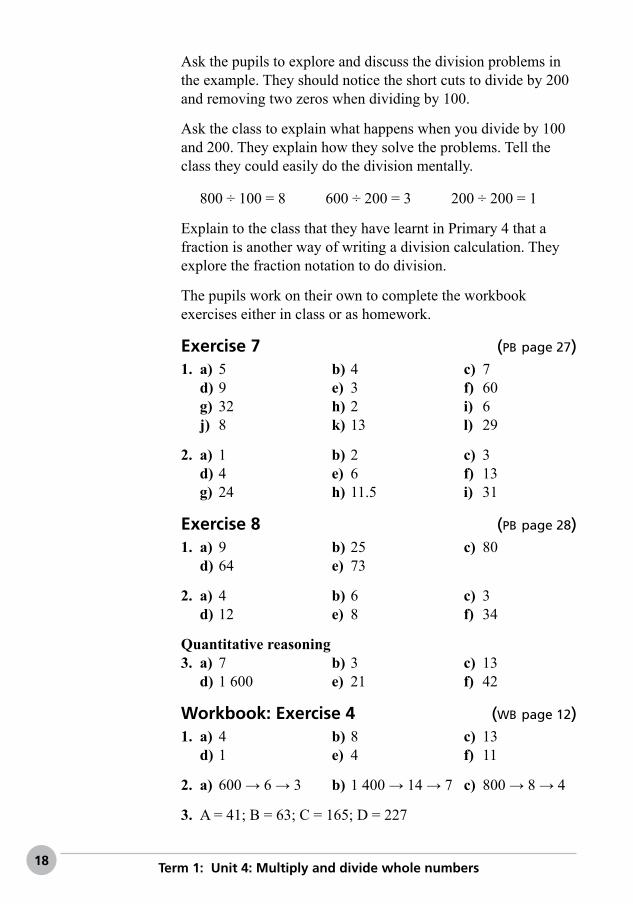
Ask the pupils to explore and discuss the division problems in the example. They should notice the short cuts to divide by 200 and removing two zeros when dividing by 100.
Ask the class to explain what happens when you divide by 100 and 200. They explain how they solve the problems. Tell the class they could easily do the division mentally.
800 ÷ 100 = 8 600 ÷ 200 = 3 200 ÷ 200 = 1
Explain to the class that they have learnt in Primary 4 that a fraction is another way of writing a division calculation. They explore the fraction notation to do division.
The pupils work on their own to complete the workbook exercises either in class or as homework.
Exercise 7 (pb page 27)1. a) 5 b) 4 c) 7 d) 9 e) 3 f) 60 g) 32 h) 2 i) 6 j) 8 k) 13 l) 29
2. a) 1 b) 2 c) 3 d) 4 e) 6 f) 13 g) 24 h) 11.5 i) 31
Exercise 8 (pb page 28)1. a) 9 b) 25 c) 80 d) 64 e) 73
2. a) 4 b) 6 c) 3 d) 12 e) 8 f) 34
Quantitative reasoning3. a) 7 b) 3 c) 13 d) 1 600 e) 21 f) 42
Workbook: Exercise 4 (wb page 12)1. a) 4 b) 8 c) 13 d) 1 e) 4 f) 11
2. a) 600 → 6 → 3 b) 1 400 → 14 → 7 c) 800 → 8 → 4
3. A = 41; B = 63; C = 165; D = 227

19Theme 2: Basic operations – Multiplication and division
Divide whole numbers by 2-digit numbersRemind the class they have divided 2- and 3-digit numbers by 1-digit divisors using long division in Primary 4. They will now use long division to divide 3-digit numbers by 2-digit numbers and solve real-life problems.
Ask the class to explore and discuss the real-life problem in example 1 to find the number of trees planted in one row. They should realise they have to divide to calculate the answer. Remind the class they can first estimate the solution by rounding off dividends and divisors to find approximate solutions.
Pupils explore and discuss the long division method to solve the problem in example 2 and find the actual solution is 16 trees so the estimate is close. Explain to the class that they could also use a clue card and doubling and halving to help them divide by 2-digit numbers.
Pupils solve the problem on the board using the clue card.
299 ÷ 23 = 13
The pupils work on their own to complete the workbook exercises either in class or as homework.
Exercise 9 Quantitative reasoning (pb page 29)1. a) 15 b) 72 c) 108 d) 8 e) 55 f) 40 g) 24 h) 10
2. a) 22; 18 b) 13.5; 15 c) 32; 23 d) 17; 16 e) 21.5; 18 f) 16.33; 18 g) 22.33; 21 h) 14.67; 13
3. a) 1 225; 49 b) 546; 42 c) 918; 27
4. a) All correct. b) 350; 14; 2
Exercise 10 Quantitative reasoning (pb page 31)1. ₦30 2. 22 necklaces 3. 30 stops4. 15 loaves 5. 14 sweets
Workbook: Exercise 5 (wb page 13)1. a) 15 b) 14 c) 17
2. a) ₦25 b) 12 biscuits
3. a) 325 b) 561 c) 338 d) 735

20 Term 1: Unit 5: Identify odd, even and prime numbers; find LCM and HCF
1THEME Numbers and numeration
Whole numbers: LCM and HCF
Term 1
Unit 5: Identify odd, even and prime numbers; find LCM and HCF
Teaching guidelines and solutions
Instructional resourcesObjects in pictures; cubes; tables; flow diagrams; problem cards; prime number chart; multiples charts; factor chart
Ask the class to explore the numbers in the game of hopscotch in the example. They write sequences on the board for the numbers in the blocks the girl jumps on and the numbers in the blocks she skips.
Ask them to describe the numbers to find out if they know odd and even numbers. They extend the sequences by filling in the next five numbers in each sequence.
Odd and even numbersAsk the class to explore and discuss the numbers represented by the cubes in the example. Let them describe the numbers in blue and in red to find out if they recognise odd and even numbers. They describe the arrangement of cubes.
Pupils explore the numbers in the table and say whether they are odd or even. Draw the table on the board and ask the pupils to multiply them by 2. They explain what they notice about the products, which are even numbers. Pupils should deduce that, if you multiply odd numbers by 2, the products are even numbers.
Pupils find out what happens when you multiply two odd numbers and deduce that the products are odd numbers.
Tell them we can perform a test to find whether numbers are odd or even by dividing by 2.
21Theme 1: Numbers and numeration – Whole numbers: LCM and HCF
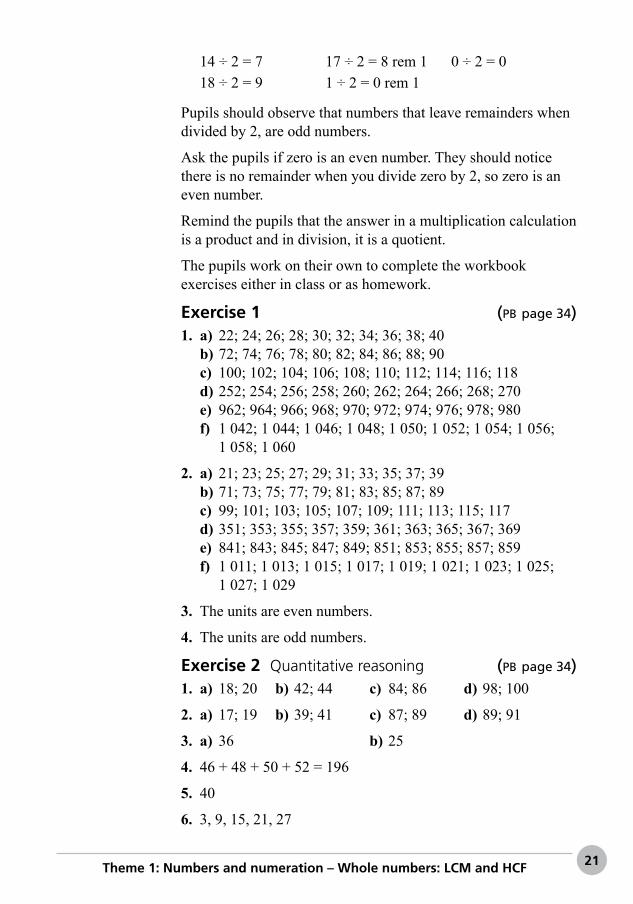
14 ÷ 2 = 7 17 ÷ 2 = 8 rem 1 0 ÷ 2 = 018 ÷ 2 = 9 1 ÷ 2 = 0 rem 1
Pupils should observe that numbers that leave remainders when divided by 2, are odd numbers.
Ask the pupils if zero is an even number. They should notice there is no remainder when you divide zero by 2, so zero is an even number.
Remind the pupils that the answer in a multiplication calculation is a product and in division, it is a quotient.
The pupils work on their own to complete the workbook exercises either in class or as homework.
Exercise 1 (pb page 34)1. a) 22; 24; 26; 28; 30; 32; 34; 36; 38; 40
b) 72; 74; 76; 78; 80; 82; 84; 86; 88; 90c) 100; 102; 104; 106; 108; 110; 112; 114; 116; 118d) 252; 254; 256; 258; 260; 262; 264; 266; 268; 270e) 962; 964; 966; 968; 970; 972; 974; 976; 978; 980f) 1 042; 1 044; 1 046; 1 048; 1 050; 1 052; 1 054; 1 056;
1 058; 1 060
2. a) 21; 23; 25; 27; 29; 31; 33; 35; 37; 39b) 71; 73; 75; 77; 79; 81; 83; 85; 87; 89c) 99; 101; 103; 105; 107; 109; 111; 113; 115; 117d) 351; 353; 355; 357; 359; 361; 363; 365; 367; 369e) 841; 843; 845; 847; 849; 851; 853; 855; 857; 859f) 1 011; 1 013; 1 015; 1 017; 1 019; 1 021; 1 023; 1 025;
1 027; 1 029
3. The units are even numbers.
4. The units are odd numbers.
Exercise 2 Quantitative reasoning (pb page 34)1. a) 18; 20 b) 42; 44 c) 84; 86 d) 98; 100
2. a) 17; 19 b) 39; 41 c) 87; 89 d) 89; 91
3. a) 36 b) 25
4. 46 + 48 + 50 + 52 = 196
5. 40
6. 3, 9, 15, 21, 27

22 Term 1: Unit 5: Identify odd, even and prime numbers; find LCM and HCF
Workbook: Exercise 1 (wb page 15)1. a) 9; 5; 7; 13; 21 b) 17; 25; 31; 37 c) 53; 55; 59
2. a) 8; 4; 6; 10 b) 12; 20; 22; 24 c) 34; 36; 38; 40
3. a) even (16 leaves) b) even (30 boxes) c) odd (19 beans) d) even (28 matchsticks)
4. a) 60 b) 60 remainder 1 c) 74 d) 76 remainder 1 e) 1 001 ; odd number f) 1 004 remainder 1
5. There are 4 possible different answers: 10 × 12; 20 × 6; 4 × 30; 2 × 60
6. 1 + 3 + 5 + 7 + 9 + 11 + 13 + 15 + 17 + 19 = 100
Prime numbers and prime factorsAsk the class to explore Moji and Dele’s problems in the speech bubbles in example 1 and find the solutions. Let them write open sentences on the board to show their reasoning and solve them.
8 × □ = 32 42 ÷ □ = 632 ÷ 8 = 4 42 ÷ 6 = 7
Let the pupils explore and discuss the names of parts of multiplication and division calculations in the diagrams. They explain what a multiple and factor are. Let them list the multiples and factors of the given numbers on the board, and find out how many factors the numbers have.
Give the pupils copies of the template of the 100-grid in example 2 on the next page. Let them follow the steps to circle and shade the numbers indicated in the grid. Explain to them that the numbers they have circled in the 100-grid are prime numbers. Prime numbers have only 2 factors, i.e. 1 and the number itself.
Explain to the pupils that the 100-grid is called the Sieve (sift) of Eratosthenes named after a famous Greek mathematician. He discovered this way of distinguishing prime numbers from other numbers.
Let them list the factors of 1 to find out that 1 is not a prime number. Ask them how many even numbers they can find

23Theme 1: Numbers and numeration – Whole numbers: LCM and HCF
among the numbers they have circled in the 100-grid. They should discover that 2 is the only even prime number.
Ask the class to list the prime numbers less than 20:
→ 2; 3; 5; 7; 11; 13; 17; 19.
Let them explore the numbers in the grid to find out if all odd numbers are prime numbers. Ask the pupils to list the factors of 9, 15, 21 and 25, which are odd numbers. They should notice that they are not prime numbers; they have more than 2 factors.
Factors of 9 → 1; 3; 9 Factors of 21 → 1; 3; 7; 21Factors of 15→ 1; 3; 5; 15 Factors of 25 → 1; 5; 25
The pupils work on their own to complete the workbook exercises either in class or as homework.
1 2 3 4 5 6 7 8 9 10
11 12 13 14 15 16 17 18 19 20
21 22 23 24 25 26 27 28 29 30
31 32 33 34 35 36 37 38 39 40
41 42 43 44 45 46 47 48 49 50
51 52 53 54 55 56 57 58 59 60
61 62 63 64 65 66 67 68 69 70
71 72 73 74 75 76 77 78 79 80
81 82 83 84 85 86 87 88 89 90
91 92 93 94 95 96 97 98 99 100
Exercise 3 (pb page 36)1. a) 2; 3; 5; 7 b) 11; 13; 17; 19 c) 23; 29; 31; 37 d) 41; 43; 47; 53; 59 e) 61; 67; 71; 73; 79 f) 83; 89; 97
2. a) 9; 3; Factors: 1; 3; 9; Prime factor: 3b) 1; 4; Factors: 1; 2; 4; 8; Prime factor: 2c) 10; 5; Factors: 1; 2; 5; 10; Prime factors: 2; 5d) 1; 5; 5; Factors: 1; 5; 25; Prime factor: 5
Exercise 4 (pb page 37)1. a) 1; 7 b) 1; 2 ; 3 ; 6 c) 1; 2 ; 4; 8; 16 d) 1; 5

24 Term 1: Unit 5: Identify odd, even and prime numbers; find LCM and HCF
e) 1; 2 ; 3 ; 4; 6; 12 f) 1; 11 g) 1; 3 ; 5 ; 15 h) 1; 2 ; 7 ; 14 i) 1; 2 j) 1; 2 ; 4 k) 1; 2 ; 3 ; 6; 9; 18 l) 1
2. a) 9; 18; 27; 36; 45 b) 14; 21; 28; 35; 49 c) 16; 24; 32; 40; 56 d) 24; 30; 36; 48; 72
3. a) 46 = 2 × 23 b) 21 = 3 × 7 c) 60 = 2 × 2 × 3 × 5 d) 35 = 5 × 7 e) 80 = 2 × 2 × 2 × 2 × 5 f) 57 = 3 × 19 g) 150 = 2 × 3 × 5 × 5 h) 210 = 2 × 3 × 5 × 7
a)4. b)30
3 10
5 2
33
11 3
c) 510
2
5
255
51
3 17
165
5
Exercise 5 (pb page 38)1. 27 = 3 × 3 × 3 2. 30 = 2 × 3 × 53. 32 = 2 × 2 × 2 × 2 × 2 4. 50 = 2 × 5 × 55. 72 = 2 × 2 × 2 × 3 × 3 6. 24 = 2 × 2 × 2 × 37. 36 = 2 × 2 × 3 × 3 8. 28 = 2 × 2 × 7
Workbook: Exercise 2 (wb page 17)1. All prime numbers are odd numbers (except 2).
2. 9; 15; 21; 25; 27
3. a) 30; 30 b) 15; 15 c) 6; 6 d) 1; 2; 3; 5; 6; 10; 15; 30
4. a) 5 × 5 b) 13 × 2 c) 5 × 7
5. a) 3; 3 b) 32; 4; 2
6. a) 84 = 2 × 2 × 3 × 784
2
2
42
21
3 7
b) 190 = 2 × 5 × 19190
2
5
95
19
25Theme 1: Numbers and numeration – Whole numbers: LCM and HCF
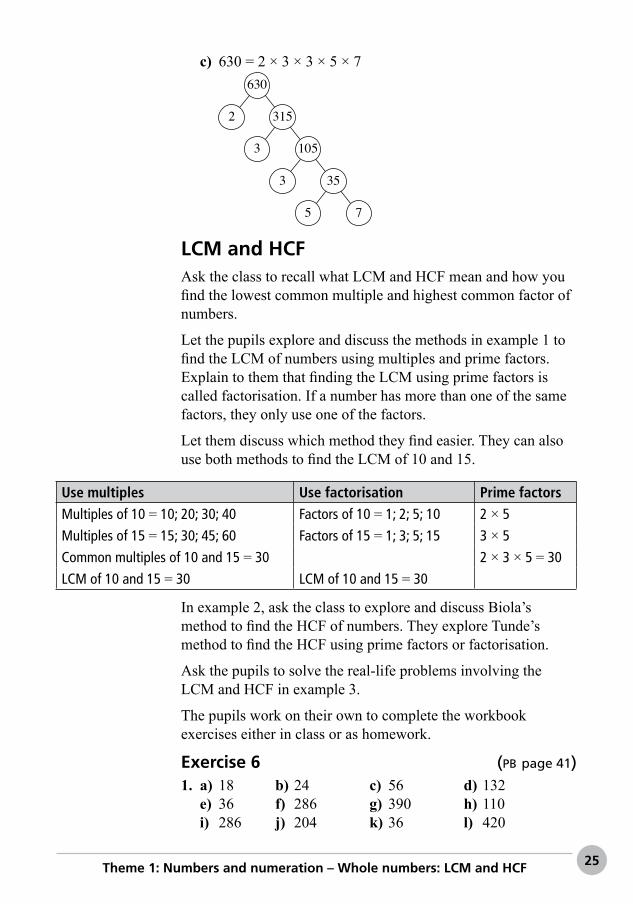
c) 630 = 2 × 3 × 3 × 5 × 7630
2
3
315
105
3 35
5 7
LCM and HCFAsk the class to recall what LCM and HCF mean and how you find the lowest common multiple and highest common factor of numbers.
Let the pupils explore and discuss the methods in example 1 to find the LCM of numbers using multiples and prime factors. Explain to them that finding the LCM using prime factors is called factorisation. If a number has more than one of the same factors, they only use one of the factors.
Let them discuss which method they find easier. They can also use both methods to find the LCM of 10 and 15.
Use multiples Use factorisation Prime factorsMultiples of 10 = 10; 20; 30; 40 Factors of 10 = 1; 2; 5; 10 2 × 5
Multiples of 15 = 15; 30; 45; 60 Factors of 15 = 1; 3; 5; 15 3 × 5
Common multiples of 10 and 15 = 30 2 × 3 × 5 = 30
LCM of 10 and 15 = 30 LCM of 10 and 15 = 30
In example 2, ask the class to explore and discuss Biola’s method to find the HCF of numbers. They explore Tunde’s method to find the HCF using prime factors or factorisation.
Ask the pupils to solve the real-life problems involving the LCM and HCF in example 3.
The pupils work on their own to complete the workbook exercises either in class or as homework.
Exercise 6 (pb page 41)1. a) 18 b) 24 c) 56 d) 132 e) 36 f) 286 g) 390 h) 110 i) 286 j) 204 k) 36 l) 420
26 Term 1: Unit 5: Identify odd, even and prime numbers; find LCM and HCF
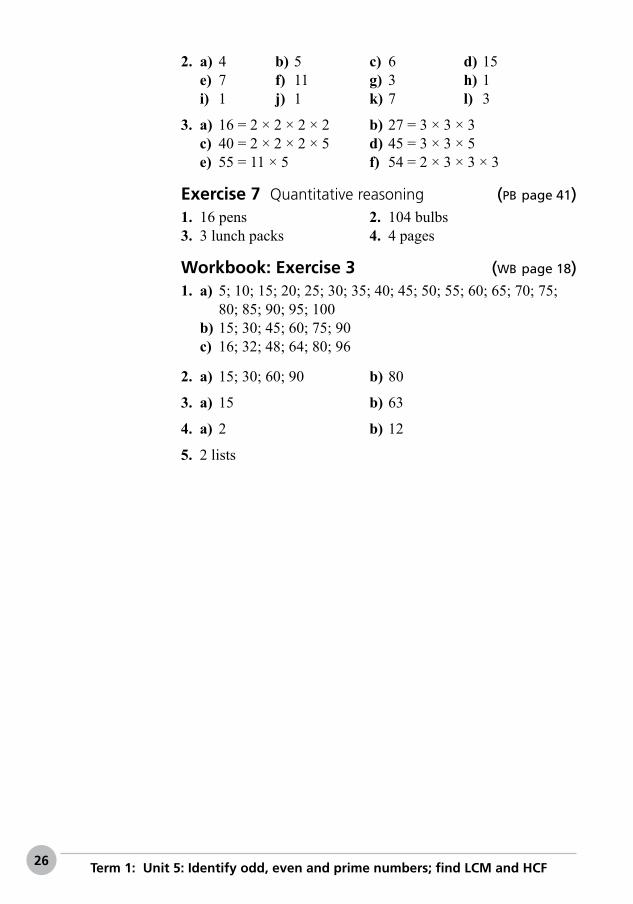
2. a) 4 b) 5 c) 6 d) 15 e) 7 f) 11 g) 3 h) 1 i) 1 j) 1 k) 7 l) 3
3. a) 16 = 2 × 2 × 2 × 2 b) 27 = 3 × 3 × 3 c) 40 = 2 × 2 × 2 × 5 d) 45 = 3 × 3 × 5 e) 55 = 11 × 5 f) 54 = 2 × 3 × 3 × 3
Exercise 7 Quantitative reasoning (pb page 41)1. 16 pens 2. 104 bulbs3. 3 lunch packs 4. 4 pages
Workbook: Exercise 3 (wb page 18)1. a) 5; 10; 15; 20; 25; 30; 35; 40; 45; 50; 55; 60; 65; 70; 75;
80; 85; 90; 95; 100b) 15; 30; 45; 60; 75; 90c) 16; 32; 48; 64; 80; 96
2. a) 15; 30; 60; 90 b) 80
3. a) 15 b) 63
4. a) 2 b) 12
5. 2 lists

27Theme 1: Numbers and numeration – Whole numbers: Square numbers and roots
1THEME Numbers and numeration
Whole numbers: Square numbers and roots
Term 1
Unit 6: Calculate square numbers and square roots
Teaching guidelines and solutions
Instructional resourcesSquares; chessboard; 20 × 20 square chart; flow diagrams; tables; square grids
Ask the class if they can recall what squares and square roots are. Write the numbers 6, 9 and 10 and 144, 400 and 121 on the board and ask the class to give the squares and square roots of the numbers.
Ask the class to explore and discuss the tile patterns in the example and give the number of tiles in each square. They explain their counting methods.
Pupils explain the given squares and square roots. Let them read the square roots and squares.
Find squares and square roots of numbers up to 12Remind the class that they should know the squares of numbers up to 12. Let them find the squares of numbers 1 to 12 in the table.
Exercise 1 (pb page 43)1. a) 36 b) 25 c) 64 d) 81
2. a) 81 b) 121 c) 1 d) 25 e) 49 f) 4 g) 144 h) 81 i) 100 j) 9
3. a) 12 b) 9 c) 8 d) 4 e) 1 f) 6 g) 7 h) 10 i) 11 j) 3
4. 8 cm 5. 12 m

28 Term 1: Unit 6: Calculate square numbers and square roots
Squares and square roots of bigger numbersAsk the class to explore and discuss the methods to calculate squares of bigger numbers showing the breaking up and the column methods in the example.
Then let them explore and explain the method or rule to calculate squares of numbers ending in 5. They should notice that you add 1 to the tens digit and multiply by the number in the tens place. They multiply the unit digit by itself and combine the products to create the squares.
The pupils work on their own to complete the workbook exercises either in class or as homework.
Exercise 2 (pb page 44)1. a) 169 b) 196 c) 289 d) 324
2. a) 225 b) 3 025 c) 1 225 d) 4 225
3. Quantitative reasoning11
15
9
100
25
7
10 000
49
121
625
225
81
Exercise 3 (pb page 44)1. a) 361 b) 400 c) 784 d) 729 e) 841
2. a) 14 b) 18 c) 13 d) 50 e) 25
Quantitative reasoning3. 7 225 mm2
4. 40 m 5. 9; 13; 14Exercise 4 (pb page 45)Row 2: 144 + 49 + 36 + 81 = 310Row 3: 64 + 121 + 100 + 25 = 310Row 4: 169 + 4 + 9 + 256 = 438

29Theme 1: Numbers and numeration – Whole numbers: Square numbers and roots
Column 1: 1 + 144 + 64 + 169 = 378Column 2: 196 + 49 + 121 + 4 = 370Column 3: 225 + 36 + 100 + 9 = 370Column 4: 16 + 81 + 25 + 256 = 378
Rows 1 and 4; Rows 2 and 3; Columns 1 and 4; Columns 2 and 3 are the same values.
Workbook: Exercise 1 (wb page 19)1. 4; 16; 49; 100; 121
2. a) 49 b) 1 c) 81
3. a) 9 × 9 = 81 b) 10 × 10 = 100 c) 11 × 11 = 121 d) 12 × 12 = 144
4. a) 3 b) 6 c) 11 d) 10 e) 9 f) 8 g) 15 h) 1
5. a) 169 = 13 × 13 = 132 b) 289 = 17 × 17 = 172
c) 64 = 8 × 8 = 82 d) 576 = 24 × 24 = 242
6.× 40 39 38 37 36 35 34 33 32 3140 1 60039 1 52138 1 44437 1 36936 1 29635 1 22534 1 15633 1 08932 1 02431 96130 90029 84128 78427 72926 67625 62524 57623 52922 48421 441× 21 22 23 24 25 26 27 28 29 30

30 Term 1: Unit 6: Calculate square numbers and square roots
7. √ _____
1 600 = 40 m
8. √ ____
900 = 30 m
Calculate with squares and square rootsAsk the class to explore and explain the different methods in the example that show calculations with squares and square roots. Assist the pupils in understanding how operations are performed when expressions are under one square root symbol and when square root symbols are separated.
The pupils work on their own to complete the workbook exercises either in class or as homework.
Exercise 5 (pb page 46)1. a) 116 b) 39 c) 18 d) 23
2. Quantitative reasoning a) 32 + 62 = 45 b) 72 + 72 = 98 c) 122 + 82 = 208 d) 142 + 162 = 452
3. a) 21 b) 3 c) 66 d) 2 e) 8 f) 38 g) 2 h) 6 i) 17 j) 7 k) 9 l) 14 m) 18 n) 9 o) 7 p) 8
Workbook: Exercise 2 (wb page 22)1. a) 18 b) 7 c) 36 d) 2
2. a) 7 b) 9 c) 11 d) 15
3. a) 8 × 2 = 16 b) 9 × 2 = 18 c) 3 × 5 = 15 d) 7 × 2 = 14
4. a) 26 b) 28 pupils
Use different methods to calculate square rootsRemind the class they have worked with factors and prime factors in Unit 5. Inform them that they will now use factors and prime factors to calculate square roots of numbers. Let them write the prime numbers less than 100 on the board.

31Theme 1: Numbers and numeration – Whole numbers: Square numbers and roots
In the example, explain the different methods to find square roots, i.e. using a square chart, the middle factor, and factorisation.
Pupils find the square roots of the circled numbers on the square chart mentally.
√ __
1 = 1 √ __
4 = 2 √ __
9 = 3 √ ___
16 = 4 √ ___
25 = 5
Ask pupils to list the factors of the given numbers and find the middle factor in each list, which is the square root of the number.
Factors of 16 = 1; 2; 4; 8; 16 √ ___
16 = 4Factors of 64 = 1; 2; 4; 8; 16; 32; 64 √
___ 64 = 8
Factors of 100 = 1; 2; 4; 5; 10; 20; 25; 50; 100 √ ____
100 = 10
Assist the pupils in understanding the different methods of factorisation. They explore the methods using factors, prime factors and using division in the prime factor grid.
Ask pupils to use the three methods to find the square roots of the given numbers.
Exercise 6 (pb page 48)1. a) 1, 5, 25 b) 1, 2, 4 c) 1, 7, 49 d) 1, 11, 121 e) 1, 3, 5, 9, 15, 25, 45, 75, 225 f) 1, 13, 169
2. a) 4 b) 8 c) 6 d) 9 e) 10 f) 7 g) 13 h) 11
3. a) 2 × 2 × 2 × 2 = 16 b) 19 c) 2 × 11 = 22 d) 5 × 5 = 25 e) 2 × 7 = 14 f) 17 g) 5 × 2 × 2 = 20 h) 23 i) 2 × 13 = 26 j) 3 × 5 = 15 k) 2 × 3 × 3 = 18 l) 2 × 2 × 2 × 3 = 24
Exercise 7 Quantitative reasoning (pb page 49)1. 25 m 2. 20 m 3. 25
4. a) 4 b) 9; 81 c) 6; 1 296 d) 3; 9

32 Term 1: Unit 7: Solve open sentences
3THEME Algebraic processes
Algebraic operations
Term 1
Unit 7: Solve open sentences
Teaching guidelines and solutions
Instructional resourcesCalculation cards; flow diagrams; multiplication array grids; objects in pictures; flow diagrams; balancing scales
Ask the class to explore and discuss the calculations in the example. They should observe the inverse relationships between addition and subtraction and between multiplication and division. Remind the class that we often use inverse operations to solve open sentences.
Use inverse operations to find unknown valuesAsk the class to explore and discuss the calculations on the cards in the example. Let them work on the board to find the values of the placeholders.
Pupils should notice the application of inverse operations and the substitution to show the value of the unknown number in the equations and to check the solutions.
Explain to the class that we sometimes apply the same operations to solve open sentences by swapping the numbers, i.e. applying the commutative property. Let them explore and discuss the examples.
The pupils work on their own to complete the workbook exercises either in class or as homework.
Exercise 1 (pb page 51)1. 14 2. 49 3. 17 4. 85. 6; 30 6. 72 7. 8 8. 109. 13 10. 192 11. 375 12. 513. 50 14. 12 15. 66

33Theme 3: Algebraic processes – Algebraic operations
Exercise 2 Quantitative reasoning (pb page 51)1. a) 4 b) 12 c) 24; 2
2. a) □ + 125 = 284; □ = 159b) 5 × □ = 60; □ = 12c) 1 _ 2 × 54 = □; □ = 27d) 75 − □ = 59; □ = 16
Workbook: Exercise 1 (wb page 23)1. 92 − 67 = 25 2. 47 + 24 = 713. 196 ÷ 14 = 14 4. 150 × 5 = 750
Letters that represent unknown valuesInform the class that, instead of placeholders we get equations with letters of the alphabet representing unknown number values. Any letter could appear in open sentences and letters have the same function as placeholders, i.e. to represent unknown numbers in open sentences. We sometimes do not use the multiplication sign in open sentences. The expression 2 × p, is written as 2p, for example.
In the example, ask the class to explore and explain Primary 5 pupils’ methods to solve open sentences. They should realise that the problems are solved in the same way as open sentences with placeholders. Draw their attention to the substitution to check solutions.
The pupils work on their own to complete the workbook exercises either in class or as homework.
Exercise 3 (pb page 52)1. 43 2. 36 3. 75 4. 155. 76 6. 26 7. 13 8. 139. 7 10. 441 11. 7 12. 425
Workbook: Exercise 2 (wb page 24)1. a) 49 − 7 = 42 b) 54 − 47 = 7 c) 42 ÷ 7 = 6 d) 72 × 8 = 576 e) 72 ÷ 9 = 8
2. A: 1 chicken is 250 g. B: 1 chicken is 375 g.
3. m = 15; n = 28; p = 4; x = 70; y = 49

34 Term 1: Unit 7: Solve open sentences
Equations that balanceRemind the pupils that they have started working with equations that work like a balancing scale. The number values of these equations should be equal on both sides of the = signs. Ask the class to explore and discuss the weights and tins of paint on the balancing scale in example 1. The weights represent kilograms. They should find the weight of one tin of paint.
Let the class explore and discuss the method showing the equation to find the weight of one tin of paint. They should observe the cans represent the unknown values, that they first write an open sentence, remove the same number of tins and weights on either side of the scale, and apply inverse operations to find the weight of one tin of paint.
In example 2, ask the class to explore and explain the weights and objects on the scales and the methods to solve the equations. They should observe that letters are used to represent unknown values. These are called variables in algebra.
Exercise 4 (pb page 54)1. a) 3b = 15; b = 5 kg b) 2b + 3 = 9; b = 3 kg c) 4b = 12; b = 3 kg d) 4b = b + 12; b = 4 kg e) 3b + 2 = 8; b = 2 kg f) 5b + 2 = 2b + 8; 3b = 6; b = 2 kg
2. a) p = 20 b) x = 12 c) m = 8 d) a = 7 e) y = 9 f) x = 6 g) m = 6 h) p = 4 i) x = 6 j) y = 7 k) n = 3 l) m = 12 m) p = 10 n) x = 4 o) y = 1 p) a = 6 q) p = 125
___ 16 or 7.81 r) z = 1

35Theme 2: Basic operations – Derived operations
2THEME Basic operations
Derived operations
Term 1
Unit 8: Add and subtract integers on number lines
Teaching guidelines and solutions
Instructional resourcesThermometers; number lines; integer pyramid; vertical number lines; tables; number cards
Write some negative numbers on the board and ask pupils where they observe the numbers in real life. Pupils might have observed countries experiencing weather with temperatures of zero and below on TV or in newspapers.
Inform the class that numbers do not stop at zero; there are numbers beyond zero. Let them look at the number line to observe the negative and positive whole numbers or integers and explain to them that zero is neutral − it is not positive or negative. Pupils find the numbers the arrows point to on the number line and compare numbers to find which is bigger.
Add and subtract positive and negative numbersAsk the class to explore and solve the calculations represented on the number line. They count on 8 from −5 to find 3 and count back 11 spaces from 4 to get −7.
Ask them to use the number line to add and subtract to solve the number sentences.
−4 + 5 = 1 6 − 8 = −2 5 − 6 = −1 −8 + 4 = −4−10 + 4 = −6 1 − 7 = −6 −5 + 6 = 1 −3 + 2 = −1
Explain to the class when we add negative 4 and positive 4, the answer is 0. When you add the same positive and negative number, the sum is always zero. −4 is the inverse of 4 or +4.

36 Term 1: Unit 8: Add and subtract integers on number lines
The pupils work on their own to complete the workbook exercises either in class or as homework.
Exercise 1 (pb page 57)1. a) 1 b) 0 c) 2 d) 5 e) 1 f) −1 g) 0 h) 0 i) 0
−8−9−1
45−4−9
110
−5 0 −3
−8 −2
43−7
−10
−5 −3 1
2.
Exercise 2 (pb page 57)1. a) 4−□=−6;□ = 10 b) 1−□=−3;□ = 4 c) 2−□=−4;□=6 d) 3−□=−5;□ = 8
2. a) 1;0;−1 b) 2;0;−2 c) 0;−10;−20 d) −5;−6;−7 e) −5;0;5 f) 1;−1;−3
3. a) 3 b) 9 c) 13 d) 8 e) 8 f) −3 g) 12 h) 10
Quantitative reasoning4. a) i) 12 °C ii) 12 °C iii) 6°C b) 36°C
5. B:−5°C 6. A:−2°C
Workbook: Exercise 1 (wb page 25)1. a) −4 b) 4 c) 5 d) −3 e) −3 f) −3 g) 0 h) 0 i) 0
2. a) 2 b) −6
3. −4+6=2;−4+5=1;−4+3=−1
a)4. b)
11 −4 −5 7
7 −9
−2 −7
−9
2
22 −5 −10
−21
−232
2
−8−1517
5. 56°C 6. 34°C

37Theme 1: Numbers and numeration – Binary numbers
1THEME Numbers and numeration
Binary numbers
Term 1
Unit 9: Identify binary numbers in base 2
Teaching guidelines and solutions
Instructional resourcesCalculation cards; tables; charts; division factor charts; worked examples
Tell the class they will now find out what binary numbers are. Explain that the word binary means composed of two or made up of groups of 2. The binary or base 2 system consists of the digits 1 and 0. It is the simplest number system. All numbers (base 10) we use can be represented in binary numbers. Explain the use of this system in electronic counting devices.
Ask the class what the remainders are when they divide even and odd numbers by 2.
2 ÷ 2 = 1 rem 0 4 ÷ 2 = 2 rem 0 6 ÷ 2 = 3 rem 03 ÷ 2 = 1 rem 1 5 ÷ 2 = 2 rem 1 7 ÷ 2 = 3 rem 1
Dividing even numbers by 2 leaves a remainder of 0.Dividing odd numbers by 2 leaves a remainder of 1.
Inform the class that the base 2 system is based on the remainders in division of odd and even numbers.
Remind the pupils they learnt about powers of 10 this term. Our number system, the base 10 system, is based on the fact that we have 10 fingers that we use for counting. We use groups of 10 (101 = 10 to the power 1), 100 (102 = 10 to the power 2), 1 000 (103 = 10 to the power 3), etc. to count and represent place values and values of digits. Let the pupils explore and discuss the place values and values in the place value table. They should understand that any number to the power of zero is equal to 1. Ask the class to write the powers of 10 on the board.
10 000 = 104 100 000 = 105 1 000 000 = 106

38 Term 1: Unit 9: Identify binary numbers in base 2
They should observe the number of zeros in the numbers is also the index or exponent showing the power of the numbers. They explore and explain the number in expanded notation using powers of 10. Ask the pupils to write the given number in expanded notation using powers of 10.
6 862 143 = (6 × 10⁶) + (8 × 10⁵) + (6 × 10⁴) + (2 × 10³) + (1 × 10²) + (4 × 101) + (3 × 100)
Inform the class that numbers in base 2 (base2) have values of powers of 2 or groupings of 2. Encourage the class to learn the powers of 2 by heart. They explore the powers of 2 and their values in the table. Ask the class to use the table to find the values of the powers of 2.
Convert between numbers in base 10 and base 2Inform the class that we find the number of groups of 2 in a number by dividing by 2 repeatedly, as in factorisation until the remainder is 0 or 1. You use the remainders 0 and 1 to represent the numbers in base2, reading the number from the bottom up. The bottom digit is the highest power of 2 and the top digit the lowest power in the number.
Let the pupils explore and discuss the representation of the number 84 in base10 and base2 in example 1.
In example 2, ask the class to explore and discuss the groupings of 2 and the binary numbers for the numbers 1 to 5 in base 10 in the chart. Draw their attention to the last column for the explanations.
Let the pupils draw the groups of 2 and the remainders on the board to write the base 10 numbers 6 to 10 in base 2 and explain the division by 2.
6 ÷ 2 = 3 rem 0 3 ÷ 2 = 1 rem 1 1 ÷ 2 = 0 rem 1 62 = 110 = (22 + 21) = 4 + 2
7 ÷ 2 = 3 rem 1 3 ÷ 2 = 1 rem 1 1 ÷ 2 = 0 rem 1 72 = 111 = (22 + 21 + 20) = 4 + 2 + 1
8 ÷ 2 = 4 rem 0 4 ÷ 2 = 2 rem 0 2 ÷ 2 = 1 rem 0 1 ÷ 2 = 0 rem 1 82 = 1000 = 23 = 8

39Theme 1: Numbers and numeration – Binary numbers
9 ÷ 2 = 4 rem 1 4 ÷ 2 = 2 rem 0 2 ÷ 2 = 1 rem 0 1 ÷ 2 = 0 rem 1 92 = 1001 = (23 + 20) = 8 + 1
10 ÷ 2 = 5 rem 0 5 ÷ 2 = 2 rem 1 2 ÷ 2 = 1 rem 0 1 ÷ 2 = 0 rem 1 102 = 1010 = (23 + 21) = 8 + 2
The pupils work on their own to complete the workbook exercises either in class or as homework.
Exercise 1 (pb page 61)1.
Base 10
Groups of 2 Binary numbers Explanation
24 23 22 21 20
11 1 0 1 1 11 ÷ 2 = 5 rem 1 5 ÷ 2 = 2 rem 1 2 ÷ 2 = 1 rem 0 1 ÷ 2 = 0 rem 1
12 1 1 0 0 12 ÷ 2 = 6 rem 0 6 ÷ 2 = 3 rem 0 3 ÷ 2 = 1 rem 1 1 ÷ 2 = 0 rem 1
13 1 1 0 1 13 ÷ 2 = 6 rem 1 6 ÷ 2 = 3 rem 0 3 ÷ 2 = 1 rem 1 1 ÷ 2 = 0 rem 1
14 1 1 1 0 14 ÷ 2 = 7 rem 0 7 ÷ 2 = 3 rem 1 3 ÷ 2 = 1 rem 1 1 ÷ 2 = 0 rem 1
15 1 1 1 1 15 ÷ 2 = 7 rem 1 7 ÷ 2 = 3 rem 1 3 ÷ 2 = 1 rem 1 1 ÷ 2 = 0 rem 1

40 Term 1: Unit 9: Identify binary numbers in base 2
2. a) 2 202 10 Rem 02 5 Rem 02 2 Rem 12 1 Rem 02 0 Rem 1
b) 2 342 17 Rem 02 8 Rem 12 4 Rem 02 2 Rem 02 1 Rem 02 0 Rem 1
3. a) 11101 b) 11111 c) 101100 d) 111001 e) 1000101 f) 1001000 g) 1011000 h) 1011010
Exercise 2 (pb page 62)1.
Place value x8 x7 x6 x5 x4 x3 x2 x1 x0
Powers of 2 28 27 26 25 24 23 22 21 20
Value 256 128 64 32 16 8 4 2 1Number in
base 10
1 0 0 0 1 17
1 0 1 0 1 21
1 1 0 0 1 0 0 100
1 1 1 1 0 0 0 120
1 0 0 0 0 0 0 1 1 259
2. Base 10
Values of powers of 2 Base 2
a) 322 256 + 64 + 2 = 322 1 0 1 0 0 0 0 1 0
b) 362 256 + 64 + 32 + 8 + 2 = 362 1 0 1 1 0 1 0 1 0
c) 525 512 + 8 + 4 + 1 = 525 1 0 0 0 0 0 1 1 0 1
d) 589 512 + 64 + 8 + 4 + 1 = 589 1 0 0 1 0 0 1 1 0 1
e) 1 280 1 024 + 256 = 1 280 1 0 1 0 0 0 0 0 0 0 0
f) 1 425 1 024 + 256 + 128 + 16 + 1 = 1 425 1 0 1 1 0 0 1 0 0 0 1

41Theme 1: Numbers and numeration – Binary numbers
Workbook: Exercise 1 (wb page 27)1. a) 103; 102; 101; 100
b) 27; 26; 23; 22; 21; 20
c) 16; 32; 64; 128
2. Power of 2
20 21 22 23 24 25 26 27 28 29 210
Value 1 2 4 8 16 32 64 128 256 512 1 024
3. a) 24 = 16 b) 27 = 128 c) 25 = 32 d) 28 = 256
4.
16
210
1 024
20
128
28
2
27
1
24
256
21
Workbook: Exercise 2 (wb page 28)1.
Base ten (base10)
Groups of 2 and remainders
Binary numbers Explanation
24 23 22 21 20
17 8 rem 1 1 0 0 0 1 16 + 1
19 9 rem 1 1 0 0 1 1 16 + 2 + 1
23 11 rem 1 1 0 1 1 1 16 + 4 + 2 + 1
2. a) 11110 b) 101010 c) 111101 d) 1100000
3. a) 7 b) 139 c) 413 d) 1 831
4. a) 1510 b) 2710
Add and subtract base-2 numbersDiscuss with the class that base-2 numbers involve many 1s and 0s with long numbers. They would find it easy to add and subtract base 2 numbers. There are only four rules for addition and three rules for subtraction. Ask the pupils to copy the addition and subtraction grids in the example on the board and complete them to discover the rules. Remind the class that 102 = 2.

42 Term 1: Unit 9: Identify binary numbers in base 2
Ask the pupils to explore and discuss the addition with carrying (renaming) of base-2 numbers in the methods. Explain that there cannot be more than 1 in a base-2 place and you carry 2 to the left each time the number is more than 1. Let them convert the sums to base-10 numbers.
Pupils explore and discuss the subtraction in base 2 method and convert the difference to base 10. Ask the class to solve the subtraction of base-2 problems on the board.
The pupils work on their own to complete the workbook exercises either in class or as homework.
Exercise 3 (pb page 64)1. a) 1100 b) 1110 c) 10000 d) 11000 e) 10100 f) 110000 g) 101010 h) 110010 i) 1010110
2. a) 101 b) 10 c) 101 d) 111 e) 110 f) 101 g) 10000 h) 1010 i) 10
Exercise 4 (pb page 64)1. a) 258; 1000000102 b) 394; 1100010102 c) 334; 1010011102
2. a) 10101 b) 11
3. a) 1111 b) 1
4. a) 11 b) 1 c) 10 d) 1100 e) 10 f) 100
Workbook: Exercise 3 (wb page 29)1. a) 10001 b) 101010 c) 10010010
2. a) 110 b) 1111 c) 101

43Theme 1: Numbers and numeration – Fractions: Addition and subtraction
1THEME Numbers and numeration
Fractions: Addition and subtraction
Term 1
Unit 10: Add and subtract fractions
Teaching guidelines and solutions
Instructional resourcesEquivalence diagrams; fraction cards; fraction diagrams; counters; squares; fraction strips
Pupils explore the fractions strips in the example and answer the questions by comparing the fractions. Let them use relation signs to compare fractions using the strips.
First, revise what they know about fractions already.
Let the class fill in the missing numerators and denominators to create equivalent fractions. Inform them that proper fractions are also called vulgar or simple fractions. Proper, improper, and mixed fractions are all common fractions.
3 _ 5 = 27
__ 45 4 _ 5 = 16
__ 20 4 _ 5 = 24
__ 30
4 _ 7 = 16
__ 28 5 _ 8 = 25
__ 40
Pupils give the fractions in their simplest forms or lowest terms. Remind them to use the highest common factor (HCF).
8 __ 12 = 2 _ 3 9 __ 39 = 3 __ 13 15
__ 45 = 1 _ 3 22
__ 50 = 11
__ 25
27
__ 36 = 3 _ 4 28
__ 35 = 4 _ 5 600
___ 900 = 2 _ 3 36
__ 60 = 3 _ 5
Ask the class to convert improper fractions to mixed fractions in their simplest forms.
5 _ 3 = 1 2 _ 3 8 _ 5 = 1 3 _ 5 23
__ 4 = 5 3 _ 4 17
__ 7 = 1 3 _ 7
9 _ 6 = 1 3 _ 6 = 1 1 _ 2 14
__ 8 = 1 6 _ 8 = 1 3 _ 4 24
__ 10 = 2 4 __ 10 = 2 2 _ 5

44 Term 1: Unit 10: Add and subtract fractions
Let the class find the LCM and HCF of the pairs of numbers. LCM of: 3 and 4 = 12 3 and 8 = 24 5 and 6 = 30 7 and 8 = 56HCF of: 12 and 15 = 3 9 and 18 = 9 24 and 30 = 6 15 and 20 = 5
Inform the class they have now revised fractions that should help them to solve addition and subtraction of proper and mixed fractions in the next activities. Add proper fractions and mixed fractionsAsk the class to explore the picture in the example and answer the questions using the fractions displayed in the picture. They explain what happens when you add fractions with the same denominators, i.e. you add the numerators. Remind the pupils that the fractions are unitary fractions, i.e. the numerators are 1.
Ask the class to give equivalent fractions as shown.
1 _ 3 = 4 __ 12 1 _ 4 = 3 __ 12
They find out which fraction of the loaves of bread Paul gets altogether.
Paul gets → 1 _ 3 + 1 _ 4 = 4 __ 12 + 3 __ 12 = 7 __ 12 of the bread.
The pupils realise that fractions with different denominators are converted to fractions with the same denominators using the LCM, the lowest common multiple.
The pupils work on their own to complete the workbook exercises either in class or as homework.
Exercise 1 (pb page 67)1. a) 1 _ 2 b) 5 _ 6 c) 1 5 __ 24 d) 1 19
__ 40
e) 1 8 __ 35 f) 23
__ 24 g) 1 10
__ 33 h) 1 23
__ 90
2. a) 7 3 _ 4 b) 9 5 _ 6 c) 11 1 _ 2 d) 13 23
__ 35
e) 5 19
__ 30 f) 14 3 _ 8 g) 4 11
__ 45 h) 13 1 _ 3
Exercise 2 Quantitative reasoning (pb page 67)1. Funmi plants 4 _ 5 of the whole garden; Funmi plants 3 _ 7 herbs; Serifat plants 5 _ 6 carrots.
2. 1 13
__ 24
3. 3 _ 5
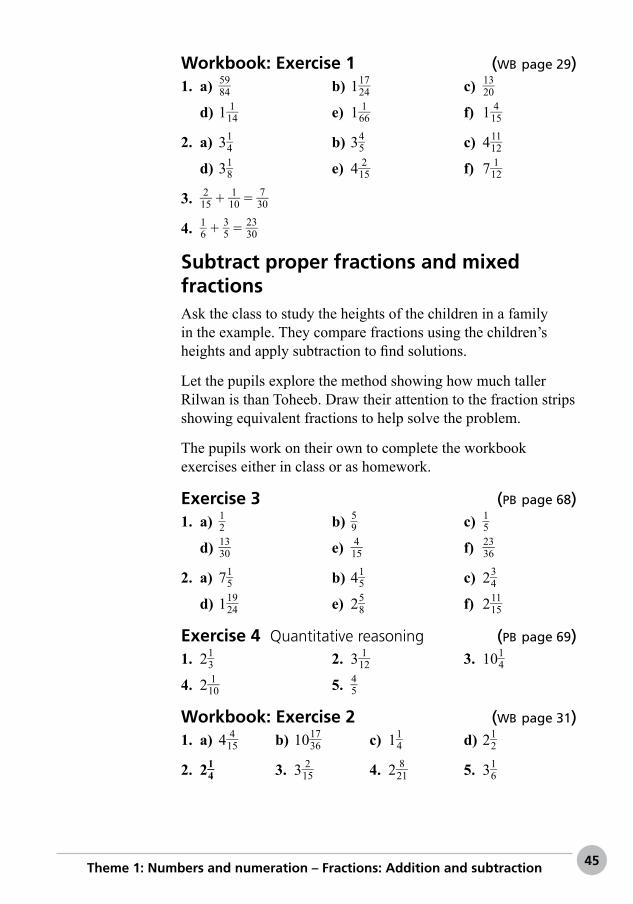
45Theme 1: Numbers and numeration – Fractions: Addition and subtraction
Workbook: Exercise 1 (wb page 29)1. a) 59
__ 84 b) 1 17
__ 24 c) 13
__ 20
d) 1 1 __ 14 e) 1 1 __ 66 f) 1 4 __ 15
2. a) 3 1 _ 4 b) 3 4 _ 5 c) 4 11
__ 12
d) 3 1 _ 8 e) 4 2 __ 15 f) 7 1 __ 12
3. 2 __ 15 + 1 __ 10 = 7 __ 30
4. 1 _ 6 + 3 _ 5 = 23
__ 30
Subtract proper fractions and mixed fractionsAsk the class to study the heights of the children in a family in the example. They compare fractions using the children’s heights and apply subtraction to find solutions.
Let the pupils explore the method showing how much taller Rilwan is than Toheeb. Draw their attention to the fraction strips showing equivalent fractions to help solve the problem.
The pupils work on their own to complete the workbook exercises either in class or as homework.
Exercise 3 (pb page 68)1. a) 1 _ 2 b) 5 _ 9 c) 1 _ 5
d) 13
__ 30 e) 4 __ 15 f) 23
__ 36
2. a) 7 1 _ 5 b) 4 1 _ 5 c) 2 3 _ 4
d) 1 19
__ 24 e) 2 5 _ 8 f) 2 11
__ 15
Exercise 4 Quantitative reasoning (pb page 69)1. 2 1 _ 3 2. 3 1 __ 12 3. 10 1 _ 4
4. 2 1 __ 10 5. 4 _ 5
Workbook: Exercise 2 (wb page 31)1. a) 4 4 __ 15 b) 10 17
__ 36 c) 1 1 _ 4 d) 2 1 _ 2
2. 2 1 _ 4 3. 3 2 __ 15 4. 2 8 __ 21 5. 3 1 _ 6

46 Term 1: Unit 10: Add and subtract fractions
Find fractions of whole numbersInform the class that finding fractions of whole numbers involves comparing the numbers in groups or sets of objects. Ask the pupils to explore the pictures in the examples and answer the questions.
In example 1, they count the number of ducks in pictures A and B. Ask them to use picture B to find the fractions of 12. Pupils should realise that the ducks in picture A are divided into 3 groups and each group is 1 _ 3 of 12 ducks.
They count the number of groups in picture C. Ask the pupils to find the fractions of 12. They should realise that the ducks in picture A are divided into 4 groups so that each group is 1 _ 4 of 12 ducks.
Tell the class it is easy to find fractions of whole numbers using pictures of objects. Ask them to explore and explain the methods showing how to find fractions of whole numbers without pictures in example 2.
Explain to the class that ‘of’ means multiplication so 1 _ 3 of 12 is the same as 1 _ 3 × 12. Help them understand the rule to find fractions of whole numbers.
The pupils work on their own to complete the workbook exercises either in class or as homework.
Exercise 5 (pb page 70)1. a) 6 b) 4 c) 6 d) 3 e) 12
2. a) 6 b) 18 c) 3 d) 4 e) 21 f) 45
Exercise 6 Quantitative reasoning (pb page 71)1. 16 pupils 2. 100 children
3. a) 3 _ 4 3 _ 4 3 _ 4 3 _ 4
3 _ 4 3 _ 4 3 _ 4 3 _ 4
b) 3 _ 4 × 8 = □
c) 6 m of ribbon
4. 15 pupils 5. 1 __ 10 ; 3

47Theme 1: Numbers and numeration – Fractions: Addition and subtraction
Exercise 7 (pb page 71)1. a) 4 _ 5 b) 4 _ 7 c) 1 _ 8
2. 15 squares shaded
Quantitative reasoning3. a) 30 × 3 _ 5 = 18 girls b) 25
__ 30 = 5 _ 6 c) 5 members
a) b)
c)
4. 1–6
3—10 210
35
63
4—18
5—12 720
160
300
1–8
2—25 2 000
250
160
Workbook: Exercise 3 (wb page 32)1. a) 5 b) 20 c) 18 d) 80 e) 350 f) 200
2. 27 pupils 3. 12 sweets
4. A. B.
C. D.

48 Term 1: Unit 11: Add, subtract, multiply and divide decimals
1THEME Numbers and numeration
Decimals
Term 1
Unit 11: Add, subtract, multiply and divide decimals
Teaching guidelines and solutions
Instructional resourcesDienes blocks; 100 squares; tape measures; place value charts; decimal cards; flow diagrams; calculators
Ask the class to recall examples where we use decimals in real life. Let them explore the decimal representation on the Dienes blocks in example 1. Assist the class in understanding the difference between the whole number 1 111 and the decimal fraction 1.111. Let them read the numbers aloud. Write the numbers in words on the board with the value of the digits. Explain that the decimal point separates the whole number from the decimal fractions.
In example 2, ask the class to explore the charts and name the number of equal parts in each chart, recognise the fractions shaded and name the decimals shaded.
Let the pupils recognise the fractions and decimals shaded in the four charts.
Let the class imagine a chart with 1 000 small squares with one square shaded and write the fraction and decimal on the board, i.e. 1
____ 1 000 = 0.001.
Exercise 1 (pb page 74)1. a) 1.04; 1.05; 1.06; 1.07; 1.09; 1.10
b) 0.99; 1.00; 1.01; 1.02; 1.03
2. A: 1.001; B: 1.006; C: 1.009; D: 1.011
3. a) 2.597; 2.598; 2.599; 2.600; 2.601b) 5.999; 6.000; 6.001

49Theme 1: Numbers and numeration – Decimals
Decimal place valueAsk the class to explore and read the numbers in the decimal place value table in the example. Remind them about the values of the powers of 10 they dealt with during this term.
They give the place values of the digits of decimals in the table.
Let the pupils explore and read the number represented in the place value table, i.e. 546.879. Ask them to give the value of each digit in the decimal.
The pupils work on their own to complete the workbook exercises either in class or as homework.
Exercise 2 (pb page 75)1. a) 14
___ 100 b) 49
___ 100 c) 63
___ 100 d) 81
___ 100
2. a) 100; 1 000 b) 2 __ 10 ; 8
____ 1 000 c) 3; 3 __ 10 ; 9
___ 100
d) 1; 1 __ 10 ; 5
___ 100 ; 5
____ 1 000 e) hundreds; tens; unit; 10; 6
___ 100 ; 7
____ 1 000
3. a) 8; 0.01; 0.009 b) 50; 0.03; 0.007 c) 0.001 d) 6; 0.9; 0.05 e) 900; 4; 0.01; 0.006
Exercise 3 (pb page 75)1. a) 9 b) 0.9 c) 0.04 d) 30 e) 0.007 f) 100 g) 0.02 h) 20
2. a) tens b) thousandths c) hundredths d) thousandths e) tenths f) tenths g) units h) hundredths
3. a) 0.6; tenths b) 0.004; thousandths c) 0.03; hundredths d) 0.7; tenths e) 0.09; hundredths f) 1.255; thousandths g) 42.7; tenths h) 6.14; hundredths
Workbook: Exercise 1 (wb page 32)1. a) 8 __ 10 = 0.8 b) 9
___ 100 = 0.09 c) 9 __ 10 = 0.9
d) 1
____ 1 000 = 0.001 e) 0 __ 10 = 0 f) 8
____ 1 000 = 0.008
2. a) 0.09 b) 9 c) 0.9 d) 90 e) 0.09 f) 0.009
3. a) 0.23 b) 8.79 c) 61 d) 0.954 e) 6.384 f) 0.7

50 Term 1: Unit 11: Add, subtract, multiply and divide decimals
4. a) 3.457 b) 2.221
5. a) 1.6 b) 2.4 c) 1.72
Convert between fractions and decimalsLet the class recall the powers of 10. Tell the class it is easy to convert fractions with denominators that are powers of 10 to decimals. Let them write five fractions with denominators that are powers of 10 on the board and change them to decimals.
Ask the class to explore the fractions and decimals represented in the example. They should observe the equivalent decimals and fractions, i.e. fractions of the same size. Ask them to write the equivalent decimals and fractions on the board using the diagrams. They may use calculators to check.
Ask the class to explore and discuss the methods to convert decimals to fractions and fractions to decimals without calculators. Remind them that fractions should be written in their simplest forms using the HCF. They convert fractions to tenths, hundredths and thousandths by multiplying by the lowest common factor or LCF of 10, 100 and 1 000.
Ask the pupils to convert between fractions and decimals on the board using the methods shown.
2 _ 4 = 1 _ 2 = 5 ___ 10 = 0.5 12
__ 15 = 4 _ 5 = 8 __ 10 = 0.8
1 _ 8 = 125
____ 1 000 = 0.125 0.5 = 1 _ 2 = 0.5 0.125 = 125
____ 1 000 = 1 _ 8
Make sure that all the pupils know that the denominator in a fraction must be 10, 100 or 1 000 to convert to a decimal. If the denominators are not powers of 10, they multiply by factors to make the denominators powers of 10 and multiply the numerators by the same factors.
The pupils work on their own to complete the workbook exercises either in class or as homework.
Exercise 4 (pb page 77)1. a) 1 _ 2 b) 5 __ 10 c) 0.5
2. a) 3 _ 4 b) 75
___ 100 c) 0.75
3. a) 3 _ 4 b) 75
___ 100 c) 0.75
4. a) 2 _ 5 b) 4 __ 10 c) 0.4

51Theme 1: Numbers and numeration – Decimals
5. a) 3 _ 5 b) 6 __ 10 c) 0.6
6. a) 1 _ 5 b) 2 __ 10 c) 0.2
7. a) 2 _ 5 b) 4 __ 10 c) 0.4
8. a) 1 __ 10 b) 1 __ 10 c) 0.1
9. a) 1 _ 4 b) 25
___ 100 c) 0.25
10. a) 3 _ 8 b) 375
____ 1 000 c) 0.375
Exercise 5 (pb page 77)1. 1 _ 5 2. 1 _ 2 3. 3 __ 10 4. 3 _ 5
5. 9 __ 20 6. 2 _ 3 7. 1 _ 8 8. 5 _ 8
Workbook: Exercise 2 (wb page 34)1. a) 0.75 b) 0.8 c) 0.25 d) 0.6 e) 0.75 f) 0.8
2. a) 2 _ 5 b) 7 __ 10 c) 9 __ 10
d) 3 __ 25 e) 4 __ 25 f) 6 __ 25
g) 1 _ 5 h) 17
__ 20 i) 1 _ 8
3. a) 3 __ 12 b) 3 _ 6 c) 12
__ 16 d) 4 _ 5
Add and subtract decimalsIn example 1, ask the class to find decimals on the cards with a sum of 2. They do this mentally. They could use whole numbers as in the examples and put the decimal points in the answers, for example 16 + 4 = 20 so 1.6 + 0.4 = 2.0 or 2.
0.7 + 1.3 = 2 1.7 + 0.3 = 2 0.4 + 1.6 = 2 0.1 + 1.9 = 2 0.5 + 1.5 = 2 0.2 + 1.8 = 2
Let the class write number sentences on the board to find out which of the decimals on the cards gives a difference of 0.2, for example:
0.7 − 0.5 = 0.2 0.4 − 0.2 = 0.2 0.3 − 0.1 = 0.2 etc.
In example 2, ask the class to explore and discuss the method showing expanded notation to add and subtract the decimals shown in the charts and the column methods to check the solutions.
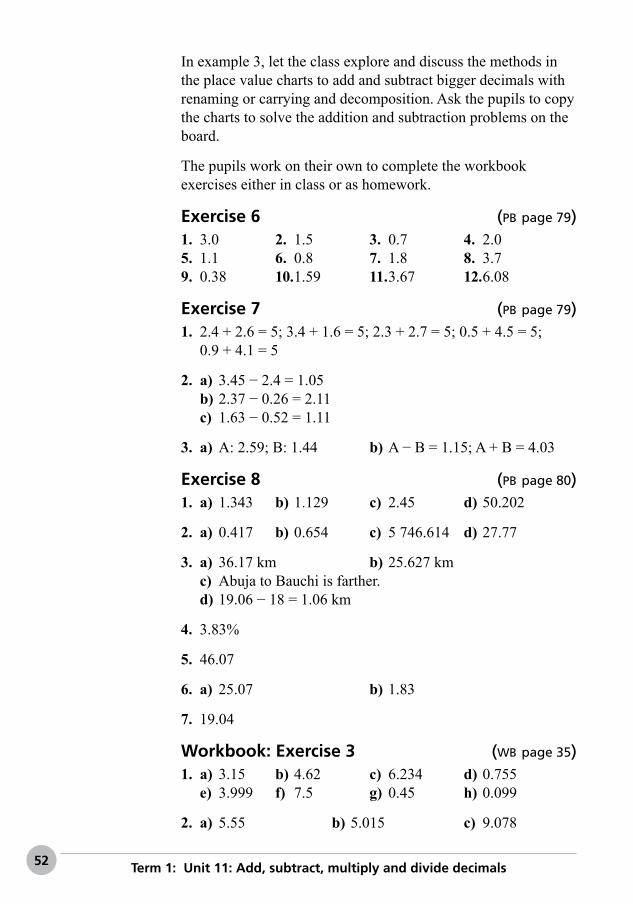
52 Term 1: Unit 11: Add, subtract, multiply and divide decimals
In example 3, let the class explore and discuss the methods in the place value charts to add and subtract bigger decimals with renaming or carrying and decomposition. Ask the pupils to copy the charts to solve the addition and subtraction problems on the board.
The pupils work on their own to complete the workbook exercises either in class or as homework.
Exercise 6 (pb page 79)1. 3.0 2. 1.5 3. 0.7 4. 2.05. 1.1 6. 0.8 7. 1.8 8. 3.79. 0.38 10. 1.59 11. 3.67 12. 6.08
Exercise 7 (pb page 79)1. 2.4 + 2.6 = 5; 3.4 + 1.6 = 5; 2.3 + 2.7 = 5; 0.5 + 4.5 = 5;
0.9 + 4.1 = 5
2. a) 3.45 − 2.4 = 1.05b) 2.37 − 0.26 = 2.11c) 1.63 − 0.52 = 1.11
3. a) A: 2.59; B: 1.44 b) A − B = 1.15; A + B = 4.03
Exercise 8 (pb page 80)1. a) 1.343 b) 1.129 c) 2.45 d) 50.202
2. a) 0.417 b) 0.654 c) 5 746.614 d) 27.77
3. a) 36.17 km b) 25.627 kmc) Abuja to Bauchi is farther.d) 19.06 − 18 = 1.06 km
4. 3.83%
5. 46.07
6. a) 25.07 b) 1.83
7. 19.04
Workbook: Exercise 3 (wb page 35)1. a) 3.15 b) 4.62 c) 6.234 d) 0.755 e) 3.999 f) 7.5 g) 0.45 h) 0.099
2. a) 5.55 b) 5.015 c) 9.078

53Theme 1: Numbers and numeration – Decimals
3. a) 0.75 m b) 7.225 m c) 7.4 m
4. a) A = 1.3; B = 1.1; C = 1.9; D = 0.7b) M = 1.2; N = 2; P = 3; Q = 0.4
Multiply decimals by whole numbersIn example 1, let the pupils explore the weights of the products in the picture and find the total weight of the products Mr Fasasi bought at the wholesalers.
5 × 12.6 kg beans = 63 kg 4 × 2.25 kg rice = 9 kg 6 × 3.75 kg sugar = 22.5 kg
Ask the class to explore and discuss the methods showing the expanded notation, place value and column methods to calculate the total weight of the products.
Let the pupils work on the board and use the methods shown to calculate the weight of 5 bags of beans and 6 bags of sugar.
In example 2, ask the class to explore and explain the breaking up methods (distributive property) to multiply by multiples of 10. Draw their attention to the shifting of the decimal points in the solutions. Let them explain what happens when you multiply decimals by 10 and multiples of 10. Let them explain why we multiply by 10 and 2 when multiplying by 20, whether the solutions are bigger or smaller than the multiplicands, and what happens when we multiply by 100.
Let the class explore and explain the decimals in the table multiplied by 10 and 100. Draw the tables on the board and ask pupils to complete them. Pupils should actually realise that it is not the decimal points that shift, but the digits. The products are bigger than the multiplicands.
The pupils work on their own to complete the workbook exercises either in class or as homework.
Exercise 9 (pb page 82)1. a) 23 b) 468.1 c) 450 d) 1 697.5 e) 25 593.6 f) 208
2. a) 1 b) 6.6 c) 44.4 d) 186.2 e) 129.6 f) 107.5

54 Term 1: Unit 11: Add, subtract, multiply and divide decimals
Exercise 10 (pb page 83)1. a) 12.5 b) 124.8 c) 23.04 d) 34.96 e) 54.81 f) 52.57
2. a) 147.6 b) 144.75 c) 17.82 d) 30.66 e) 53.25 f) 1 068.08 g) 164.8 h) 483.7
3. a) 3.9 b) 4 c) 3 d) 3.2
Exercise 11 Quantitative reasoning (pb page 83)1. 6.15 × 6 = 36.9 m 2. 3 × 7.25 = 21.75 kg
3. 0.45 × 5 = 2.25 m
4. a) B b) D c) A d) C
5. 110.4; 124.15; 186.225; 140; 35
Workbook: Exercise 4 (wb page 36)1. a) 42 b) 437.4 c) 690 d) 2 243.5 e) 2 428 f) 460.9
2. a) 2.4 b) 9.3 c) 92.1 d) 17.5 e) 133.8 f) 16.8
3. a) (4 × 1) + (4 × 0.6) = 6.4b) (6 × 13) + (6 × 0.3) = 79.8c) (3 × 0.2) + (3 × 0.05) = 0.75d) (8 × 2) + (8 × 0.4) + (8 × 0.02) = 19.36e) (4 × 1) + (4 × 0.8) + (4 × 0.08) = 7.52f) (3 × 0.9) + (3 × 0.05) = 2.85
4. a) 46.2 + 154 = 200.2 b) 16.52 + 82.6 = 99.12 c) 4.02 + 6.7 = 10.72 d) 12.96 + 86.40 = 99.36
5. a) 3 × 45.25 m = 135.75 mb) 5 × 5.45 km = 27.25 kmc) 7 × 3.25 ℓ = 22.75 ℓ
Divide decimalsInform the class they will learn about decimal ten thousandths ( 1
_____ 10 000 ) , i.e. 4 decimal places after the decimal point when
dividing by 100. Explain to the class that, the more the digits there are after the decimal point, the smaller the value of the digits. Remind the class they have multiplied decimals by 10 and ask whether they think numbers become bigger or smaller when they divide by 10.

55Theme 1: Numbers and numeration – Decimals
Ask the class to explore and discuss the decimals divided by 10 and 100 in the place value charts in the example. Let them explain the division by 10 and 100 and give the values of the digits in the solutions.
4.76 ÷ 10 = 0.476 4.76 ÷ 100 = 0.0476
Draw the charts on the board and ask pupils to complete them. They explain how the digits move right and the numbers become smaller. They should notice the decimal points stay in the same positions and the use of zero as placeholders. Let them do division by 10 and 100 on the board and give the values of the digits in the solutions.
The pupils work on their own to complete the workbook exercises either in class or as homework.
Exercise 12 (pb page 85)1. a) 3.35 b) 4.36 c) 0.267 d) 16.25 e) 3.6714 f) 5.6124 g) 5.104 h) 2.525 i) 721.32
2. a) 5.24; 0.524 b) 0.402; 0.0402 c) 1.051; 0.1051 d) 4.106; 0.4106
Exercise 13 Quantitative reasoning (pb page 85)1. a) 1.355 kg b) 0.5 ℓ c) 0.31 kg d) 0.6 ℓ e) 0.912 m
2. a) 0.6; 0.71; 0.308; 0.29; 1.01b) 2.1; 0.081; 0.24; 0.016; 0.0104
Workbook: Exercise 5 (wb page 38)1. a) 56.1 b) 1.67 c) 74.69 d) 0.283 e) 0.005 f) 0.082 g) 0.4405 h) 9.007
2. a) 0.24 b) 0.024 c) 0.101 d) 0.71 e) 0.071 f) 10.61
Workbook: Exercise 6 (wb page 38)1. 0.76 ℓ 2. 1.29 kg 3. 1.25 kg

56 Term 1: Revision
1TERM
Revision
You may use the revision questions or a selection thereof for the final assessment at the end of the term. The questions and problems involve work covered in topics during the term. The problems include routine problems and those involving quantitative reasoning.
Revision solutions (pb page 86)1. a) 4 291 257 b) 1 146 592
2. a) four million two hundred and ninety-one thousand two hundred and fifty-seven
b) one million one hundred and forty-six thousand five hundred and ninety-two
3. a) 789 100; 789 101; 789 102b) 999 990; 1 000 000; 1 000 010
4. 5 030 050; 6 030 050
5. a) 5 400 803 b) 700 120
6. a) 40 000 b) 4 000 000 c) 400 000 d) 4 000
7. a) 200 000 + 40 000 + 6 000 + 300 + 20 + 1b) 4 000 000 + 50 000 + 700 + 20 + 8c) 1 000 000 + 400 000 + 90 000 + 3 000 + 800 + 20 + 6d) 50 000 + 4 000 + 800 + 70 + 3
8. a) 8 658 b) 3 567
9. a) 14 000 b) 3 344 c) 11 460 d) 4 270 e) 2 540
10. a) 0 b) 0 c) 54 d) 567
11. a) 73 188 b) 40 545c) 669; 8 920; 22 300; 31 889
12. 15 500
13. a) 7; 7 b) 8; 80

57Term 1: Revision
14. a) 8 b) 200 c) 6 d) 53
15. 42 boxes
16. a) 24 b) 23
17. 27 bags
18. 91 42 57 96 103
78 235 880 777 309
19. a) False b) False c) True d) True e) False f) False g) True
20. 13; 17; 29; 31; 37
21. a) 30; 15; 10; 6; 2 Factors of 30: 1, 2, 3, 5, 6, 10, 15, 30 Prime factors: 2; 3; 5
b) 40; 20; 10; 8; 4; 2 Factors of 40: 1, 2, 4, 5, 8, 10, 20, 40 Prime factors: 2; 5
22. a) 24 = 2 × 2 × 2 × 3 b) 32 = 2 × 2 × 2 × 2 × 2
23. a) 15 b) 20
24. a) 10 b) 3 c) 2
25. 36 necklaces
26. 120 of each colour bead
27. a) 8 b) 81
28. a) 7 × 7 = 49b) (11 × 10) + (11 × 1) = 121c) (13 × 10) + (13 × 3) = 169d) (15 × 10) + (15 × 5) = 225
29. a) 10 b) 16 c) 14 d) 25
30. a) 16 b) 6 c) 88 d) 2 e) 19 f)
5 √ ___
10 − 25 g) 28 h) 3 i) 40 j) 100 k) 9 l) 225
31. a) 1, 5, 25 b) 1, 3, 9, 27, 81

58 Term 1: Revision
32. a) 8 b) 12
33. a) 5 2255 453 93 3
1
√ ____
225 = 5 × 3 = 15
b) 2 1962 987 497 7
1
√ ____
196 = 2 × 7 = 14
34. a) 79 b) 18 c) 30 d) 107 e) 13 f) 12
35. a) □ − 56 = 75; □ = 1 431 b) 25 + □ = 67; □ = 42
36. a) p = 4 b) y = 9 c) n = 4 d) x = 20
37. a) 4c = 2c + 12 kg; c = 6 kgb) 4c = 1c + 15 kg; c = 5 kg
38. a) 2 b) −6 c) 12 d) −5
39. C: 2
40. a) 1; −1; −3 b) −1; 2; 5
41. a) 9 b) 39 c) 63 d) 109
42. a) Binary value: 10 000; Decimal value: 16b) Binary value: 10; Decimal value: 2
43. a) Sum: 11001; Difference: 101b) Sum: 101101; Difference: 1111
44. a) 79 = 10011112 b) 1 538 = 110000000102

59Term 1: Revision
45. a) 4 5 __ 12 b) 1 _ 2 c) 3 1 _ 4
d) 15 e) 100 f) 600 km
46. a) i) 1 _ 3 + 2 _ 5 = 11
__ 15 ; 11
__ 15 < 7 _ 8 ; No she does not have enough.
ii) 0 kg
b) 3 _ 5 × 5 = 3 km
47. A: 6 B: 15 C: 28 D: 41 E: 54
48. a) 40; 0.006 b) 8; 0.09 c) 0.7; 0.009 d) 200; 0.01
49. a) 1 __ 10 ; 4
____ 1 000 b) 50; 3 __ 10 ; 2
___ 100 ; 1
____ 1 000
50. a) 0.005 b) 0.01 c) 4.5 d) 9.205 e) 8 __ 10 f) 2 019
____ 1 000 g) 999
____ 1 000 h) 3 618
____ 1 000
51. a) 11
__ 50 b) 1 7 __ 20 c) 3 __ 20 d) 47
__ 50
52. a) 18.582 b) 8.747
53. a) 3.883 kg b) 10.633 kg
54. a) 3.7 kg b) 2.25 kg c) 0.7 kg d) 1.45 kg
55. a) 0.105; 0.041 b) 4; 8
56. a) 5.66 b) 0.293 c) 1.234 d) 0.191
57. D: 220 g
58. C: 32.4 cm

60 Term 2: Unit 1: Solve problems involving percentages
1THEME Numbers and numeration
Fractions: Percentage
Term 2
Unit 1: Solve problems involving percentages
Teaching guidelines and solutions
Instructional resourcesNumber lines; 100 squares; percentage charts and scales; flow diagrams; cubes; counters; measuring jugs; shapes; tables; fraction conversion chart
Tell the class they will first find out what percentage is all about. We observe percentages in real life all the time. Ask the class to find examples of percentages in newspapers and magazines.
Ask the pupils to write percentages as decimals and fractions. Check if they write fractions in their simplest forms. Let them explain what 100% means.
10% = 10
___ 100 = 0.1 80% = 0.8 = 80
___ 100 = 4 _ 5
95% = 0.95 = 95
___ 100 = 19
__ 20 100% = 1.0 = 100
___ 100 = 1
Let the pupils explore and explain the fractions, decimals and percentages on the number line in example 1. They should observe the equivalence among the fractions. Ask them to write the fractions out of 100 in their simplest forms, e.g. 20
___ 100 = 1 _ 5 ;
40
___ 100 = 2 _ 5 ; etc. Let the pupils fill in the missing numbers in the equations.
Ask the class to explore the 100 squares and the shaded parts in example 2. Let them write the percentage, fraction and decimal shaded in all the shapes.
Inform the class that they will convert between fractions, decimals, and percentage in this activity. They will write fractions in their lowest terms or simplest forms using the HCF.

61Theme 1: Numbers and numeration – Fractions: Percentage
Exercise 1 (pb page 95)1. E 2. D 3. H 4. F5. G 6. A 7. B 8. C
Convert between fractions, decimals and percentagesLet the class explore the sign in the window in example 1 and explain what it means to get 50% discount on sales items, which fraction of the price they pay for an item and what the discount price of the computer mouse will be. The price of the mouse is 1 _ 2 of the cost price.
Draw the fraction conversion chart on page 97 on the board. Leave some out and ask the pupils to fill in the missing percentages, fractions, and decimals. Let them write the fractions in their simplest forms.
In example 2, explain that the conversions in the chart should be easy. The denominators of the fractions are powers of 10. It is however not so easy to convert fractions when the denominators are not powers of 10. We change the denominators of fractions to powers of 10 when we convert them to decimals and percentages. Ask the pupils to explore and explain the methods to convert between fractions, decimals and percentages. Let them use the methods to do the conversions as shown.
The pupils work on their own to complete the workbook exercises either in class or as homework.
Exercise 2 (pb page 98)1. a) 0.25; 25% b) 0.4; 40% c) 0.75; 75% d) 0.5; 50% e) 0.6; 60% f) 0.26; 26% g) 0.3; 30% h) 0.2; 20% i) 0.8; 80% j) 0.07; 7%
2. a) 20%; 1 _ 5 b) 80%; 4 _ 5 c) 25%; 1 _ 4 d) 75%; 3 _ 4
e) 1%; 1
___ 100 f) 70%; 7 __ 10 g) 11%; 11
___ 100 h) 60%; 3 _ 5
3. a) 0.08; 2 __ 25 b) 0.24; 6 __ 25 c) 0.62; 31
__ 50 d) 0.96; 24
__ 25
e) 0.05; 1 __ 20 f) 0.33; 33
___ 100 g) 0.55; 11
__ 20 h) 0.2; 1 _ 5
4. Quantitative reasoning a) 20% b) 10 c) 1 d) 75%

62 Term 2: Unit 1: Solve problems involving percentages
5. a) 20%; 0.2 b) 90%; 0.9 c) 60%; 0.6 d) 40%; 0.4
Exercise 3 (pb page 99)1. a) True b) True c) True d) True e) False f) True
2. 75%
3. a) 40% b) 60%
4. a) 9 __ 12 ; 3
_ 4 ; 0.75; 75% b) 8 __ 20 ; 2
_ 5 ; 0.4; 40%
5. a) D b) B c) C d) A
6. A: 25%; 1 _ 4 ; 0.25 B: 1 _ 2 ; 0.5; 50%
C: 0.2; 1 _ 5 ; 20% D: 90%; 0.9; 9 __ 10
7. a) 1 _ 8 b) 11
___ 400 c) 1 __ 40 d) 3 _ 8
Workbook: Exercise 1 (wb page 39)1. a)
70%60%
40%30%
100%90%0.9
0.40.3
0.60.7
b) 1 __ 10 ; 2
__ 10 ; 3
__ 10 ; 4
__ 10 ; 5
__ 10 ; 6
__ 10 ; 7
__ 10 ; 8
__ 10 ; 9
__ 10 ; 10
__ 10 or 1
2. a) 0.75 b) 0.55 c) 0.38 d) 0.72 e) 0.5 f) 0.32 g) 0.64 h) 0.25
3. a) 1 _ 5 b) 4 _ 5 c) 1 _ 4 d) 21
__ 50
e) 16
__ 25 f) 7 __ 20 g) 3 _ 5 h) 3 _ 4
4. a) 40 b) 10 c) 20 d) 50 e) 110 f) 200 g) 30 h) 100

63Theme 1: Numbers and numeration – Fractions: Percentage
5. a) 50% b) 60% c) 75% d) 30% e) 80% f) 25%
Express numbers as percentages of other numbersInform the class they will express numbers as percentages of other numbers and use knowledge of multiplication and division. They start with a real-life problem in the example.
Tell the class we need healthy food that contains proteins to build up our bodies. Let them explore the different food types and their protein contents. Let them name the food and the protein contents. Let the pupils find out how much protein 500 g stewing beef and 30 g of peanuts contain.
Then ask them to explore and discuss the methods to find the amount of protein in the food types.
25% of 250 g cheese 25 ___ 100 × 250 ___ 1 1 _ 4 × 250 250 ÷ 4 × 1 = 62.5 g protein
16% of 750 g fish 16 ___ 100 × 750 ___ 1 4 __ 25 × 750 750 ÷ 25 × 4 = 120 g protein
40% of 125 g soya beans 40 ___ 100 × 125 ___ 1 2 _ 5 × 125 125 ÷ 5 × 2 = 50 g protein
12 % of 36 eggs 12 ___ 100 × 36 __ 1 3 __ 25 × 36 36 ÷ 25 × 3 = 4.32 g protein
21% of 1 000 g chicken 21 ___ 100 × 1 000 ____ 1 1 000 ÷ 100 × 21 = 210 g protein
In the next example, explain to the class that it is easy to calculate percentage with fractions that can be converted to halves, quarters, fifths, etc. Let them explore the percentage scale with amounts up to ₦120. We can find percentages of ₦120 on the scale. Ask the pupils to use the scale to find percentages of the amount of naira as shown and experience how easily it is done.
50% of ₦120 = ₦60 25% of ₦120 = ₦3075% of ₦120 = ₦90
Tell the class it is not so easy to calculate percentages without a scale. Ask them how they think we express the amounts shown as percentages. Let them explore and discuss the methods showing how to express numbers as percentages. Ask the class to check the percentages on the scale above.

64 Term 2: Unit 1: Solve problems involving percentages
In the example on page 101, ask the pupils to explore the populations of two rural towns. Let them show how they express the populations as a percentage. Then let them explore the method to calculate the percentage.
The pupils work on their own to complete the workbook exercises either in class or as homework.
Exercise 4 (pb page 100)1. 62.5 g 2. 120 g 3. 50 g 4. 36% 5. 210 g
Exercise 5 (pb page 102)1. a) ₦15 b) ₦30 c) ₦45
2. a) 8% b) 17% c) 33% d) 67% e) 83% f) 92%
Quantitative reasoning3. a) 65 g b) i) 69% ii) 23% iii) 8%
4. a) 31% b) 27%c) Ogunsina’s Electronics have more disabled employees.
5. a) 40 chocolates b) 40%c) True. 25% coconut chocolates; 20% hazelnut chocolatesd) 35%
Exercise 6 (pb page 103)1. a) 27 b) 22 c) 160 d) 396 e) 81 f) 348
2. a) 42 pupils b) 324 days c) 780 cows d) 3 168 telephones e) 754 beds f) 4 495 books
Quantitative reasoning3. 86% passed 4. 6 cars
5. a) 90% b) 15 pupils walk
6. 36 ℓ
Workbook: Exercise 2 (wb page 41)1. 74% 2. 67% 3. 48%
4. a) 600 people b) Pupils study the method.

65Theme 1: Numbers and numeration – Fractions: Percentage
c) i) 14% ii) 27% iii) 13% iv) 14% v) 10% vi) 5%
5. a) 75
___ 150 = 0.5 = 50% b) 6 __ 30 = 0.2 = 20% c) 5 __ 25 = 0.2 = 20%
d) 25
__ 75 = 1 _ 3 = 33.3% e) 9 __ 36 = 0.25 = 25% f) 15
__ 75 = 0.2 = 20%
6. 14 males; 66.7%
7. a) 8 × 15 = 120 b) 64
___ 120 = 53.33%
c) 10
___ 120 = 8.33% d) 14
___ 120 = 11. 67% e) 75 × ₦31,50 = ₦2 362,50 f) Pupil’s own work
Find the percentage increase or decreaseAsk the pupils to explore and discuss the prices and the items in the pictures in the example. They should observe the rise and fall in prices of cement and dresses. Let them explain whether there are increases or decreases in the prices, by which amounts the prices decrease or increase and what the percentage increase or decrease is.
Ask the class to explore and explain the methods showing how to calculate percentage increase and decrease. Let the pupils use the methods to calculate the percentage increase and decrease of the prices of items.
The pupils work on their own to complete the workbook exercises either in class or as homework.
Exercise 7 Quantitative reasoning (pb page 106)1. 150
___ 900 × 100 = 17% 2. 6 __ 24 × 100 = 25%
3. 50
___ 300 × 100 = 17% 4. 11.04 m
5. ₦184.80; ₦210; ₦175
6. a) 75% b) 90% c) 175
Workbook: Exercise 3 (wb page 44)1. a) 15% of ₦11 500 = ₦1 725
b) ₦11 500 − ₦1 725 = ₦9 775
2. 150
___ 400 = 37.5%
3. 50 000 + 4 000 = 54 000

66 Term 2: Unit 2: Determine ratio
1THEME Numbers and numeration
Fractions: Ratio
Term 2
Unit 2: Determine ratio
Teaching guidelines and solutions
Instructional resourcesObjects in picture; graphs; cubes; strips of paper
What is ratio?Ask the class to explore and discuss the measurements and number of objects in the pictures in the example. Ask them to write the number of the quantities indicated on the board, write the quantities as fractions and simplify the fractions.
a) Lime cordial → 2 parts water → 4 parts → 2 _ 4 = 1 _ 2 b) Mass of son → 30 kg mother → 70 kg → 30
__ 70 = 3 _ 7
c) Green apples → 12 red apples → 4 → 12
__ 4 = 3 _ 1 d) Strip of wood → 20 m length of pipe → 5 m → 20
__ 5 = 4 _ 1
Let the pupils compare the quantities by saying how much bigger the one quantity is than the other.
a) Water is 2 times more than the cordial.b) Mass of mother is 40 kg more than the son’s.c) Green apples are 8 more than red apples.d) Strip of wood is 4 times more than the pipe’s length.
Let pupils explore and discuss the different ways of representing the quantities. Ask them to read the sentences and numbers aloud. Explain to the class that the numbers 4 : 2; 30 : 70; 12 : 4 and 20 : 5 are called ratios. The fractions they wrote in the simplest forms are written as the ratios 2 : 1; 3 : 7; 3 : 1 and 4 : 1.
Read through the definitions of a ratio and a fraction on page 108.
Ask the class to explore the format for writing the ratios in the example. They should observe the ratios in their simplest forms

67Theme 1: Numbers and numeration – Fractions: Ratio
and division by HCF. Tell the pupils the order of the numbers or parts are important. The quantity mentioned first is the first number in the ratio. 4 : 1 is not the same as 1 : 4.
Pupils should realise that, when you add or subtract the same number to or from both quantities, the ratio changes. When you multiply or divide the quantities by the same number, the ratio stays the same.
Ask the class where we use ratio in real life. They might think about making coffee or tea, ingredients in recipes, mixing different colours of paint, sharing quantities, etc.
The pupils work on their own to complete the workbook exercises either in class or as homework.
Exercise 1 (pb page 109)1. a) 5 : 3 b) 5 : 3 c) 5 : 3 d) The ratio of the long strip to the short strip remains the
same when you divide both strips by the same amount.
2. a) 3 : 6 and 6 : 2 b) 4 : 6 and 10 : 4 c) 1 : 2 and 3 : 1; 2 : 3 and 5 : 2
3. a) 30 : 60 and 60 : 20 b) 40 : 60 and 100 : 40 c) 1 : 2 and 3 : 1; 2 : 3 and 5 : 2
4. a) 24 : 4; 6 : 1 b) 95 : 15; 19 : 3 c) 108 : 54; 2 : 1
Exercise 2 (pb page 110)1. C and E
2. a) i) 50 : 75 ii) 2 : 3 b) i) 50 : 125 ii) 2 : 5 c) i) 350 : 1 000 ii) 7 : 20
Workbook: Exercise 1 (wb page 45)1. a) 3 : 4 b) 1 : 3 c) 2 : 3 d) 1 : 3
2. a) 5 : 6 b) 1 : 3 c) 1 : 2 d) 1 : 4 e) 1 : 5 f) 1 : 4
3. a) 6 : 9 b) 2 : 3
c) i) remains 2 : 3 ii) 3 : 6 → 1 : 2 iii) 12 : 15 → 4 : 5 iv) remains 2 : 3

68 Term 2: Unit 2: Determine ratio
4. a) i) 4 and 8 ii) 3 and 9 iii) 4 and 8 iv) 2 and 10
b) i) 8 and 16 ii) 6 and 18 iii) 9 and 15 iv) 6 and 18
Solve problems involving ratioAsk the class to explore and discuss the real-life problem in the example and the method to solve it. Let the pupils explain the steps to find each partner’s share of the profit.
The pupils work on their own to complete the workbook exercises either in class or as homework.
Exercise 3 Quantitative reasoning (pb page 111)1. 25 kg : 35 kg 2. ₦9 000 : ₦45 000
3. a) Serifat: ₦300 000; Toheeb: ₦500 000b) Serifat (12 years): ₦320 000; Toheeb (18 years): ₦480 000
Exercise 4 Quantitative reasoning (pb page 112)1. a) 2 : 8 b) 1 : 4 c) 24 parts cotton; 8 : 24 d) 4 parts silk; 4 : 16
2. a) 100 : 550; 2 : 11 b) 180 : 360; 1 : 2 c) 550 : 380; 55 : 38 d) 360 : 550: 36: 55 e) 180 : 100; 9 : 5 f) 380 : 180; 19 : 9 g) 100 : 360; 5 : 18 h) 360 : 380; 18 : 19
3. a) 28 pointsb) 30 pointsc) Red team boys: Total score − red girls = 72 − 30 = 42 points Blue team girls: Total score − blue boys = 70 − 28
= 42 points They scored the same number of points.
Workbook: Exercise 2 (wb page 47)1. a) 12 : 8 → 3 : 2 b) 36 : 12 → 3 : 1 c) 36 : 8 → 9 : 2 d) 36 : 20 → 9 : 5
2. a) 3 : 36 → 1 : 12 b) 12 : 72 → 1 : 6
3. 180 ÷ 2 × 3 = 270 people 4. 54 : 45 → 6 : 5
5. ₦24 750 6. 16 litres

69Theme 1: Numbers and numeration – Fractions: Ratio and percentage
1THEME Numbers and numeration
Fractions: Ratio and percentage
Term 2
Unit 3: Express values as ratio and percentage
Teaching guidelines and solutions
Instructional resourcesFraction cards; population charts
The relationship between ratio and percentageExplain to the class that ratio and percentage are forms of fractions just as decimal fractions are. Remind them that ratio is the comparison between two numbers, groups, quantities or objects. Percentage is a fraction of a hundred used to compare sizes or values of things. The word percent is a Latin word meaning per centum, i.e. a hundred or out of a hundred.
Let the pupils explore the pupil’s test marks in the example, given as a fraction and percentage. Ask them to compare the scores to find out which test score is better. Assist them in understanding they convert the Mathematics marks to percentage or the Science marks to a fraction and simplify the fractions to make the comparison.
Let the class explore and explain the methods to convert ratios to percentages. They should observe that the ratios are written in the simplest forms to do the calculations.
The pupils work on their own to complete the workbook exercises either in class or as homework.
Exercise 1 Quantitative reasoning (pb page 115)1. a) A. 1 : 3; B: 2 : 3 b) A: 25%; B: 40%
2. a) 1 : 150; 1 : 60; 67 : 900; 1 : 200; 1 : 450; 1 : 720

70 Term 2: Unit 2: Determine ratio
b) 0.7%; 1.7%; 7%; 0.5%; 0.2%; 0.2%
3. a) 5.7% b) 28% c) 10%
Exercise 2 (pb page 116)1. 4 2. 5 3. 1 : 10 4. 55. 20 6. 80% 7. 60% 8. 70%
Quantitative reasoning9. a) 60% b) 140 marbles
10. ₦11 250
Workbook: Exercise 1 (wb page 48)1. a) 30% b) 75% c) 80% d) 35% e) 38% f) 90%
2. a) 200 : 215 → 93%b) 55 : 200 → 27.5%c) 55 : 215 → 26%

71Theme 4: Mensuration and geometry – Primary measures: Money profit and loss
4THEME Mensuration and geometry
Primary measures: Money profit and loss
Term 2
Unit 4: Compare currencies; calculate profit and loss
Teaching guidelines and solutions
Instructional resourcesBanknotes and coins; maps; flags of countries; currency charts; flow diagrams
Help pupils understand that we need money in the currency of foreign countries when we visit those countries. In Europe we need the euro, in England the British pound and in South Africa we need the rand.
Ask the class to name the banknotes and coins used in Nigeria. Let them explore the countries and currencies used in the different countries. They use the data on the map to convert the amounts in the example.
Inform the class about the use of the British pound in Nigeria, the change of currency and the foreign exchange.
Use the rate of exchange to convert between currenciesExplain to pupils that exchange rates are the values of currencies, i.e. the price of currencies in relation to each other. Exchange rates increase or decrease from day to day depending on the market force or demand and supply in a country. Inform the class about the role of the Central Bank of Nigeria. Tell them they will apply knowledge of multiplication and division of decimal fractions to convert between currencies.
Ask the class to explore and discuss the currencies on the map. They change each currency as shown.

72 Term 2: Unit 4: Compare currencies; calculate profit and loss
1. 100 kobo 2. 100 cents 3. 100 cents4. 100 pence 5. 100 cents 6. 100 pesevas
Let the pupils use the rates in the chart to change the foreign amounts to naira. They multiply by powers of 10.
₵10 → N58.53 × 10 = N583.30 Le10 → N0.05 × 10 = N0.50
₵100 → N58.53 × 100 = N5 853 Le100 → N0.05 × 100 = N5
₵1 000 → N58.53 × 1 000 = N58 530 Le1 000 → N0.05 × 1 000 = N50
R10 → N15.76 × 10 = N157.60 $10 → N198.95 × 10 = N1 989.50
R100 → N15.76 × 100 = N1 576 $100 → N198.95 × 100 = N19 895
R1 000 → N15.76 × 1 000 = N15 760 $1 000 → N198.95 × 1 000 = N198 950
£10 → N308.70 × 10 = N3 087
£100 → N308.70 × 100 = N30 870
£1 000 → N308.70 × 1 000 = N308 700
Now, ask the class to find out what the amounts of naira would be worth in foreign countries. They divide by the powers of 10.
N1 N10 N100 N1 000
USA $0.53 $0.053 $0.0053 $0.00053
South Africa R0.06 R0.006 R0.0006 R0.00006
UK £0.003 £0.0003 £0.00003 £0.000003
Sierra Leone Le20.24 Le2.024 Le0.2024 Le0.02024
Ghana ₵0.02 ₵0.002 ₵0.0002 ₵0.00002
You should inform the class that the exchange rates in the chart might have changed in the meantime.
Ask the class to explore and discuss the real-life problems in the example and the methods to solve them.
Let the pupils do research on the Internet, use apps on cell phones or newspapers or other media to find the exchange rate between the naira and currencies of Japan, Brazil, Canada and Botswana.
The pupils work on their own to complete the workbook exercises either in class or as homework.

73Theme 4: Mensuration and geometry – Primary measures: Money profit and loss
Exercise 1 (pb page 119)1. ₦16 330 2. ₦1 890 3. ₦8014. ₦8 791 5. ₦21 6. ₵1.976 7. $14 8. ₤3 9. ₵0.110. Le3 460 11. ₦162 083 12. ₦12 93613. ₦790 155 14. ₦0.4 15. ₦198 769
Exercise 2 Quantitative reasoning (pb page 119)1. a) R79.40; ₤4; $7 b) R76.70; ₤3.80; $6.70 c) R24.90; ₤1.20; $2.20 d) R22.40; ₤1.10; $2
2. a) ₵26.50; Le26 777.50 b) ₵25.60; Le25 866.70 c) ₵8.30; Le8 399.60 d) ₵7.50; Le7 569.80
3. a) $212 b) $78 c) 25%
Workbook: Exercise 1 (wb page 49)1.
Amount in naira
Foreign currencies
leone rand dollar pound cedi
a) 2 500 50 600.00 150.00 13.25 7.50 50.00
b) 19 525 395 186.00 1 171.50 103.48 58.58 390.50
c) 180 3 643.20 10.30 0.95 0.54 3.60
d) 65 1 315.60 3.90 0.35 0.20 1.30
e) 150 000 3 036 000.00 9 000.00 795.00 450.00 3 000.00
f) 7 500 151 800.00 450.00 39.75 22.50 150.00
2. Le9 917.60
3. $13 426.50; ₤7 599.93
4. a) ₦3 029 × 4 = ₦12 116b) USA: $64.21; UK: ₤36.35; Ghana: ₵242.32
5. a) ₦12 348 b) ₦23 874 c) ₦135 d) ₦197 000
Calculate percentage profit and lossInform the class they have worked with profit and loss of amounts in Primary 4. They have worked with percentages of whole numbers and calculated percentage increase and decrease

74 Term 2: Unit 4: Compare currencies; calculate profit and loss
this year. Tell them they will use this knowledge to calculate percentage profit and loss in this activity.
Let the pupils explore and discuss the prices of objects in the example. The business partners buy and sell items again to make a profit. Let them discuss the prices and the profit for which the items are resold and calculate the percentage profit. Draw their attention to the formulas for calculating percentage profit.
The pupils work on their own to complete the workbook exercises either in class or as homework.
Exercise 3 Quantitative reasoning (pb page 122)1. a) loss b) 330
___ 930 × 100 = 36% loss
2. ₦220
3. 25%
4. 10%
5. ₦4 063
6. ₦6 500
Exercise 4 Quantitative reasoning (pb page 123)1. a) ₦456 b) ₦120 c) ₦142
2. Local bookshop: ₦325 × 15 = ₦4 875Internet distributor: ₤19 × ₦305 = ₦5 795So the local bookshop is the better option.
Workbook: Exercise 2 (wb page 51)1. 10% 2. 28%3. ₦211 200 4. ₦25 580.755. a) Pupil’s own answer.
b) CP = ₦34 125

75Theme 4: Mensuration and geometry – Primary measures: Money interest
4THEME Mensuration and geometry
Primary measures: Money interest
Term 2
Unit 5: Find simple interest
Teaching guidelines and solutions
Instructional resourcesFlow diagrams; interest charts
Let the class explore the people’s activities in the example. Work through the text in the example and discuss with the class.
Explain to the class that interest is the money earned on the principal (original amount) invested. The sum of the principal plus interest is the amount. Go through the facts in the box. Let them explore and discuss the process represented in the diagram showing the increase in savings over 3 years in the example on page 125. Let the pupils work on the board showing the amount you will earn on ₦500 after 3 years and discuss whether they think the investment is worthwhile. They show the growth in an investment of ₦1 000 over 3 years at 8% interest per year.
Exercise 1 (pb page 126)1. ₦8 750 2. ₦20 250 3. ₦66 300 4. ₦43 250 5. ₦24 650
Calculate simple interest, amount, time, principal and rateLet the pupils explore the real-life problems in the example, and the methods for solving these problems. Let the pupils discuss whether they think it is worthwhile to invest money in a bank.
The pupils work on their own to complete the workbook exercises either in class or as homework.

76 Term 2: Unit 5: Find simple interest
Exercise 2 (pb page 128)1. SI Amount
a) N300 N2 300
b) N875 N4 375
c) N320 N1 920
d) N240 N1 120
e) N520 N5 720
2.Amount (N) Interest (N) Principal (N) Rate Time
99 200 19 200 80 000 6% 4 years
513 000 38 000 475 000 4% 2 years
165 000 15 000 150 000 10% 1 year
33 000 3 000 30 000 5% 2 years
99 450 9 450 90 000 3.5% 3 years
Quantitative reasoning3. ₦2 464 + ₦3 850 = ₦6 3144. 12 years5. ₦90 000 6. 9 years7. 11% per annum simple interest
Workbook: Exercise 1 (wb page 53)1. ₦1 250 interest2. 11 years3. 333% 4. 7.5%5. ₦4006. 10 years

77Theme 4: Mensuration and geometry – Primary measures: Money transactions
4THEME Mensuration and geometry
Primary measures: Money transactions
Term 2
Unit 6: Calculate commission, discount and social transactions
Teaching guidelines and solutions
Instructional resourcesFlow diagrams; advertisements; discount charts; Nigerian stamps; postage rate charts
Remind the class they have worked with percentage decreases in Unit 1 this term and learnt that percentage decrease involves discount in prices. Read through the introductory text and make sure that the pupils understand how commission works.
Ask the class to explore and discuss the teachers’ conversations on pay day in the example. Let them explain what each teacher is doing, say which transactions are done at a post office and for which transactions one has to visit a bank. They should notice that we can do cell phone transactions to buy airtime and data, transfer money and pay instalments. We can do Internet transactions on computers to transfer money, go to the bank to get new chequebooks and send parcels and buy postal orders at the post office. Inform the pupils about the dangers of doing transactions on cell phones, the Internet and using ATM cards. Warn them about protecting PIN numbers or codes against con artists who commit electronic crimes to get hold of your money. They should keep in mind that banks do not provide Internet transactions free. They charge commission for these facilities and you pay for each transaction you make.

78 Term 2: Unit 6: Calculate commission, discount and social transactions
Calculate commissionRead through the example with the class. Let them calculate the commission he receives if he sells an apartment and the total salary he receives at the end of the month. Ask the pupils to explore the method showing how to solve the problem.
Ask the pupils to discuss the advantages and disadvantages of working on commission.
The pupils work on their own to complete the workbook exercises either in class or as homework.
Exercise 1 Quantitative reasoning (pb page 131)1. ₦4 750
2. a) ₦180 on box of fish; ₦25.60 on box of pens; ₦3 056 per iPod b) i) ₦3 600 ii) ₦1 280 iii) ₦36 672
3. a) ₦23 352 b) ₦65 489.76
Workbook: Exercise 1 (wb page 54)1. Price of product Percentage
commissionCommission
a) N450 15% N67.50
b) N12 600 9% N1 134.00
c) N30 000 16.67% N5 000.00
d) N25 880 10% N2 588.00
2. a) Bracelet: ₦57.51; Necklaces: ₦89.1; Brooches: ₦34.83; Earrings: ₦41.31
b) Bracelets: ₦1 150.20; Necklaces: ₦603.80; Brooches: ₦905.58; Earrings: ₦1 487.16
c) 100 − 9 = 91%
Work with discountsRemind the pupils they have worked with discount before. Let them explain what discount means, why they think shops give discount and how they know when products are sold on discount. Explain to the class that shops offer discount when they get new stock and want to get rid of old stock. Go through the list of words related to discount and find out if pupils know

79Theme 4: Mensuration and geometry – Primary measures: Money transactions
discount is normally expressed as percentage.
Ask the class to explore the price of the calculator in the example and the discount or percentage decrease in the price offered. Let them explore and discuss the method to calculate the discount. Ask the pupils which steps they think could be omitted to make the calculation shorter.
Let them work on the board to calculate the discount on these items and the discounted prices they will pay for each item.
Cost price Discount Sale price
Pencils → N104 7 __ 20 × 104 = N36.40 N104 − 36.40 = N67.60
Crayons → N98 7 __ 20 × 98 = N34.30 N98 − 34.30 = N63.70
Scissors → N49.36 7 __ 20 × 49.36 = N17.30 N49.36 − 17.30 = N32.06
Glue stick → N28 7 __ 20 × 28 = N9.80 N28 − 9.80 = N18.20
Magnifying glass → N288 7 __ 20 × 288 = N100.80 N288 − 100.80 = N187.20
The pupils work on their own to complete the workbook exercises either in class or as homework.
Exercise 2 (pb page 133)1. Item Price 20% off 15% off 25% off 30% off
microphone N260 N52 N39.00 N65.00 N78.00
single CD N50 N10 N7.50 N12.50 N15.00
video cassette N45 N9 N6.75 N11.25 N13.50
guitar N25 750 N5 150 N3 862.50 N6 437.50 N7 725.00
drum marimba N12 800 N2 560 N1 920.00 N3 200.00 N3 840.00
Quantitative reasoning2. a) 70 b) 180 c) 150 d) 90
Workbook: Exercise 2 (wb page 55)1. a) ₦21 375 b) ₦64 125
2. a) 0.54% b) ₦497 345

80 Term 2: Unit 6: Calculate commission, discount and social transactions
3. Price of item
Discount Discount amount
Price after discount
a) N368 18% N66.24 N301.76
b) N750 6% N45.00 N705.00
c) N999 8% N80.00 N919.00
d) N2 040 12% N244.80 N1 795.20
e) N1 850 15% N277.50 N1 572.50
f) N35 452 25% N8 863.00 N26 589.00
4. a) ₦1 000 b) ₦950
5. ₦71 400
6. a) 40% b) 20% c) 25% d) 60%
Perform social transactionsAsk the class to explore the first example. They explain what a cheque is and why people use cheques. Explain to them that a cheque is money in print form. When you open a cheque account at a bank, you get a chequebook you can use instead of paying or buying with cash. The service is not free however. You pay the bank commission for each cheque you use.
Ask the class which transactions are done at post offices. Inform the class that people also use courier services like PostNet or SkyNet to send packages to international destinations.
Let the pupils name the value of different Nigerian postage stamps and describe pictures on stamps. Ask them to describe the stamps on page 135, and explore and explain the data in the postage chart showing rates and costs for posting letters and small packages in the example on page 134. They should observe the mass limits, which are ₦60 for 20 g and ₦25 for every extra 20 g or part thereof. Packages over 1 000 g or 1 kg are not allowed to be posted at these rates.
The pupils work on their own to complete the workbook exercises either in class or as homework.
Exercise 3 (pb page 135)1. a) ₦200 b) ₦800 c) ₦4 800
2. a) ₦435 b) ₦160 c) ₦685 d) ₦1 060

81Theme 4: Mensuration and geometry – Primary measures: Money transactions
Exercise 4 (pb page 135)1. a) ₦37; ₦30 + ₦2 + ₦2 + ₦2 + ₦1 stamps
b) ₦49; ₦20 + ₦20 + ₦2 + ₦2 + ₦2 + ₦2 + ₦1 stampsc) ₦73; ₦50 + ₦20 + ₦2 + ₦1 stampsd) ₦133; ₦50 + ₦50 + ₦30 + ₦2 + ₦1 stampse) ₦193; ₦50 + ₦50 + ₦50 + ₦20 + ₦20 + ₦2 + ₦1 stampsf) ₦229; ₦50 + ₦50 + ₦50 + ₦50 + ₦20 + ₦2 + ₦2 +₦2
+ ₦2 + ₦1 stamps
2. a) ₦150 b) ₦200 c) ₦100 d) ₦250 e) ₦350 f) ₦450 g) ₦600 h) ₦750
Workbook: Exercise 3 (wb page 58)
1. Parcel postage rates
Weight not over Area rate National rate
6 kg N3 350 N3 625
7 kg N3 410 N3 700
8 kg N3 470 N3 775
9 kg N3 530 N3 850
10 kg N3 590 N3 925
2. a) ₦3 170 b) ₦3 110 c) ₦3 470 d) ₦3 290 e) ₦3 110 f) ₦3 350
3. a) ₦3 400 b) ₦3 325 c) ₦3 775 d) ₦3 550 e) ₦3 325 f) ₦3 625

82 Term 2: Unit 7: Work with capacity
4THEME Mensuration and geometry
Secondary measures: Capacity
Term 2
Unit 7: Work with capacity
Teaching guidelines and solutions
Instructional resourcesFlow diagrams; petrol gauges; Dienes blocks; cardboard; sticky tape; rulers and pencils; soft sand; 1-litre containers; recipe charts; number lines; conversion charts; cube stacks
Remind pupils of the difference between volume and capacity and which standard unit we use to measure capacity (litres). Capacity is the amount of liquid a container could possibly hold and volume is the amount of liquid in a container.
Let the pupils explore the petrol gauges in the example and estimate the volume of the petrol in each tank. Ask them what the capacity of each tank is. Explain to the pupils the capacity of tank A is 30 litres but the volume of the tank is about 15 litres.
Ask the class to explore the containers in the example. They identify the volume of the liquid in the cola bottle and the volume of the Dienes block. Remind the class they have worked with Dienes blocks, a volume model for representing place value before. Let them name the dimensions of the small cube to discover the length, breadth and height are each 1 cm long. Remind them about square numbers they have worked with in Term 1. Use the idea of 1 squared to help them understand 1 cubed.
1 × 1 = 12 → 1 squared or the square of 11 × 1 × 1 = 13 → 1 cubed or the cube of 1
Ask the class to look at the cola bottle and the big cube again. They should realise the cola bottle can be emptied into the glass cube the same size as the Dienes blocks. The volume of the cola bottle is therefore equal to the volume of the cube.

83Theme 4: Mensuration and geometry – Secondary measures: Capacity
Volume of Dienes block → 10 cm × 10 cm × 10 cm = 1 000 cm3 1 ℓ = 1 000 cm3
Explain to the class the Dienes block and the brick are solids with external volume. The cola bottle and the glass cube, i.e. solids that can be filled with substances, are hollow solids with internal volume.
Construct and compare the capacity of a cubeInform the pupils they will work in their groups to construct their own open or hollow cubes to compare the volume to that of a 1-litre container. Let them collect the materials or supply the materials needed and follow the given steps to construct the cube and compare it to the volume of the 1-litre bottle. Let them share their observations with the class.
Exercise 1 (pb page 138)Pupils construct a cube box by following the instructions.
The relationship between litre and cubic centimetre and conversionAsk the class to explain what internal and external volume means and to name some 3-D objects with internal and external volume, e.g. a dice, plastic ice cream containers, a Rubik’s cube, etc. They identify the objects in the example. Let them explain the differences and similarities between 1 ℓ and 1 000 cm3.
Let the pupils explore the conversion charts showing conversions of whole numbers, fractions and decimals of litres. Encourage them to memorise the conversions. They explain how they convert litres to cm3 and cm3 to ℓ, i.e. multiply and divide by 1 000.
The pupils work on their own to complete the workbook exercises either in class or as homework.
Exercise 2 (pb page 139)1. a) A: 4 ℓ; B: 1 ℓ; C: 5 ℓ; D: 2 ℓ
b) A: 2.5 ℓ; B: 0.8 ℓ; C: 3.6 ℓ; D: 1.2 ℓc) A: 2 500 cm3; B: 800 cm3; C: 3 600 cm3; D: 1 200 cm3
2. 750 ml olive oil; 6 egg yolks; 45 ml mustard; 90 ml lemon juice

84 Term 2: Unit 7: Work with capacity
Exercise 3 (pb page 140)1. a) 0.5 ℓ b) 3.2 ℓ c) 0.00075 ℓ d) 1.5 ℓ e) 0.250 ℓ f) 3 ℓ g) 0.000655 ℓ h) 5 ℓ i) 10 ℓ
2. a) 400 cm3 b) 950 cm3 c) 1 000 cm3
d) 5 000 cm3 e) 1 600 cm3 f) 4 800 cm3
g) 2 000 cm3 h) 6 000 cm3 i) 8 800 cm3
3. a) A: 216 cm3; B: 240 cm3; C: 125 cm3; D: 432 cm3
b) A: 0.216 ℓ; B: 0.24 ℓ; C: 0.125 ℓ; D: 0.432 ℓ
4. 5 cm 5. 19 cm
6. a) 3 cm b) 64 cm3
Exercise 4 Quantitative reasoning (pb page 141)1. a) 1 200 cm3 b) 2 426 cm3 c) 4 000 cm3
d) 4.205 e) 0.745 f) 8.9
2. 38.5 ℓ
3. 787.5 cm3 = 0.7875 ℓ; No
4. a) 432 cm3 b) 594 cm3
c) is more suitable.
5. 0.25 ℓ
6. a) 1.5 ℓ b) 3 ℓ c) 1 500 cm3 d) 1 000 cm3
7. 64 ℓ
Workbook: Exercise 1 (wb page 59)1. a) 4; 2.9; 1.5; 1 000; 500; 275 b) 8 000; 5 600; 750; 3; 0.35; 7.5
2. A: 0.4; B: 0.5; C: 0.7; D: 0.9; E: 1; F: 1.2; G: 300; H: 500; I: 800; J: 1 000; K: 1 200
3. a) 48 cm3 b) 1.728 cm3 c) 84 cm3
4. a) A: 27 cm3; B: 125 cm3; C: 16 cm3; D: 72 cm3
b) A: 0.027 ℓ; B: 0.125 ℓ; C: 0.016 ℓ; D: 0.072 ℓ
5. a) i) 15 ℓ ii) 54 ℓ b) 6 ℓ c) ₦5 970 d) 60 000 cm3
6. 6 cm × 6 cm

85Theme 4: Mensuration and geometry – Primary measures: Mass
4THEME Mensuration and geometry
Primary measures: Mass
Term 2
Unit 8: Work with mass
Teaching guidelines and solutions
Instructional resourcesObjects in pictures; flow diagrams; conversion charts; recipe charts; scales; number lines; mass charts
Let the class explain what mass is and which units are used to measure mass. Explain to them people often use the word weight to refer to mass. Mass is the amount of substance or matter in an object. An object that is weightless in space, still has mass.
The standard unit for measuring mass is a gram. We use kilograms to measure mass of heavier objects. Kilo- means 1 000.
Ask the class to explore the mass of the bars of soap. They find the weight of each bar of soap, the total mass of two bars and all the bars, and explore the methods to do this. They name the fractions and decimals and identify the operations to convert the grams to kilograms.
Convert between grams and kilogramsLet the class read the masses in the conversion chart aloud. Encourage them to memorise the conversions. The pupils work on their own to complete the workbook exercises either in class or as homework.
Exercise 1 (pb page 144)1. a) A: 500 g; B: 750 g; C: 250 g; D: 500 g; E: 750 g
b) A: 1 500 g; B: 2 250 g; C: 1 250 g; D: 1 000 g; E: 750 g c) A: 1.5 kg; B: 2.25 kg; C: 1.25 kg; D: 1 kg; E: 0.75 kg
2. a) < b) = c) < d) > e) = f) >
3. a) 5 kg 75 g b) 1 kg 9 g c) 20 kg 500 g d) 4 kg 350 g e) 3 kg 516 g f) 25 kg 5 g g) 9 kg 999 g h) 6 kg 100 g

86 Term 2: Unit 8: Work with mass
Quantitative reasoning4. a) 125 g b) 600 g c) 875 g d) 1 900 g or 1.9 kg
Exercise 2 (pb page 145)1. a) 21
__ 10 b) 2 _ 5 c) 7 _ 2 d) 1 __ 40
e) 1 _ 4 f) 3 _ 4 g) 24
__ 5 h) 1
___ 200
i) 1 __ 50 j) 709
___ 100 k) 62
__ 5 l) 603
___ 40
2. a) 400 kg
300 kg
b) 400 kg
300 kg
c) 340 000 g; 301 000 g; 250 000 g
Workbook: Exercise 1 (wb page 61)1. Grams Decimal of kg kg and g
e .g . 2 515 g 2.515 kg 2 kg 515 g
a) 1 851 g 1.851 kg 1 kg 851 g
b) 2 650 g 2.650 kg 2 kg 650 g
c) 8 652 g 8.652 kg 8 kg 652 g
d) 6 795 g 6.795 kg 6 kg 795 g
e) 8 935 g 8.935 kg 8 kg 935 g
2. a) 6 525 g b) 2 500 g c) 4 001 g d) 750 g e) 3 654 g f) 1 400 kg
Identify the mass of items and calculate massAsk the class to explore the objects in the example and say which unit of measure they would use to weigh the objects. Let them estimate the mass of each object.
Let the pupils compare the mass of objects in litres and kg and say which weighs more. Explain to them that one cubic centimetre (cm3) of liquid is equal to one gram.

87Theme 4: Mensuration and geometry – Primary measures: Mass
Supply groups of pupils with scales and let them measure the objects to check their estimates. If you do not have scales available, let the pupils collect the materials named in the note to create their own balancing scales. They use marbles, sugar cubes, etc. as weights.
Ask the class to explore the mass of the pupils on the scales. They find each pupil’s mass and compare the masses to find out who is the heaviest and the lightest. They calculate the total mass of the boys and the girls. Ask them to calculate the difference between the mass of the boys and girls. (This could be sensitive to some pupils so do this example with care.)
The pupils work on their own to complete the workbook exercises either in class or as homework.
Exercise 3 (pb page 147)1. a) Banke: 37 kg + Saheed: 31 kg + Habib: 34 kg
+ Deji: 30 kg + Tinuke: 33 kg + Tayo: 38 kg + Sesan: 36 kg + Bolu: 40 kg + Tope: 29 kg + Sumbo: 39 kg = 347 kg
b) 34.7 kg c) 34.7 kg
2. Pupils’ own results
Exercise 4 Quantitative reasoning (pb page 148)1. a) total mass = 2 800 g b) i) 5 250 g ii) 2 250 g iii) 2 500 g iv) 2 400 g c) i) 5.25 kg ii) 2.25 kg iii) 2.5 kg iv) 2.4 kg
d) 5.25 + 2.25 + 2.5 + 2.4 = 12.4 kg
2. 7.8 kg
3. a) 375 g flour; 150 g butter; 150 g sugar; 150 g mixed fruit; 3 eggs
b) 1 000 g flour; 400 g butter; 400 g sugar; 400 g mixed fruit; 8 eggs
c) four times as long (60–80 minutes)
4. 750 g or 0.75 kg 5. 6 packs of sugar 6. 40 bags
7. 6.3 kg 8. 15 packets
Workbook: Exercise 2 (wb page 62)1. a) 900 g b) between 17:50 and 18:05 c) 675 g
2. 286 kg 3. 15.876 kg 4. 11 apples

88 Term 2: Unit 9: Measure height and distance
4THEME Mensuration and geometry
Primary measures: Length
Term 2
Unit 9: Measure height and distance
Teaching guidelines and solutions
Instructional resourcesObjects in pictures; flow diagrams; maps; measuring tools; length, height and distance charts; leg and hand spans; conversion charts
Ask the class to explain what length is and name some objects of known length. Ask them to name objects in the classroom that have lengths they can measure. Let them explain what distance is and name distances they can measure. Ask them to explain which standard or regular units we use to measure length, height and distance.
Let the class explore the objects and measurements in the example. Tell them to compare the length and height of the objects and the distances between places and to answer the questions.
Length of the stick → 10.7 cm Height of the boy → 1.3 mDistance between house and school → 2.5 km
Pupils may give the length of a ruler, their heights, distance between their houses and the school, between Lagos and Lagos Airport and the place they live and Lagos mainland.
Measure in hand spans and leg pacesExplain to the class how people measured in ancient times using body parts without the measuring tools we use today. Let the class explore each body part measurement in the example and estimate the lengths of each part. Let the pupils work with partners to show and compare the body parts.

89Theme 4: Mensuration and geometry – Primary measures: Length
They should notice that the lengths differ. Let them name the approximate lengths of the body parts in the note. Ask the class why they think people stopped measuring in body parts.
The pupils work on their own to complete the workbook exercises either in class or as homework.
Exercise 1 (pb page 151)1–5. Pupils measure using hand spans and rulers. They can compare tables to make sure they are accurate.
Object Number of hand spans Actual measurementsLength Width Length Width
a) Exercise book 1 hand span 1.5 hand spans 20 cm; 0.2 m 30 cm; 0.3 mb) Desk/table 6 hand spans 3.5 hand spans 120 cm; 1.2 m 70 cm; 0.7 mc) Teacher’s table 8 hand spans 4.5 hand spans 160 cm; 1.6 m 90 cm; 0.9 md) Writing board 10 hand spans 5 hand spans 200 cm; 2 m 100 cm; 1 me) Window 4 hand spans 6 hand spans 80 cm; 0.8 m 120 cm; 1.2 m
Exercise 2 (pb page 152)1–2.
Object measuredDistance in leg spans
Distance in metres
A. Length of classroom floor 23 18 mB. Breadth of classroom floor 11 9 mC. Length of writing board 4 3 mD. Distance from your desk to teacher’s table 7 6 mE. Distance from your desk to the door 9 8 mF. Length of teacher’s table 2 1.8 mG. Length of classroom window 5 4 m
3. They are proportional. The amount of leg spans should be roughly equal to the length in metres because 1 leg span ≈ 1 metre.
Workbook: Exercise 1 (wb page 64)1. a) 2 b) 3.5 c) 4 d) 4.5 e) 5 f) 10
2. a) 1 b) 5 c) 9 d) 10 e) 13 f) 15
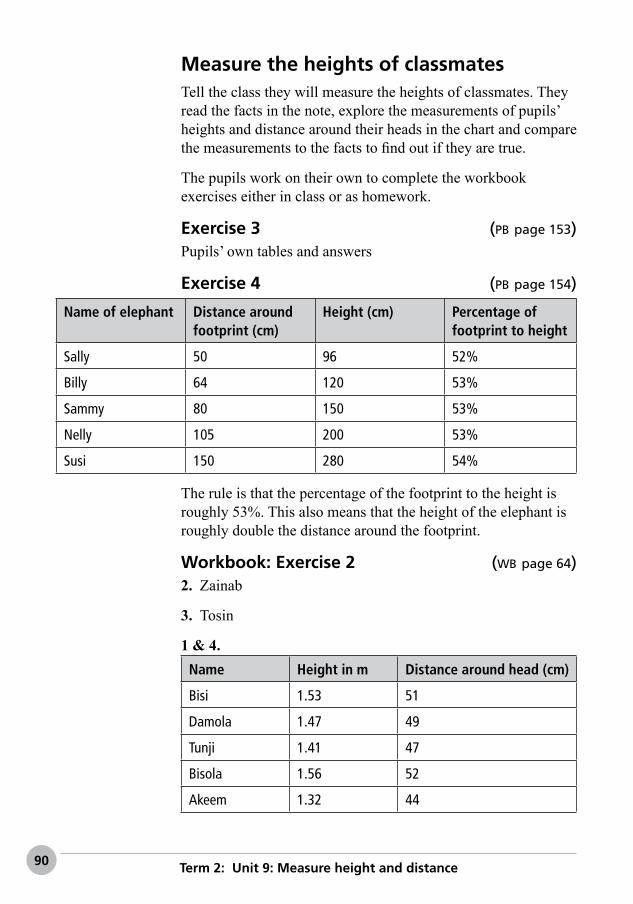
90 Term 2: Unit 9: Measure height and distance
Measure the heights of classmatesTell the class they will measure the heights of classmates. They read the facts in the note, explore the measurements of pupils’ heights and distance around their heads in the chart and compare the measurements to the facts to find out if they are true.
The pupils work on their own to complete the workbook exercises either in class or as homework.
Exercise 3 (pb page 153)Pupils’ own tables and answers
Exercise 4 (pb page 154)
Name of elephant Distance around footprint (cm)
Height (cm) Percentage of footprint to height
Sally 50 96 52%
Billy 64 120 53%
Sammy 80 150 53%
Nelly 105 200 53%
Susi 150 280 54%
The rule is that the percentage of the footprint to the height is roughly 53%. This also means that the height of the elephant is roughly double the distance around the footprint.
Workbook: Exercise 2 (wb page 64)2. Zainab
3. Tosin
1 & 4. Name Height in m Distance around head (cm)
Bisi 1.53 51
Damola 1.47 49
Tunji 1.41 47
Bisola 1.56 52
Akeem 1.32 44

91Theme 4: Mensuration and geometry – Primary measures: Length
Name Height in m Distance around head (cm)
Kayode 1.35 45
Tosin 1.62 54
Hammed 1.44 48
Zainab 1.2 40
Biola 1.38 46
5. a) 1.47 − 1.38 = 0.09 m b) 1.53 − 1.44 = 0.09 m c) 1.62 − 1.35 = 0.27 m d) 1.41 − 1.32 = 0.09 m
Measure heights and distances outside the classroomTell the class they will work with larger heights and longer distances in this activity. They will go outside and measure heights of buildings, trees and distances between places.
In the example, let them explore the facts and have a class discussion concerning extreme heights and depths on earth. Pupils develop social knowledge regarding the deepest part of the sea, one of the highest tidal waves recorded, one of the deepest caves on Earth and the highest mountain on Earth.
Ask the pupils to give the heights and depths in the example in kilometres. They should know they have to divide by 1 000.
Mariana Trench → 10 994 m = 10.994 kmTsunami wave → 524 m = 0.524 kmKrubera Cave → 1 710 m = 1.710 kmMount Everest → 8 848 = 8.848 km
Work through the questions in the example in class.
The pupils work on their own to complete the workbook exercises either in class or as homework.
Exercise 5 (pb page 155)Pupils’ own tables and answers
Exercise 6 Quantitative reasoning (pb page 156)1. 68 m
2. A: 44 m, B: 27 m, C: 0 m

92 Term 2: Unit 9: Measure height and distance
3. a) A: 4.5 m, B: 5.8 m, C: 6.8 mb) 0.48 m
4. 4 900 m or 4.9 km
5. 260.52 km
6. 94 km
Workbook: Exercise 3 (wb page 65)1. 0.75 + 0.75 + 0.75 + 0.75 = 3 m
2. 181 − 25 = 156 cm
3. 1.95 + 0.5 = 2.45 m
4. 3 × 3.5 = 10.5 km
5. 30.1 m
6. a) 200 km b) 40 km

93Theme 4: Mensuration and geometry – Primary measures: Time
4THEME Mensuration and geometry
Primary measures: Time
Term 2
Unit 10: Solve problems involving speed
Teaching guidelines and solutions
Instructional resourcesFlow diagrams; traffic signs; speed charts; train timetable; number lines
Tell the class they will start by finding out what the meaning or definition of speed is. Look at example 1. Ask them what they think is the fastest a car is allowed to drive on the road and what the speed limit or the maximum speed is that vehicles can drive on a national road. Find out if they know what happens when a vehicle goes over or exceeds the speed limit and how traffic officers know when cars go too fast. Let the pupils explore the picture, observe the speed limit on the road and by how much the driver exceeded the speed limit.
Assist the pupils in understanding that speed is a measure to find out how fast or slowly modes of transport, people, animals or forces of nature move. Speed is measured in units of time, i.e. seconds, minutes and hours over a certain distance. We measure speed of vehicles with a speedometer, and the speed of people and animals with a stopwatch. Ask them to imagine light travelling at a speed of 300 000 km per second (km/s).
Let the class explore the pictures taken by a road camera in example 2, showing pairs of photos taken one second after the other. Ask them to find out which vehicle goes faster in each pair of photos. Ask them if the ambulance is allowed to drive faster than the traffic car in picture B, and why they think the fire truck is going faster than the combi in picture D.
Calculate average speedExplain that drivers of vehicles travelling long distances often have to stop at traffic lights and garages and drive slower
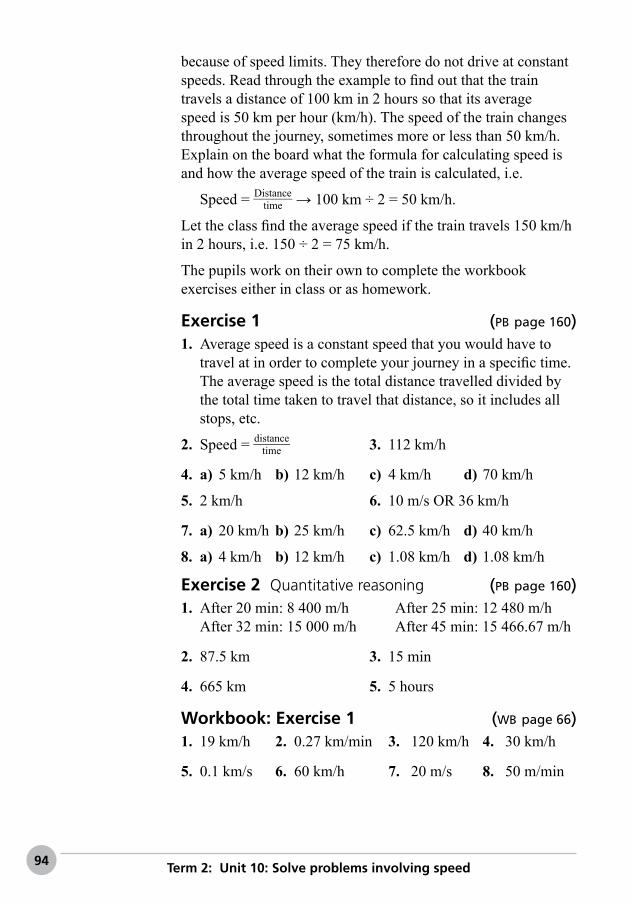
94 Term 2: Unit 10: Solve problems involving speed
because of speed limits. They therefore do not drive at constant speeds. Read through the example to find out that the train travels a distance of 100 km in 2 hours so that its average speed is 50 km per hour (km/h). The speed of the train changes throughout the journey, sometimes more or less than 50 km/h. Explain on the board what the formula for calculating speed is and how the average speed of the train is calculated, i.e.
Speed = Distance
______ time → 100 km ÷ 2 = 50 km/h.
Let the class find the average speed if the train travels 150 km/h in 2 hours, i.e. 150 ÷ 2 = 75 km/h.
The pupils work on their own to complete the workbook exercises either in class or as homework.
Exercise 1 (pb page 160)1. Average speed is a constant speed that you would have to
travel at in order to complete your journey in a specific time. The average speed is the total distance travelled divided by the total time taken to travel that distance, so it includes all stops, etc.
2. Speed = distance _____ time 3. 112 km/h
4. a) 5 km/h b) 12 km/h c) 4 km/h d) 70 km/h
5. 2 km/h 6. 10 m/s OR 36 km/h
7. a) 20 km/h b) 25 km/h c) 62.5 km/h d) 40 km/h
8. a) 4 km/h b) 12 km/h c) 1.08 km/h d) 1.08 km/h
Exercise 2 Quantitative reasoning (pb page 160)1. After 20 min: 8 400 m/h After 25 min: 12 480 m/h
After 32 min: 15 000 m/h After 45 min: 15 466.67 m/h
2. 87.5 km 3. 15 min
4. 665 km 5. 5 hours
Workbook: Exercise 1 (wb page 66)1. 19 km/h 2. 0.27 km/min 3. 120 km/h 4. 30 km/h
5. 0.1 km/s 6. 60 km/h 7. 20 m/s 8. 50 m/min

95Theme 4: Mensuration and geometry – Primary measures: Time
Workbook: Exercise 2 (wb page 67)1. 40 km/h 2. 50 km/h 3. 107.5 km/h
4. a) 336 km
_______ 0.75 hours = 448 km/h
b) 146 km
_______ 1.25 hours = 116.8 km/h
c) 162 km
______ 1.5 hours = 108 km/h
5. 3 750 m
6. 11 hours and 36 minutes
7. 6 hours and 24 minutes

96 Term 2: Unit 11: Compare and convert temperature
4THEME Mensuration and geometry
Primary measures: Temperature
Term 2
Unit 11: Compare and convert temperature
Teaching guidelines and solutions
Instructional resourcesThermometers; temperature graphs; meteorological data; vertical and horizontal number lines; temperature scales; temperature charts; maps
Ask the class to explore the pictures in the example to find out what they remember about temperature. They compare temperatures in the pictures to find out which is warmer or colder, define temperature, name the instruments we measure temperature with and identify the temperature of different objects and situations.
Go through the facts to help pupils define and understand temperature in degrees Celsius and Fahrenheit. Explain that degrees Celsius was invented by, and named after the Swedish astronomer, Anders Celsius.
Read and use thermometersExplain to the class we use different thermometers, i.e. analogue and digital thermometers.
Ask the class to explore the thermometers in the example and work through the questions. Explain the calibrations on analogue thermometers for measuring body temperature.
The pupils work on their own to complete the workbook exercises either in class or as homework.

97Theme 4: Mensuration and geometry – Primary measures: Temperature
Exercise 1 (pb page 164)1. a) 7 °C
b) A: 27 °C; B: 18 °C; C: 13 °C; D: 6 °C; E: 1 °C; F: −2 °C; G: −9 °C; H: −14 °C
2. a) 0 °C b) 0 °C c) 17 °C d) −8 °C e) −3 °C f) 2 °C g) 3 °C h) −16 °C
3. a) 40.1 °C b) 3.1 °Cc) Take her to the doctor.
Exercise 2 (pb page 164)Pupils’ own temperature charts and answers
Workbook: Exercise 1 (wb page 69)
1. a)
–20 –10 0 10 20 30
31 °C
40 50 60 70 80 90 100
°C
b)
–20 –10 0 10 20 30
–16 °C
40 50 60 70 80 90 100
°C
c)
–20 –10 0 10 20 30
20.5 °C
40 50 60 70 80 90 100
°C
2. a) coldest → −25 °C; hottest → 31 °Cb) coldest → −18 °C; hottest → −4 °Cc) coldest → −1 °C; hottest → 20 °Cd) coldest → −2 °C; hottest → 41 °C
3. a) 2 °C; 0 °C; −2°C b) −1 °C; 2 °C; 5 °C c) 3 °C; 0 °C; −3 °C d) −4 °C; 0 °C; 4 °C
Read temperatures of places and regions (areas)Tell the class they will now work with temperatures in places around the world and locations in Nigeria. They start by exploring extreme low temperatures in Antarctica (South Pole) and the Arctic (North Pole) in example 1. Help the class understand the temperatures in the table were recorded during a

98 Term 2: Unit 11: Compare and convert temperature
year at the bases shown. The data in the table show the monthly average temperatures for the bases. They should realise that the conditions at the Poles are severe and the people living there are mostly researchers from different countries who want to find out about the weather and animal life conditions.
Pose the questions to find out how pupils interpret the data in the table. They discuss why there are no towns or cities in the Poles and compare temperatures to find which base is colder, name the months that are warmer and have temperatures below zero and find the difference between highest and lowest temperatures. Let them explain why they would or would not live at the Poles and how the temperatures are different in their environment from temperatures at the Poles.
Go through the information describing the weather conditions in regions of Nigeria in example 2. Pose the questions to help pupils find out more about the weather conditions. They show the areas below 1 000 m and 500 m above sea level, name the number of seasons occurring and the natural features that influence temperature levels.
Let the class explore the data in the table indicating average maximum and minimum temperatures in different areas and places in Nigeria. They calculate the range between minimum and maximum temperatures and compare temperatures to find places with the lowest and highest average temperatures. Explain the possibility of rain if the difference between daily temperatures is less than 10 °C.
The pupils work on their own to complete the workbook exercises either in class or as homework.
Exercise 3 (pb page 167)1. Feb 33.1 °C; Mar 32.7 °C; Jan 32.2 °C; Apr 32.1 °C;
Nov 31 °C; May 30.9 °C
2. Jun 22.6 °C; Jan 22.3 °C; Oct 22.3 °C; Jul 22.1 °C; Sep 21.9 °C; Aug 21.7 °C
3. a) Jan 9.9 °C Feb 9.6 °C Mar 8.9 °C Apr 8.5 °C May 7.8 °C Jun 6.6 °C Jul 6 °C Aug 6.4 °C Sep 7 °C Oct 8.1 °C Nov 8.4 °C Dec 8 °C
b) 7.93 °C c) 30.62 °C d) 22.68 °C

99Theme 4: Mensuration and geometry – Primary measures: Temperature
4. The average maximum temperature is between 33.1 °C and 28.1 °C. This is a small difference between seasons. The average minimum temperature is between 23.8 °C and 21.1 °C, which is also a small difference between seasons. The average temperatures are quite high so it is usually quite hot in Lagos. The average minimum temperatures are quite high so it shows that it doesn’t get cold very often in Lagos.
Exercise 4 (pb page 167)1. Pupils find Finland on a map.
2. a) −9 °C b) 6 °C c) 7 °C d) 9 °C e) −10 °C f) −16 °C g) 3 °C h) 4 °C
3. −16 °C 4. 9 °C 5. 13 °C
6. 9 °C; 7 °C; 6 °C; 4 °C; 3 °C; −9 °C; −10 °C; −14 °C; −16 °C
7. −2.22 °C
Workbook: Exercise 2 (wb page 70)1. a) 14 °C b) 19 °C c) −26 °C d) 0 °C e) −58 °C f) 20 °C
2. 31 °C
3–5. Pupils’ own work
Convert between Celsius and FahrenheitExplain that some countries use degrees Fahrenheit (°F) as the unit of measuring temperature. Some cooking and baking recipes and data on weather and climate in books and on the Internet give temperatures in degrees Fahrenheit. It is therefore important that we know how to change or convert between degrees Fahrenheit and degrees Celsius (°C). Assist the pupils in understanding the formulas to convert between degrees Celsius and degrees Fahrenheit.
Ask the pupils to explore and discuss the woman’s problem in the example and find out how many degrees Fahrenheit are equal to 180 °C. They should have observed that 0 °C = 32 °F and 100 °C = 212 °F.

100 Term 2: Unit 11: Compare and convert temperature
Let them use the formula to convert the following from Celsius to Fahrenheit on the board.
[0 °C × 9 _ 5 ] + 32 → (0 × 9 ÷ 5) + 32 → 0 + 32 = 32 °F
[100 °C × 9 _ 5 ] + 32 → (100 × 9 ÷ 5) + 32 → 900 ÷ 5 = 180 °F
[180 °C × 9 _ 5 ] + 32 → (180 × 9 ÷ 5) + 32 → 900 ÷ 5 = 324 °F
Assist the class in understanding the formula for converting between degrees Fahrenheit and Celsius. They subtract 32 and multiply by 5 _ 9 .
[(32 °F − 32) × 5 _ 9 ] → 0 × 5 ÷ 9 → 0 ÷ 9 = 0 °C
[(212 °F − 32) × 5 _ 9 ] → 180 × 5 ÷ 9 → 900 ÷ 9 = 100 °C
They use the formula to convert the degrees Celsius to Fahrenheit on the board.
[30 °C × 9 _ 5 ] + 32 → (30 × 9 ÷ 5) + 32 → 270 ÷ 5 = 54 °F
[90 °C × 9 _ 5 ] + 32 → (90 × 9 ÷ 5) + 32 → 180 ÷ 5 = 36 °F
The pupils work on their own to complete the workbook exercises either in class or as homework.
Exercise 5 (pb page 144)1. a) 32 °F b) 50 °F c) 140 °F d) 212 °F e) 68 °F f) 86 °F
2. a) 4.44 °C b) 36.67 °C c) 37.78 °C d) 54.44 °C e) 67.78 °C f) 76.67 °C
3. Pupils use the formulas to check answers.
Exercise 6 (pb page 169)1.
City Country °C °F
Pretoria South Africa 24 75.2
Lisbon Portugal 16.11 61
Abuja Nigeria 20.56 69
Melbourne Australia 33 91
Bangui Central African Republic 35 95
Sao Paulo Brazil 21 69.8

101Theme 4: Mensuration and geometry – Primary measures: Temperature
2. Lisbon
3. Bangui
4. 16 °C; 20 °C; 21 °C; 24 °C; 33 °C; 35 °C
Workbook: Exercise 3 (wb page 71)1. a) 149 °F b) 167 °F c) 77 °F d) 98.6 °F e) 95 °F f) 57.2 °F g) 41 °F h) 75.2 °F
2. a) 44.4 °C b) 30 °C c) 55.6 °C d) 82.2 °C e) 15 °C f) 18.3 °C g) 87.7 °C h) 95.6 °C

102 Term 2: Revision
2TERM
Revision
You may use the revision questions or a selection thereof for the final assessment at the end of the term. The questions and problems involve work covered in topics during the term. The problems include routine problems and those involving quantitative reasoning.
Revision solutions (pb page 170)1. A, B and C; E and F
2. a) 2 : 3 b) 2 : 5 c) 3 : 5 d) 1 : 4 e) 1 : 4 f) 1 : 3
3. a) 2 : 28 b) 5 : 25 c) 19 : 11 d) 13 : 17 e) 9 : 21 f) 7 : 23
4. a) 360 b) 360 : 900 c) 2 : 5 d) 40%
5. a) 1 : 4b) i) 48 ii) 80c) i) 9 ii) 14
6. a) 12 b) 20 c) 4 d) 10
7. a) Yoruba 3 : 5; Igbo 1 : 5; Hausa 3 : 20; Other 1 : 20b) Yoruba 60%; Igbo 20%; Hausa 15%; Other 5%
8.
Amount in naira
Foreign currencies
leone rand dollar pound cedi
a) 7 825 158 378 469.5 4 1.4725 23.48 156.5
b) 50 680 1 025 763.2 3 040.8 26 8.604 152.04 1 013.6
c) 950.40 19 236.1 57.02 5.0371 2.85 19.01
d) 48 971.52 2.88 0.2544 0.14 0.96
e) 223.56 4 524.85 13.41 1.1849 0.67 4.47
f) 1 250 25 300 75 6.625 3.75 25

103Term 2: Revision
9. a) Le404.80; R1.20; $0.106; ₤0.06; ₵0.40b) Le4 048; R12; $1.06; ₤0.60; ₵4c) Le40 480; R120; $10.60; ₤6; ₵40d) Le404 800; R1 200; $106; ₤60; ₵400
10. a) ₦12 400 b) ₦4 000 c) ₦800 profit
11. ₦4 500
12. 13.64 years
13. 50%
14. a) ₦117.75 b) ₦667.25 c) ₦4 003.50
15. a) No, he does not have enough money. The two CDs cost ₦536 and he only has ₦510. He needs another ₦26.
b) ₦235.84c) Yes. The two CDs are now ₦471.68.
16. a) ₦5 375 b) ₦5 375 c) ₦5 750 d) ₦5 875
17. a) 17.5% b) 10.5% c) 28% d) 21%
18. a) Petrol can: 9 000 cm3; Fish tank: 108 000 cm3
b) Petrol can: 9 ℓ; Fish tank: 108 ℓ
19. a) 1 ℓ; 2.6 ℓ; 9.75 ℓb) 4 000 cm3; 3 250 cm3; 2 400 cm3
20. D. 16 bottles
21. 9 ℓ
22. a) i) 0.565 kg ii) 0.072 kg iii) 2.054 kg iv) 1.49 kg v) 0.7 kg vi) 11.5 kg
b) i) 113
___ 200 kg ii) 9
___ 125 kg iii) 1 027
____ 500 kg
iv) 149
___ 100 kg v) 7 __ 10 kg vi) 23
__ 2 kg
23. 1 g
24. 53.2 kg
25. 39 kg
26. a) 40 cm b) 70 cm c) 100 cm d) 180 cm
27. a) 10 leg spans b) 20 leg spans c) 44 leg spans d) 62 leg spans

104 Term 2: Revision
28. a) cubit
b) Height (cm) Distance from elbow to fingertip (cm)
Height ÷ distance
A. 152 42 4
B. 133 35 4
C. 136.5 35 4
D. 161 41 4
E. 175.5 45 4
F. 160 40 4
c) 4d) 1.5 m; 1.3 m; 1.4 m; 1.6 m; 1.8 m; 1.6 m
e) i) 39 cm ii) 0.27 m iii) 0.09 m iv) 0.19 m
29. kilometres
30. a) 3 _ 7 b) 9 m
31. a) 136 km b) 254 km
32. a) 37 °C b) 100 °C c) 0 °C d) 20 °C e) 20 °C f) 60 °C g) 180 °C
33. a) Highest: 75 °C; Lowest: −50 °Cb) Highest: 5 °C; Lowest: −5 °C
34. C
35. a) 60 °C b) 180 °C c) 20 °C d) 50 °C e) 28 °C f) 19 °C
36. Carrot muffins → 356 °F Lamb pie→ 204.44 °C Mini pizzas → 392 °F Corn pudding→ 165.56 °C Meat balls → 428 °F Roast turkey→ 190.56 °C Lamb roast → 176.67 °C Corn bread → 374 °F
37. a) 720 km/h b) 160 km/h c) 18 km/h d) 180 km/h
38. 72 km/h
39. 45 km/h

105Theme 4: Mensuration and geometry – Plane shapes: Lines, triangles, quadrilaterals
4THEME Mensuration and geometry
Plane shapes: Lines, triangles, quadrilaterals
Term 3
Unit 1: Work with lines, triangles and quadrilaterals
Teaching guidelines and solutions
Instructional resourcesShapes and lines; flags; street plan; shape charts; flow diagrams; property checklists
Explain to the class that a plane is a flat surface. Triangles and quadrilaterals such as squares and rectangles are plane or two-dimensional shapes that can be drawn on a plane. Plane shapes have length and breadth. Make drawings of the shapes on the board to help the pupils recall the facts.
Let the pupils explore the pictures in the example. Ask them where in the pictures they see the geometrical lines that appear below the example. Ask the class what they think would happen if the train tracks or the sides of the window, the brick wall and the sides of the door would be built as the skew lines shown.
Draw parallel linesExplain to the class that lines A, C, D and F are sets of parallel lines. Two or more parallel lines are straight lines that are always the same distance apart, no matter how long they are. Write the description and the format for writing parallel lines AB and CD on the board, as shown in the example. Let them describe and show the formats for the other parallel lines.
Ask the pupils to explore objects in class and identify parallel lines. Let them explore the rectangle to observe how two different pairs of parallel lines are labelled, i.e. with single and double sets of arrows.
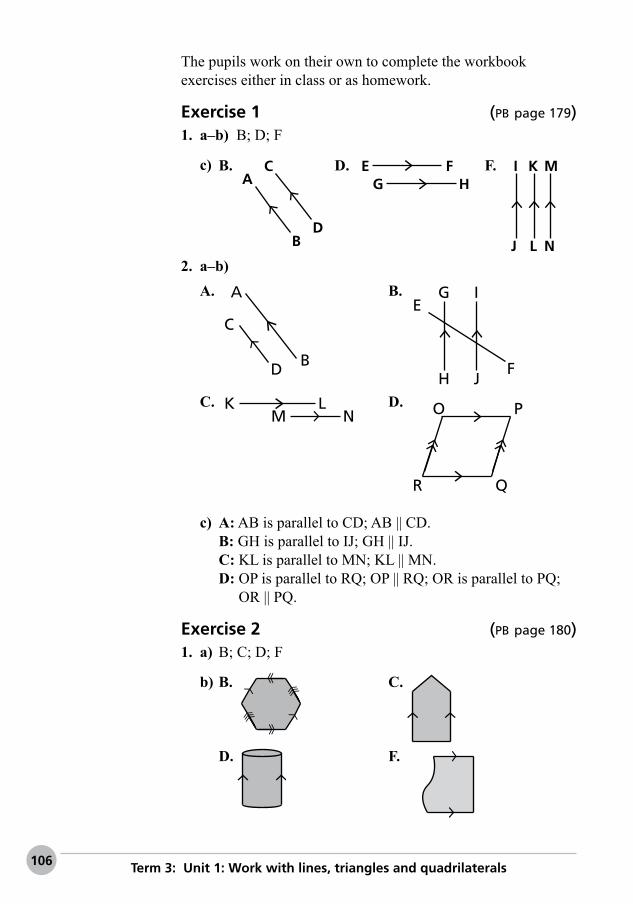
106 Term 3: Unit 1: Work with lines, triangles and quadrilaterals
The pupils work on their own to complete the workbook exercises either in class or as homework.
Exercise 1 (pb page 179)1. a–b) B; D; F
c) B.A
C
BD
D. E FG H
F. I K M
J L N2. a–b)
A.
A
B
C
D
B.
H JF
IE
G
C. K LM N
D. PO
QR
c) A: AB is parallel to CD; AB || CD. B: GH is parallel to IJ; GH || IJ. C: KL is parallel to MN; KL || MN. D: OP is parallel to RQ; OP || RQ; OR is parallel to PQ;
OR || PQ.
Exercise 2 (pb page 180)1. a) B; C; D; F
b) B. C.
D. F.

107Theme 4: Mensuration and geometry – Plane shapes: Lines, triangles, quadrilaterals
2. a) False b) True c) False d) True e) True f) False
3. Parallel lines are straight lines that are in the same direction. They are always the same perpendicular distance apart from one another. A line that crosses one parallel line perpendicularly will cross the other parallel line perpendicularly as well.
Workbook: Exercise 1 (wb page 72)1. a) A
C D
B b)
AC
D
B
c)
A
C D
B
E
F
G
H
d)
BD
F
E
CA
2. a) AB ‖ CD b) AB ‖ CD c) AB ‖ CD; EF ‖ GH d) AB ‖ CD ‖ EF
3. a)
FED
C
A B
G H
I
b) B
A
CDE
F
c) A
C
B D
E
d) A B
GEC
D F H

108 Term 3: Unit 1: Work with lines, triangles and quadrilaterals
e) B A
C
D G
E
F
4. a) b)
c) d)
a)5. b)
c)
Draw perpendicular linesAsk the class to look around the classroom to identify the pairs of lines as shown in the Pupil’s Book. Let them explore the pictures in the example to identify similar lines. Ask them to describe the pairs of lines in their own words. Inform the class that the lines are perpendicular lines. Explain that perpendicular means ‘at right angles’. Two lines are perpendicular when they meet at right angles (at 90 degrees or 90°). We use a small square (□) and the symbol ⊥ to describe perpendicular

109Theme 4: Mensuration and geometry – Plane shapes: Lines, triangles, quadrilaterals
lines. Explain to the class that 90 degrees (90°) is not the same as 90 °C or 90 °F as in measuring temperature. The degrees mentioned here refer to measuring angles, which they will learn about in Unit 3. Let them explore the drawing and describing perpendicular lines.
Explain to the class that a line could also be perpendicular to a plane, for example an electric cord and the floor. Two planes could also be perpendicular, for example two walls, or two sides of a box meeting in a corner. Two lines can also intersect each other perpendicularly. Lines that cross each other are intersecting lines. Let the pupils explore the drawings to help them interpret these facts.
Ask the pupils to look around in the classroom to identify perpendicular lines.
The pupils work on their own to complete the workbook exercises either in class or as homework.
Exercise 3 (pb page 182)1. A.; C.; E.
2. A
D
B
C A
AB CD
C
J
I
K
IJ JK
E
PO
Q
RQR OP
3. a) False b) False c) True d) False e) True f) False g) True h) True
4. a) EA and CFb) DA, EJ and CBc) AB and DCd) CH and GAe) Any four pairs from: AB || DC; DA || CB; AG || HC;
AE || FC; DA || EJ; EJ || CB.
5. a) Hill; Fox; Short; Topb) Longc) Block; Hill; Fox; Short; Topd) Block; Hill; Fox; Short; Top

110 Term 3: Unit 1: Work with lines, triangles and quadrilaterals
e) Block; Hill; Fox; New; Top; Boxf) Block; Hill; Fox; Short
6. Perpendicular lines are lines that meet at right angles to one another.
Workbook: Exercise 2 (wb page 74)1. a) A
BC D
b)
E
FG
H
c) M
NO P
R
Q
2. a) GH b) EF c) OP d) AB e) MN, QR f) CD g) OP
3. a)
DC
G
I H
A B
E F
b) A
E
B
D
c) A
B C
E D
d) A
B C D
F E
e)
B
A D
C
4. a) AB ⊥ AC; FH ⊥ HI; GI ⊥ HI; AB ⊥ BEb) AB ⊥ BD; AB ⊥ AE; ED ⊥ AE; ED ⊥ BDc) ED ⊥ DC; AB ⊥ EDd) AB ⊥ BC; FC ⊥ BD; ED ⊥ BD; FE ⊥ ED; FE ⊥ FCe) AB ⊥ BC; BC ⊥ CD

111Theme 4: Mensuration and geometry – Plane shapes: Lines, triangles, quadrilaterals
Work with trianglesInform the class they will state properties of equilateral, isosceles, scalene, and right-angled triangles. They will use knowledge of perpendicular lines to identify and describe right-angled triangles. Let the pupils explore the diagrams in example 1 and explain to the pupils that a triangle is a 2-D or plane shape with 3 straight sides and 3 interior (inside) angles. Tri- means three. Triangles are classified as polygons, i.e. closed 2-D shapes with more than two straight sides. A triangle is the simplest polygon. We classify triangles by the lengths of their sides and the size of their angles. The bottom side of a triangle is its base. Inform them that the faces of the Egyptian pyramids are isosceles triangles.
Ask the pupils what they think the small lines on the sides of the equilateral, isosceles, scalene triangles, the arcs, or archers indicate and explain what they observe about the angles in the triangles.
Let the class explore the right-angled triangles in example 2 and explain why they think the triangles are named as such, and what the small squares and the small lines indicate. Ask them whether a right-angled triangle can also be an isosceles, an equilateral or a scalene triangle.
The pupils work on their own to complete the workbook exercises either in class or as homework.
Exercise 4 (pb page 184)1. a) scalene b) isosceles c) equilateral d) right-angled isosceles e) isosceles f) right-angled isosceles g) equilateral h) right-angled i) scalene j) right-angled isosceles
2. a) equilateral b) scalene c) isosceles d) right-angled e) scalene f) equilateral g) isosceles h) right-angled
Quantitative reasoning3. a) Never true b) Always true c) Sometimes true d) Always true e) Sometimes true f) Never true

112 Term 3: Unit 1: Work with lines, triangles and quadrilaterals
Workbook: Exercise 3 (wb page 75)1. a) scalene b) equilateral c) right-angled d) isosceles
2. a) No sides equal; no angles equalb) All sides equal; all angles equal (to 60°)c) 2 perpendicular sides; 1 right angled) 2 sides are equal; 2 angles are equal
3. a) 8 b) 12
4. A: right angled; D: isosceles; G: isosceles B: right angled; E: isosceles; H: scalene C: isosceles; F: isosceles; I: scalene
5. Type of triangle Diagram
a) Isosceles triangle
b) Right-angled triangle
c) Scalene triangle
d) Right-angled isosceles triangle
e) Equilateral triangle

113Theme 4: Mensuration and geometry – Plane shapes: Lines, triangles, quadrilaterals
Identify the properties of parallelogramsRemind the class they have worked with the properties of quadrilaterals (squares and rectangles) in Primary 4. Ask the pupils to recall what a quadrilateral is and to name and draw some quadrilaterals they know on the board. Assist pupils in understanding the facts describing quadrilaterals. Let the class explore, name and describe the square, rectangle and parallelogram in the example by referring to the sides, angles and opposite angles of the shapes.
Pupils explore the shapes and the lines in the shapes. They identify symmetry lines and non-symmetry lines and observe that the lines cut the shapes in half. Help the pupils understand that the diagonal lines in the rectangle and parallelogram are not symmetry lines but the diagonal in the square is a symmetry line. The vertical lines and the diagonal line in the square, rectangle and parallelogram are symmetry lines.
The pupils work on their own to complete the workbook exercises either in class or as homework.
Exercise 5 (pb page 186)1. The shape
has:Square Rectangle Parallelogram
a) Four sides ✓ ✓ ✓
b) Four angles ✓ ✓ ✓
c) Opposite sides equal in length
✓ ✓ ✓
d) Opposite angles equal in size
✓ ✓ ✓
e) Opposite sides parallel
✓ ✓ ✓
f) Diagonal or symmetry lines that cut them in half
✓ ✓ ✓

114 Term 3: Unit 1: Work with lines, triangles and quadrilaterals
2. A B
CD
E F
GH
I
L K
J M
P
N
O
3. a) Square b) Parallelogram c) Rectangle d) Parallelogram e) Square f) Rectangle
Quantitative reasoning4. a) Pupil’s own answers. b) Pupil’s own answers.
Workbook: Exercise 4 (wb page 77)1. a) b)
c) d)
2. Opposite sides are parallel, opposite sides are equal, opposite angles are equal, 2 lines of symmetry, the diagonals bisect each other, and the diagonals bisect the angles.
Squares
Rectangles
Parallelograms
AC F
3.
D
EB

115Theme 4: Mensuration and geometry – Plane shapes: Lines, triangles, quadrilaterals
Identify the properties of trapeziumsAsk the class to explore and name the scalene, right-angled, and isosceles trapeziums in the example. Ask them to describe the sides and angles of the trapeziums. Let them explain whether the shapes have lines of symmetry.
Assist the pupils in interpreting the properties of trapeziums. Explain to them that we say one trapezium and many trapeziums or trapezia.
The pupils work on their own to complete the workbook exercises either in class or as homework.
Exercise 6 (pb page 189)1. a) right-angled b) isosceles c) scalene d) right-angled e) isosceles
2. a) b)
c) d)
e)
3. a) A: South Africa: red; blue B: Antigua and Barbuda: black; blue C: Zimbabwe: green; yellow; redb) A: red: right-angled; blue: right-angled B: black: isosceles; blue: isosceles C: green: right-angled; yellow: right-angled;
red: right-angled
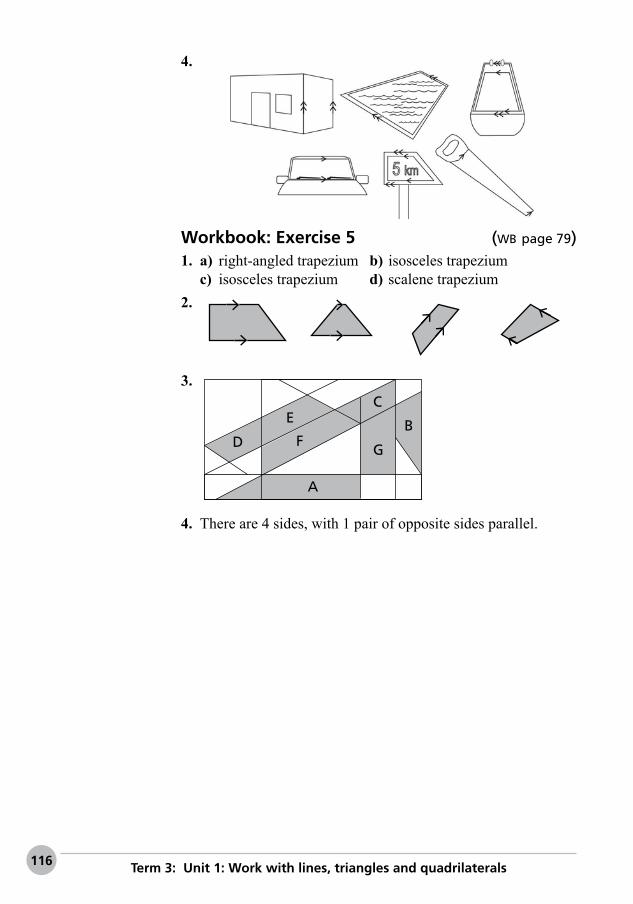
116 Term 3: Unit 1: Work with lines, triangles and quadrilaterals
4.
Workbook: Exercise 5 (wb page 79)1. a) right-angled trapezium b) isosceles trapezium c) isosceles trapezium d) scalene trapezium2.
3.
A
D
E
FG
B
C
4. There are 4 sides, with 1 pair of opposite sides parallel.

117Theme 4: Mensuration and geometry – Plane shapes: Square, rectangle, rhombus
4THEME Mensuration and geometry
Plane shapes: Square, rectangle, rhombus
Term 3
Unit 2: Define the properties of a square, rectangle and rhombus
Teaching guidelines and solutions
Instructional resourcesShapes; property checklists; shape charts; flow diagrams; multiple-choice cards
Compare the properties of a square, rectangle and rhombusExplain to the class many people, adults and pupils do not think of a square and rectangle as parallelograms. They also do not think of a square as a rhombus and call a rhombus a diamond. We say one rhombus and many rhombi.
Ask the pupils to explore and name the shapes in the example and describe the sides and angles using the symbols. Assist pupils in interpreting the properties of a rhombus. A rhombus is a quadrilateral (polygon) with all sides equal in length and opposite angles equal in size. The opposite sides of a rhombus are parallel. A square is a special rhombus with right angles. Ask the class to name the differences between a rhombus and a rectangle.
The pupils work on their own to complete the workbook exercises either in class or as homework.

118 Term 3: Unit 2: Define the properties of a square, rectangle and rhombus
Exercise 1 (pb page 191)1. The shape has: Square Rectangle Rhombus
a) four equal sides ✓ ✗ ✓
b) four equal angles ✓ ✓ ✗
c) opposite sides equal in length ✓ ✓ ✓
d) opposite angles equal in size ✓ ✓ ✓
e) opposite sides parallel ✓ ✓ ✓
f) a diagonal that cuts the shape in half ✓ ✓ ✓
2. Yes, because a square has all the properties that a shape must have in order to be considered a rhombus. A square is a special type of rhombus; it is a rhombus with right-angles.
3. No, because a rhombus has all sides equal in length. A rectangle does not have all sides equal in length.
4. A. B. C. D. E.
5. Yes, it is a parallelogram that has opposite sides equal in length.
6. a) Always true b) Always true c) Never true d) Always true e) Sometimes true f) Sometimes true
Workbook: Exercise 1 (wb page 80)1. Has 4 sides, 2 pairs of opposite sides parallel, 4 corners are
right angles, opposite sides are equal2. All 4 sides are equal in rhombus and 2 pairs of opposite sides
equal in rectangle; the diagonals of a rectangle do not bisect the angles
3. All 4 sides are equal, all 4 angles are equal to 90°, 2 pairs of parallel sides, both have 4 sides

119Theme 4: Mensuration and geometry – Plane shapes: Square, rectangle, rhombus
A
CD G
E
H
4.
Rhombi
B F
Squares
Rectangles
Parallelograms
Identify diagonals and symmetry lines of a square, rectangle and rhombusExplain to the class that a diagonal connects the opposite angles of a shape. The diagonals of a rhombus are also lines of symmetry. Let the pupils explore the diagonals or lines of symmetry in the shapes in the example and explain what they observe. Read through the example with the class and make sure they understand the difference between diagonals and lines of symmetry. Remind the pupils that 90° is the size of the angle and does not refer to temperature.
Ask the pupils to find the number of symmetry lines in the square, rectangle and rhombus.
The pupils work on their own to complete the workbook exercises either in class or as homework.
Exercise 2 (pb page 192)1. These properties
apply to the shape
Square Rectangle Rhombus
a) The diagonals intersect.
✓ ✓ ✓
b) The diagonals in-tersect each other at right angles.
✓ ✗ ✓
c) The diagonals bisect each other.
✓ ✓ ✓
d) The diagonals bisect the angles.
✓ ✗ ✓
e) The shape has 4 lines of symmetry.
✓ ✓ ✓
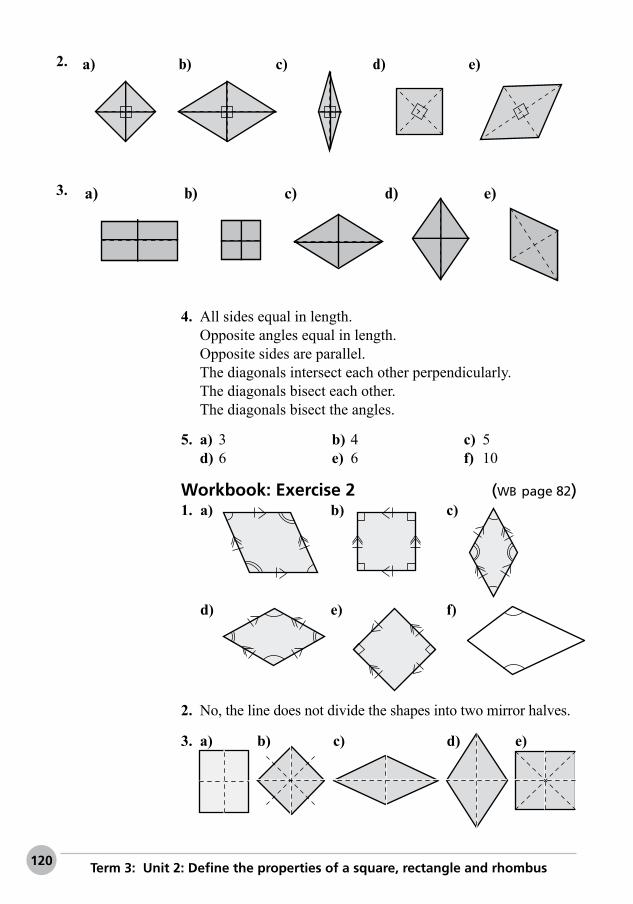
120 Term 3: Unit 2: Define the properties of a square, rectangle and rhombus
2. a) b) c) d) e)
3. a) b) c) d) e)
4. All sides equal in length.Opposite angles equal in length.Opposite sides are parallel.The diagonals intersect each other perpendicularly.The diagonals bisect each other.The diagonals bisect the angles.
5. a) 3 b) 4 c) 5 d) 6 e) 6 f) 10
Workbook: Exercise 2 (wb page 82)1. a) b) c)
d) e) f)
2. No, the line does not divide the shapes into two mirror halves.
3. a) b) c) d) e)

121Theme 4: Mensuration and geometry – Plane shapes: Square, rectangle, rhombus
Workbook: Exercise 3 (wb page 83)1. a) A B C D
E F
b) A: isosceles triangle; B: isosceles trapezium; C: square; D: parallelogram; E: right-angled triangle; F: isosceles triangle
2. a) square + square = rectangleb) trapezium + trapezium = parallelogramc) triangle + square = trapeziumd) rhombus + rhombus = parallelograme) square + square = rectanglef) triangle + triangle = square
3. a) 14 squares b) 13 triangles

122 Term 3: Unit 3: Define different angles
4THEME Mensuration and geometry
Plane shapes: Angles
Term 3
Unit 3: Define different angles
Teaching guidelines and solutions
Instructional resourcesPaper and card; scissors; pencils; protractors; number lines; rulers; colour pencils; multiple-choice cards; paper circles
Follow the example. Provide the class with paper circles. They fold the circles in half and in half again to get a quarter circle and identify the right angle in the L-shape. Ask the pupils to identify right angles in the objects in the classroom. Let them move around the class to check the angles with their paper right angles. Assist the class in understanding that a right angle is a quarter ( 1 _ 4 ) turn. The size of a right angle is 90°.
Types of angles and measurement of anglesRemind the class they have worked with angles in Primary 4. Ask them to explain what an angle is. Let them draw angles they know on the board and describe the angles. They should recall that an angle is the amount of turn or the space between two lines. An angle is formed where two lines or arms of the angle meet at a point (vertex). Acute angles are smaller than right angles. Right angles are smaller than obtuse angles.
Ask the pupils to explore the angles and their sizes on the number line in example 1. They explain what they observe about the numbers and find the missing numbers.
0° 45° 90° 180° 225°135° 270° 315° 360°
In example 2, let the class study the parts of angle ABC or ∠ABC. They explain the names of the parts and find the sizes

123Theme 4: Mensuration and geometry – Plane shapes: Angles
of ∠ABD and ∠BDC. Explain to the class that the bisector BD, cuts the angle in half, creating two angles of the same size. ∠ABD = 40° and ∠DBC = 40°. Two angles with the same or common arm are adjacent angles. Adjacent means next to or joined. We can use small or capital letters to name angles.
Explain to the class that we measure the size of angles and draw angles of a given size with a mathematical instrument, a protractor in degrees (°). Work through the example in the Pupil’s Book on how to draw and measure an angle.
The pupils work on their own to complete the workbook exercises either in class or as homework.
Exercise 1 (pb page 196)1. 45°2. Follow the steps to draw an angle.3. A: Right angle B: Acute C: Obtuse D: Obtuse E: Obtuse F: Acute G: Acute H: Obtuse I: Right angle J: Obtuse K: Obtuse L: Obtuse
4. a) C b) D c) E d) H e) G f) A g) B h) F
5. a = 79° b = 98° c = 83°
6. a) 37°
b) 56°
c) 72°
acute acute acuted)
90°e)
110°f)
49°
right angle obtuse acuteg)
68°h)
93°i)
105°
acute obtuse obtusej) 158°
obtuse

124 Term 3: Unit 3: Define different angles
Exercise 2 (pb page 198)1. a) 55° b) 27° c) 85° d) 118° e) 55° f) 85° g) 118° h) 27°
2. Pupils draw angles in their environment.
Workbook: Exercise 1 (wb page 84)1. Pupils’ own work
2. Pupils’ own work
3. a) A: 115°, B: 50°, C: 150°b) A: obtuse, B: acute, C: acute
4. a) 23° b) 125°
c) 94°
acute obtuse obtuse
5. a) DAB = 60°.
DAC = 30°.
BAC = 30°.
DCB = 60°. DCA = 30°.
BCA = 30°.
ADC = 120°. ADB = 60°.
CDB = 60°.
ABC = 120°. ABD = 60°.
CBD = 60°.
b) Interior opposite angles of a rhombus are equal. Diagonals of a rhombus bisect the interior angles.
c) The interior opposite angles of a rhombus are equal.d) The diagonals of a rhombus bisect the interior opposite
angles.e) ∠DEC = 90° ∠CEB = 90° ∠BEA = 90° ∠AED = 90°f) The diagonals of a rhombus intersect at right angles to
each other.g) Angles at E: 4 × 90° = 360°. The sum of the angles
around a point is equal to 360°.

125Theme 4: Mensuration and geometry – Plane shapes: Angles
Complementary and supplementary anglesTell the class they will apply knowledge of solving open sentences and equations that balance to find sizes of angles. Remind them they have learnt about adjacent angles and bisectors already. Let them explain what adjacent means and what bisectors do.
Ask the class to explore and discuss the angles in the drawings in the example. They identify the right angle ABC and the straight angle EFG. Ask them if BD and HF are bisectors of the angles. Find out if they use knowledge that the size of a right angle is 90° and a straight angle is 180°, to find the sizes of ∠a and ∠e.
Inform the class that lines BD and HF are not bisecting lines. Let the class explain why. They should realise the lines do not halve the angles and the sizes of the angles in ABC and EFG are not equal. These lines are intersecting lines. Assist the pupils in understanding that, when a bisecting or intersecting line divides a right angle in two, the two angles are complementary angles. When an intersecting or bisecting line divides a straight angle into two angles, the angles are supplementary angles. Let the class explore and explain the calculations showing how to find the unknown sizes of complementary and supplementary angles, i.e. subtracting from 90° and 180°.
Assist the class in understanding that, if they know how to calculate the sizes of complementary and supplementary angles, they can find the size of any angle around a point if they know the size of one angle.
The sum of complementary angles = 90°The sum of supplementary angles = 180°The sum of angles around a point is always 360°.
Ask the class to find the sizes of the angles indicated by letters to represent unknown sizes. Explain to them that there are no degrees stated. They have to solve equations to calculate the sizes of the angles in degrees. They start with the sum of supplementary angles and understand that x is the same as 1x so x + x = 2x. Show the class how to substitute the values into the equation to check solutions.

126 Term 3: Unit 3: Define different angles
The pupils work on their own to complete the workbook exercises either in class or as homework.
Exercise 3 (pb page 200)1. a) 56° b) 12° c) 43° d) 45°
2. Complementary angles
3. a) 57° b) 75° c) 36°
4. Supplementary angles
5. a) 119° b) 74° c) 158°
Exercise 4 (pb page 201)1. a) x = 24°; y = 156° b) x = 45°; y = 45° c) x = 17°; y = 163° d) x = 140°; y = 140°
2. a) x = 36°; 2x = 72°b) x = 45°; 2x = 90°c) x = 20°; 2x = 40°; 6x = 120°
3. a) w = 102°; y = 15°; x = 63°; z = 63°b) e = 54°; f = 126°; g = 54°c) h = 45°; i = 90°; j = 90°; k = 90°d) a = 30°; b = 120°; c = 30°; d = 30°
4. a) 180°b) 126° + 54° + 126° + 54° = 360°c) 45° + 45° + 90° + 90° + 90° = 360°d) 120° + 30° + 30° + 120° + 30° + 30° = 360°
Quantitative reasoning5. a) 75° b) 38° c) 41° d) 27° e) 9° f) 15°
6. a) 35° b) 79° c) 125° d) 96° e) 55° f) 167°
Workbook: Exercise 2 (wb page 87)1. a) 72° b) 24° c) 64°
2. a) 108° b) 51° c) 84°
3. a) 86° b) 65° c) 20°

127Theme 4: Mensuration and geometry – Plane shapes: Angles
4. a) 120°b) x = 35°; 2x = 70°; 3x = 105°c) x = 30°, 2x = 60°, 3x = 90°
5. 30° 25° 80° 45° 10° 38° 60°
Complementary angle
60° 65° 10° 45° 80° 52° 30°
Supplementary angle
150° 155° 100° 135° 170° 142° 120°
Transversal and parallel linesRemind the class they worked with parallel lines in Unit 1. They will apply this knowledge in working with angles formed by transversals and parallel lines in this activity. Ask the pupils to explain what they remember about parallel lines and to draw sets of parallel lines on the board. Let them label the lines.
Give the pupils copies of the angles in diagram A in the example. Let them cut out the two angles as in diagram B. Ask them to fit the angles on those in diagram C to observe which angles are the same size, angles around a point, supplementary and vertically opposite angles. They work on the board to list the equal angles.
Explain to the class that the line that intersects the parallel lines in Figure C is a transversal. A transversal can be drawn across two or more parallel lines resulting in many pairs and equal angles where the lines meet. They already know complementary, supplementary and vertically opposite angles. Assist them in understanding and recognising corresponding, and alternate angles in diagram C. They should memorise the facts about angles at the end of the example.
Exercise 5 (pb page 204)1. a) a + b; d + c; e + f; h + g; a + d; b + c; e + h; f + g
b) a + c; b + d; e + g; f + hc) a + e; b + f; d + h; c + gd) d + f; c + e
2. a) Supplementary angles are two angles on a straight line; they add up to 180°.

128 Term 3: Unit 3: Define different angles
b) Vertically opposite angles are angles on two intersecting straight lines; they are opposite each other.
c) Corresponding angles are in the same position as each other on transverse and parallel lines.
d) Alternate angles are on the opposite insides of the transversal and parallel lines.
3. a = 135°; b = 135°; c = 45°; d = 45°; e = 45°; f = 135°
4. a) x = 40° → alternate anglesb) p = 135° → corresponding anglesc) x + y = 104° → interior anglesd) m = 46° → supplementary angles n = 46° → vertically opposite o = 134° → vertically opposite p = 134° → corresponding angles q = 46° → supplementary angles r = 134° → vertically opposite s = 46° → alternate anglese) a = 104° → vertically opposite b = 76° → supplementary angles c = 104° → corresponding angles d = 104° → vertically opposite e = 68° → supplementary f = 68° → corresponding angles g = 114° → corresponding angles h = 66° → supplementary anglesf) x = 76° → alternate angles y = 49° → supplementary angles z = 55° → corresponding angles v = 76° → alternate angles w = 49° → corresponding angles

129Theme 4: Mensuration and geometry – Plane shapes: Circles
4THEME Mensuration and geometry
Plane shapes: Circles
Term 3
Unit 4: Identify parts of a circle
Teaching guidelines and solutions
Instructional resourcesObjects in pictures; paper or card; scissors; pencils; flow diagrams; rulers; pairs of compasses; squared grid paper; colouring pencils; multiple-choice cards; circular objects; paper circles; strings of wool or rope
Inform the class they will work with circles in this unit. They will discover and define parts of a circle, measure the radii and circumferences of circles, draw circles with different radii to find the circumferences and appreciate circular shapes and their properties in their environment.
Ask the class to name objects with circular shapes around them. Then let them explore the pictures in the example. Ask the pupils what they think a circle is. Explain that a circle is a plane, continuous curve with a centre point the same distance (equidistant) from any point on the curve.
Parts of a circle and relationship between diameter and radiusTell the class they will find out about the different parts of a circle by doing a practical exercise. Make sure that all pupils have the materials as listed and let them follow the instructions stated. They make folds and draw lines to discover the meaning of the circumference, diameter and radius of a circle. Explain to the class that we say one radius and many radiuses or radii, pronounced ‘raydee-eye’.
Exercise 1 (pb page 206)Pupils draw circles by following the steps.

130 Term 3: Unit 4: Identify parts of a circle
In procedure 1, pupils should discover that radius × 2 = diameter or d = 2r and diameter ÷ 2 = radius or d _ 2 = r. They label the circles with the terms.
Ask the class to use the second circle and follow the steps to discover the properties of a circle such as the chord, arc and the segment. They label the circle with the terms.
Let the pupils use the third circle and follow the steps in procedure 3 to discover the property of the sector of a circle. Let them paste the labelled circles in their exercise books. Ask them to define each part of a circle in their own words.
The pupils work on their own to complete the workbook exercises either in class or as homework.
Exercise 2 (pb page 208)1.
Radius
Sector
Arc
CircumferenceDiameter
Chord
Segment
2. a) d = 6 cm b) r = 7 cm c) d = 3 m d) r = 14 cm e) d = 14 m f) d = 24 m
Exercise 3 (pb page 208)1. a) 1 cm b) 2.5 cm c) 3.5 cm d) 4 cm e) 4.5 cm f) 6 cm
2. a) 1 cm b) 8 cm c) 6 cm d) 14 cm e) 5 cm f) 16.4 cm
3. a) Y ZXAX Y
XY = XZ ÷ 2
b) Y ZXAX Y
XZ = XY × 2
c)Y ZXAX Y
XZ } XY = XY

131Theme 4: Mensuration and geometry – Plane shapes: Circles
Workbook: Exercise 1 (wb page 88)1. a) circumference b) arc c) segment d) chord e) sector
2. The diameter is twice the radius or the radius is half the diameter.
3. a) 2.8 cm b) 4 cm c) 1.4 cm
4. a) 1.4 cm b) 1.3 cm c) 1.7 cm
5. a) 16 cm b) 24 cm c) 11 cm d) 3 cm e) 9 cm f) 3.5 cm g) 5 cm
Measure and draw circlesInform the class they will measure the distances from the centre or midpoints of circles, the distance around a circle to find the circumference, draw circles with different radii to find diameters and draw or create circle patterns.
In example 1, let the pupils work with partners to measure the distances from the midpoint to the points indicated on the circumferences of the given circles. Ask them for the names of the lines they drew and what they notice about the distances from the midpoint to points on the circumferences. Let them find the diameter of each circle. Work through the explanation in the example.
Tell the class that they should have noticed above how easy it is to measure the radii of circles using a ruler and then double (multiply by 2) the radius to get the length of the diameter. It is not so easy to measure the distance around a circle, i.e. the circumference of a circle. Let them explore the method to find the approximate circumference of a circle. They work on the board using a string or wool and a ruler and follow the steps. Ask the pupils why the length of the wool should be multiplied by 4. Tell the class they can also put a string of wool along the total length around the circle, which might be a bit more difficult to handle. They should find the circumference of a circle is about three times the diameter. The methods above do not give very accurate measurements of the circumference of a circle. In the next unit, they will learn how to calculate the circumference of a circle using a fixed number (pi, a Greek word) to ensure a more accurate measurement of the circumference.

132 Term 3: Unit 4: Identify parts of a circle
Ask the class which instrument they used to draw and measure angles in Unit 3. Inform the pupils that we use a pair of compasses to draw circles. Let the pupils use a pair of compasses and a sharp pencil and follow the steps to draw a circle as in the example. Explain to them that a pair of compasses has two legs; one with a sharp point (needle) and the other to hold a pencil. The needle marks the midpoint of the circle. The leg with the pencil rotates around the midpoint to draw the circumference of the circle. They can draw bigger or smaller circles by adjusting the legs of the pair of compasses. Ask them to draw circles of different sizes to practise using the pair of compasses.
The pupils work on their own to complete the workbook exercises either in class or as homework.
Exercise 4 (pb page 211)1. Pupils draw circles with the given radii.
2. a) 2 cm b) 3.6 cm c) 18 mm d) 40 mm e) 4.6 cm f) 80 mm
3. Pupils draw circles with the given diameters.
4. Pupils copy circles onto squared paper.
5–6. Pupils copy and then create their own circle patterns.
Workbook: Exercise 2 (wb page 90)1. a) b)
radius = 15 mm radius = 12 mm
2. a) b)
diameter = 3.8 cm diameter = 2.6 cm

133Theme 4: Mensuration and geometry – Plane shapes: Circles
3. a) 1.2 cm b) 2 cm c) 1 cm
4. a) d = 2.4 cm; C = x cmb) d = 4 cm; C = x cmc) d = 1 cm; C = x cm

134 Term 3: Unit 5: Find the perimeter and circumference
4THEME Mensuration and geometry
Primary measures: Length
Term 3
Unit 5: Find the perimeter and circumference
Teaching guidelines and solutions
Instructional resourcesShapes; floor plans; composite shapes; perimeter charts; property cards; multiple-choice cards; rulers; circle charts; flow diagrams; pair of compasses; graphs; pencils; squared grid paper; paper squares
Ask the class to explore the picture in the example and discuss what the children are measuring. They should observe children measuring the distance around a house and a hut in leg spans to find the number of leg spans it takes to cover the distances.
Write the words volume, area, perimeter and circumference on the board. Ask the class which words are used when you measure the distance around an object.
Find out whether pupils know the difference between perimeter and circumference. They should understand that the distance around a circle or circular object is its circumference (C). The distance around an object or shape in the form of a polygon is its perimeter (P).
Find the perimeter of regular and irregular shapesAsk the class to explore the real-life problem and the measurements of the objects in example 1. Ask them how they would find the length of ribbon and lace around the box and the card.

135Theme 4: Mensuration and geometry – Primary measures: Length
Let the pupils explore and discuss the methods displaying the calculations of perimeter of the objects to find the length of ribbon and lace around the box and the card. They should understand that, when they calculate the perimeter of squares and rectangles, they add the lengths of the four sides. Instead of doing addition, they can multiply, which is shorter than addition. They will, from now on use the formula 2 × (L + B) or 2(L + B) to calculate the perimeter of squares and rectangles, i.e. regular (constant) shapes.
Let the class explore the representations of animal camps on a farm. They find the lengths of the trenches around the camps the farmer wants to dig. They should realise the camps are irregular shapes. The sides in the triangle, trapezium, and the pentagon (a 5-sided shape) are not the same in length. To calculate the perimeter, they add the lengths of the sides.
Ask the class what the difference is between a regular and an irregular shape.
The pupils work on their own to complete the workbook exercises either in class or as homework.
Exercise 1 (pb page 214)1. a) 74 cm b) 214 cm c) 68 m d) 146 m e) 400 m f) 178 cm g) 240 cm
2. a) 24 cm b) 30 m
Quantitative reasoning3. 200 m
5. 108 cm
4. 480 m
Exercise 2 (pb page 215)1. a) 17 cm b) 76 m c) 472 dm d) 90 cm e) 132 m f) 38 m
2. a) 32 m b) 6 m c) 226 cm d) 540 mm e) 196 m f) 16 m

136 Term 3: Unit 5: Find the perimeter and circumference
Workbook: Exercise 1 (wb page 91)1. 80 cm 2. 40.5 cm 3. 58 cm4. 63 cm 5. 61 cm 6. 130 m
Workbook: Exercise 2 (wb page 92)1. 420 × 2 = 840 m
2. 134 + 134 + 75 + 75 = 418 cm
3. 23.5 + 23.5 + 15.5 + 15.5 = 78 cm
Workbook: Investigation (wb page 93)Perimeter is not always the same.
Perimeter: A: 16 cmB: 14 cmC: 11 cmD: 12 cmE: 10 cm
AB
C
D E
Identify properties and calculate circumferenceAsk the pupils to draw a circle on the board and use arrows to label the circle showing the diameter, radius and circumference. Tell the class the statements in example 1 about properties of a circle are false. Ask the class to give the correct statements.
The distance around a circle is the circumference.A line from edge to edge through the centre of a circle is the diameter.The arc of a circle joins two points on the circumference of a circle.The diameter divides a circle in two equal parts. The circumference of a circle is about three times its diameter.The diameter is double the radius. A line joining the midpoint and a point on the circumference is a radius.
Remind the pupils they have used strings of wool and lengths of diameters to find the circumferences of circles. Now they

137Theme 4: Mensuration and geometry – Primary measures: Length
will use a formula to calculate circumference. Ask the class to explore and discuss the graph in example 2 that is used to find the circumference of circles.
Ask the pupils to explore the circles in which the lengths of arcs in sectors are measured with strings of wool and recorded in the table. Draw the table on the board and ask the pupils to record their findings. Ask the pupils to multiply the lengths of the arcs by 4 to get the approximate circumferences, measure the diameter of each circle, and divide the circumference by the diameter for each circle. They explain their observations.
Pupils should observe they get the same number for each circle, i.e. 3.2 cm. Work through the explanation in the Pupil’s Book with the class.
Inform the class that pi is a funny number. No mathematician ever could find its exact value. We cannot write the number in full. The decimal places continue forever in no particular pattern. On a calculator, it shows 22 ÷ 7 = 3.1428571. We round off the number to two decimal places and use the value 3.14 or 22
__ 7 . Scientists and engineers use pi to calculate movement in
circular objects and the contents of cans (e.g. peas in a can). People would not be able to build cars, investigate the planets, etc. without pi.
Tell the class the number they have calculated in the table for circumference ÷ diameter is 3.2. This is not accurate but close to pi, i.e. 3.14.
Let the class explore and read the formulas on the board in the example on page 217. Encourage them to memorise the formulas. They will need this knowledge to calculate the circumference of a circle.
Ask the class to explore and explain the examples showing how to use the formulas to calculate circumference if the diameter and radius are given. Advise the pupils that, when the radius or diameter is a multiple of 7, they should use the fraction 22
__ 7
instead of 3.14 to calculate the circumference. Let them find out what happens when they enter 22 ÷ 7 on their calculators.
The pupils work on their own to complete the workbook exercises either in class or as homework.

138 Term 3: Unit 5: Find the perimeter and circumference
Exercise 3 (pb page 217)1. a) 43.98 cm b) 56.55 cm c) 87.96 cm d) 75.4 cm e) 131.95 cm
2. a) 43.98 cm b) 62.83 cm c) 21.99 m d) 15.71 m e) 18.85 m
Exercise 4 Quantitative reasoning (pb page 218)1. 219.91 cm
2. 9.42 m
3. Object Radius Diameter Circumference c _ d
a) Glass 35 mm 70 mm 219.91 mm 3.14
b) Coffee mug 40 mm 80 mm 251.33 mm 3.14
c) Saucer 7 cm 14 cm 43.98 cm 3.14
d) Side plate 9.5 cm 19 cm 59.69 cm 3.14
e) Dinner plate
125 mm 250 mm 785.4 mm 3.14
4.15
4.782.39
25.13
184 168
a) b) c) 50.27
5. r = 5.5 cm
6. Perimeter = 7a
Workbook: Exercise 3 (wb page 93)1. a) diameter b) radius c) π d) diameter e) 2 × r × π f) d × π
2. a) 2 × π × 4 = 25.13 cm b) 21 × π × 2 = 131.9 cm c) 2 × π × 7 = 43.98 cm d) 2 × π × 42 = 263.89 cm
3. π × 21 m = 65.97 m

139Theme 4: Mensuration and geometry – Primary measures: Length
4. 2 × π × 14 m = 87.96 m
5. a) π × 14 = 43.98 cmb) 2 × π × 16 = 100.53 cm
6. DC = 6 cm
7. Diameter of big circle = 10 cm

140 Term 3: Unit 6: Find the area of a right-angled triangle
4THEME Mensuration and geometry
Secondary measures: Area
Term 3
Unit 6: Find the area of a right-angled triangle
Teaching guidelines and solutions
Instructional resourcesPaper; scissors; rulers; pencils/pens; triangles; formula cards
Ask the pupils to explore the right-angled triangles in the example and explain what a right-angled triangle is. Let them explore the Penrose triangle. If they look carefully, they will notice it appears as if the angles of the triangle are all right angles. Have a class discussion to assist pupils in understanding this is mathematically impossible. Show drawings of equilateral, isosceles, scalene and right-angled triangles on the board so pupils can see we do not get a triangle with all angles as right angles. The sum of the interior angles in a triangle is 180°. So, a triangle with angles 90° + 90° + 90° is impossible because the sum of the angles is 270°.
Develop a formula to calculate the areaInform the class they will use a rectangle to create a square and right-angled triangles by folding paper. They will discover the formula for calculating the area of right-angled triangles.
Make sure that all the pupils have the materials needed. Let them follow the instructions to create two right-angled triangles from a rectangle. Ask the class to name the triangles, the fraction that each triangle is of the square and find the area of one triangle if the area of the square is 441 cm2. They should realise they have to halve the area of the square.
Let pupils label the angle, the height and the breadth (base) of one of the triangles created as in the drawing. Ask them what they think the formula for calculating the area of the triangle is.
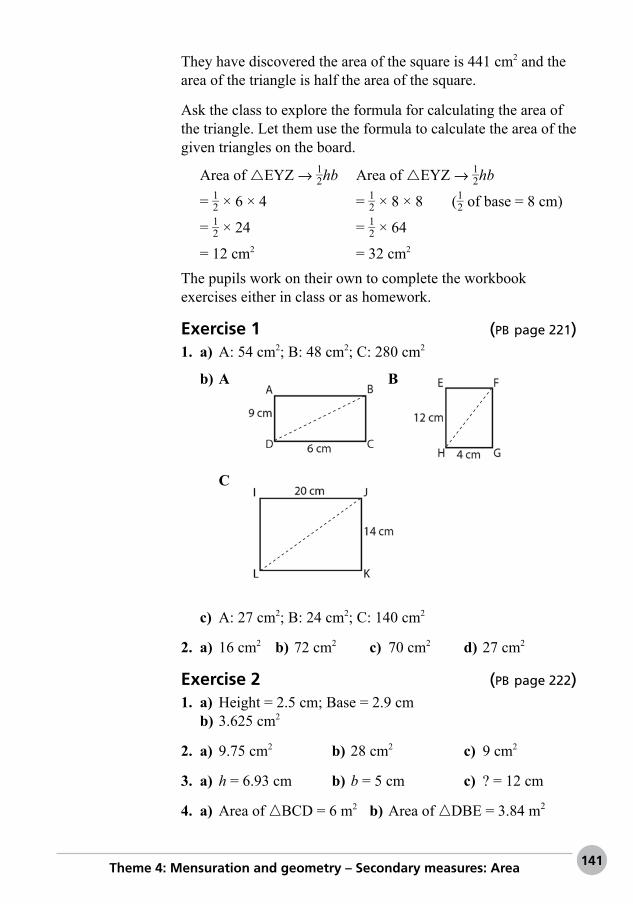
141Theme 4: Mensuration and geometry – Secondary measures: Area
They have discovered the area of the square is 441 cm2 and the area of the triangle is half the area of the square.
Ask the class to explore the formula for calculating the area of the triangle. Let them use the formula to calculate the area of the given triangles on the board.
Area of rEYZ → 1 _ 2 hb
= 1 _ 2 × 6 × 4
= 1 _ 2 × 24
= 12 cm2
Area of rEYZ → 1 _ 2 hb
= 1 _ 2 × 8 × 8 ( 1 _ 2 of base = 8 cm)
= 1 _ 2 × 64
= 32 cm2
The pupils work on their own to complete the workbook exercises either in class or as homework.
Exercise 1 (pb page 221)1. a) A: 54 cm2; B: 48 cm2; C: 280 cm2
b) A B
C
c) A: 27 cm2; B: 24 cm2; C: 140 cm2
2. a) 16 cm2 b) 72 cm2 c) 70 cm2 d) 27 cm2
Exercise 2 (pb page 222)1. a) Height = 2.5 cm; Base = 2.9 cm
b) 3.625 cm2
2. a) 9.75 cm2 b) 28 cm2 c) 9 cm2
3. a) h = 6.93 cm b) b = 5 cm c) ? = 12 cm
4. a) Area of △BCD = 6 m2 b) Area of △DBE = 3.84 m2

142 Term 3: Unit 6: Find the area of a right-angled triangle
Workbook: Exercise 1 (wb page 95)1. base × height × 0.5
2. area = base × height × 0.5
3. a) 4 × 5 × 0.5 = 10 cm2 b) 8 × 3 × 0.5 = 12 cm2
4. a) 6 cm2 b) 21 cm2
c) 6 cm2 + 21 cm2 = 27 cm2
5. A: 4 × 3 × 0.5 = 6 cm2
B: 2 × 3 × 0.5 = 3 cm2
6. A B C D
Base of triangle 1.5 m 5 cm 4 m 6 cm
Height of triangle 6 m 6 cm 3 m 4 cm
Area of triangle 4.5 m2 15 cm2 6 m2 12 cm2
7. 3 × 4 × 0.5 = 60 cm2
8. 12 × 8 × 0.5 = 48 m2

143Theme 4: Mensuration and geometry – 3-D shapes (objects): Nets
4THEME Mensuration and geometry
3-D shapes (objects): Nets
Term 3
Unit 7: Make 3-D shapes (objects) using nets
Teaching guidelines and solutions
Instructional resourcesPhysical objects; tables/charts; nets; scissors; rulers; pencils/pens; glue; stiff card; colouring pencils; models of 3-D objects; triangular dotty paper; squared dotty paper
Ask the class where they observe 2-D shapes and 3-D objects around them and in their environment. Find out if they can explain the difference between 2-D shapes and 3-D shapes or objects.
Identify the properties of 3-D shapes (objects)Ask the class to explore the pictures in the example showing geometrical drawings of some of the real-life objects in the picture. In picture A they can see a cube, in pictures B and C cuboids or prisms, and in picture D a pyramid. Let the pupils name and describe each 3-D object. Let the class explore the properties (qualities) of the 3-D shapes. Explain that 3-D shapes have faces, edges and vertices (one vertex). The face that the shape rests on is the base. Ask them to identify the number of faces, vertices and edges in the cube, cuboid, triangular-based prism and the square-based pyramid.
The pupils work on their own to complete the workbook exercises either in class or as homework.

144 Term 3: Unit 7: Make 3-D shapes (objects) using nets
Exercise 1 (pb page 224)1. 3-D object No . of faces No . of vertices No . of edges
a) Square-based pyramid 5 5 8
b) Triangular-based prism 5 6 9
c) Cube 6 8 12
d) Cuboid 6 8 12
2. 3-D object No . of faces
No . of square faces
No . of rectangular
faces
No . of triangular
faces
Shape in base
a) Cube 6 6 0 0 square
b) Cuboid 6 2 4 0 square
c) Triangular-based prism
5 0 3 2 triangle
d) Square-based pyramid
5 1 0 4 square
Workbook: Exercise 1 (wb page 97)1. a) i) cube; cuboid ii) volume iii) number of sides; vertices b) i) square-based pyramid; triangular-based prism ii) number of vertices iii) both have 5 sides c) i) cube; triangular-based prism ii) number of sides iii) both are 3-D shapes
2. a) A, D, E, I b) B, C, F, G, H
3. a) faces: 6; vertices: 8; edges: 12b) faces: 5; vertices: 5; edges: 8c) faces: 4; vertices: 4; edges: 6

145Theme 4: Mensuration and geometry – 3-D shapes (objects): Nets
Workbook: Exercise 2 (wb page 99)1. prisms: A, C, F, G, H; not prisms: B, D, E, I, J
2. a) b) c)
Draw the nets of cubes and pyramidsTell the class that we buy products in boxes of different shapes and sizes. Ask them to name products they buy in boxes.
Let the pupils name the cube in example 1 and say how many faces, edges and vertices they see in the box. They should know the box has the shape of a cube. Work through the steps in example 1 and make sure the pupils understand about the faces and vertices they cannot see.
Ask the class to explore the boxes of real-life products in example 2. Assist the pupils in understanding that boxes do not come ready-made in their shapes. A box is made from a flat pattern called a net, which is cut out, folded and glued together to form a box. Let the pupils explore the nets of the boxes of the products. Ask them to find out which nets were used to create the boxes and to describe the shapes in the nets.
Toothpaste → net for a cuboid → rectangular facesGlasses → net for a cube → square facesDice → net for a cube → square faces Chocolates → net for a square-based pyramid → square and triangular faces
The pupils work on their own to complete the workbook exercises either in class or as homework.

146 Term 3: Unit 7: Make 3-D shapes (objects) using nets
Exercise 2 (pb page 226)1. A and C
2. C
3. a) Cuboid b) Cube c) Triangular-based prism d) Square-based pyramid
4. A and C.
Quantitative reasoning5. a) i) cube ii) cuboid iii) triangular-based prism iv) square-based pyramid
b) hexagon; circle
c) i) goes with D because all the shapes in the net are square so it forms a cube.
ii) goes with C because there are only squares and rectangles so it forms a cuboid.
iii) goes with A because there are triangles and rectangles so it forms a triangular-based prism.
iv) goes with B because there are triangles and a square so it forms a square-based pyramid.
6. a) 1
2 3 4 5
6
b) 5
1 2 3 4
6
c) 6
4 2 3 5
1
Exercise 3 (pb page 229)Pupils follow the steps to create nets for a cube and square-based pyramid.
Workbook: Exercise 3 (wb page 100)1. a) green b) orange c) white d) yellow e) blue f) yellow
2. a) A: blue; B: green, C: redb) D: blue; E: red, F: green
3. Pupils’ own work

147Theme 4: Mensuration and geometry – Secondary measures: Volume, structure of Earth
4THEME Mensuration and geometry
Secondary measures: Volume, structure of Earth
Term 3
Unit 8: Calculate volume; define the structure of Earth
Teaching guidelines and solutions
Instructional resourcesMeasuring jugs; cubes; nets; flow diagrams; globe; balls; oranges; paper; boxes
Remind the class they learnt about volume and capacity of liquids in Term 2 and in Primary 4. Let them explore the measuring jug in the example. Ask them what the capacity and volume of the container are. Find out if the pupils can recall the difference between volume and capacity and the unit used to measure volume and capacity.
Inform the class they will work with the volume of solid shapes in which volume is the amount of space a solid occupies or the exact amount of material in the object. Let the pupils consider the soccer ball. We do not measure volume of the objects using water or liquids. We measure the amount of matter or space within objects such as the space in the ball.
Assist the pupils in understanding that the volume of solids is measured by the number of cubic units needed to fill its space, i.e. cubic millimetres (mm3), cubic centimetres (cm3) and cubic metres (m3). Let the pupils explore the measurements of the cubes and find the volume of each cube.
Use cubes and cuboids to measure volumeLet the pupils explore the containers in the example. They should observe that containers A and B are filled with stacks

148 Term 3: Unit 8: Calculate volume; define the structure of Earth
of 1 cm3 cubes, and stacks of boxes with volumes of 1 m3 each are loaded on forklifts C and D. Pupils should notice the stacks are cubes and cuboids and that cubes have the same number of cubes in the length, breadth and height. Ask the class to find the volume of each cube stack.
Let the pupils explore the layers in the cube stacks to find out the length, breadth and height of cubes are equal. The opposite lengths, breadths and heights of cuboids are equal. To count the number of cubic units in a stack, count the number of cubes in one layer and multiply by the number of layers.
Ask the pupils to explore the formula for finding the volume of a cube and cuboid.
Volume of C → 3 m3 × 3 m3 × 3 m3 = 27 m3
Volume of D → 5 m3 × 3 m3 × 4 m3 = 60 m3
Let the class explore the measurements in the nets of a cube and cuboid and show how they use the formula to calculate the volume of the cubes on the board.
The pupils work on their own to complete the workbook exercises either in class or as homework.
Exercise 1 (pb page 232)1. a) 45 cm3 b) 24 cm3 c) 125 cm3 d) 7 cm3
2. a) 27 cm3 b) 36 cm3 c) 125 cm3 d) 112 cm3
3. a) 60 cm3 b) 288 cm3 c) 216 cm3 d) 360 cm3
e) 343 cm3 f) 70 cm3 g) 192 cm3 h) 180 cm3
Quantitative reasoning4. a) 24 cm3 b) 144 cm3
c)
5.
4 4
4
64
2 8
3
48
2 2
2
8
1 1
1
1
a) b) c) d)

149Theme 4: Mensuration and geometry – Secondary measures: Volume, structure of Earth
Workbook: Exercise 1 (wb page 101)1. a) 8 × 3 × 3 × 4 = 288 cm3
b) 8 × 2 × 2 × 4 = 128 cm3
c) 8 × 2 × 4 × 4 = 256 cm3
2. a) 13 × 1 = 13 cm3 b) 9 × 1 = 9 cm3
c) 10 × 1 = 10 cm3 d) 13 × 1 = 13 cm3
3. a) 480 cm3 b) 945 cm3
c) 6 000 cm3 d) 729 cm3
4. 648 cm3
5. 300 cm3
6. a) 3 cubes b) 9 cubes c) 39 cubes
7. a–c) Pupils’ own work d) 1 000 cm3
e) 1 000 cubes f) Pupils’ own work
Calculate the area of a circleThe base of a cylinder is a circle. Pupils should know the formula for the area of a circle as it forms part of the calculation of the volume of a cylinder. Ensure that pupils know how to use this formula.
Calculate the volume of cylindersInform the class that they will work with cylinders and use a formula to calculate the volume of cylinders. Find out if they can describe a cylinder and give examples of cylindrical or tube-shaped objects (cylinders) in their environment.
Let the class explore the geometrical drawings of a cylinder and its net in the example. Assist the class in understanding all the features of a cylinder that are listed in the Pupil’s Book.
Ask the pupils why they think a cylinder is a prism. Pupils should understand that a cylinder is considered a prism because the base and the top face are parallel.
Remind the class they have worked with the properties of a circle in Unit 5. Ask them to recall the formula for calculating the circumference of a circle. Ask them to explain the meaning of pi, where it is used and the value of pi.

150 Term 3: Unit 8: Calculate volume; define the structure of Earth
Demonstrate to the class how you roll up a rectangular sheet of paper to make a cylinder or a tube. The area of the curved face of the cylinder is the area of the rectangular sheet of paper.
Let the pupils explore and discuss the formula for calculating the volume of a cylinder on the board. Ask them to work on the board to calculate the area of given cylinders and the volume using the formulas.
The pupils work on their own to complete the workbook exercises either in class or as homework.
Exercise 2 (pb page 235)1. a) Area = 50.27 cm2; Volume = 904.78 cm3
b) Area = 12.57 cm2; Volume = 289.03 cm3
c) Area = 28.27 mm2; Volume = 282.74 mm3
d) Area = 113.1 cm2; Volume = 1 470.27 cm3
e) Area = 706.86 cm2; Volume = 5 654.87 cm3
f) Area = 113.1 cm2; Volume = 904.78 cm3
2. a) 98 cm3 b) 294 cm3
3. a) 7.85 m3 b) 35.34 m3
Workbook: Exercise 2 (wb page 103)1. a) 7 128 cm3 b) 804.57 cm3 c) 353.57 cm3
2. a) 549.5 cm3 b) 904.32 cm3
The structure of EarthInform the class that, centuries ago, people thought Earth was flat and if they travelled too far by ship they would fall off the surface of the Earth. Ask the class if they think this could happen. Find out if they know the shape of Earth, and which objects have the same shape as Earth.
Share the social knowledge with the class that Eratosthenes, a Greek mathematician who lived in Egypt around 1250bc, proved that Earth is round and even measured the size of Earth when most people thought Earth was flat.
The Earth is a spherical, perfectly round 3-D shape. Read through the properties and characteristics of Earth in the Pupil’s Book.

151Theme 4: Mensuration and geometry – Secondary measures: Volume, structure of Earth
Ask the class in which hemisphere Nigeria is located. Let the pupils explore the diagram of Earth in the example and help the pupils to understand that circles of longitude join the North and South Poles. Explain the meridian lines and how these are linked to time. Pupils should understand Earth spins like a top around its axis causing day and night and seasons of the year. Places on the same latitude circles are an even distance from the equator. The shortest path between two points on a flat surface is a straight line. Earth is not flat. There are no straight paths. The shortest path between two points on Earth is the one with the least curve.
Exercise 3 (pb page 237)1. a) Different: A sphere is 3-D and a circle is 2-D; a circle has
no volume but a sphere does. Same: They are both based on the same shape (a circle),
any cross section through a sphere will give you a circle.b) Different: A sphere has no squares or rectangles and a
cuboid does. Same: They are both 3-D objects and they both have
volume.c) Different: A cylinder has edges and a sphere has no edges. Same: They are both 3-D shapes based on a circle.
2. You can sail all the way around and end up where you started.
3. equator
4. two half spheres
5. A semi-circle is 2-D and a half sphere is 3-D.
Find the volume of a sphereInform the class that Archimedes, the cleverest of all Greek mathematicians, discovered the formula for calculating the volume of a sphere. He found the formula by studying wooden models of spheres. He honoured his discovery by asking that a sphere and a cylinder be engraved on his tombstone. Archimedes is also known for jumping out of his bath and running naked down the street shouting “Eureka!” after he made another brilliant science discovery.

152 Term 3: Unit 8: Calculate volume; define the structure of Earth
Explain to the class that the equator is the imaginary diameter of Earth. The line from the centre of the equator to any point on the surface is the imaginary radius of the sphere.
Ask the pupils to explore and discuss the formula for finding the volume of a sphere on the parchment in the Pupil’s Book. Let them explore the method to find the volume of Earth (sphere). Ask them to use the formula to calculate the volume of the sphere on the board.
The pupils work on their own to complete the workbook exercises either in class or as homework.
Exercise 4 (pb page 238)1. a) 654.17 cm2 b) 2 616.7 mm2 c) 1 674.7 mm2
d) 67 cm2 e) 2.36 cm2
2. a) i) 603.19 mm3 ii) 11 309.73 mm3
b) i) 4.19 cm3 ii) 8 cm3
c) i) 707.91 cm3 ii) 7 800 cm3
d) i) 3.39 cm3 ii) 5.4 cm3
Exercise 5 (pb page 238)1. Yellow bead: 0.26 cm3
Green bead: 1.51 cm3
Red bead: 37.7 cm3
2. a) blue candle: 268.08 cm3
b) orange candle: 73.89 cm3
c) pink candle: 603.19 cm3
d) green candle: 370.12 cm3
Workbook: Exercise 3 (wb page 104)1. spherical 2. ball3. face; edges, vertices 4. latitudes; longitudes5. Greenwich meridian 6. equator; southern hemisphere7. equator 8. axis
Workbook: Exercise 4 (wb page 105)1. a) 523 cm3 b) 65.4 cm3 c) 7 238 cm3 d) 0.27 cm3
2. a) 137 cm3 b) 3 052 m3 c) 1 675 mm3
d) 268 cm3 e) 697 cm3 f) 3 054 cm3

153Theme 5: Everyday statistics – Data collection and presentation: Tallies and graphs
5THEME Everyday statistics
Data collection and presentation: Tallies and graphs
Term 3
Unit 9: Represent data in tallies and graphs
Teaching guidelines and solutions
Instructional resourcesData/facts cards; frequency/tally tables; pictograms; number lines; meteorological data; pie charts; population charts; game board and cards
Explain to the class that statistics (data or information) is a section of mathematics dealing with the collection, organisation, classification, presentation, analysis, interpretation and reporting of data in a systematic (orderly) and logical way. Read through the introduction in the Pupil’s Book and make sure pupils understand the concepts.
Ask the pupils what type of data or information they think people normally collect, present, interpret and report. Explain that weather stations collect data about daily temperatures, wind speeds, rainy and sunny days in a week, month or year, etc. Hospitals collect data about mass, length and times of birth of newborn babies, for example. Schools collect data about pupils’ birthdates, ages, child illnesses, home addresses, etc.
Use tallies and data in tables (tabular form)Inform the class that data collection normally starts with a question. Explain the example to them where a Primary 5 class collected data to find out what the favourite colour of each pupil was. Let them look at the colour options and how the teacher allows for colours other than the options provided. Ask the class what they think the quickest way is to collect the data.
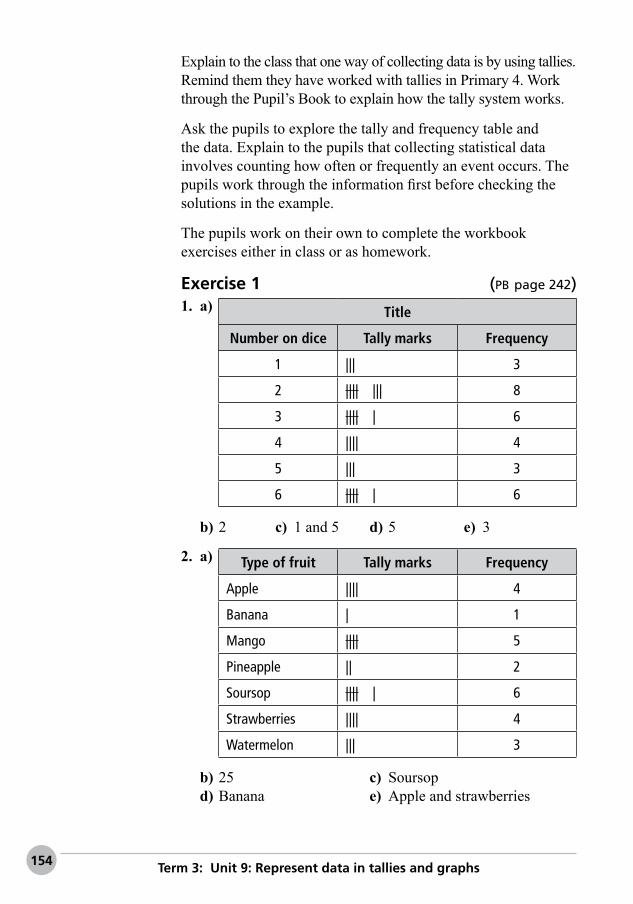
154 Term 3: Unit 9: Represent data in tallies and graphs
Explain to the class that one way of collecting data is by using tallies. Remind them they have worked with tallies in Primary 4. Work through the Pupil’s Book to explain how the tally system works.
Ask the pupils to explore the tally and frequency table and the data. Explain to the pupils that collecting statistical data involves counting how often or frequently an event occurs. The pupils work through the information first before checking the solutions in the example.
The pupils work on their own to complete the workbook exercises either in class or as homework.
Exercise 1 (pb page 242)1. a) Title
Number on dice Tally marks Frequency
1 ||| 3
2 |||| ||| 8
3 |||| | 6
4 |||| 4
5 ||| 3
6 |||| | 6
b) 2 c) 1 and 5 d) 5 e) 3
2. a) Type of fruit Tally marks Frequency
Apple |||| 4
Banana | 1
Mango |||| 5
Pineapple || 2
Soursop |||| | 6
Strawberries |||| 4
Watermelon ||| 3
b) 25 c) Soursop d) Banana e) Apple and strawberries

155Theme 5: Everyday statistics – Data collection and presentation: Tallies and graphs
Workbook: Exercise 1 (wb page 106)1. a) February and March → 33 °C b) September → 28 °C c) 5 °C d) close to equator – hot all year round
2. a) 30
b) Mark Tally Frequency
12–15 |||| |||| 10
16–19 |||| |||| 9
20–23 |||| | 6
24–25 |||| 5
c) 25 d) 12 e) 13 f) 11 g) 63%
Present data in pictogramsInform the class that presenting and recording data in frequency tables make it easy to interpret the data. Read through the information in the Pupil’s Book with the class.
Let the pupils explore the data representing the outcomes of a survey about pupils’ favourite beverages in example 1. They explore the data in the frequency table and the pictogram. Pose the questions to find out if pupils interpret data correctly.
Inform the class that the numbers in the frequency table and pictogram in example 2 are all even numbers. The picture representing the items in the pictogram could be a problem, if there was an odd number of pupils in the class. Ask the pupils to explore the data presented in the pictogram representing the number of pupils who like rap music. Explain how to use part of a symbol to represent half or quarter of an amount.
The pupils work on their own to complete the workbook exercises either in class or as homework.
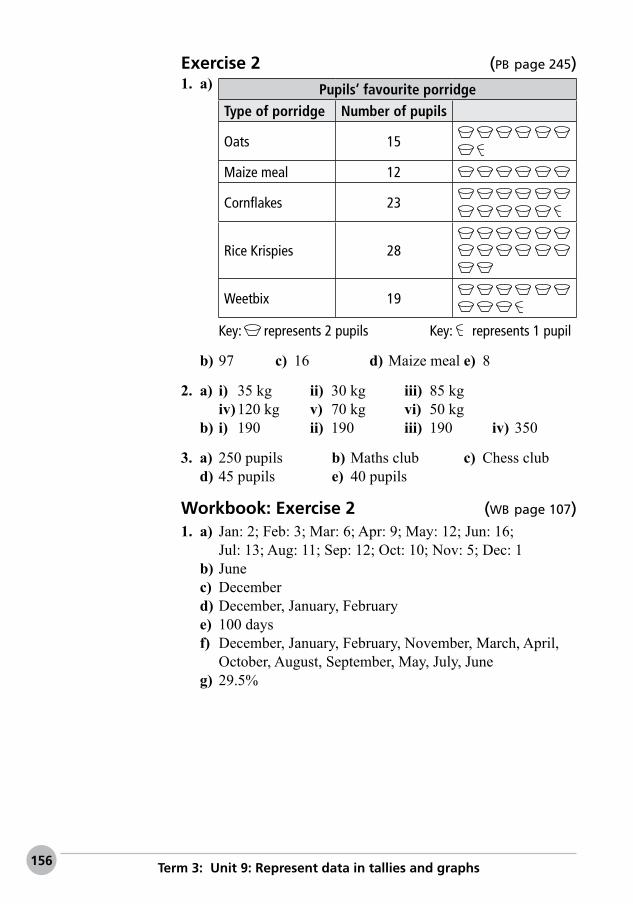
156 Term 3: Unit 9: Represent data in tallies and graphs
Exercise 2 (pb page 245)1. a) Pupils’ favourite porridge
Type of porridge Number of pupils
Oats 15
Maize meal 12
Cornflakes 23
Rice Krispies 28
Weetbix 19
Key: represents 2 pupils Key: represents 1 pupil
b) 97 c) 16 d) Maize meal e) 8
2. a) i) 35 kg ii) 30 kg iii) 85 kg iv) 120 kg v) 70 kg vi) 50 kg b) i) 190 ii) 190 iii) 190 iv) 350
3. a) 250 pupils b) Maths club c) Chess club d) 45 pupils e) 40 pupils
Workbook: Exercise 2 (wb page 107)1. a) Jan: 2; Feb: 3; Mar: 6; Apr: 9; May: 12; Jun: 16;
Jul: 13; Aug: 11; Sep: 12; Oct: 10; Nov: 5; Dec: 1b) Junec) Decemberd) December, January, Februarye) 100 daysf) December, January, February, November, March, April, October, August, September, May, July, Juneg) 29.5%

157Theme 5: Everyday statistics – Data collection and presentation: Tallies and graphs
2. a)
R R R R R R R R R R R RR R R R R R R R R R RR R R R R R R R R
Jan Feb Mar Apr May Jun Jul Aug Sep Oct Nov Dec
KEY: R 10 degrees Celsius
1 degree Celsius
b) February and Marchc) February, March, January, April, November, October,
December, May, September, June, August, July
3. a) 2013b) 2012c) 2 + 12 + 8 = 22 puppiesd) 2013-2014
Present data in bar graphsTell the class they have interpreted, analysed and presented data in tally and frequency tables and in pictograms. They will now interpret and present data collected in another form called a bar graph. Read through the explanation of bar graphs in the Pupil’s Book.
Ask the pupils to explore the bar graph in the example. Pose the questions to assist pupils in understanding the different parts of the graph and the data presented. Ask the class what the differences are between a bar graph and a pictogram.

158 Term 3: Unit 9: Represent data in tallies and graphs
Ask the class to name the intervals on the scale on the y-axis. Pupils should realise that, in the bar graph, the number of items or frequencies on the y-axis are displayed in intervals of 10. An interval is the set of numbers between a starting number and the next number. You work with different intervals on scales when you measure capacity, length, weight, temperature and time, for example.
The pupils work on their own to complete the workbook exercises either in class or as homework.
Exercise 3 (pb page 248)1. a) Niger Delta b) Niger Benue c) 700 mm d) 2 500 mm e) 27.5% f) 5 : 8
Quantitative reasoning2. Pupils do their own research and present their findings in the
form of a report.
Workbook: Exercise 3 (wb page 110)1. a)
0 5 10
Warri Town
Abuja
Jos Plateau
Lagos
15 20
Temperature (degrees Celsius)
Average minimum temperatures forfour different places in Nigeria
25 30
b) i) Lagos ii) Warri Town c) 12

159Theme 5: Everyday statistics – Data collection and presentation: Tallies and graphs
2. a)
0 cocoabeans
�sh
100 000
200 000
300 000
400 000
500 000
600 000
700 000
800 000
groundnut cotton
Tonn
es (t
)
rubber
b) fishingc) groundnutd) 450 000 te) 700 000 t
Present data in pie charts (pie graphs)Remind the class they have worked with four processes (steps) in a data cycle, i.e. tally tables, frequency tables, pictograms and bar graphs. They will now engage in another form of graph called a pie chart or pie graph. In a pie chart, each frequency or category (group) is represented by a sector of a circle so that the angle or size of the sector is in the correct proportion (ratio) to the frequency.
Ask the class to explore the pie chart in example 1 to find out which data is presented in the graph and observe the number or fraction of girls who like different flavoured ice cream. Then let the class explore the pie chart in example 2 and interpret and analyse the data to answer the questions about pupils in school clubs.
The pupils work on their own to complete the workbook exercises either in class or as homework.
Exercise 4 (pb page 250)1. a) Categories of household spending
b) Housingc) Entertainmentd) 30%
e) Housing 1 _ 4 Clothes 3 __ 25 Food 1 _ 5
Transport 9 __ 50 Savings 3 __ 20 Entertainment 1 __ 10

160 Term 3: Unit 9: Represent data in tallies and graphs
2. a) Area of continents on Earthb) Asiac) Europed) 20%
3.
75% 25%
50%
0%Land
71%
29%
Water
4. a) Sleeping 33.33% Working 41.67% Eating 8.33% Watching TV 16.67%
b–d)
Eating
WatchingTV
Sleeping
Boju’s dailyroutine
Work42%
8%
17%33%
e) Eating f) Working
Workbook: Exercise 4 (wb page 112)1. a) football b) rugby c) 1 _ 4 d) 25% e) 34
2. a)housing
education
social services
public services
leisure
other

161Theme 5: Everyday statistics – Data collection and presentation: Tallies and graphs
b) Budget for a local municipality for 2016/2017c) educationd) 8%e) Areas not included in housing, education, social services,
public services and leisure, such as maintenance
3. a) 1.65 g b) 11.4 g c) 1.05 g d) 2.45 g e) 3.85 g f) 26.6 g

162 Term 3: Unit 10: Find measures of central tendency
5THEME Everyday statistics
Data collection and presentation: Measures of central tendency
Term 3
Unit 10: Find measures of central tendency
Teaching guidelines and solutions
Instructional resourcesPlant seeds; numerical data charts; frequency/tally tables; number lines; flow diagrams; weight charts
Remind the class that they have worked with frequency tables in which it is easy to answer questions about a set of data. The graphs they worked with allowed them to notice overall trends (tendencies or performances) even more obviously. Read through the introduction in the Pupil’s Book and explain the new concepts to the class.
Find the mode of a data setLet the pupils explore the real-life problem in example 1 about Awele collecting different seeds to plant her own garden. Pose the questions to find out if they recognise the number of seeds that Awele collected most or the number of seeds that appear more than once in the frequency table. Inform the class that the number 12 appears more than the other numbers in the frequency table. The number 12 is the mode of the data set.
Let the pupils explore the data in the pictogram to find the number of seeds that appear the most. In this data presentation, 20 is the mode.
Ask the pupils to find the mode in the data set presented in example 2. They should observe there are two modes in the set of numbers, i.e. 5 and 6 – we say here the mode is bimodal. Assist the class in understanding that using the mode as a central measure, means you do not consider other scores (numbers or

163Theme 5: Everyday statistics – Data collection and presentation
objects) in the data set. Sometimes the mode can be equal to the highest or the lowest scores in a data set. Inform the class that the mode as a central measure of tendency or average is not unique and not very reliable. In this unit, they will define and use the mode as the number that appears the most in numerical data sets.
Let the class explore Rotimi’s mathematics test marks out of 50 during the year, find the number of tests written during the year and find the mode of the data set.
Tell the class it is easy to find the mode of a large data set, when you draw a frequency table. They order the numbers from the lowest to the highest and count the number of times a number appears. Let them find the number that occurs more frequently, the mode and the most common age, which is the mode.
The pupils work on their own to complete the workbook exercises either in class or as homework.
Exercise 1 (pb page 254)1. a) 10 b) 12 c) 15 and 20
2. 26, 26, 26, 26, 26, 25, 25, 25, 24, 22, 21, 21, 21, 20, 20, 19, 19, 19, 18, 18
Mode: 26
3. a) 47 cm and 48 cm b) 101 g c) 0 d) 17 km e) 26 °C and 28 °C f) 1 kg
Exercise 2 (pb page 255)1. a) Title
Vehicle Tallies Frequency
Bicycle |||| |||| 9
Motorbike |||| || 7
Car |||| |||| |||| | 16
Truck |||| || 7
Van |||| ||| 8
Bus | 1
Everyday statisticsData collection and presentation

164 Term 3: Unit 10: Find measures of central tendency
b) Different types of vehicles using the main road past the school
c) 16d) Cars are the most common vehicle using the road.
Bicycles, motorbikes, trucks and vans are roughly the same and roughly half the amount of cars. The least frequent by a large margin are buses.
2. a) 75 beads b) Green c) 15
__ 75 × 100 = 20% d) 50
__ 75 × 100 = 66.67%
Workbook: Exercise 1 (wb page 115)1. a) 10, 11, 12, 13, 14 are all modes.
b) 45, 41c) 63
2. a) apples: 45; oranges: 42; pears: 53; peaches: 40; lemons: 40; bananas: 47
b) Mrs Nnaji: 22; Mrs Sotade: 27c) Mrs Sotade sold more fruit than Mrs Nnaji. Mrs Sotade
sold more apples, oranges, pears, lemons and bananas than Mrs Nnaji, while Mrs Nnaji sold more peaches than Mrs Sotade.
3. Movie type Tally marks Total
Comedy |||| ||| 8
Sci-fi |||| 4
Musical |||| 5
Action |||| 5
Suspense |||| 4
animation |||| 4
a) 4b) They mostly hire comedies.
4. a) 15 cars b) Honda c) 4 __ 15 × 100 = 26.67% d) Pie chart 2

165Theme 5: Everyday statistics – Data collection and presentation
Find the median of a data setRemind the pupils that they have worked with the mode as a measure of central tendency in the previous exercises. Ask the class to explain what mode means. Inform the class that the next average or measure of central tendency they will work with is the median of data sets.
Ask the class to look at the picture in example 1 showing plants growing against a wall. They find the heights of the plants, order the heights and find the number in the middle. Let the pupils explore the numbers in the list to find that 50 cm is the middle number. Work through the explanations with the class.
Let the class explore the heights of the ten pupils in example 2 and order the heights from the tallest to the shortest (descending order) to find the height in the middle. They should observe that there are two heights in the middle. Pupils work through the method to find the median.
The pupils work on their own to complete the workbook exercises either in class or as homework.
Exercise 3 (pb page 258)1. a) 38.5 kg b) most likely age/average mass
2. a) 25 b) 18
c) The most common age is less than the middle age.
3. a) 17.5 b) 16c) The median and mode are similar. The data is well
distributed.
4. a) Mode: 2; Median: 2 b) Mode: 5; Median: 5 c) Mode: 9; Median: 11 d) Mode: 25; Median: 24 e) Mode: 98; Median: 91
5. Pupils’ own work
Workbook: Exercise 2 (wb page 118)1. a) 68.5 km b) mode: 3; median: 2
2. a) median:1; mode: 1 b) median: 4.5; mode: 4 c) median: 13; mode: 7 d) median: 24; mode: 22
Everyday statisticsData collection and presentation

166 Term 3: Unit 10: Find measures of central tendency
3. a) Mode = 115; Median = 115b) Mode = 14; Median = 19c) Mode = 75; Median = 70d) Mode = 302; Median = 354
Find the mean of a data setRemind the pupils they have worked with the mode and median as measures of central tendencies or averages in the previous exercises. Ask the class to explain the meaning of mode and median. Inform the class they will now work with a third measure of central tendency or average – the mean of a data set.
Let the pupils explore the speech bubbles. They should understand that, when we talk about average marks, temperature, rainfall, etc. we refer to the mean. The mean of a data set is the most frequently used measure of central tendency. Read through the explanations with the class.
Go through the real-life problem in the example with the class and let them explore the data about newborn babies on the chart showing height and weight of babies. Let them find the weight, length, and birthdate of the baby in the picture. Ask them how they think they could calculate the average or mean of the babies’ heights and weights.
Ask the class to explore and explain the methods showing how to calculate the mean of the babies’ heights and weights. Let them explore the formula for calculating the mean of data sets. Work through the explanations with the class.
The pupils work on their own to complete the workbook exercises either in class or as homework.
Exercise 4 (pb page 261)1. Mode is the most frequently occurring number. Median is the middle number when the data is in ascending
or descending order. Mean is the average number.
2. They are all tools used to measure the central tendency of a set of data.

167Theme 5: Everyday statistics – Data collection and presentation
1, 0, 2, 1, 3, 0, 1data set
3.
mode mean median1 11.14
Quantitative reasoning
4. a) 7 b) 62 c) 535 d) 28 e) 232.8 f) 1.9
5. a) 7.5 b) 70 c) 565 d) 23 e) 169.5 f) 1.9
6. a) Mode: 49.2; Median: 49.2; Mean: 50.2b) The data is quite well distributed.
Exercise 5 Quantitative reasoning (pb page 262)1. 10 2. 45 3. 17 4. 51
5. a) Baskets sold at farmers’ cooperative per monthb) Mode: 23; Median: 20; Mean: 19.3
6. Median: 16; Mean: 15.4
7. a) 27 b) 25 c) 300
Workbook: Exercise 3 (wb page 120)1. a) median: 31.5; mean: 37
b) median: 3 214; mean: 3 235c) median: 33.39; mean: 174.03
2. 166 bricks per day
3. 378 pupils
4. a) 2.5; 2.88; 4.22 b) 29.31; 29; 29.71c) 132; 127.5; 127.75

168 Term 3: Unit 11: Experiment with tossing coins and throwing dice
5THEME Everyday statistics
Chances and events
Term 3
Unit 11: Experiment with tossing coins and throwing dice
Teaching guidelines and solutions
Instructional resourcesFormula chart; probability cards; frequency/tally tables; dice; coins; number cards; balls; spinners; game board; counters
Let the class read the pupils’ statements about probability and likelihood. Ask the pupils to name the pupils who are absolutely sure of their facts and those who are not totally sure of their facts. Discuss the language of probability with the class.
Let the pupils name some things or events that they are sure will never happen, think will happen and are sure will happen. Ask them to explore the statements on the cards. Explain to the class that, in statistics, the probability of an outcome (result) is a number value stating how likely (possible) it is that the outcome will happen. We take the number of possible events that can give the outcome and divide it by the total number of outcomes. Ask the class to explore the formula for calculating probability.
Inform the class that probability or chance is important in the fields of genetics (human characteristics passed on between generations), science, insurance, investments, etc. Ask them to look at the number values for the probability of events and to explain the number values. Explain that they will never throw 7 on a six-faced dice so the probability is 0. They certainly have 1 out of 6 chances to throw a 1, 2, 3, 4, 5, or 6 on a six-faced dice so the probability is 1. They certainly have 1 out of 2 chances to get heads when they toss a coin so the probability is 1 _ 2 . The number value for probability is always between 0 and 1.

169Theme 5: Everyday statistics – Chances and events
Ask the class what the probability is that a baby is a girl when it is born. Let them name the probability of drawing a red ball from a bag with a blue, red, and green ball without looking, drawing a card with the number 3 from a box with cards numbered 1 to 5 without looking, and drawing an ace of triangles card from a pack of 52 ordinary playing cards.
Let the pupils find the probability of drawing an even number, a number more than 5 and a prime number from a set of 10 cards as numbered. Explain to the class that, choosing something at random means the selection is unplanned, not thought through or unpredicted. Winning National Lottery numbers are chosen at random to prevent cheating.
The pupils work on their own to complete the workbook exercises either in class or as homework.
Exercise 1 Quantitative reasoning (pb page 266)1. Spin red on the wheel, the chances are 1 _ 5 on the wheel and 1 _ 6
with the dice, the closer the odds are to 1 the more likely the event is to happen.
2. 6 times
3. 15 times
4. 5 __ 12
5. a) 1 _ 3 b) 1 _ 2 c) 4 _ 7
6. a) 10 times
b) Throws Tally Appearances of numbers
1 |||| |||| ||| 13
2 |||| |||| | 11
3 |||| 5
4 |||| ||| 8
5 |||| |||| ||| 13
6 |||| |||| 10
c) The prediction is the same as the outcome.
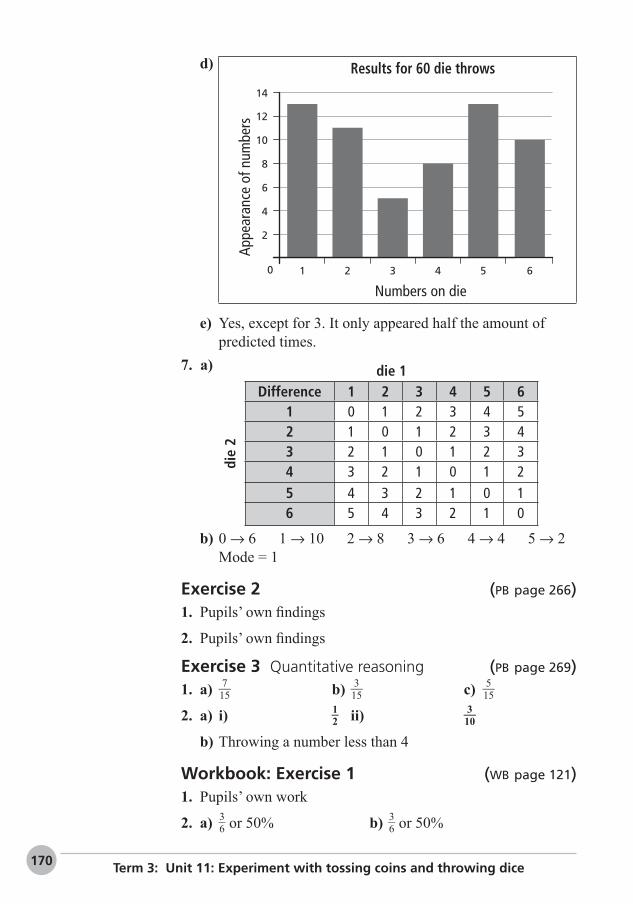
170 Term 3: Unit 11: Experiment with tossing coins and throwing dice
d)
0 1 2
2
4
6
8
10
12
14
3 4
Results for 60 die throws
Appe
aran
ce o
f num
bers
5 6
Numbers on die
e) Yes, except for 3. It only appeared half the amount of predicted times.
7. a) die 1
die
2
Difference 1 2 3 4 5 61 0 1 2 3 4 52 1 0 1 2 3 43 2 1 0 1 2 34 3 2 1 0 1 25 4 3 2 1 0 16 5 4 3 2 1 0
b) 0 → 6 1 → 10 2 → 8 3 → 6 4 → 4 5 → 2 Mode = 1
Exercise 2 (pb page 266)1. Pupils’ own findings
2. Pupils’ own findings
Exercise 3 Quantitative reasoning (pb page 269)1. a) 7 __ 15 b) 3 __ 15 c) 5 __ 15
2. a) i) 1 _ 2 ii) 3 __ 10
b) Throwing a number less than 4
Workbook: Exercise 1 (wb page 121)1. Pupils’ own work
2. a) 3 _ 6 or 50% b) 3 _ 6 or 50%

171Theme 5: Everyday statistics – Chances and events
c–e) Pupils’ own workf) Yes, both have an equal chance of throwing an odd or
even number.
Workbook: Exercise 2 (wb page 123)1. Pupils’ own work
2. Probability StatementHighly likely b) I will have supper tonight.Very likely a) I will get dressed for school tomorrow.Likely d) It will rain tomorrow.Unlikely e) We will have roast beef for supper tomor-
row evening.Highly unlikely c) My Mathematics teacher will do cart-
wheels today.
Project / practical work (pb page 270)Remind the class that they have worked with nets of 3-D shapes in Unit 7 this term. They will now engage in a project to create their own nets (or planes) to construct a cube, cuboid and a cylinder. They should not find it difficult because they have already practised drawing nets.
Ask the pupils to explore the boxes created from nets and decorated by combining two shapes (creating composite shapes). Some boxes have separate lids while others have flaps that fold to form lids.
Make sure that all pupils have the necessary materials. Go through the points with the class and make sure all pupils understand what is expected of them. Let the pupils choose the nets they want to use, i.e. nets for 2 cubes, a cuboid and the cylinder. They fold the box for one cube without decorating it.
Ask the pupils to calculate the volume of the cube, cuboid, and cylinder.
They use the cube without decorations and empty a 1-litre container of sand into it. They should find that 1 ℓ = 1 000 cm3.
Display the pupils’ boxes in the class.
Assessment: Use a project assessment sheet to assess pupils’ practical work and their ability to calculate the volume of a cube, cuboid and cylinder.

172 Term 3: Revision
3TERM
Revision
You may use the revision questions or a selection thereof for the final assessment at the end of the term. The questions and problems involve work covered in topics during the term. The problems include routine problems and those involving quantitative reasoning.
Revision solutions (pb page 272)1. a) True
b) False, the distance is always equal.c) False, they never intersect or cross each other.d) Truee) False, we use a small square.f) False, we use small arrows.g) False, the symbol is ||.h) False, the symbol is ⊥.
2. a) b) c) d) e) f)
3. a) b) c) d) e) f)
4. a) equilateral b) isosceles c) isosceles d) equilateral e) right-angled f) scalene g) scalene h) right-angled

173Term 3: Revision
5.
6. a) quadrilateral b) parallel c) isosceles d) right-angled e) legs f) scalene g) symmetry
7. a) True, it is a rhombus with right angles.b) False, a rhombus has all sides equal in length and a
rectangle does not.c) False, only squares and rhombi have bisecting diagonals.d) Truee) False, two opposite pairs are equal.f) False, they can be any angle.g) Trueh) True
8.
Parallelograms
parallelograms
Notparallelograms
Right-angled Rhombi Trapeziums Triangles Circles
9. a) 143° b) 44° c) 95°
10. a) 46°
b) 99°
acute obtusec) 135° d) 190°
obtuse reflex

174 Term 3: Revision
11. a) a = 55°; c = 35°; d = 55°b) w = 40°; x = 32°; y = 108°; z = 40°
12. a) 35° + 55° + 35° + 55° = 180°b) 108° + 32° + 40° + 32° + 108° + 40° = 360°
13. a) 63° b) 73°c) x = 36°; 3x = 108°
14. a) radius b) arc c) minor segment d) major segment e) chord f) chord
g) arc h) arc i) minor sector j) major sector k) arc l) radius m) arc n) radius o) radius
15. a) 16 cm b) 7.5 cm c) 18 cm d) 11 cm
16. a) A: 17 mm; B: 11 mmb) A: 34 mm; B: 22 mmc) A: 106.81 mm; B: 69.12 mm
17. a) 25 m b) 30 m c) 288 cm d) 10 m
18. 900 m
19. 122 poles
20. a) 31.42 cm b) 219.91 mm c) 131.95 mm d) 94.25 m
21. 51.42 m
22. a) 1 445.1 mm b) 157 cm c) 1 884.9 mm
23. a) A: 3.5 m2 b) B: 24 cm2c) C: 7.5 cm2; D: 17.5 cm2
24. a) D b) A c) B d) C
25. a) cubeb) triangular-based prismc) cuboidd) square-based pyramid
26. a) cube: edges 12; vertices 8b) triangular-based prism: edges 9; vertices 6c) cuboid: edges 12; vertices 8d) square-based pyramid: edges 8; vertices 5

175Term 3: Revision
27. a) •• • •• •• • ••
•• •• •••• •
•• ••
b) • •• • ••• •
•• •• •••• ••
•• • ••
28. Pupils’ own constructions
29. a) 216 dice b) 160 dice
30. a) 2 880 cm3 b) 768 cm3
31. a) 791.68 cm3 b) 339.29 cm3 c) 14 137 cm3
32. a) 9 817.5 cm3 b) 3 232.7 cm3 c) 791.7 cm3 d) 2 155.1 cm3
33. 251.3 m3
34. cuboid: 31 104 cm3; sphere: 24 429.02 cm3; the cuboid has more volume.
35. a) spherical b) sphere c) ball d) equator e) longitude f) hemisphere
36. A: 2 144.66 cm3; B: 7 238.23 cm3; C: 2 144.66 cm3
37. Pupils’ own tallies and graphs
38. a) 175 000 b) 375 000
39.a) HIV/AIDS occurence in women by stateState Percentage of
women affected
Plateau 8%
Benue 12%
Kogi 6%
Kanu 4%
Key: represents 2%
b) Benue c) 30% d) Discuss this in class. e) Practise safe sex.

176 Term 3: Revision
40. a)
0 APC PDP
36 00040 00054 000
31 000
13 000 000
15 000 000
APA ACPN
Votes for the top 6 parties in the2015 Presidential General Elections, Nigeria
Num
ber o
f vot
es
CPP AD
b) APC c) Muhammadu Buhari
d) i) 14 969 000 ii) 12 964 000e) No, because there may be other parties who were voted
for and some ballots may have been spoilt.
41. a) ₦1 240 000b) Dibia 29%; Ikemdi 22.6%; Ikenna 19.4%; Chinasa 16.1%;
Ego 12.9%
c)
Ego13%
Dibia29%
Ikemdi23%Ikenna
19%
Chinasa16%
d) Egoe) ₦80 000f) ₦80 000g) No, because some children inherited significantly more
than the others.

177Term 3: Revision
42. a) 32b) Test mark No . of pupils
32 1
33 0
34 1
35 2
36 2
37 1
38 3
39 2
40 0
41 1
42 2
43 0
44 5
45 3
46 1
47 1
48 3
49 2
50 2
c) 44d) The most frequent mark was 44 out of 50 so that means
the results for the test are generally quite high.
43. a) Occurs most frequentlyb) median
44. a) Mode: 2; Median: 2b) The data is centred around 2
45. a) Mode: 5; Median: 3b) Mode: 1.3; Median: 1.41

178 Term 3: Revision
46. a) Most frequently occurring numberb) Middle number when the data is in an ascending or
descending orderc) Sum of all the numbers divided by the total number of
numbers in the data setd) Measures of central tendency
47. 76 kg
48. 17 km
49. a) Mode: 4.1; Median: 3.5; Mean: 3.4b) Mode: 29; Median: 29; Mean: 30.1c) Mode: 133; Median: 133; Mean: 132.3d) Mode: 38; Median: 43.5; Mean: 43
50. 125
51. a) 1 _ 6 b) All the shapes have a 1 _ 6 chance of being thrown.
52. 1 _ 6
53. B, because the chance of getting a black sweet in bag B is 9 __ 14 and the chance of getting a black sweet in bag A is 2 _ 5 . 9 __ 14 is closer to 1 than 2 _ 5 .
54. a) definitely b) unlikely c) likely d) possibility e) unlikely