smarter balanced achievement level cut scoressbe.wa.gov/documents/boardmeetings/2015/jan/achievement...
TRANSCRIPT

OFFICE OF SUPERINTENDENT OF PUBLIC INSTRUCTIONDivision of Assessment and Student Information
Smarter Balanced Achievement Level Cut Scores
January 2015

December 23, 2014 | Slide 2
OFF
ICE
OF
SUPE
RIN
TEN
DEN
T O
F PU
BLIC
INST
RU
CTI
ON
Preparing for New Test Scores
Smarter Balanced assessments measure the full range of the Common Core State Standards. They are designed to let teachers and parents know whether students are on track to be college- and career-ready by the time they graduate.
Because the new standards set higher expectations for students--and the new tests are designed to assess student performance against these higher expectations--our definition of grade level performance is higher than it used to be.
As a result, it’s likely that fewer students will meet grade level standards, especially for the first few years. Results should improve as students have additional years of instruction aligned to the new standards and become better equipped to meet the challenges they present.
This does not mean that our students are “doing worse” than they did last year. Rather, the scores represent a “new baseline” that provides a more accurate indicator for educators, students, and parents as they work to meet the rigorous demands of college and career readiness.

December 23, 2014 | Slide 3
OFF
ICE
OF
SUPE
RIN
TEN
DEN
T O
F PU
BLIC
INST
RU
CTI
ON
Smarter Balanced Achievement Level Setting Activities
Online panel to recommend cut scores Over 10,000 registered 5,840 logged in 2,660 completed training and submitted recommendation
In-person panel to recommend cut scores 504 panelists confirmed 482 completed the tasks
Vertical Articulation Committee to smooth across grades
64 panelists confirmed

December 23, 2014 | Slide 4
OFF
ICE
OF
SUPE
RIN
TEN
DEN
T O
F PU
BLIC
INST
RU
CTI
ON
Washington’s Participation
For the Online Panel Washington had 1,293 total participants: 916 – Teachers 238 – Other educators (administrators and higher ed) 86 – Parents 53 – Other (business/community members)
For In Person Panel= 30, mostly teachers but a few administrators and higher education representatives

December 23, 2014 | Slide 5
OFF
ICE
OF
SUPE
RIN
TEN
DEN
T O
F PU
BLIC
INST
RU
CTI
ON
Achievement Level Setting Participation (across states)
Online Panel In-Person Panel
Cross-Grade Review
Committee
Teachers 65% 64% 66%
Non-TeacherEducators & Administrators
18% 18% 19%
Higher Education 9% 12% 11%
General Public 7% 6% 5%
Total 2,660 482 64
December 23, 2014 | Slide 6
OFF
ICE
OF
SUPE
RIN
TEN
DEN
T O
F PU
BLIC
INST
RU
CTI
ON
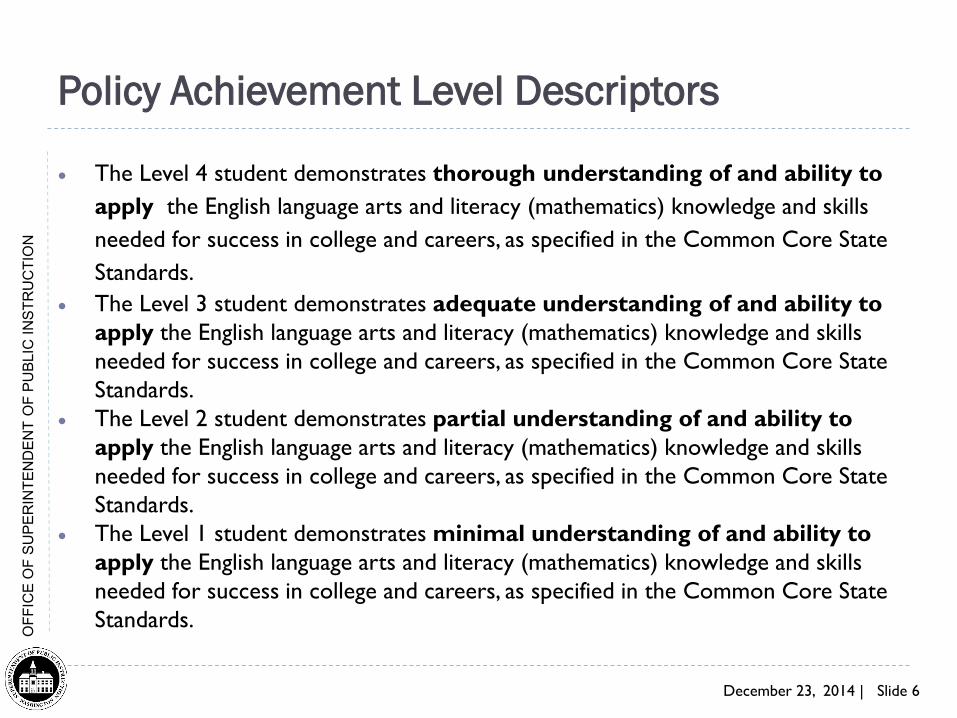
Policy Achievement Level Descriptors
• The Level 4 student demonstrates thorough understanding of and ability to apply the English language arts and literacy (mathematics) knowledge and skills needed for success in college and careers, as specified in the Common Core State Standards.
• The Level 3 student demonstrates adequate understanding of and ability to apply the English language arts and literacy (mathematics) knowledge and skills needed for success in college and careers, as specified in the Common Core State Standards.
• The Level 2 student demonstrates partial understanding of and ability to apply the English language arts and literacy (mathematics) knowledge and skills needed for success in college and careers, as specified in the Common Core State Standards.
• The Level 1 student demonstrates minimal understanding of and ability to apply the English language arts and literacy (mathematics) knowledge and skills needed for success in college and careers, as specified in the Common Core State Standards.

December 23, 2014 | Slide 8
OFF
ICE
OF
SUPE
RIN
TEN
DEN
T O
F PU
BLIC
INST
RU
CTI
ON
Smarter Balanced Threshold Scale Scores for Four Achievement Levels
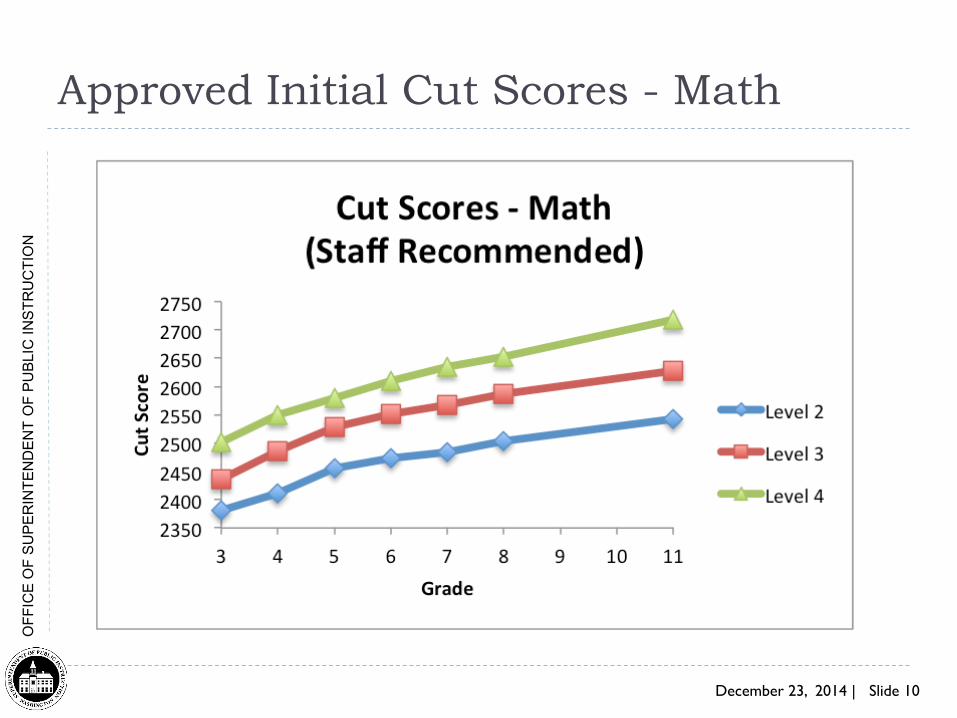
Math Scale Score ThresholdsGrade Level 1-to-2 Level 2-to-3 Level 3-to-4
3 2381 2436 25014 2411 2485 25495 2455 2528 25796 2473 2552 26107 2484 2567 26358 2504 2586 2653
11 2543 2628 2718
ELA Scale Score ThresholdsGrade Level 1-to-2 Level 2-to-3 Level 3-to-4
3 2367 2432 24904 2416 2473 25335 2442 2502 25826 2457 2531 26187 2479 2552 26498 2487 2567 2668
11 2493 2583 2682

December 23, 2014 | Slide 9
OFF
ICE
OF
SUPE
RIN
TEN
DEN
T O
F PU
BLIC
INST
RU
CTI
ON
Approved Initial Cut Scores - ELA
December 23, 2014 | Slide 10
OFF
ICE
OF
SUPE
RIN
TEN
DEN
T O
F PU
BLIC
INST
RU
CTI
ON
Approved Initial Cut Scores - Math
December 23, 2014 | Slide 11
OFF
ICE
OF
SUPE
RIN
TEN
DEN
T O
F PU
BLIC
INST
RU
CTI
ON
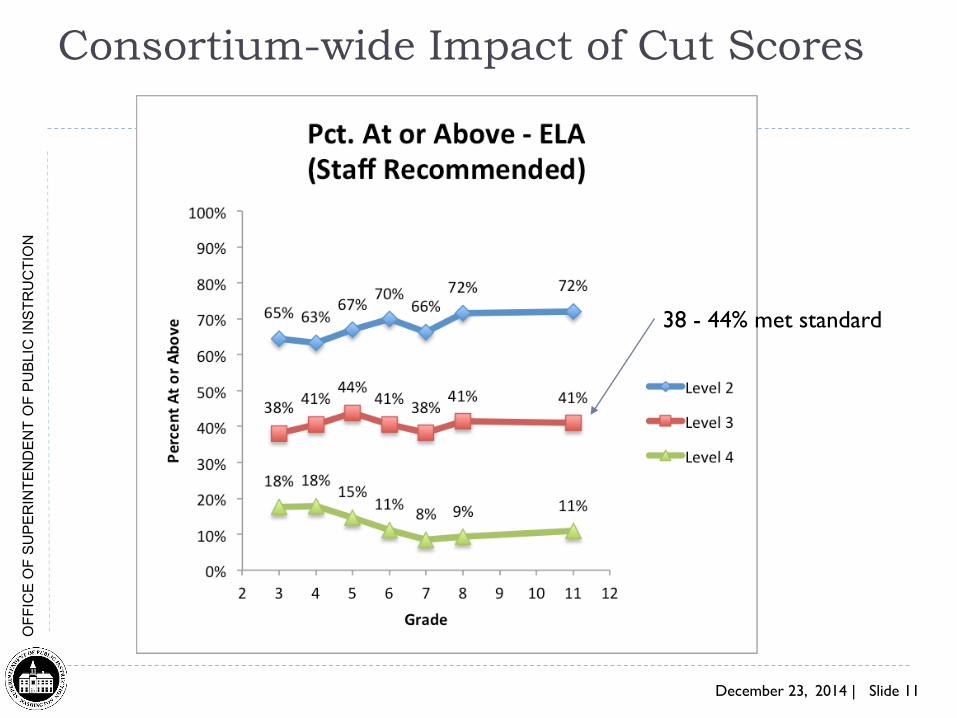
Consortium-wide Impact of Cut Scores
38 - 44% met standard
December 23, 2014 | Slide 12
OFF
ICE
OF
SUPE
RIN
TEN
DEN
T O
F PU
BLIC
INST
RU
CTI
ON
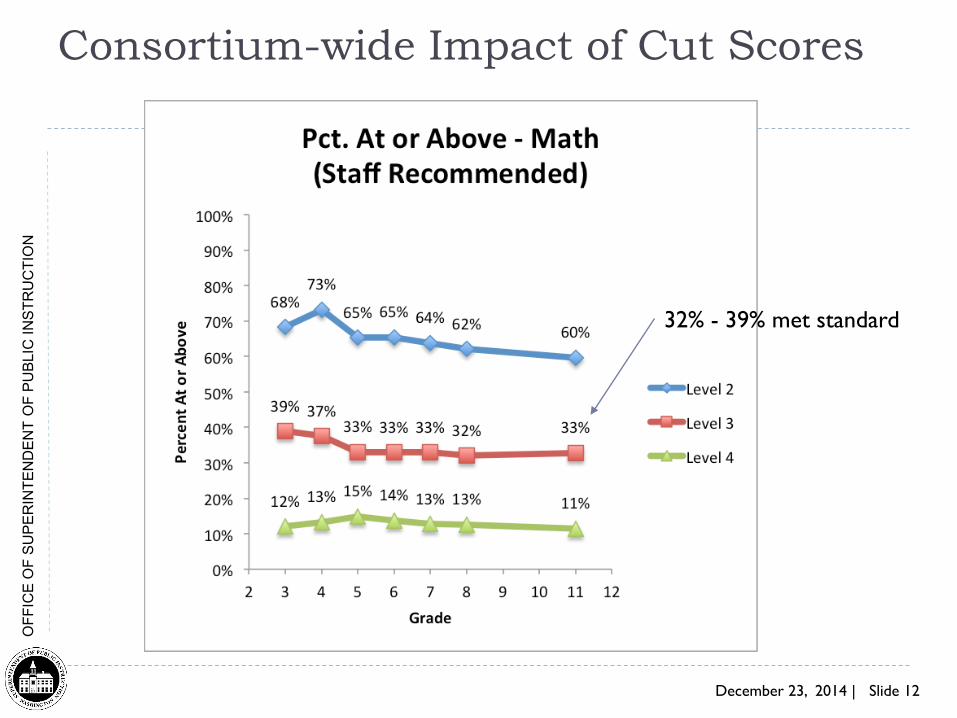
Consortium-wide Impact of Cut Scores
32% - 39% met standard
December 23, 2014 | Slide 13
OFF
ICE
OF
SUPE
RIN
TEN
DEN
T O
F PU
BLIC
INST
RU
CTI
ON
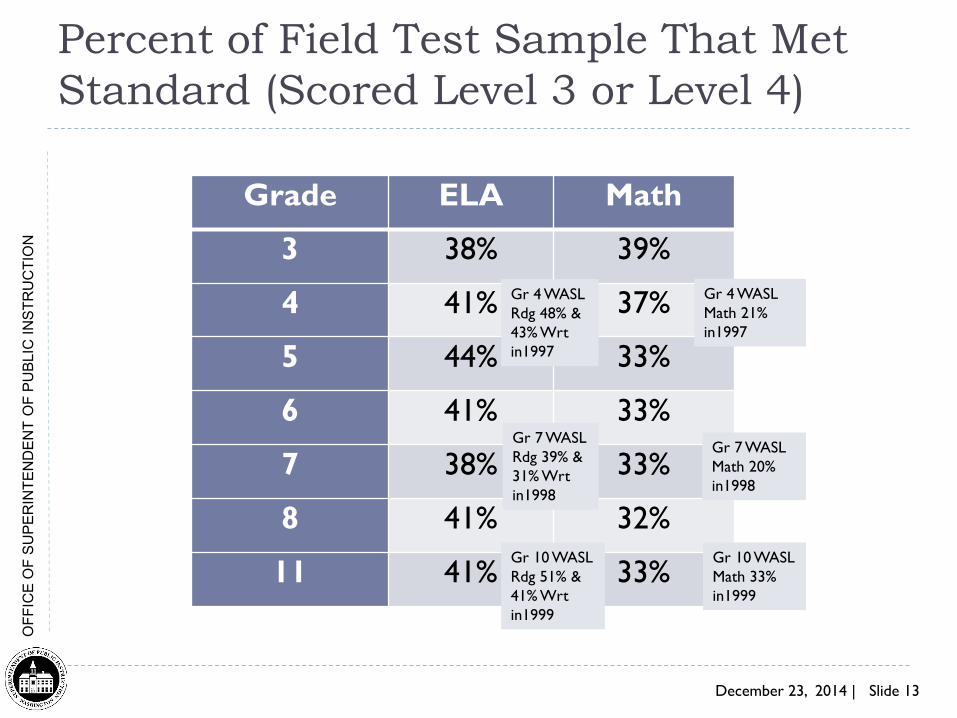
Percent of Field Test Sample That Met Standard (Scored Level 3 or Level 4)
Grade ELA Math
3 38% 39%
4 41% 37%
5 44% 33%
6 41% 33%
7 38% 33%
8 41% 32%
11 41% 33%
Gr 4 WASL Rdg 48% & 43% Wrtin1997
Gr 7 WASL Rdg 39% & 31% Wrtin1998
Gr 10 WASL Rdg 51% & 41% Wrtin1999
Gr 7 WASL Math 20% in1998
Gr 4 WASL Math 21% in1997
Gr 10 WASL Math 33% in1999