smartway transport partnership - united nations · pdf filesmartway transport partnership un...
TRANSCRIPT

SmartWayTransport Partnership
UN CSD 19
Learning Center
Buddy Polovick
US Environmental Protection Agency
09 May 2011

Outline
Part 1
• Freight Sustainability Drivers and Challenges
• SmartWay Overview
• Questions
2
• Questions
Part 2
• Design, Build and Implement a FreightSustainability Program
• Questions
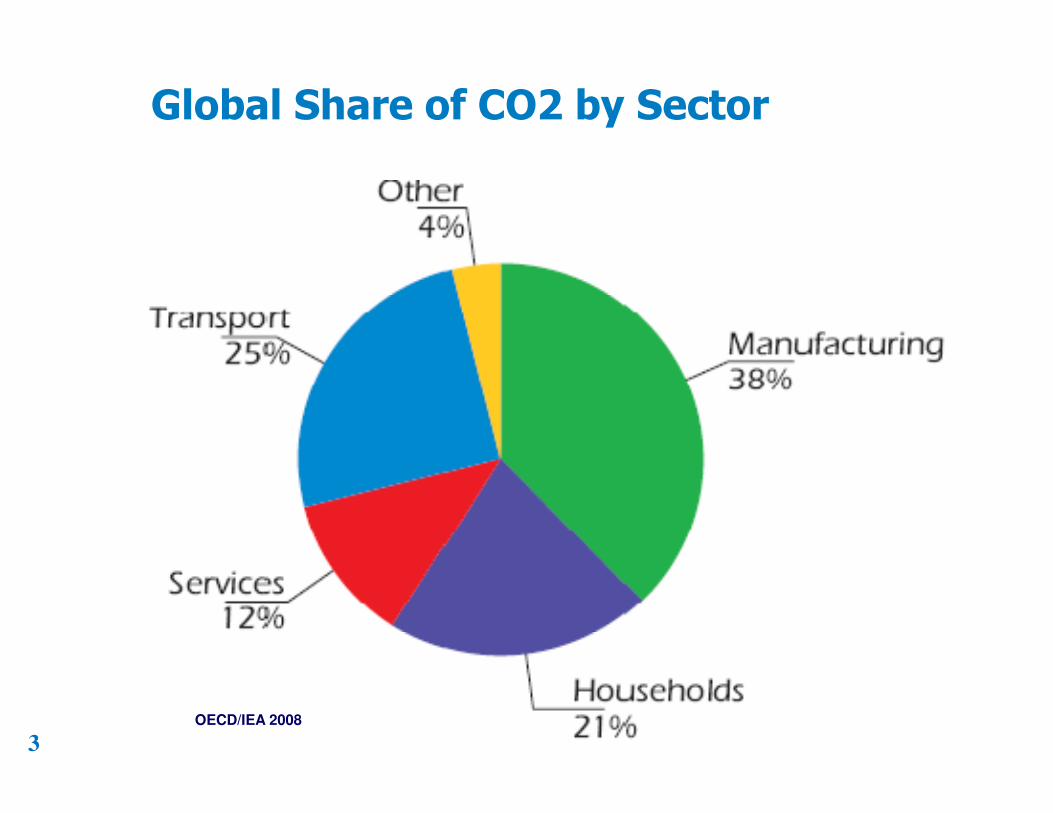
Global Share of CO2 by Sector
3
OECD/IEA 2008

Vehicle Freight Miles
4 www.worldmapper.org

Freight Mile Growth Outpaces Passengers
5
International Transport Forum member countries onlyITF 2011

Energy Volatility
6

Passenger Cars
Aviation8%
Rail2%
Marine2%
Pipelines2%
U.S. Transportation Sector GHG Emissions
7
GHG (1,820 mmt CO2-eq, 2009)
Passenger Cars35%
Light Duty Trucks30%
Medium & Heavy Duty Trucks
21%
DRAFT INVENTORY OF U.S. GREENHOUSE GAS EMISSIONS AND SINKS: 1990 – 2009FEBRUARY 2011

SmartWay Program Components
Partnership• Assess, benchmark and track
emissions of carriers, shippers, and logistics companies
• National idle reduction program• New carbon assessment tools• Partner support• GHG and fuel savings
Technology Program
Light Duty Vehicles• SmartWay certified vehicles• Preferential leasing, purchasing• Consumer education
Outreach and Education• Partner recognition - SmartWay web site,
logo, and awards• Partner education – webinars, fact
8
Technology Program• Test program• SmartWay Tractor/Trailer• SmartWay-verified technologies• Test methods
Finance Program • Innovative finance programs (grant
programs, banks, retailers)• SmartWay Finance web site
• Partner education – webinars, fact sheets, e-update, web site, workshops, events
• Innovative pilot programs• Brand marketing – PSAs, media
campaigns, events
International Activities• Conferences, training, workshops• Replicate public/private partnership• Pilot projects
• Global supply chain

How Does The Partnership Work?
ShipperShipperShipperShipper
Data
Data
Partnership
Partnership
Fuel $ Fuel $ SavingsSavingsFuel $ Fuel $ SavingsSavings
Carbon Carbon FootprintFootprintCarbon Carbon FootprintFootprint
9
TechnologyTechnologyVendorVendor
TechnologyTechnologyVendorVendor
BBanker anker FinancerFinancerBBanker anker
FinancerFinancer
CarrierCarrierCarrierCarrierEPAEPAEPAEPAPartnershipPartnership
DataDataVerificationVerification
DataData Facilita
tion
Facilita
tion $$
$$
$$

SmartWay Partner Results
2, 900+ Partners– All 100 largest truck carriers and 1K+ medium-small carriers
– All Class 1 Rail lines
– Major logistics firms
– Fortune 500 (and Fortune 50) shippers from every sector
Since 2004, SmartWay Partners saved
10
Since 2004, SmartWay Partners saved– 16.5 million metric tons of CO2
– 235,000 tons NOx
– 9,100 tons PM
– 5 million barrels of oil imports
– 6.1 billion dollars in fuel costs
– Equivalent to taking over 3 million cars off the road for 1 year

SmartWay Global Partners
11

Why is SmartWay successful?
Shippers:– Top of the supply chain, drive
marketplace demand
– Give preferred status to SmartWay Carrier Partners
– Get better data to improve their own shipping operations
Carriers:– Gain competitive advantage:
• Preferred status, plus
• Fuel efficiency, savings
– Reduce emissions
– Integrate fuel saving technologies and strategies
12
their own shipping operations
– Modify logistics operations to improve efficiency & reduce emissions, for example:
• Inter-modal Shipping
• Full Truck Loads
• Warehouse Improvements
• Idle-Reduction at facilities
– Get recognition and PR value with SmartWay brand
technologies and strategies into fleets, such as:
• Idle Reduction
• Improved Aerodynamics
• Efficient Tire Systems
• Driver Training
• Renewable Fuels
• Advanced Lubricants
– Get recognition and PR value with SmartWay brand

SmartWay Tractors and Trailers
Specifications include 2007+ engine, idle reduction, low rolling resistance tires, and aerodynamic equipment
–10% to 20% reduction in fuel use,relative to a comparable
13
comparable truck without these fuel-saving features
– Limited to the equipment & truck types that EPA tests

SmartWay Finance Center –For Smaller Fleets, Owner Operators
141414
www.smartwayfinancecenter.com

Public Service Campaign for Shippers
15

Public Service Campaign for Carriers(TV, Radio, Print)
1616

Public Service Campaign for Consumers (TV, Radio, Print)
17171717

Partner Recognition
– Partner logo earned by top-performing SmartWay Partners
– SmartWay Annual Awards recognize the
18
Awards recognize the “best of the best”
– SmartWay partners compete for recognition

SmartWay Industry Awareness
Survey of supply chain
19
Survey of supply chain executives shows SmartWay as leading industry sustainability program - Eye For Transport, June, 2010

SmartWay Industry Awareness
Shipping executives survey shows SmartWay as leading industry sustainability program- Environmental Sustainability Benchmark Study: Leaders Prepare for the “Greening” Supply Chain, Feb, 2011
20
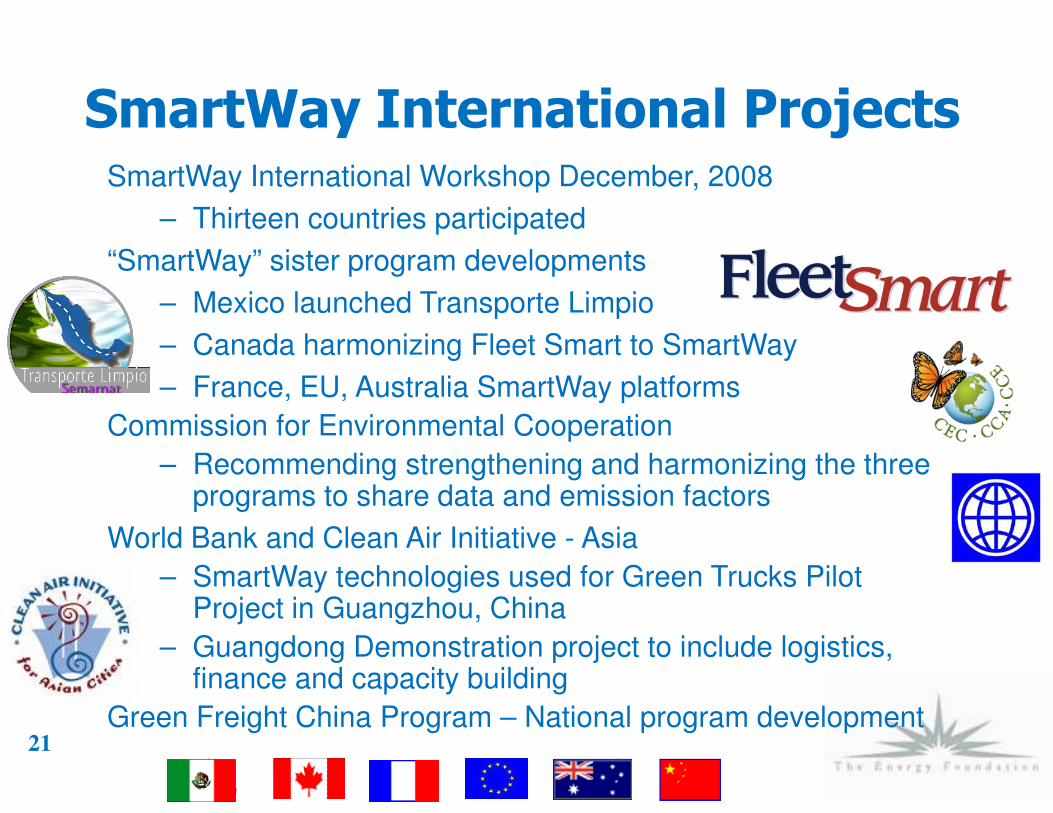
SmartWay International ProjectsSmartWay International Workshop December, 2008
– Thirteen countries participated
“SmartWay” sister program developments
– Mexico launched Transporte Limpio
– Canada harmonizing Fleet Smart to SmartWay
– France, EU, Australia SmartWay platforms
21
Commission for Environmental Cooperation
– Recommending strengthening and harmonizing the three programs to share data and emission factors
World Bank and Clean Air Initiative - Asia
– SmartWay technologies used for Green Trucks Pilot Project in Guangzhou, China
– Guangdong Demonstration project to include logistics, finance and capacity building
Green Freight China Program – National program development

Creating a Freight Sustainability Program
I. Exploratory Stage
• Market research
II. Design and Development Stage
• Program components, tools materials
III. Implementation Stage
22
III. Implementation Stage
• Marketing
• Recruiting and Partner management
IV. Expansion and Refinement Stage
• Value added components
• Building program credibility

Stage I - Exploratory Stage
Before designing SmartWay (2001-2002), EPA conducted research on the current state of freight transportation• Freight industry energy use• Environmental impacts • Trends and forecasts
Contractor created report on state of industry and potential
23
Contractor created report on state of industry and potential for energy savings; found that freight sector:• Accounted for 19.4% of total transportation energy use• Contributed 50% of mobile source NOx• Contributed 30% of mobile source PM • Contributed 20% of the mobile source CO2• Grew more rapidly than all transportation sectors except air travel

Stage I - Exploratory Stage
24

Fuel Savings per truck (<3%)
Automatic Tire Inflation 0.70
Tare Weight Reduction (3000 lbs.) 0.80
Low-Friction Drive Train Lubricants 0.50
Low-Friction Engine Lubricants 1.50
Reduced Rolling Resist. (Wide based tires) 2.30
Fuel Savings per truck (3%<x<6%)
2010 Emission Reduction (MMTCE*)
Opportunities to Improve Efficiency
Stage I - Exploratory Stage
25
Fuel Savings per truck (3%<x<6%)
Improved Trailer Aerodynamics 1.90
Driver Training and Monitoring 1.80
Improved Tractor Aerodynamics 1.20
Fuel Savings per truck (>6%)
Speed Reduction (70 to 65 mph) 0.90
Speed Reduction (65 to 60 mph) 3.90
Idling Reduction (APU) 2.90
Total Maximum Benefit (current technologies) 18.4
*million metric tons of carbon equivalent

Advanced Truck Stop Electrification
26

Advanced Truck Stop Electrification
27

Idle Reduction TechnologiesFor Trucks and Locomotives
Average fuel savings Emissions ControlledTrucks: 1 gal/hr CO2, NOx, and PM
Rail: 4 - 12 gal/hr
• Automatic Shut-Down/Start Up System
• Battery Powered Systems
• Diesel Driven Heating System
• Auxiliary Power Unit/Generator Set
28
• Auxiliary Power Unit/Generator Set
• Truck Stop Electrification

Low Rolling Resistance TiresSingle Wide Base and Improved Duals
Average fuel savings Emissions ControlledTrucks: 4 - 5% CO2, NOx
• Single-wide tires
• Reduced rolling resistance
• Reduced weight
• Low rolling resistance dual tires
29
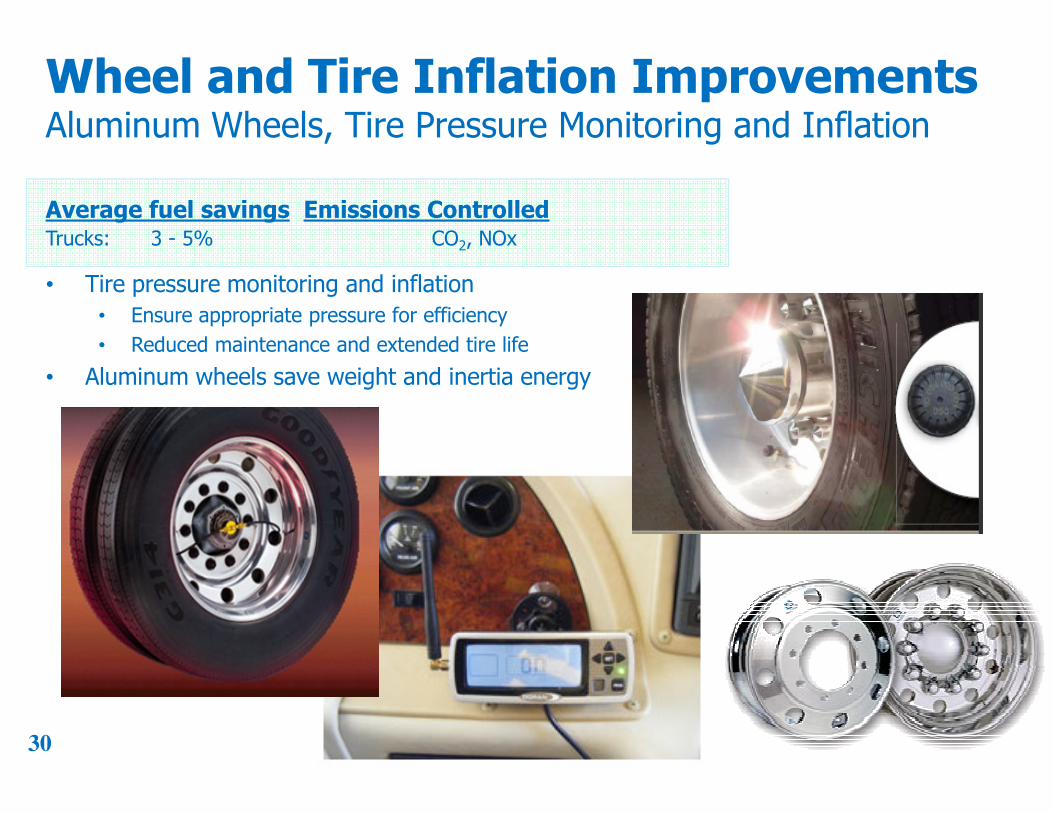
Wheel and Tire Inflation ImprovementsAluminum Wheels, Tire Pressure Monitoring and Inflation
Average fuel savings Emissions ControlledTrucks: 3 - 5% CO2, NOx
• Tire pressure monitoring and inflation
• Ensure appropriate pressure for efficiency
• Reduced maintenance and extended tire life
• Aluminum wheels save weight and inertia energy
30
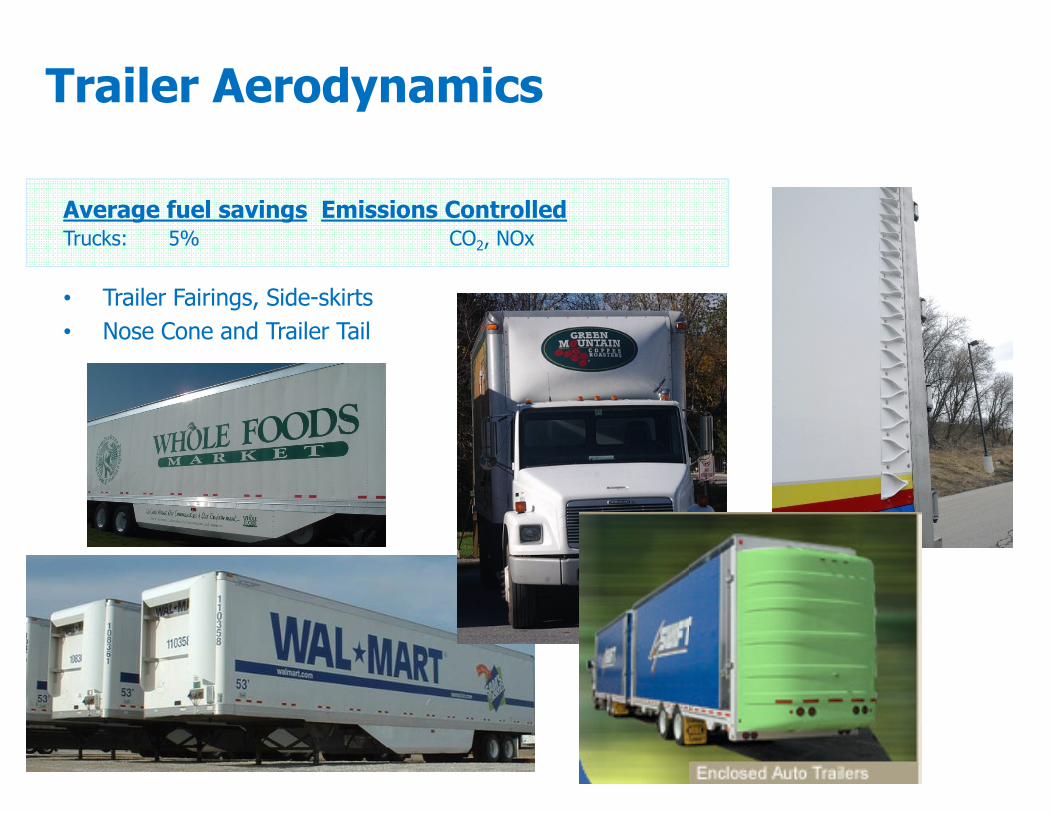
Trailer Aerodynamics
Average fuel savings Emissions ControlledTrucks: 5% CO2, NOx
• Trailer Fairings, Side-skirts
• Nose Cone and Trailer Tail
31
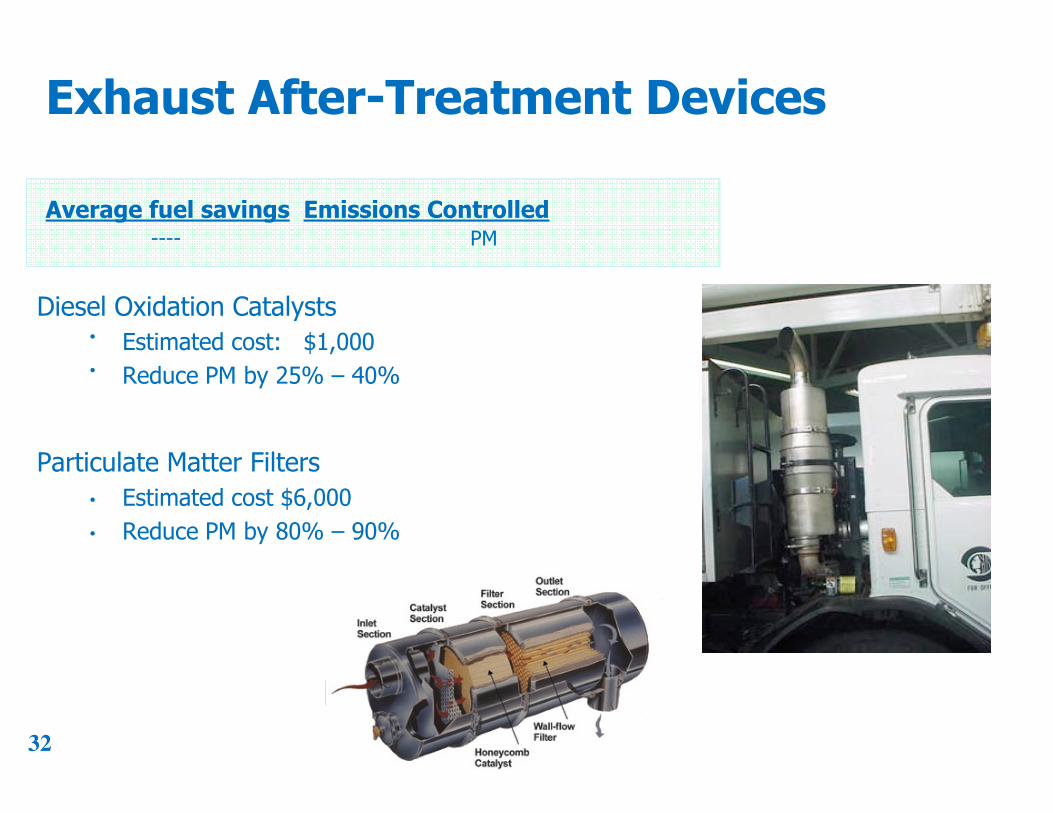
Diesel Oxidation Catalysts• Estimated cost: $1,000• Reduce PM by 25% – 40%
Exhaust After-Treatment Devices
Average fuel savings Emissions Controlled---- PM
32
Particulate Matter Filters
• Estimated cost $6,000
• Reduce PM by 80% – 90%

Intermodal Shipping
33

Operational Strategies
34
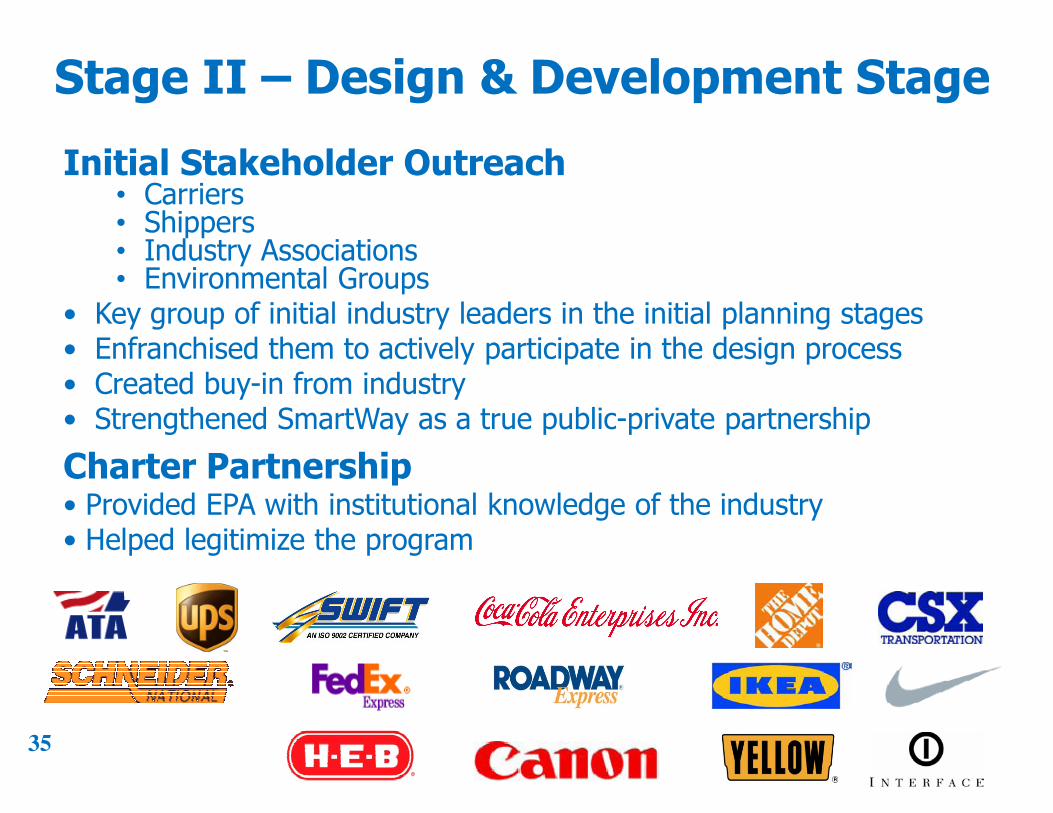
Stage II – Design & Development Stage
Initial Stakeholder Outreach • Carriers• Shippers• Industry Associations• Environmental Groups
• Key group of initial industry leaders in the initial planning stages • Enfranchised them to actively participate in the design process• Created buy-in from industry• Strengthened SmartWay as a true public-private partnership
35
• Strengthened SmartWay as a true public-private partnership
Charter Partnership• Provided EPA with institutional knowledge of the industry• Helped legitimize the program
Stage II – Design & Development Stage
Website Includes information on Partners, news, funding opportunities, official program materials, technical reports, general SmartWay information
Calculator Tools • Help partners estimate CO2, NOx, and PM emissions• Determines effectiveness of strategies used in the fleet
36
• Determines effectiveness of strategies used in the fleet• Allows fleet to determine best strategies for them• Projects and estimates cost savings and paybacks• Measures their environmental footprint
Database• To organize Partnership contact and communication information
Partner agreements • To formalize commitments as a Memorandum of Understanding

Stage III – Implementation Stage
Step 1 - Program Launch and Marketing
• Education campaign
• Brand marketing tools
• Consumer education
37
• Recognize Charter Partners
• Demonstrate Calculator Tool
• Press Releases
• Press Conference
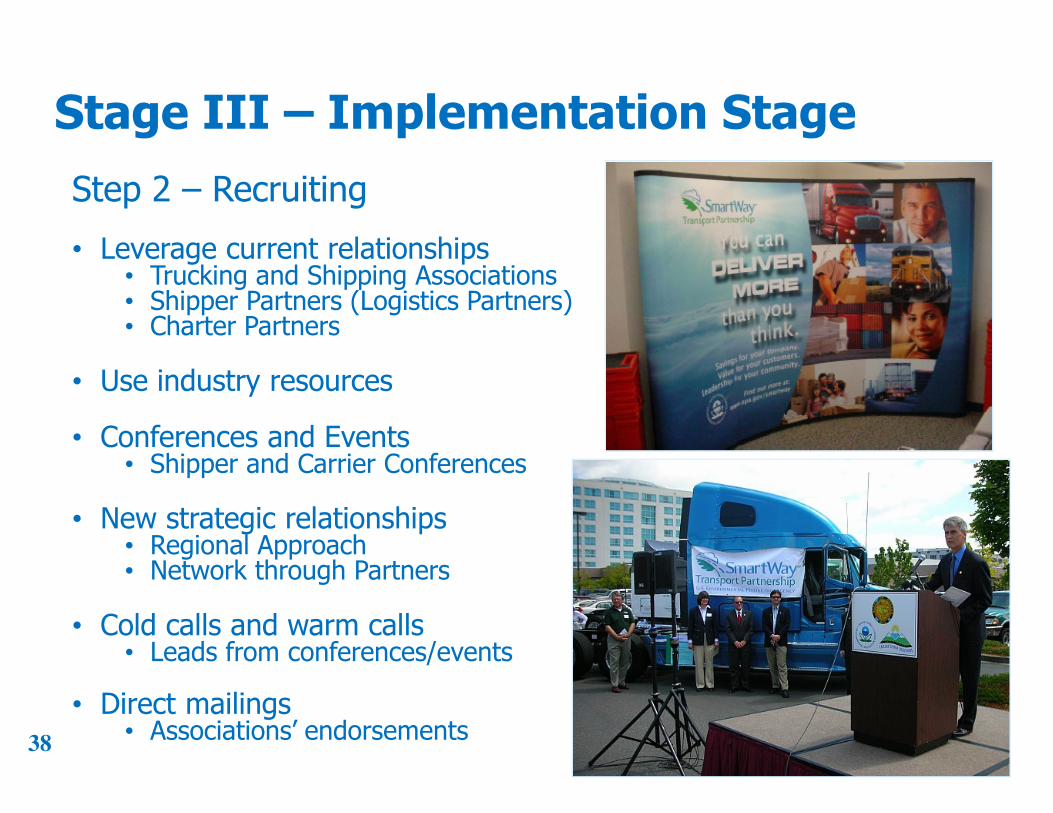
Stage III – Implementation Stage
Step 2 – Recruiting
• Leverage current relationships• Trucking and Shipping Associations• Shipper Partners (Logistics Partners)• Charter Partners
• Use industry resources
38
• Conferences and Events• Shipper and Carrier Conferences
• New strategic relationships• Regional Approach• Network through Partners
• Cold calls and warm calls• Leads from conferences/events
• Direct mailings• Associations’ endorsements

Stage III – Implementation Stage
Step 3 - Partner Management• General assistance with paperwork and data reporting
• Calculator tool• Authorization to use logo
• Develop working relationships
• Technical Guidance
39
• Technical Guidance
• Marketing assistance • Press Release• Case Studies• Logo Use • Authoring articles or internal memos
• Make the Partnership more valuable• Using Partner feedback to improve the process for them
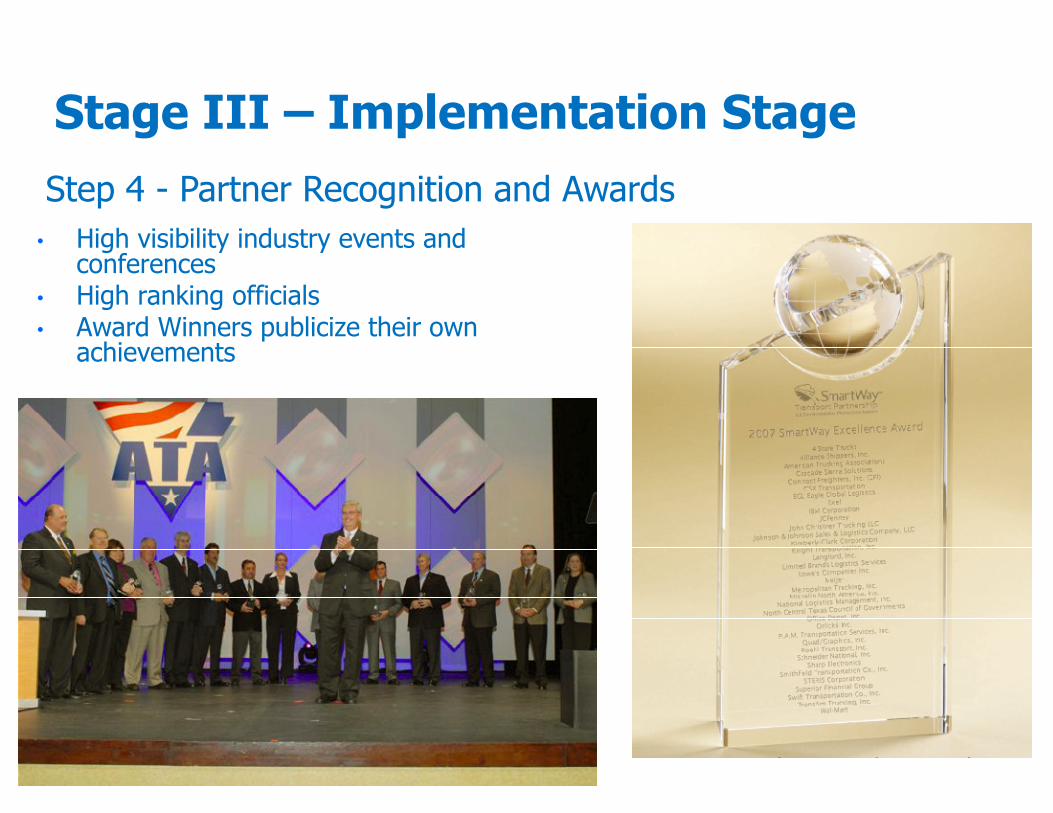
Stage III – Implementation Stage
Step 4 - Partner Recognition and Awards
• High visibility industry events andconferences
• High ranking officials• Award Winners publicize their own
achievements
40

Stage IV – Expansion & Refinement
Value added components:
• Technology Testing and Verification Program
• SmartWay verified Technologies
• SmartWay verified Trucks (Tractors and Trailers)
• Online Driver Training E-Learning
41
• Online Driver Training E-Learning
• Online Calculator Tools
• Financing programs
• Grants, loans and subsidies for Technology upgrades
• Goal: Maximize deployment of fuel saving and emission reduction technologies in the market
• Enhancing the Brand
• Mark of cleaner/sustainable transportation options

Stage IV – Technology Verification
42

Stage IV – SmartWay verified Trucks
43

Stage IV – Driver Training E-Learning
44

Stage IV – Online Calculator Tools
45
http://www.epa.gov/smartway/transport/calculators/index.htm#single

Stage IV – Financing Programs
Cleaner
Used Truck
2005 MY Truck on the Used Truck Market
Standard Truck Same Truck with PM Filter
Extend loan by 12 months & lower rate to 6%
46
rate to 6%
Purchase Price: $40,000 $50,000
60 Month Interest Rate:
12% 6%
Monthly Payment: $890 $829 ($61 less)
Total Cost: $53,400 $59,688

Stage IV – Brand Enhancement
SmartWay on EPA’s Green
Vehicle Guide website
Automakers promoting their SmartWay vehicles:
•Chrysler
•Ford
•GM
•Hyundai
47
•Hyundai
•Kia
•Mazda
•Nissan
•Subaru
•Toyota
•Volvo
Banks and credit unions offer discounted loans for SmartWay vehicles

Package Labeling Pilot Program
HP consumer electronics are carried exclusively by SmartWay Carrier Partners
48

49
www.epa.gov/smartway
SmartWay phone center (734) 214-4767
Buddy Polovick (734) 214-4928