smr trading guide
TRANSCRIPT
Table of Contents Pg 1
SMR – The Trader’s Edge
INTRO – Trading with an Edge p. xxHow This Guide Can Help You Create Your Edge
CH. 1 – Trading with the Trend p. xxUsing the 49-Day Moving Average Line: The MA
CH. 2 – Timing the Trade p. xxThe Momentum Oscillators and Buy/Sell Signals
CH. 3 – How to Enter the Trade p. xxUsing Confirmation and Verification to Improve your Odds
CH. 4 – Trading with the Mode p. xxUsing SMR’s Concurrent Mode to Enter Trades
CH. 5 – The SL Divergence p. xxAn Excellent Tool for Pinpointing Price Reversals
CH. 6 – Getting Out p. xxSome Ideas for Exit Strategies
CH. 7 – Keeping a Sharp Edge p. xxTips and Strategies for Better Trading Results
Appendix A – Recommended Reading p. xxTrading Day By Day, by Chick Goslin
Appendix B – Getting Started with SMR Pro p. xxHow to Request your 30-day Free Trial
SMR - The Trader’s Edge CH. 1: Trading with the Trend Pg 2
INTRODUCTION – Trading with an EdgeHow This Guide Can Help You Create Your Edge
XXXXXXXXXXXXXXX(In Progress)

SMR - The Trader’s Edge CH. 1: Trading with the Trend Pg 3
CHAPTER 1 – Trading with The TrendUsing the 49-Day Moving Average Line: the MA
If you are going to trade with the trend (and you should), you need a clear-cut, reliable way to determine the primary trend of a chart – Uptrend, Downtrend, or Flat. The way we determine the trend in this guide is to use the MA line on the SMR chart.
The MA is the Foundation of the SMR ChartWhenever we make a trading decision using the SMR charts, the first step is always to determine the state of the MA. All of the pre-defined Buy/Sell set-ups, which we discuss in detail later in this guide, depend on whether the MA shows the chart to be in an Uptrend, a Downtrend, or a Flat trend.
This chapter discusses how we determine the trend of the chart using the MA.
Markets don’t always trend well. But when they do, the trend is indeed your friend. This chart shows several examples of excellent Buy Signals during an Uptrend, and excellent Sell Signals during a Downtrend.

SMR - The Trader’s Edge CH. 1: Trading with the Trend Pg 4
Defining the Trend of a MarketSo much is said about how you should always trade with the trend. And how “The Trend is Your Friend.” And I agree, absolutely, that you’ll have the best chances for success if you stick only to trades that are with the primary trend.
Yet, even with all this stress on the importance of trading with the trend, it is strange that most trading books fail to provide a clear-cut way to determine the trend of a market.
So when you look at a chart, how do you determine what the trend is? Do you just know by your experience? Or, do you have an objective method that eliminates any guesswork?
It is my belief that an objective, clear-cut definition of trend is the single most important component of a solid trading methodology. Without a clear definition, there is way too much wiggle room in the decision-making process.
Whatever definition of trend you choose to use, it is important to be consistent with your definitions. Don’t bend the rules, even a little. Sticking to a consistent way to determine trend is part of the discipline of good trading. It will pay off in more winnings over the long run.
Did you even realize that the trend of the market depends on how you define the term “trend”? Joe looks at a chart of May Soybeans and says “It’s in an uptrend.” Fred says “No way, Joe, that chart’s in a downtrend. What do you say, Bob?” Bob hesitates for a moment, then says “Hmmm. I’m gonna have to call this one sideways.” Who’s right? Can they all three be right?
Actually, yes, they can all three be right, depending on their personal definitions of trend.
The way we define trend in this Trading Guide is very simple, and completely objective. And it only depends on the behavior of the MA line. Our definition of trend has proven its usefulness by the quality and reliability of the Buy/Sell signals that are based on it.
Let’s talk a little more about the MA, and then we’ll see how we use it to define the trend.

SMR - The Trader’s Edge CH. 1: Trading with the Trend Pg 5
Using the MA to Define the TrendThe MA is the black dotted line in the chart below. It plots a 49-day Simple Moving Average of the closing prices, and it is the tool with which we determine the primary trend of the market.
Why do we use the 49-Day Simple Moving Average to define the trend? It is an arbitrary choice, of course. You could in fact use a 30-day Exponential Moving Average, a 75-day Weighted Moving Average, a MACD indicator, etc., etc.
We use the 49-Day Moving Average (the MA Line) simply because it works quite well over a wide variety of charts, including Indexes, Stocks, Futures, and FOREX. Traders keep coming back to this indicator (or a 50-day MA, essentially the same thing) because it has worked very nicely for years, and continues to work.
The UptrendIn the chart above, we see a market in a very clear uptrend. The MA is slanting up, and every price bar since the second week in August has been completely above the MA.
I still haven’t told you what my definition of trend is. Before I do that, lets take a look at a chart in a Downtrend.

SMR - The Trader’s Edge CH. 1: Trading with the Trend Pg 6
The DowntrendIn the chart below, we have a market that is definitely in a clear Downtrend. The MA is slanting down. While not every bar is completely below the MA, the vast majority of them are. Since the downtrend began, only a tiny fraction of the total price activity has pushed above the MA.
And now, for my definition of Trend…
A Simple and Completely Objective Definition of Primary Trend
If today’s MA is HIGHER than yesterday’s MA, the Market is in an Uptrend.
If today’s MA is LOWER than yesterday’s MA, the Market is in a Downtrend.

SMR - The Trader’s Edge CH. 1: Trading with the Trend Pg 7
Yes, it’s a Simple Definition I admit that this definition is very simple. In fact, some traders might argue that our definition is too simple. They would say that our definition does not take into account whether the latest closing price is above the MA, or below the MA, for example.
Based on the results we have seen with our automated Buy/Sell setups, we have come to realize that our definition of trend is completely adequate, and does not need any other criteria added on to it.
One reason that our definition works is that the MA is a rather slow-changing indicator. It takes a lot of shift in the price action to get a 49-day moving average to switch its direction. So when the MA says it is pointing up, it really does indicate the medium-term momentum of the market is up.
Trading the UptrendThe choice of how to trade a chart in an Uptrend is straightforward. When trading an Uptrend chart, we are looking only for good Buy signals so we can take long positions.
NOTE: None of the Buy/Sell signals that we define and discuss in this Guide are counter-trend signals. We only define trades that are with the primary trend.
Trading the DowntrendLikewise, the choice of how to trade a chart in an Downtrend is equally straightforward. When trading a Downtrend chart, we are looking only for good Sell signals so we can take short positions.
Do We Ever Trade a Flat Trend?Yes, we do have one type of Buy/Sell signal, the “F” signal, that can be triggered when the MA is determined to be Flat. In this type of trade, we look at the whether we have a clear consolidation of the price activity either above or below the MA to determine if we may have a Buy or Sell signal. And yes, we use a very objective definition of a flat trend. We cover all of that in detail in the next chapter.
Don’t Try to Get In Too Early
Only Trade Well-Trending MarketsIf you want to succeed at trading, one of your objectives will be to trade only the well-trending markets, and to avoid the choppy ones. Obviously, you can never know in advance when a well-trending market is suddenly going to become not-so-well-trending, and vice versa. And a big part of the art of successful trading requires having enough experience to be able to tell when the market is acting too choppy for safe entry.
However, if you follow the rules for trade entry set out in this Guide, you will tend to avoid trade entry in the choppy periods of a chart. That’s not a guarantee, but over the long run, you should find that the rules really do help to keep you out of the market during the non-trending periods.

SMR - The Trader’s Edge CH. 1: Trading with the Trend Pg 8
About the MA ExtensionYou may have noticed that, in the chart illustrations, the SMR Pro software adds a heavier, solid “extension” at the end of the MA. This is known as the MA Extension.
So, what is it’s purpose? In the books Intelligent Futures Trading and Trading Day By Day, Chick Goslin suggests that you try to predict which way the MA will be likely be heading over the next 4-5 trading days. You do this by looking back in the chart and seeing which prices are next in line to be dropped off of the calculation of the MA.
By showing the MA Extension, SMR Pro is just doing the work for you. It projects which way the MA will head over the next several trading days, assuming that the closing price will remain flat over that timeframe.
The MA Extension

SMR - The Trader’s Edge CH. 2: Timing the Trade Pg 9
CHAPTER 2 – Timing The TradeThe Momentum Oscillators and Buy/Sell Signals
The SMR trading signals have stood the test of time. They are the favorite indicators among many traders because they just plain work – that is, when you learn how to use them properly. Do they work all of the time? No, of course not. But, they work at least as well, and usually better, than anything else you can stack them up against. That is the consensus opinion among the traders who use them.
How to Improve Your Trading ResultsEnter a market in the right direction, at the right time. Do this more often than the average trader does. Learn from your experiences, and just keep getting better and better at doing it.
This is what we try to do as traders. But, actually doing it is another matter – a whole lot easier said than done, huh?
When you learn how to time your trades using the SMR signals, I believe you can significantly improve your chances of entering the markets in the right direction, and at the right time. In this chapter, I discuss the specific techniques for using the SL and DL momentum oscillators to time your trade entries.
Buy the Dips, Sell the RalliesWhen using the SMR oscillators to time our trades, what we want to find are low-risk, high probability entries in the direction of the primary trend. For the majority of our trades, we wait for short-term pullbacks from the trend so that we can enter our trades with relatively close stop-loss levels.
In an Uptrend, we wait for a short-term dip in price, and try to enter just after the market has started to turn back up. In a Downtrend, we wait for a short-term rally in the price, and attempt to enter the market just after the market has started to turn back down.

SMR - The Trader’s Edge CH. 2: Timing the Trade Pg 10
The SL and DL Momentum Oscillators
The SL (Solid Line) and DL (Dotted Line) Momentum Oscillators are located immediately beneath the price panel in the SMR charts. These indicators oscillate above and below a value of Zero.
In this chapter, we explain in detail how we use these indicators to time our entries into a market. In a nutshell, there are specific trade set-ups which involve the Price, the MA, the DL, and the SL. These set-ups are automatically detected, and then displayed as Buy/Sell signals, by the SMR Pro software.
After you take a little time to become familiar with how these Buy/Sell signals are generated, you will have a better understanding of how the SMR indicators can help to predict profitable moves in price.
SL (Solid Line)DL (Dotted Line)

SMR - The Trader’s Edge CH. 2: Timing the Trade Pg 11
About the SL OscillatorThe Solid Line, or SL, is a fairly simple oscillator that is constructed from short-term moving averages of the price, plus a secret ingredient that is also derived directly from the price action. The function of the SL is to indicate very short-term swings in the price. It helps us to pinpoint the precise timing of our trade, and is also sometimes called the “Signal Line.” It oscillates above and below a value of Zero.
On the SMR Pro screen, both the SL and the DL (the Dotted Line) are plotted in the first lower indicator panel, directly below the Price panel. Even if you choose to add other indicators to your chart, the SL/DL panel will always be immediately below the Price panel.
To use the SL, you look for a reversal in its direction, back toward the direction of the primary trend.
These reversals in the SL can occur above or below Zero, as well as above or below the DL. When we look for Buy/Sell signals, we consider the position of the SL as will as its direction.
There is yet another very important and valuable function of the SL. When there is a divergence between the SL and the price action, highly reliable signals of short-term price reversals are often generated. We will cover the topic of SL Divergence, and explain what we mean by divergence, in a later chapter.
About the DL OscillatorThe Dotted Line, or DL, is a medium-term moving average of the SL. It helps to find the medium term “momentum” of the market, and so it can also be called the “Momentum Line.” It moves slower than the SL, so we don’t use it for precise trade timing. Instead, it is a happy medium between the MA (long-term, primary trend indicator) and the SL (short-term swing indicator).
In this chapter, we primarily consider the position of the DL (above or below Zero) rather than its direction (pointing UP or pointing DOWN).
For a special class of set-ups we discuss in a later chapter, the direction of the DL does become important. However, for the formation of the primary Buy/Sell signals (the ones discussed in this chapter), we don’t need to be concerned about the DL’s direction.

SMR - The Trader’s Edge CH. 2: Timing the Trade Pg 12
The Position of the DL Helps to Confirm the Trend
In this chart of Live Cattle, notice how the DL (Dotted Line) stays above Zero during the Uptrend phase of the market, and then stays below Zero during the Downtrend phase. This is typically how the DL behaves in well-trending markets. For that reason, this kind of DL action serves to confirm that a market is trending well.
NOTE: Even when a market is trending well, the DL can occasionally dip or rise across the zero line briefly. This does not mean the trend has been broken, as long as the MA indicates that the trend is still in place. What it means, though, is that the price is making a pullback, so we should be on the lookout for a possible entry signal.
About the DL ExtensionThe solid heavier line at the end of the DL is the DL Extension. It works just like the MA Extension. It predicts the direction that the DL will head over the next several days, based on the prices that are next in line to be dropped from the calculation of the DL.
DL below ZeroDL above Zero

SMR - The Trader’s Edge CH. 2: Timing the Trade Pg 13
Trade Set-Ups using the SL and DL Momentum OscillatorsNow that we’ve covered all the background material, let’s get into the fun stuff. Let’s cover some specifics on how we use the SMR indicators to time our trade entries.
SMR has identified eight primary trade set-ups that we call the Buy/Sell signals. These signals are produced by a set of rules that are based on the price action, together with the action of the SL, DL, and MA indicators.
The 4 Buy Signals The 4 Sell SignalsBuy-A Sell-ABuy-B Sell-BBuy-C Sell-CBuy-F Sell-F
We will examine each of these signals and show plenty of chart examples.
Take some time to get familiar with the rules for these Buy/Sell signals, and you will have a good understanding of how the SMR indicators work.
The SMR Pro software automatically generates the Buy/Sell Signals and displays them as green and red arrows.
Buy-B
Buy-B
Buy-B
Buy-B
Sell-B

SMR - The Trader’s Edge CH. 2: Timing the Trade Pg 14
The B SignalsWe’ll start with the Buy-B and Sell-B Signals. These are the most basic, and the most common, of the Buy/Sell Signals.
The Buy-B Signal
The Buy-B Signal is generated when the MA is headed UP, the DL is ABOVE Zero, the SL is BELOW Zero, and the SL has just turned UP.
Here is how the Buy-B signal looks on the day the signal is generated.
NOTE: The horizontal blue line in the SL/DL section of the chart is the Zero Line.
Here is how the same chart looks after the Buy-B signal was successful.
Notice how the DL was headed down, then flattens out and turns up again.
Notice how the SL forms a “V” shape.
This is an example of what I would call the “classic” Buy-B signal.
Buy-B
Buy-B
Zero Line

SMR - The Trader’s Edge CH. 2: Timing the Trade Pg 15
The B Signals (cont’d)
The Sell-B Signal
The Sell-B Signal is generated when the MA is headed DOWN, the DL is BELOW Zero, the SL is ABOVE Zero, and the SL has just turned DOWN.
Here is how the Sell-B signal looks on the day the signal is generated.
Here is how the same chart looks after the Sell-B signal was successful.
Notice how the DL was headed up, then flattens out and turns slightly down.
Notice how the SL forms a “V” shape. In this case, it’s an inverted “V.”
This is an example of what I would call the “classic” Sell-B signal.
Sell-B
Sell-B

SMR - The Trader’s Edge CH. 2: Timing the Trade Pg 16
The B Signals (cont’d)
The Rules for the Buy-B Signal
1) Today’s MA > Yesterday’s MA2) Yesterday’s DL >= 03) Yesterday’s SL <= 04) SL has just turned UP
Rule 1) for the Buy-B signal is our definition of Uptrend: Today’s MA is higher than Yesterday’s MA.
Rule 2) means that the DL is above the Zero line, or right at it.
Rule 3) requires that the SL has gone below the Zero line, or is sitting right at it.
Rule 4) means that the short-term momentum has just turned back UP.
The Rules for the Sell-B Signal
1) Today’s MA < Yesterday’s MA2) Yesterday’s DL <= 03) Yesterday’s SL >= 04) SL has just turned DOWN
The rules for the Sell-B Signal are just the reverse of the rules for the Buy-B Signal. The trend is DOWN, the DL is below the Zero line, the SL is above the Zero line, and the SL has just turned DOWN.
Next, let’s look at some real-life chart examples of the Buy-B and Sell-B Signals.

SMR - The Trader’s Edge CH. 2: Timing the Trade Pg 17
The B Signals (cont’d)
Here are a series of Buy-B Signals in an Uptrend. Notice how, at each of these signals, the SL dips below zero, while the DL remains above zero.
Buy-B
Buy-BBuy-B
Buy-B

SMR - The Trader’s Edge CH. 2: Timing the Trade Pg 18
The B Signals (cont’d)
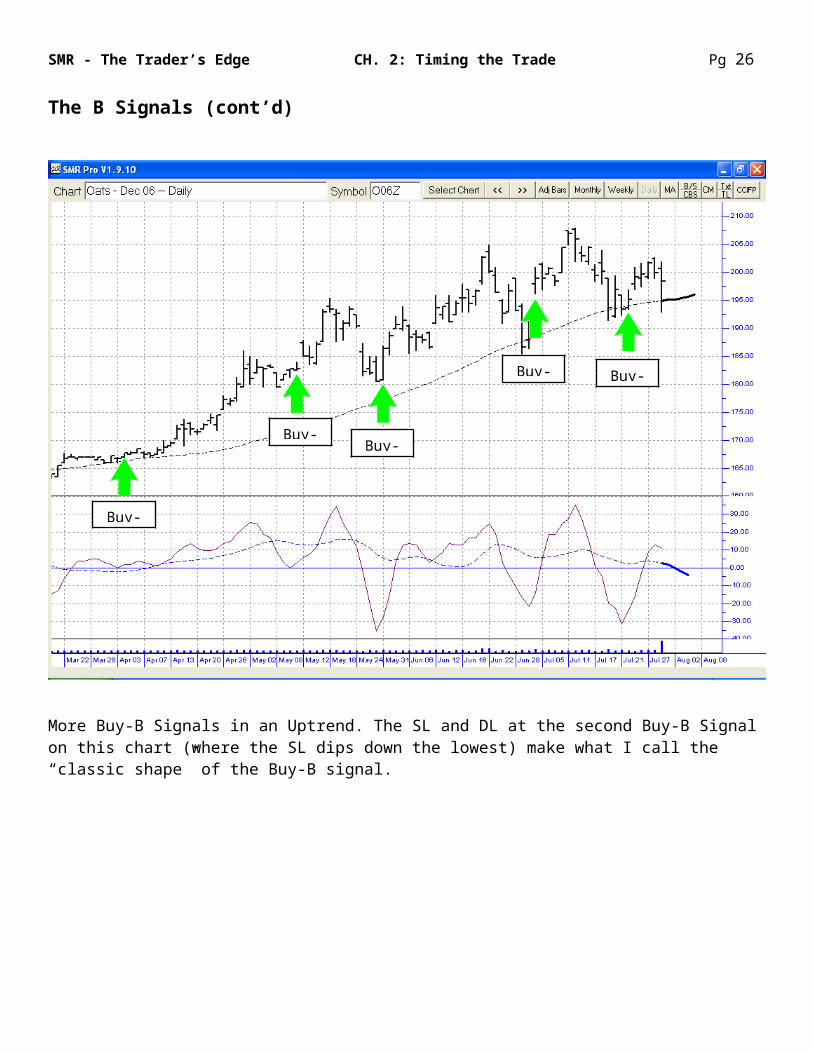
More Buy-B Signals in an Uptrend. The SL and DL at the second Buy-B Signal on this chart (where the SL dips down the lowest) make what I call the “classic shape” of the Buy-B signal.
Buy-BBuy-B
Buy-BBuy-B
Buy-C

SMR - The Trader’s Edge CH. 2: Timing the Trade Pg 19
The B Signals (cont’d)
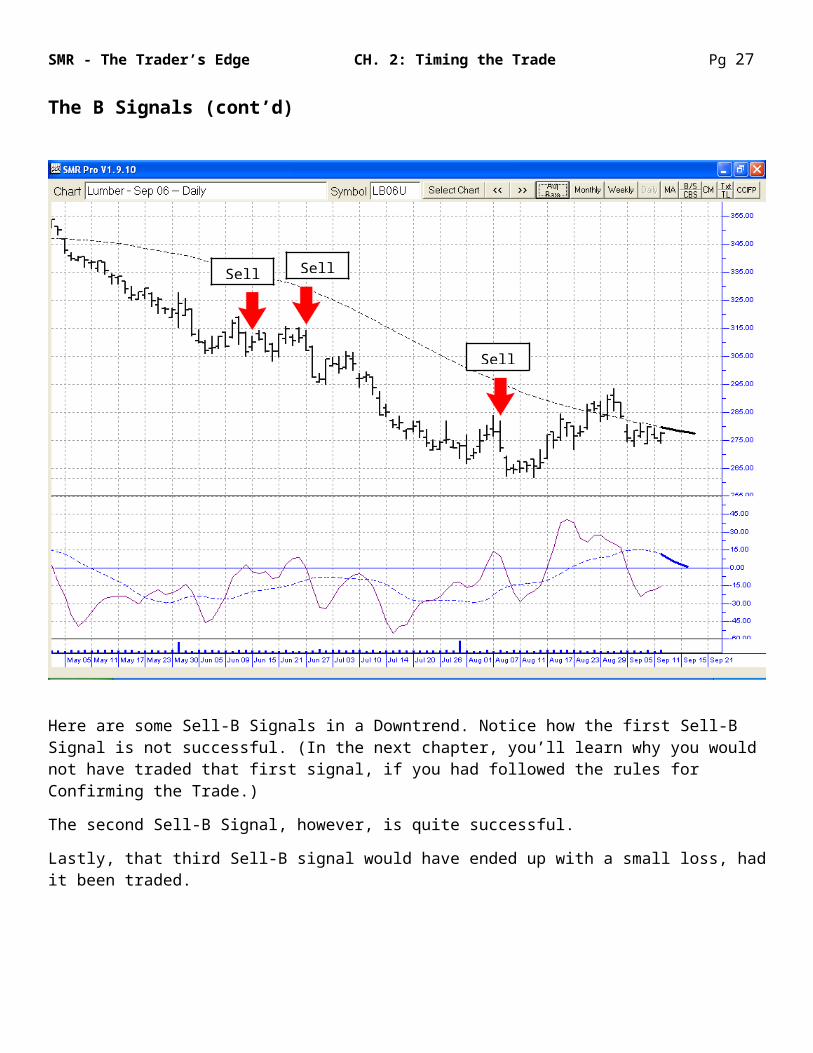
Here are some Sell-B Signals in a Downtrend. Notice how the first Sell-B Signal is not successful. (In the next chapter, you’ll learn why you would not have traded that first signal, if you had followed the rules for Confirming the Trade.)
The second Sell-B Signal, however, is quite successful.
Lastly, that third Sell-B signal would have ended up with a small loss, had it been traded.
Sell-B
Sell-BSell-B

SMR - The Trader’s Edge CH. 2: Timing the Trade Pg 20
The B Signals (cont’d)
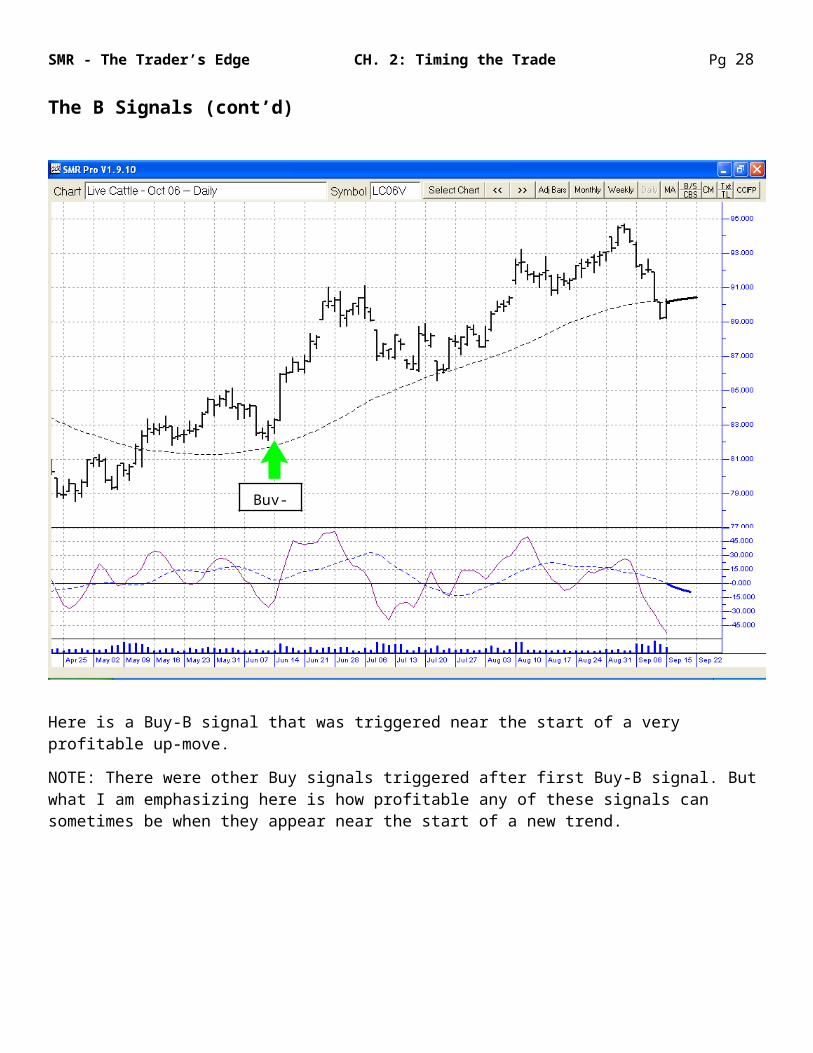
Here is a Buy-B signal that was triggered near the start of a very profitable up-move.
NOTE: There were other Buy signals triggered after first Buy-B signal. But what I am emphasizing here is how profitable any of these signals can sometimes be when they appear near the start of a new trend.
Buy-B

SMR - The Trader’s Edge CH. 2: Timing the Trade Pg 21
The B Signals (cont’d)
Here is a whole series of Buy-B signals on a Stock chart. Notice how getting in early on this up-move would have paid off very nicely, with around a 50% gain.
NOTE: In the following chapter, we give you additional tools for improving your odds for success with the Buy/Sell signals. We show you how to enter only when the probabilities for a winning trade are greatest. So, following those guidelines, you would enter the first Buy-B signal, and then you would know how to “pick and choose” among the remaining Buy-B signals on this chart.
Buy-B
Buy-BBuy-B
Buy-BBuy-B
Buy-B
Buy-B
Sell-A

SMR - The Trader’s Edge CH. 2: Timing the Trade Pg 22
The B Signals (cont’d)
Here is a series of Sell-B signals during a Downtrend on a Stock chart.
Buy-B
Sell-B Sell-BSell-B
Sell-B

SMR - The Trader’s Edge CH. 2: Timing the Trade Pg 23
The C SignalsThe C Signals are probably triggered less frequently than any of the others. But when they do occur, they can often signal the start of a very profitable trend. They can also just be a good continuation signal, much like the B Signal.
The Buy-C Signal
The Buy-C Signal is generated when the MA is headed UP, the DL is BELOW Zero, the SL is ABOVE the DL, and the SL has just turned UP.
For the Buy-C Signal, the SL can be either ABOVE or BELOW Zero, but it must be ABOVE the DL.
There are also price conditions for the Buy-C signal: 1) today’s closing price must be HIGHER than yesterday’s closing price; and 2) today’s closing price must be HIGHER than at least one of the closing prices of 10, 11, or 12 days ago.
Here is how the Buy-C signal looks on the day the signal is generated.
Here is how the same chart looks after the Buy-C signal was successful.
Notice how, as soon as the Buy-C Signal is triggered, the SL, DL, and MA are all headed UP. This will very often be the case with the Buy-C signal.
In this example, the Buy-C signal was followed by a successful Buy-B signal.
Buy-C
Buy-C
Buy-B

SMR - The Trader’s Edge CH. 2: Timing the Trade Pg 24
The C Signals (cont’d)
The Sell-C Signal
The Sell-C Signal is generated when the MA is headed DOWN, the DL is ABOVE Zero, the SL is BELOW the DL, and the SL has just turned DOWN.
For the Sell-C Signal, the SL can be either ABOVE or BELOW Zero, but it must be BELOW the DL.
There are also price conditions for the Sell-C signal: 1) today’s closing price must be LOWER than yesterday’s closing price; and 2) today’s closing price must be LOWER than at least one of the closing prices of 10, 11, or 12 days ago.
Here is how the Sell-C signal looks on the day the signal is generated.
Here is how the same chart looks after the Sell-C signal was successful.
Notice how, as soon as the Sell-C signal is triggered, the SL, DL, and MA are all headed DOWN. This will very often be the case with the Sell-C signal.
Sell-C
Sell-C

SMR - The Trader’s Edge CH. 2: Timing the Trade Pg 25
The C Signals (cont’d)
The Rules for the Buy-C Signal
1) Today’s MA > Yesterday’s MA2) Yesterday’s DL <= 03) Yesterday’s SL > Yesterday’s DL4) SL has just turned UP5) Today’s Close > Yesterday’s Close6) Today’s Close > Close of 10, 11, -or- 12 Days Ago
Rule 1) requires that the chart must be in an Uptrend.
Rule 2) requires that the DL must be below Zero. This means that either a) there has been some pullback in the price action, or b) the chart has recently shifted from Downtrend to Uptrend
Rule 3) requires that the SL be above the DL. This improves the probability of a successful trade, based on observation of historic chart behavior.
Rule 4) means that the short-term momentum has just turned back UP.
Rules 5) and 6) insure that today’s price is breaking out above recent price activity.
The Rules for the Sell-C Signal
1) Today’s MA < Yesterday’s MA2) Yesterday’s DL >= 03) Yesterday’s SL < Yesterday’s DL4) SL has just turned DOWN5) Today’s Close < Yesterday’s Close6) Today’s Close < Close of 10, 11, -or- 12 Days Ago
The rules for the Sell-C Signal are just the reverse of the rules for the Buy-C Signal.
Rule 1) requires that the chart must be in a Downtrend.
Rule 2) requires that the DL must be above Zero. This means that either a) there has been some pullback to the downward price action, or b) the chart has recently shifted from Uptrend to Downtrend
Rule 3) requires that the SL be below the DL.
Rule 4) means that the short-term momentum has just turned back DOWN.
Rules 5) and 6) insure that today’s price is breaking out below recent price activity.
Let’s look at some real-life chart examples of the Buy-C and Sell-C Signals.
SMR - The Trader’s Edge CH. 2: Timing the Trade Pg 26
The C Signals (cont’d)
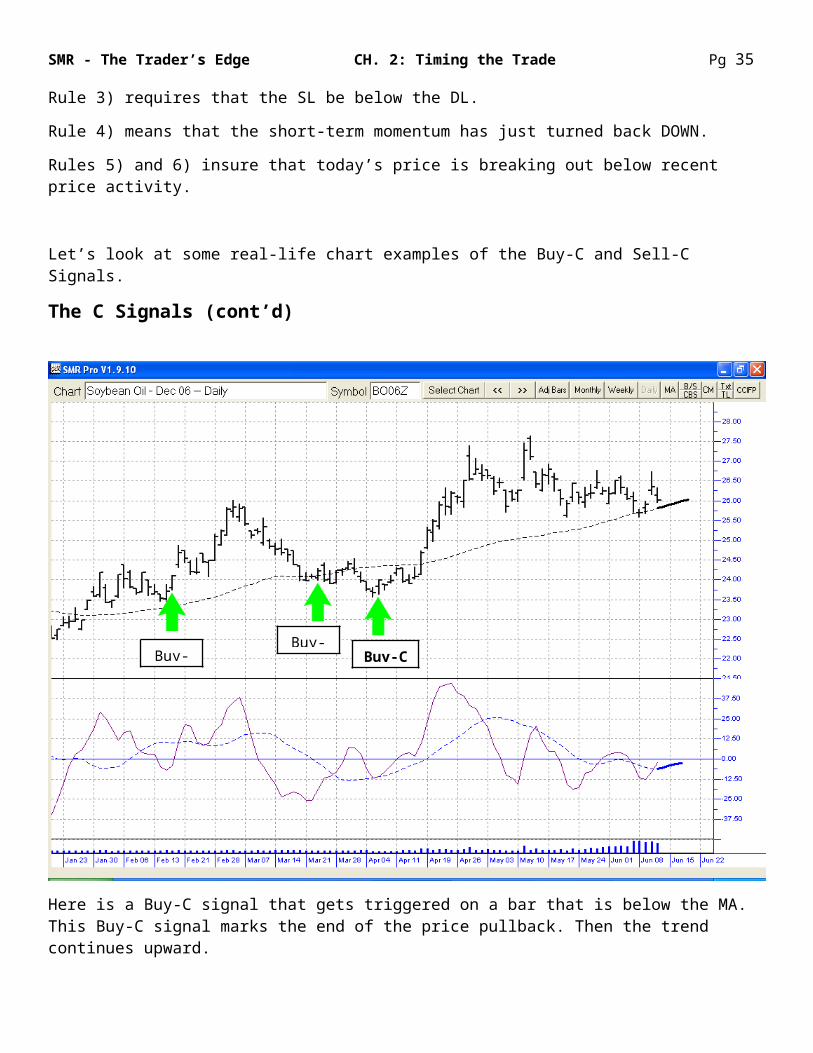
Here is a Buy-C signal that gets triggered on a bar that is below the MA. This Buy-C signal marks the end of the price pullback. Then the trend continues upward.
Buy-CBuy-B
Buy-B
SMR - The Trader’s Edge CH. 2: Timing the Trade Pg 27
The C Signals (cont’d)
Here is a Buy-C signal that occurs at a bar that closes just slightly above the MA.
NOTE: When any Buy signal (A, B, C, or F) occurs on the same day as an uptick bar though the MA, or a gap up through the MA, it is a sign of extra validation for that signal. Tall uptick bars through the MA are especially good signs for a Buy signal.
In the chart above, the Buy-C signal occurs on the same day as an uptick bar through the MA.
Buy-B
Buy-B Buy-C
SMR - The Trader’s Edge CH. 2: Timing the Trade Pg 28
The C Signals (cont’d)
Here we have two Sell-C signals in a downtrending market. Notice how, in both cases, the DL is above (or just at) the Zero line, and the SL makes its downturn below the DL.
Sell-C
Sell-C
Sell-A

SMR - The Trader’s Edge CH. 2: Timing the Trade Pg 29
The C Signals (cont’d)
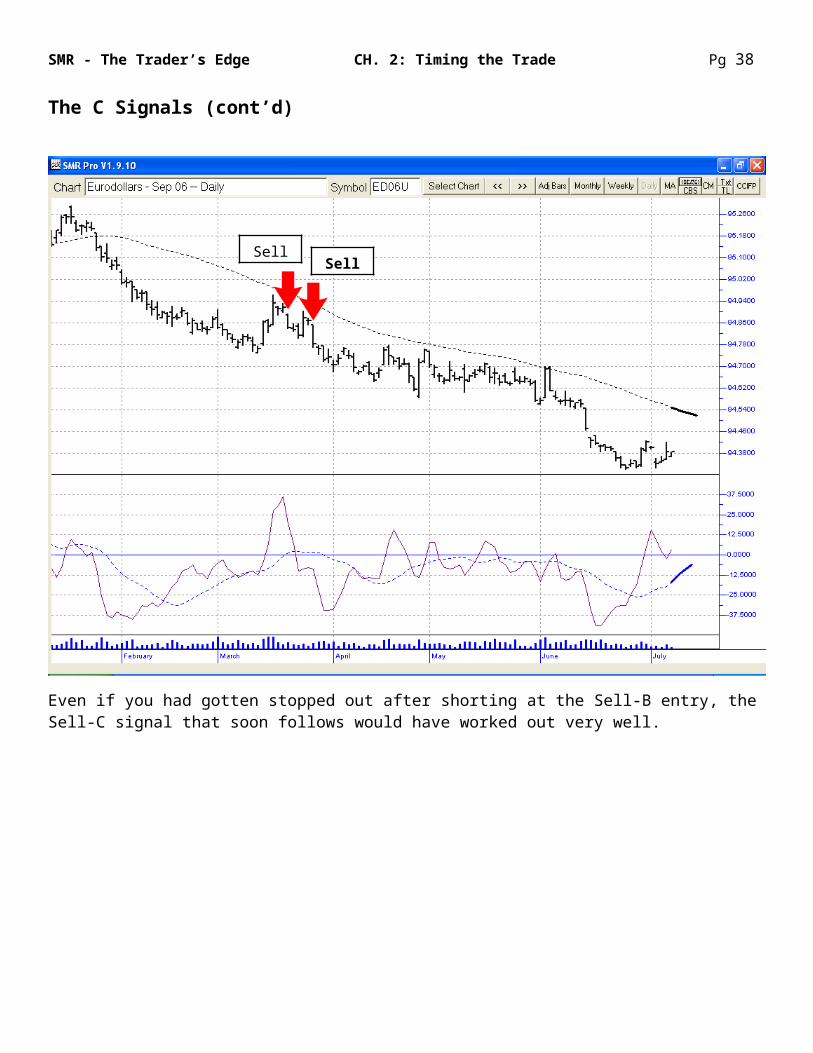
Even if you had gotten stopped out after shorting at the Sell-B entry, the Sell-C signal that soon follows would have worked out very well.
Sell-CSell-B

SMR - The Trader’s Edge CH. 2: Timing the Trade Pg 30
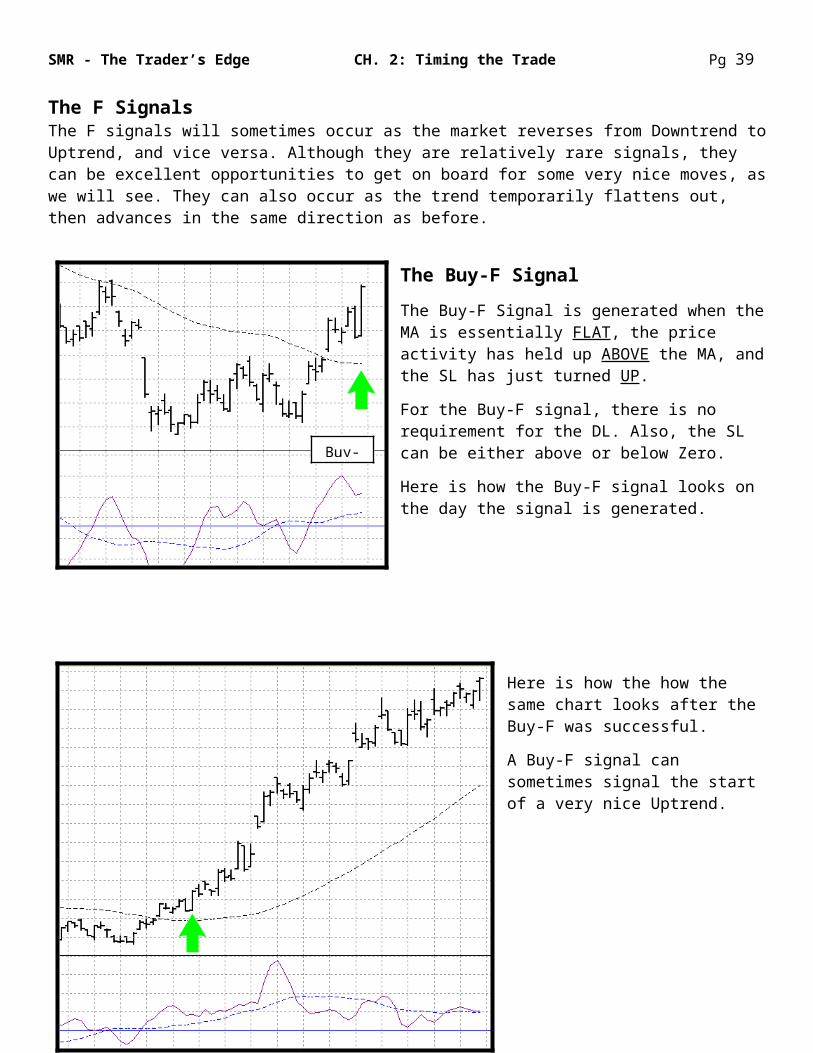
The F SignalsThe F signals will sometimes occur as the market reverses from Downtrend to Uptrend, and vice versa. Although they are relatively rare signals, they can be excellent opportunities to get on board for some very nice moves, as we will see. They can also occur as the trend temporarily flattens out, then advances in the same direction as before.
The Buy-F Signal
The Buy-F Signal is generated when the MA is essentially FLAT, the price activity has held up ABOVE the MA, and the SL has just turned UP.
For the Buy-F signal, there is no requirement for the DL. Also, the SL can be either above or below Zero.
Here is how the Buy-F signal looks on the day the signal is generated.
Here is how the how the same chart looks after the Buy-F was successful.
A Buy-F signal can sometimes signal the start of a very nice Uptrend.
Buy-F
Buy-F

SMR - The Trader’s Edge CH. 2: Timing the Trade Pg 31
The F Signals (cont’d)
The Sell-F Signal
The Sell-F Signal is generated when the MA is essentially FLAT, the price activity has been contained BELOW the MA, and the SL has just turned DOWN.
For the Sell-F signal, there is no requirement for the DL. Also, the SL can be either above or below Zero.
Here is how the Sell-F signal looks on the day the signal is generated.
Here is how the how the same chart looks after the Sell-F was successful.
A Sell-F signal can sometimes signal the start of a very nice Downtrend.
Sell-F
Sell-F

SMR - The Trader’s Edge CH. 2: Timing the Trade Pg 32
The F Signals (cont’d)
The Rules for the Buy-F Signal
1) The MA is essentially Flat2) At least 4 of the last 5 Low prices are ABOVE the MA3) SL has just turned UP
Rule 1) requires that the chart is neither in a clear Uptrend or Downtrend. That is, the MA has NOT been steadily increasing over the last 4 trading days, nor has it been steadily decreasing over the last 4 trading days.
Rule 2) means that price action has formed a consolidation ABOVE the MA.
Rule 3) means that the short-term price momentum has just turned UP.
The Rules for the Sell-F Signal
1) The MA is essentially Flat2) At least 4 of the last 5 High prices are BELOW the MA3) SL has just turned UP
The rules for the Sell-F Signal are just the reverse of the rules for the Buy-F Signal, except that Rule 1) is the same in both cases.
Rule 2) means that price action has formed a consolidation BELOW the MA.
Rule 3) means that the short-term price momentum has just turned DOWN.
Now, let’s look at some real-life chart examples of the Buy-F and Sell-F Signals.

SMR - The Trader’s Edge CH. 2: Timing the Trade Pg 33
The F Signals (cont’d)
Here is what can happen when the Buy-F signal works out extremely well. The market had been in a rather shallow Downtrend, then it decides to take off to the upside in a big way. The Buy-F signal allowed us to hop on board the train just as the trend is beginning to turn up.
NOTE: Sometimes the market moves too fast for even the Buy-F signal to get triggered. Luckily, we have yet another way to catch those kinds of moves, which we will show you in a later chapter.
Buy-F
Buy-B

SMR - The Trader’s Edge CH. 2: Timing the Trade Pg 34
The F Signals (cont’d)
Here is an example of a Buy-F signal that catches the reversal from Downtrend to Uptrend on a Stock chart.
Buy-F
Buy-B
Buy-B
SMR - The Trader’s Edge CH. 2: Timing the Trade Pg 35
The F Signals (cont’d)
Even though the previous Buy-B signal doesn’t work out for us, the Sell-F signal more than makes up for it.
The Sell-F signals can work as well to the downside as the Buy-F can to the upside.
Buy-B
Sell-F
Sell-B

SMR - The Trader’s Edge CH. 2: Timing the Trade Pg 36
The F Signals (cont’d)
Another very nice example of a Sell-F success. Notice how the Sell-F gets triggered just as the MA is rolling over to the downside.
Sell-F

SMR - The Trader’s Edge CH. 2: Timing the Trade Pg 37
The A SignalsLike the C Signals and F Signals, the A Signals do not occur nearly as frequently as the B Signals. But when these babies work out, they can really smoke. Like the F Signals, they can often get you in at the start of some very good price moves.
The Buy-A Signal
The Buy-A Signal is generated when the MA is headed UP, the DL is BELOW Zero, and the SL has just crossed ABOVE the DL from below.
There are also price conditions for the Buy-A signal: 1) today’s closing price must be HIGHER than yesterday’s closing price; and 2) today’s closing price must be HIGHER than at least one of the closing prices of 10, 11, or 12 days ago.
Here is how the Buy-A signal looks on the day the signal is generated.
Here is how the same chart looks after the Buy-A signal was successful.
Like the Buy-F signal, the Buy-A signal will sometimes get triggered just as the market is reversing over to an Uptrend.
Buy-A
Buy-A
SMR - The Trader’s Edge CH. 2: Timing the Trade Pg 38
The A Signals (cont’d)
The Sell-A Signal
The Sell-A Signal is generated when the MA is headed DOWN, the DL is ABOVE Zero, and the SL has just crossed BELOW the DL from above.
There are also price conditions for the Sell-A signal: 1) today’s closing price must be LOWER than yesterday’s closing price; and 2) today’s closing price must be LOWER than at least one of the closing prices of 10, 11, or 12 days ago.
Here is how the Sell-A signal looks on the day the signal is generated.
Here is how the same chart looks after the Sell-A signal was successful.
I always like to see Buy-A and Sell-B signals, because they tend to be the most reliable of all of them.
Sell-A
Sell-A
SMR - The Trader’s Edge CH. 2: Timing the Trade Pg 39
The A Signals (cont’d)
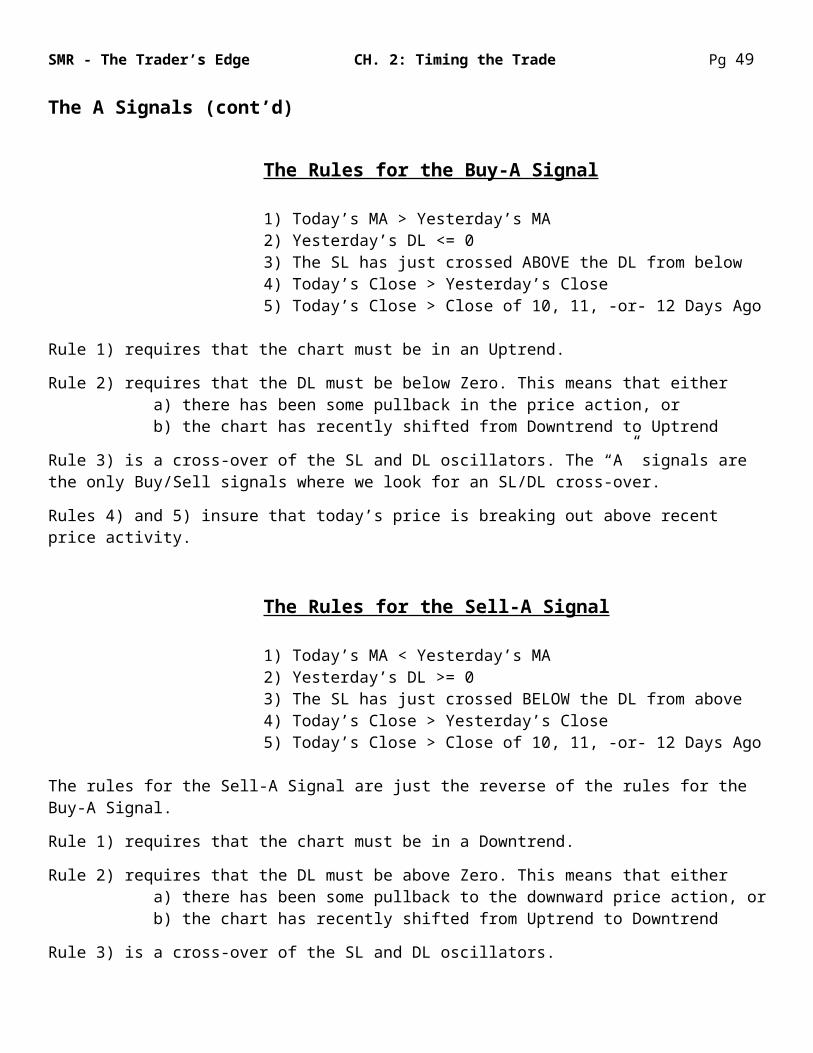
The Rules for the Buy-A Signal
1) Today’s MA > Yesterday’s MA2) Yesterday’s DL <= 03) The SL has just crossed ABOVE the DL from below4) Today’s Close > Yesterday’s Close5) Today’s Close > Close of 10, 11, -or- 12 Days Ago
Rule 1) requires that the chart must be in an Uptrend.
Rule 2) requires that the DL must be below Zero. This means that either a) there has been some pullback in the price action, or b) the chart has recently shifted from Downtrend to Uptrend
Rule 3) is a cross-over of the SL and DL oscillators. The “A” signals are the only Buy/Sell signals where we look for an SL/DL cross-over.
Rules 4) and 5) insure that today’s price is breaking out above recent price activity.
The Rules for the Sell-A Signal
1) Today’s MA < Yesterday’s MA2) Yesterday’s DL >= 03) The SL has just crossed BELOW the DL from above4) Today’s Close > Yesterday’s Close5) Today’s Close > Close of 10, 11, -or- 12 Days Ago
The rules for the Sell-A Signal are just the reverse of the rules for the Buy-A Signal.
Rule 1) requires that the chart must be in a Downtrend.
Rule 2) requires that the DL must be above Zero. This means that either a) there has been some pullback to the downward price action, or b) the chart has recently shifted from Uptrend to Downtrend
Rule 3) is a cross-over of the SL and DL oscillators.
Rules 4) and 5) insure that today’s price is breaking out below recent price activity.
Let’s look at some real-life chart examples of the Buy-A and Sell-A Signals.

SMR - The Trader’s Edge CH. 2: Timing the Trade Pg 40
The A Signals (cont’d)
Even though the market pulls back some after the Buy-F signal, it really takes off after the Buy-A signal.
Buy-F
Buy-BBuy-B
Buy-A

SMR - The Trader’s Edge CH. 2: Timing the Trade Pg 41
The A Signals (cont’d)
The Buy-A signals can mark the beginning of an upmove, or they can just be good continuation signals, as in this chart.
Buy-B
Buy-B
Buy-A
Buy-A

SMR - The Trader’s Edge CH. 2: Timing the Trade Pg 42
The A Signals (cont’d)
Here are Buy-A continuation signals on a Stock chart that provide excellent places to initiate or add to market positions.
Buy-B
Buy-BBuy-B
Buy-A
Buy-A

SMR - The Trader’s Edge CH. 2: Timing the Trade Pg 43
The A Signals (cont’d)
Here is another example of how the Buy-A signal lets you get in the game very early in the move.
Buy-ABuy-B
Buy-B
Buy-BBuy-B
Buy-B
Buy-B
Sell-B

SMR - The Trader’s Edge CH. 2: Timing the Trade Pg 44
The A Signals (cont’d)
Here we have a series of sell signals that are just so-so, and then the Sell-A comes in and really gets things rolling.
Sell-A
Buy-B
Sell-B
Sell-BSell-BSell-F
Buy-B

SMR - The Trader’s Edge CH. 2: Timing the Trade Pg 45
The A Signals (cont’d)
Remember what I said about a gap through the MA? Here is a Sell-A signal that occurs on the same day as a price gap down through the MA. The gap through the MA adds an extra piece of validation to the Sell-A signal.
Sell-B
Buy-B
Sell-A

SMR - The Trader’s Edge CH. 2: Timing the Trade Pg 46
The A Signals (cont’d)
Sometimes you will see two Buy-A or two Sell-A signals in a row. If the first one doesn’t work out, the second signal very often will.
Now, speaking of signals not working out…
Obviously, I have shown some of the very best examples of these Buy/Sell signals. They won’t all be this good. You will have some winners, some break-evens, and some losers. That, or course, is the nature of this crazy business.
There is some good news. There are some very easy-to-apply techniques to put more of the odds in your favor, every time you make a trade. That’s what we’ll look at next.
Sell-A Sell-A
Sell-B

SMR - The Trader’s Edge CH. 3: How to Enter The Trade Pg 47
CHAPTER 3 – How to Enter the TradeUsing Confirmation and Verification to Improve Your Odds for Success
In the previous chapter, we looked at the various Buy/Sell signals that SMR Pro provides for timing the trades. Now, we’ll take a look into the specifics of how to enter the trades.
Always Wait for the Buy/Sell Signals to be Confirmed!The Buy/Sell signals we just learned about are pretty good signals. However, if you just jumped into each and every Buy/Sell set-up on the next trading day, your trading results would probably not be very good.
Luckily, there is a very simple and objective method you can use to confirm every signal before you enter.
If you always wait for the Buy/Sell signals to be confirmed, you will increase your overall percentage of winning trades very substantially.
The rules for confirming the Buy and Sell signals are very simple.
For a Buy Signal, only enter the trade if the price trades ABOVE the High of the Signal Day within the next 2 trading days.
For a Sell Signal, only enter the trade if the price trades BELOW the Low of the Signal Day within the next 2 trading days.
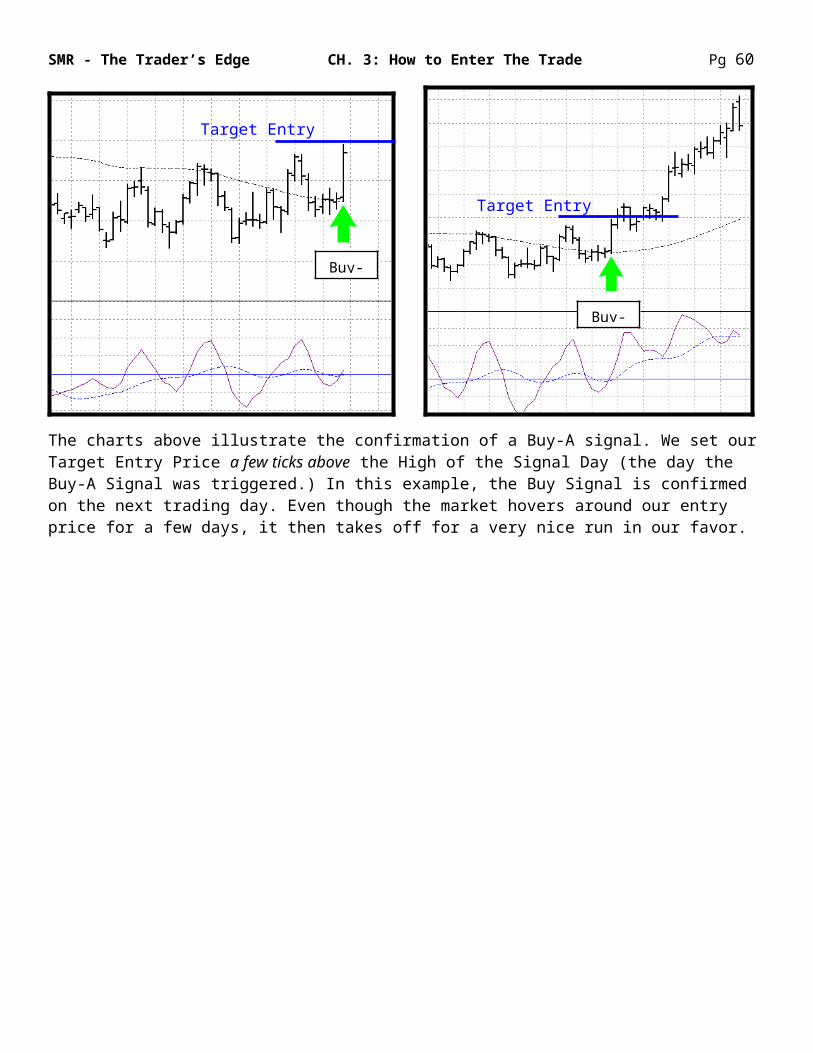
The charts above illustrate the confirmation of a Buy-A signal. We set our Target Entry Price a few ticks above the High of the Signal Day (the day the Buy-A Signal was triggered.) In this example, the Buy Signal is confirmed on the next trading day. Even though the market hovers around our entry price for a few days, it then takes off for a very nice run in our favor.
Target Entry Price
Target Entry Price
Buy-A
Buy-A

SMR - The Trader’s Edge CH. 3: How to Enter The Trade Pg 48
Some Confirmation Examples
Here’s an example of a Sell-B signal that confirmed very nicely on the next trading day. Notice how we set our Target Entry Price a few ticks below the Low of the Signal Day.
Above are two good examples of why it’s a smart idea to wait for confirmation. Even though Buy/Sell signals were triggered, waiting for the price to confirm the signals would have kept you out of these losing trades.
Sell-BSell-B
Buy-B
Sell-F
Target Entry Price
Target Entry Price
Target Entry Price
Target Entry Price
SMR - The Trader’s Edge CH. 3: How to Enter The Trade Pg 49
More Confirmation Examples
The chart above shows a series of Buy signals in a shallow Uptrend. The only signal that does not result in a winning trade is the signal that failed to confirm. Notice that the confirmation does come on the third day, but then the prices move sideways. Sticking to the 2-day rule for trade confirmation will tend to keep you out of losing trades.
The chart to the left shows a big price gap on the open, which occurs the first day after the Signal day. My advice is to avoid chasing these big gaps. If I wanted to trade this Buy-B Signal, I would wait for the price to come down closer to the Target Entry Price. In this example, that is exactly what the price does on the second day after the Signal day.
You will often see that big gaps on the first day after the Signal day indicate trades that do not pan out very well.
However, if a market makes a big gap, and then takes off without me, I simply wait for another Buy or Sell signal to be triggered before attempting to enter that market.
Buy-BBuy-B
Buy-B
Buy-F
This Signal did NOT Confirm within 2 days
Opening Price Gap on Day 1
Target Entry Price
Buy-B

SMR - The Trader’s Edge CH. 3: How to Enter The Trade Pg 50
Better Entry Price –vs– Improved Trading ResultsSome traders, when presented with this idea of signal confirmation, may be saying to themselves, “Hey, if I ‘jump the gun’ and enter the trade on the first day, before the price gets to the confirmation point, I can enter the trade at a better price.” Yes, you can enter the trade early, but you will have a lot more losers that way.
The whole point of confirming the trade is to improve your win-to-loss ratio. Those little bits of extra profits you will obtain, by getting in on the winners too early, will be eaten up many times over by the additional losses you will sustain from the increased number of losing trades.
By the same token, that little bit of price advantage that you will sacrifice, by waiting for confirmation, is a small price to pay to reap the reward of an increased percentage of winning trades.
It is no contest: the trader who waits for confirmation will have much better overall results than the trader who jumps in too early to get the better price.
If you are serious about your trading success, you will do everything you can to improve your odds of a winning trade. Waiting for confirmation of a Buy/Sell signal is the simplest and most objective tool you can use to improve those odds.
Get This: Confirmation Automatically Improves Your OddsThe chart above shows that, basically, the price can do only one of four things every time you place an order to enter a trade: 1) It never reaches your Target Entry Price (the “Never-Confirmed” path). 2) It reaches your Target Entry Price, then turns against you (the “Lose” path). 3) It reaches your Target Entry Price, then drifts sideways (the “Break-Even” path). 4) It breaks through your Target Entry Price, then runs in your favor (the “WIN” path).
This is the only guarantee you will ever get in trading: by using Confirmation, you automatically eliminate a whole class of possible outcomes from the “loser” category, which guarantees you a higher percentage of winners and break-evens.
WINBreak-Even
Lose
Never-Confirmed
Use Confirmation!
That way, you will automatically eliminate this whole class of losing outcomes from your overall trading results.Buy Signal

SMR - The Trader’s Edge CH. 3: How to Enter The Trade Pg 51
Plan Your Trades in AdvanceAlways go into your trades with a plan. Give yourself plenty of time before the market opens, and determine all the price levels for your trade entries.
Having a plan in advance helps keeps you detached from the emotions of trading. If you stick to your plan, it’s more likely you will be calm and objective when you place your trading orders.
Buy Signals
For long trades, determine your Target Entry Price, your Max Entry Price, and your Initial Sell-Stop level.
The Max Entry Price is the highest price you would be willing to enter the trade, if the market has already moved above your Target Entry Price.
Sell Signals
For short trades, determine your Target Entry Price, your Min Entry Price, and your Initial Buy-Stop level.
The Min Entry Price is the lowest price you would be willing to enter the trade, if the market has already moved below your Target Entry Price.
Target Entry Price
Max Entry Price
Initial Sell-Stop
Target Entry Price
Min Entry Price
Initial Buy-Stop
Sell Signal
Buy Signal

SMR - The Trader’s Edge CH. 3: How to Enter The Trade Pg 52
Guidelines for Trade Entry when using Confirmation
1. How do you set the Target Entry Price for your trade? How many ticks are “a few ticks”? There is no cut-and-dried answer. But just by looking at the chart history and the recent price activity, you should be able to judge where a good entry point would be. For example, if you are considering a Buy signal, and you see several instances where entering at two ticks above the Signal Day High would have resulted in losing trades, you might choose to use a three-tick to five-tick margin to set the Target Entry Price. And of course, it is always a good idea to avoid numbers that are too round. For example, 219-3/4 is a better choice than 220-0.
2. It is good trading practice to take your time and already have all your price levels determined well in advance of the market open. Mark each chart with your Target Entry Price, your Max or Min Entry Price, and your Initial Stop level.
3. Whenever you can, I suggest waiting for the market to open. Then check the latest price before placing the trade.
4. If the Market has not yet reached your Target Entry Price, I suggest placing a Stop order at the Target Entry Price. This is the simplest way to be sure you will enter the trade only if the Signal is confirmed.
5. If the Market has already moved beyond your Target Entry Price, then it is your call as to how willing you are to “chase” the price beyond your Target Entry Price.
6. If you want to be a disciplined trader, you should never enter the trade beyond your Max/Min Entry Price. So, if the Market has already traded beyond your Max/Min Entry Price, you could choose to place a Limit order at any point between your Max/Min Entry Price and Target Entry Price. You may miss a few winning trades that way, but it will make you a better trader if you always follow your plan.
7. Remember that Markets which make big gaps on the Open are often sending a warning that the trade may not be a good one. However, if the Market does “take off” without you, it is better trading practice to sit this Signal out, rather than to chase the market by entering beyond your Max or Min Entry Price. If a decent trend develops, there will almost always be another chance to get on board.
8. If the Market does not reach your Target Entry Price on the first trading day after the Signal Day, the Buy/Sell signal is still valid. The guidelines for trade entry on the second day are exactly the same as above.
9. If the Market still has not reached your Target Entry Price by the end of the second trading day after the Signal Day, then consider the Buy/Sell Signal as no longer valid. Move on and look for the next good opportunity.

SMR - The Trader’s Edge CH. 3: How to Enter The Trade Pg 53
Another Way to Improve Your Odds: Verification of the “B” Signals
Using confirmation of the Buy/Sell signals, as we just explored in the first part of this chapter, is an excellent idea if you want to have better odds of entering a winning trade. But it gets even better.
When I first examined the chart behavior of the Buy/Sell signals, I was not satisfied with the win/loss ratio of the Buy-B and Sell-B signals. Even when using confirmation, I thought the overall probability of success was just “OK,” but not anything to get overly excited about. I had hoped that these signals would be significantly better than what I was seeing. Because the B signals were by far the most common, I wanted to find a way to improve their success rate. The A, C, and F signals seemed to work reasonably well, as long as the rules for confirmation were followed. If I could just get the B signals to achieve a fairly high degree of reliability, then I knew I would have all the tools I needed to make up a truly superior methodology, and not just another “pretty good” one.
I must confess that I got pretty lucky. One of the early Beta Testers for the SMR Pro software sent me a letter about the method he was using with the SMR Pro signals. I won’t go into the details, because I since discovered that there are some problems with his method, at least from my perspective, that keep it from being a first-class approach. In short, it works great during its “streaks”, but then it misses a whole lot of good signals. But one component of his method turned out to be a real gem: the CCI-FP indicator.
One of first things I tried when looking for an improvement to the B signal was to check its success rate against the CCI-FP: how many times did the B signal succeed whenever the CCI-FP was also flashing a particular signal. I was very impressed with the results. Almost spooky, it worked so well. And no, it’s not 100%, but it’s good enough to pay some very serious attention to.
The name I chose for this tool is “Verification,” to set it apart from the Confirmation tool.
The CCI-FP Indicator is a Departure from “Pure” SMR
I know that some long-term fans of SMR will have an objection to introducing a “foreign” indicator into their methodology. They believe that the SMR Signals (MA, DL, and SL) are everything you ever need to trade successfully, and throwing anything else into the mix is downright sacrilege.
While I can understand how someone would feel that way, I have a different perspective. My mission is to always strive to create the very best trading methodology I can, and to continually look for ways to improve it. I do this both for myself, and for the users of the SMR Pro software. I am willing to do whatever I need to do. If adding another indicator or two improves my chances for success, then I will gladly do that, even if it irritates some purists.
I consider myself pretty lucky to have found a tool that works as well as it does to improve the success rate of the Buy-B and Sell-B signals. I will continue to use it and recommend it until I come across something that works better.

SMR - The Trader’s Edge CH. 3: How to Enter The Trade Pg 54

SMR - The Trader’s Edge CH. 3: How to Enter The Trade Pg 55
Verification: How to Apply the CCI-FP Indicator
The first step in using Verification of the Buy-B and Sell-B signals with the CCI-FP is pretty simple. Whenever you are considering entering into a B signal, just add the CCI-FP indicator to the chart, as shown below.
Choose “Add Lower Indicator 1” from the Indicators menu.
(If you already have added one or two Lower Indicators to your chart, just add the next available Lower Indicator.)
Select the CCI-FP indicator type from the pull-down list. Keep the Upper Marker set to 80, and the Lower Marker set to -80. Click “Add.”
This will add the CCI-FP indicator to a new panel on the chart, just below the SMR panel, which contains the DL and SL.

SMR - The Trader’s Edge CH. 3: How to Enter The Trade Pg 56
Verification: About the CCI-FP Indicator
The CCI (Commodity Channel Index) indicator was developed by Donald Lambert. It is a momentum oscillator which can be useful for identifying short-term overbought and oversold conditions of a chart. Despite the use of the term “Commodity” in the name, this indicator works as well on Stock charts as on Futures charts.
The basic CCI indicator takes one parameter, which is the period. The CCI-FP indicator is a special type of the CCI indicator. Its full name is “Commodity Channel Index – Fibonacci Peaks.” It is constructed by computing three different CCI lines, each with a different period, and then taking the average of the three. The three periods are 8, 13, and 21, which are Fibonacci numbers.
When I use the CCI-FP indicator to cross-verify the “B” signals, I am looking for signals formed when the CCI-FP line crosses values of +80 and -80. Therefore, I set the Upper Marker value to +80, and the Lower Maker value to -80. These values are already set up as the defaults in the SMR Pro software.
When you add the CCI-FP indicator to your SMR Pro chart, the Upper Marker will already be set to +80, and the Lower Marker to –80.
There is also a Middle Marker at the Zero line. I do not use the Middle Marker for anything in my methodology.
CCI-FP Upper Marker
Lower Marker
Middle Marker

SMR - The Trader’s Edge CH. 3: How to Enter The Trade Pg 57
Verification of the Buy-B Signal
Now that we know how to add the CCI-FP indicator to our charts, let’s look at how to Verify the Buy-B signals.
This chart shows a Buy-B signal that has been Verified by the CCI-CP signal.
Notice how the CCI-FP line has dipped BELOW the Lower Marker, but has already crossed back ABOVE the Lower Marker on the day the Buy-B signal is triggered.
In order to Verify the Buy-B signal, the CCI-FP Indicator must have already crossed ABOVE the Lower Marker from BELOW.
And here is the same chart after the Verified Buy-B signal was successful.
NOTE: This Verified signal was also Confirmed. Verification does not take the place of Confirmation! It is just another tool you can use in addition to Confirmation.
Buy-BBuy-B
Buy Verification
CCI-FP
Buy-B
CCI-FP

SMR - The Trader’s Edge CH. 3: How to Enter The Trade Pg 58
Verification of the Buy-B Signal (cont’d)
Notice how in the first Buy-B signal, the CCI-FP failed to Verify, because it had not crossed BELOW the Lower Marker.
The second Buy-B signal does get Verification from the CCI-FP, and is successful.
VerificationFailed
VerificationOK
CCI-FP
Buy-BBuy-B

SMR - The Trader’s Edge CH. 3: How to Enter The Trade Pg 59
Verification of the Buy-B Signal (cont’d)
In the charts above, notice how the CCI-FP has not yet crossed back ABOVE the Lower Marker on the day the Buy-B signal was triggered. Therefore, the Verification of the Buy-B signal did NOT occur.
Buy-BBuy-B
Verification Failed
CCI-FP CCI-FP
SMR - The Trader’s Edge CH. 3: How to Enter The Trade Pg 60
Verification of the Sell-B Signal
Now let’s take a look at how we verify the Sell-B signal using the CCI-FP Indicator.
This chart shows a Sell-B signal that has been Verified by the CCI-CP signal.
Notice how the CCI-FP line has popped up ABOVE the Upper Marker, but has already crossed back BELOW the Upper Marker on the day the Sell-B signal is triggered.
In order to Verify the Sell-B signal, the CCI-FP Indicator must have already crossed BELOW the Lower Marker from ABOVE.
And here is the same chart after the Verified Sell-B signal was successful.
NOTE: This Verified signal was also Confirmed. Verification does not take the place of Confirmation! It is just another tool you can use in addition to Confirmation.
Sell-B
Sell Verification
Sell-B

SMR - The Trader’s Edge CH. 3: How to Enter The Trade Pg 61
Verification of the Sell-B Signal (cont’d)
Notice how, in the first Sell-B signal, the CCI-FP failed to Verify, because it had not even crossed ABOVE the Upper Marker.
The second Sell-B signal does get Verification from the CCI-FP, and is successful.
VerificationOK
VerificationFailed
Sell-BSell-B

SMR - The Trader’s Edge CH. 3: How to Enter The Trade Pg 62
Verification of the Sell-B Signal (cont’d)
In the charts above, notice how the CCI-FP has not yet crossed back BELOW the Upper Marker on the day the Sell-B signal was triggered. Therefore, the Verification of the Sell-B signal did NOT occur. Notice how the market just moves sideways after this signal is triggered.
Sell-B
Sell-B
Verification Failed

SMR - The Trader’s Edge CH. 3: How to Enter The Trade Pg 63
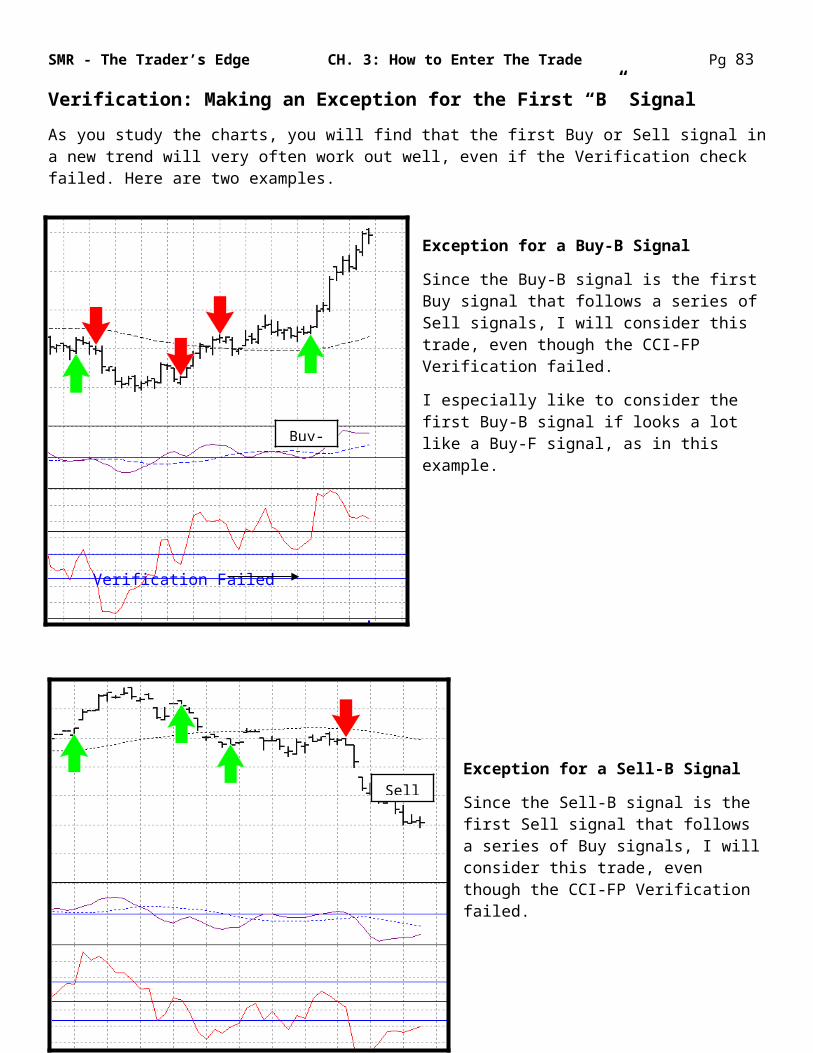
Verification: Making an Exception for the First “B” Signal
As you study the charts, you will find that the first Buy or Sell signal in a new trend will very often work out well, even if the Verification check failed. Here are two examples.
Exception for a Buy-B Signal
Since the Buy-B signal is the first Buy signal that follows a series of Sell signals, I will consider this trade, even though the CCI-FP Verification failed.
I especially like to consider the first Buy-B signal if looks a lot like a Buy-F signal, as in this example.
Exception for a Sell-B Signal
Since the Sell-B signal is the first Sell signal that follows a series of Buy signals, I will consider this trade, even though the CCI-FP Verification failed.
I especially like to consider the first Sell-B signal if looks a lot like a Sell-F signal, as in this example.
Sell-B
Buy-B
Verification Failed
Verification Failed

SMR - The Trader’s Edge CH. 3: How to Enter The Trade Pg 64
Verification: Making an Exception for the First “B” Signal (cont’d)
Below is another example of when you could have made an exception for the first “B” signal in a new trend.
In this chart, we see three Sell-B signals in a row, which come after a series of Buy signals. Notice how the first Sell-B signals works out well, even though the Verification check failed. The Verification check passes on the second Sell-B signal, and it turns out to be an excellent short trade. The third Sell-B signal fails the Verification check. Unlike the first Sell-B signal, the third Sell-B signal results in a losing trade.
Sell-BSell-B
Sell-B
Verification Failed Verification OK Verification Failed

SMR - The Trader’s Edge CH. 4: Trading with the Mode Pg 65
CHAPTER 4 – Trading with the ModeUsing SMR’s Concurrent Mode to Enter Trades
In addition to the primary Buy/Sell signals, the SMR charts provide yet another tool which you can use to achieve excellent timing of your trade entries – the Concurrent Mode.
What is Concurrent Mode?Whenever the MA and the DL are both headed in the same direction, the chart is said to be in Concurrent Mode. If the MA and DL are headed in opposing directions (one going UP and the other going DOWN), the chart is said to be in Cross-Current Mode.
Why would we want to use Concurrent Mode? Because many of the best moves occur when the chart enters Concurrent Mode and stays there for an extended period of time. Sometimes these changes occur in such a way that the Buy/Sell signals miss the trade entry. However, if we can recognize Concurrent Mode on the day that it starts, we can often jump on board and go for a nice little ride (and sometimes a nice long one).
Also, we can look for small, subtle pullbacks in the middle of a Concurrent Mode run. In a strongly trending chart, these entry opportunities can often be missed by the conservatively structured Buy/Sell signals. But for those who are occasionally willing to trade a little more aggressively, I will show a method for entering trades during these periods of fast-moving market activity.
While I don’t advocate jumping into each and every market as soon as it enters into Concurrent Mode, I do believe there are setups that make sense to watch for and consider, and I will show examples of these.

SMR - The Trader’s Edge CH. 4: Trading with the Mode Pg 66
Viewing the Modes in ColorWith SMR Pro, it is now very easy to instantly recognize the Mode of the chart. Go to the View or Colors menu and select “Mode Colors ...”. Then check the option to “Show Mode with Colored Bars.” If you want to change the color for any of the modes, click on the small colored box next to the Mode type, and select a different color.
This chart shows the default colors for the SMR Modes:
GREEN for Concurrent Mode, MA heading UP (Concurrent - Uptrend)BLUE for Cross-Current Mode, MA heading UP (Cross-Current - Uptrend)BLACK for Cross-Current Mode, MA heading DOWN (Cross-Current - Downtrend)RED for Concurrent Mode, MA heading DOWN (Concurrent - Downtrend)

SMR - The Trader’s Edge CH. 4: Trading with the Mode Pg 67
Mode Entry Setup #1 – First Concurrent BarWhat about those times when the market moves so fast that you don’t get alerted by an automated Buy/Sell signal? Those are often the times when entering into a market as soon as it enters Concurrent Mode can result in a very good trade. To do this, we look for the First Concurrent Bar that’s clearly breaking out from recent price action. Let’s look at a few examples.
Here we have a Concurrent Mode bar that is breaking out to the upside. The Green bar tells me that the chart is in Concurrent Mode, and the Trend is UP.
Notice how the last bar is clearly breaking out above the recent market Highs.
I follow the rules for Confirmation by setting my Target Entry Price a few ticks above the high of the Signal bar. Then I wait to see what happens on the next day’s market open.
NOTE: Just being the First Concurrent Bar does not qualify as a trade set-up. As you can see, there are other Green bars, but they do not break out above the price action, so we don’t consider those.
This is a case where being alert for the First Concurrent Bar really paid off, since there was no other Buy signal triggered for this trade.
The chart stayed in a strong Concuurent Mode Uptrend for the next 23 trading days, which is a very good run.
NOTE: A market will sometimes move too quickly for one of the automated Buy/Sell signals to be triggered. That’s when you need to know how to recognize the Mode Set-ups.
Target Entry Price
Target Entry Price

SMR - The Trader’s Edge CH. 4: Trading with the Mode Pg 68
Mode Entry Setup #1 – First Concurrent Bar (cont’d)
Here we have a Concurrent Mode bar that is breaking out to the downside. The Red bar tells me that the chart is in Concurrent Mode, and the Trend is DOWN.
Notice how the last bar is clearly breaking down below the recent market activity.
I follow the rules for Confirmation by setting my Target Entry Price a few ticks below the Low of the Signal bar. Then I wait to see what happens on the next day’s market open.
Since no other Sell signal was triggered for this trade, it definitely pays to be alert to the First Concurrent Bar set-up.
Target Entry Price
Target Entry Price

SMR - The Trader’s Edge CH. 4: Trading with the Mode Pg 69
Mode Entry Setup #2 – First SL TurnThe second type of Concurrent Mode trade set-up occurs when you see a First SL Turn in a chart that is already in Concurrent Mode. What do we mean by “SL Turn?” The SL Turn occurs on the first day that the SL line turns back into the direction of the Trend. For example, if the chart is in an Uptrend, and the SL is currently heading DOWN, the SL Turn will occur on the first day that the SL turns back UP.
Here we have a chart with six Green bars in a row, so it is solidly in Concurrent Mode, and in an Uptrend.
If I want to enter into a long position, or add to an existing long position, I can consider doing it here. That’s because the SL has just turned UP, and it’s the first SL Turn of this Concurrent Mode.
Again, I follow the Confirmation rules by placing my Target Entry Price a few ticks above the High of the Signal bar.
NOTE: This is another case where you can have a good trade set-up, even though an automated Buy signal was not triggered.
You may be wondering why I’m only looking for the first SL Turn of the Concurrent Mode. That’s because the first SL Turn has a much higher probabilty of success than any second or third SL Turn which might occur. It is just a safer bet, and it will definitely get you in at a better price if a good trend should develop.
A second or third SL Turn will most likely happen too far into the trend to be a good bet. It would be better to look for any of the automated Buy signals instead.
Target Entry Price
Target Entry Price

SMR - The Trader’s Edge CH. 4: Trading with the Mode Pg 70
Mode Entry Setup #2 – First SL Turn (cont’d)
Here we have a chart with six Red bars in a row, so it is solidly in Concurrent Mode, and in a Downtrend.
If I want to enter into a short position, or add to an existing short position, I can consider doing it here. That’s because the SL has just turned DOWN, and it’s the first SL Turn of this Concurrent Mode.
Again, I follow the Confirmation rules by placing my Target Entry Price a few ticks below the Low of the Signal bar.
After the First SL Turn, the market continues with a very nice sell-off.
In this case, even an entry at the second SL Turn would have paid off nicely. However, I still recommend to avoid those, because they aren’t nearly as good a bet as the First SL Turn.
Target Entry Price
Target Entry Price

SMR - The Trader’s Edge CH. 5: The SL Divergence Pg 71
CHAPTER 5 – The SL DivergenceAn Excellent Tool for Pinpointing Price Reversals
Let’s take a look at one more way that we can use the SMR oscillators to anticipate future movements in price. When the Solid Line (SL) forms a divergence with the price behavior, we have a highly reliable indication of a reversal in price within one or two trading days. I’ll explain what I mean by divergence, and show examples of how we can use this information to improve our trading.
Bearish Divergence
Now what do we mean by divergence? In the chart to the left, notice how the Price makes a HIGHER High from Point 1 to Point to, but the SL makes a LOWER High from Point A to Point B. The line that connects Points 1 and 2 is pointing UP, but the line connecting Points A and B is pointing DOWN.
This is a clearly defined SL Divergence, a difference in behavior between the SL and the Price. Notice that even though the price has made a new short-term high, the SL is signaling that the market is likely to head lower. So, whenever you have an SL Divergence, it is the direction of the line drawn on the SL signal that is pointing to the direction, in the short term, that the market is most likely to take next.
Bullish Divergence
In the Bullish Divergence, the Price makes a LOWER Low, but the SL makes a HIGHER Low.
Again, it is the direction of the line drawn on the SL signal that is indicating the likely future price direction.
1
2
AB

SMR - The Trader’s Edge CH. 5: The SL Divergence Pg 72
Some SL Divergence Examples
In this chart, we see a Bullish Divergence (marked by the Blue lines) that occurs in conjunction with a Buy-B signal. This is a very nice validation of the Buy Signal. Notice how the Bullish Divergence pinpoints the end of the first pullback from the Uptrend.
Next, the Bearish Divergence (marked by the Red lines) tells us to be on the alert for the end of that upward wave of price movement. You might choose to take at least part of your profits here, then wait to see if another Buy Signal develops.
This chart is a very good example of the two ways we use the SL Divergence:
1. To signal the possible end of a pull-back from the primary trend
2. To signal the possible end of a price move in the direction of the primary trend
Buy-B
Buy-B

SMR - The Trader’s Edge CH. 5: The SL Divergence Pg 73
Some SL Divergence Examples (cont’d)
In this chart, we first see a Bullish Divergence (marked by the Blue lines). Now, we don’t use this as a signal to go long, because that would be a trade against the Bearish trend. Instead, we just recognize it as an “alert” that the trend could very likely be ready to turn UP.
Next, take a look at the Bearish Divergence (marked by the Red lines). The SL has just turned down, which completes the divergence signal. This divergence flashes a big alert that we should think seriously about getting out of this market, if we are long.
And here we see that the market does indeed sell off, and sells off hard.
Whenever you are in a position, you should always be alert to any possible development of an SL Divergence against the direction of your trade.

SMR - The Trader’s Edge CH. 5: The SL Divergence Pg 74
Some SL Divergence Examples (cont’d)
Here is an example of a Bearish Divergence on a weekly chart. We don’t see as many divergences on the long-term charts as we do on the daily charts. When they do occur, however, you should pay close attention to them. They can alert you to some very big changes in the trend.
Notice how hard and fast the market sells off after this Bearish Divergence was signaled.

SMR - The Trader’s Edge CH. 5: The SL Divergence Pg 75
Notes on the SL Divergence
1. The SL Divergences are highly reliable signals of price reversals. In fact, they are sometimes the most reliable indicator on the chart. Always be on the lookout for them.
2. The SL Divergences tend to run in “streaks.” Sometimes you see them all over your charts, and sometimes you can go weeks or even months and only see a few. They do not occur frequently enough to build a whole methodology around them.
3. When the line drawn across the SL is at a steeper incline that the line drawn across the Price, the SL Divergence is more likely to indicate a reversal in price action.
4. SL Divergences with large differences in SL values (the line drawn on the SL is very steep) are the most reliable reversal indicators.
5. If an SL Divergence fails to signal a price reversal, be on the lookout for another divergence to develop soon after the first one. If it does, this second divergence is an especially reliable predictor of a price reversal.

SMR - The Trader’s Edge CH. 6: Getting Out Pg 76
CHAPTER 6 – Getting OutSome Ideas for Exit Strategies
If you are like most traders, getting out of a trade always feels different than getting into one. You never have the same level of confidence that the timing is correct. You always wonder if you are getting out too soon, and missing out on some additional gains. There’s just more uncertainty to the process.
Well, there’s no way to remove all that uncertainty, because the future is, of course, always uncertain. But there are some tools you can employ which cut down on the guesswork, and add more strategic thinking and objectivity to your exit techniques. Just as you want to have a plan for entering trades, you should also have a plan in mind for how you are going to exit. Using a pre-planned strategy will, over the long haul, help you to let your winners run and catch more of those occasional big moves. You are also more likely to be better protected when the market turns against you.
In this chapter, we identify four distinct methods we can use to exit a winning position. These methods are:
The SL Divergence Exit
The Cross-Current Mode Exit
The Displaced Moving Average Exit
The 2-Day Trailing Stop Exit
These methods all involve the use of trailing stop orders. The only exception is the SL Divergence, where you could also choose use a market order to exit.

SMR - The Trader’s Edge CH. 6: Getting Out Pg 77
The SL Divergence ExitWe saw in the last chapter how we can use the SL Divergence to alert us to an upcoming price reversal. Let’s look at an example of how we might exit the trade when an SL Divergence develops.
This market has been in a steady Uptrend for weeks. On this day, we see that a Bearsish Divergence of the SL has just occured, signalling that the top may be in place.
I make my plans to move my sell-stop just under the low of the latest bar. I will place the order to move my stop as soon as the market opens the next day.
Of course, you also have the choice here to just exit the trade on the next day’s market open.
Even though the market does not sell off right away, it’s a good thing we got out when we did. It drops hard a few weeks later.
The SL Divergence did an excellent job of telling us that there was no more upward momentum left in this market, at least for the short term.
Move Stop to Here

SMR - The Trader’s Edge CH. 6: Getting Out Pg 78
The Cross-Current Mode ExitThis is a strategy we can use whenever the market is in a strong Concurrent Mode. The technique is very simple. Whenever the first Cross-Current Mode bar appears, we move our stop-order just under the Low of that bar (if we’re long), or just above the High (if we’re short).
Here we see a market that has been in a strong Concurrent Mode, as indicated by the Green Bars.
As soon as I see the first Blue bar, I know the market has switched to Cross-Current Mode. At this point, I want to be on the alert for a possible pullback in the price. This is especially true if the market has just made a fast move, as is the case with this chart.
As soon as the market opens the next day, I’ll move my stop to just under the Low of the Blue Bar.
Just a few days after entering Cross-Current Mode, the market begins its sell-off.
Now, sometimes the market will continue trending in your favor, even as it switches back and forth between Concurrent Mode and Cross-Current Mode. That’s why you should consider using trailing stops for these kinds of strongly thrusting market moves, rather than just exiting at the market.
Move Stop to Here

SMR - The Trader’s Edge CH. 6: Getting Out Pg 79
The Displaced Moving Average ExitThis is a strategy you may want to consider to help you position your trailing stops during the beginning and middle phases of your trades.
The Displaced Moving Average (DMA) is simply a moving average that is shifted to the right by one or more periods. When a moving average line is shifted to the right on a chart, it is able to “capture” more of a price move in a trending market. That is, the market will run for a longer period of time before any of the price bars cross the moving average line. Because of that, it is a very useful guide for setting the level of your trailing stops.
Non-Displaced Moving Average
In the chart to the left, the Blue line is a 20-day simple moving average. It has not been displaced.
I call this a 20x0 DMA (“Twenty by Zero”).
Notice where we would have exited this trade, if we had used the 20x0 DMA to set our trailing stops.
Displaced Moving Average
The Blue line is this chart is also a 20-day moving average. The only difference between this chart and the chart above is that the moving average has been shifted to the right by 5 periods.
I call this a 20x5 DMA (“Twenty by Five”).
Now, notice how much more of the price move we are able to capture by using the 20x5 DMA rather than the 20x0.
Using a 20x0 DMA, you would have gotten stopped out here.
Using a 20x5 DMA, you would have gotten stopped out here.

SMR - The Trader’s Edge CH. 6: Getting Out Pg 80
Choosing the DMA ParametersOn the previous page, we used a 20x5 DMA to help us set our trailing stop levels. However, what you will use really depends on how fast the market moves after you enter the trend.
Of course, you can never know in advance what setting for the Displaced Moving Average will work the best for any particular trade. But there is a logical method you can use to adjust the DMA to fit the price action as the trade progresses.
I suggest keeping your moving average displacement set to 5. That value seems to work well over most markets.
Start out with a 40x5 DMA. If the price bars seems to be pulling away from this line, then try a 35x5 DMA and see if that seems to fit the trend better. Basically, you just have to try different values and see how well they fit. Then be ready to adjust the period of the DMA any time the price action appears to require it.
You may find there are a few settings you tend to come back to as favorites. You might start out with experimenting with 40x5, 25x5, and even 7x5 for very fast-moving markets.
Adding the DMA to Your ChartTo add a DMA to your chart, click on the “Moving Averages” button in the control area of the SMR Pro screen. Or, select “Moving Averages” from the Indicators menu. You will get the following form:
You can add up to 4 different Moving Averages to your chart at one time. If I’m using a Displaced Moving Average to help me set my trailing stops, though, I usually will just turn on the MA3 line. I keep the MA Type set to “Simple”, and the Source set to “Close.” I adjust the Period, and keep the Displacement (“Disp”) set to 5.
Make sure to choose the option for “This Chart Only.” Otherwise, you will apply the same DMA to all of the Daily Charts.

SMR - The Trader’s Edge CH. 6: Getting Out Pg 81
The 2-Day Trailing Stop ExitSuppose I am in a trade that has already made a nice profit. I start to think about taking my gains, but I also want to let the trade run as long as the market keeps moving in my favor. Here is a simple strategy you can use to keep your trailing stops tight against the price action, yet still allow a little space to let a winner keep running.
This chart shows a market that I have entered at the Buy-B signal. I have a little profit, and I want to protect it.
Suppose the last day on this chart is a Thursday. My plan is to place a trailing stop just under Wednesday’s Low. I will place this stop order when the market opens on Friday morning
Since, on the day that I actually place the order (Friday), I am basing my stop level on a bar that occurred two days ago (Wednesday), I call this a 2-Day Trailing Stop.
At the end of each trading day, I check to see if the market has made a Higher Low. If so, then I make a note to move my trailing stop to just under yesterday’s Low. I actually place the order to move the stop on the next day’ s open.
If, at the end of the trading day, the price has not made a Higher Low, I simply leave the stop order as is.
Here you can see the results of using this technique. I get stopped out for a decent profit on the last bar of this chart.
When the market opens on Friday, I will set my stop just under the low of Wednesday’s bar
Thursday’s price bar
On the Market Open, if the previous day’s Low was a Higher Low, I will set my stop just under the Low of 2 day’s ago.

SMR - The Trader’s Edge APPENDIX A: Recommended Reading Pg 82
CHAPTER 7 – Keeping a Sharp EdgeTips and Strategies for Better Trading Results
(In Progress)
SMR - The Trader’s Edge APPENDIX A: Recommended Reading Pg 83
Chick Goslin’s TRADING DAY BY DAY
Trading Day By Day is one of the few truly great books on trading, and we highly recommend it. Chick explains his methods for using the SMR signals in a simple, straight-forward, and thorough style.
But it’s about a lot more than just the SMR signals. This book covers all aspects of what it takes to become a success at the difficult game of trading: the psychology, the discipline, and excellent guidelines for money management.
A trading classic.
Buy direct from:
www.tradingdaybyday.com
SMR - The Trader’s Edge APPENDIX B: Getting Started with SMR Pro Pg 84
XXXXXXXXXXXXXXX(In Progress)