sms management & technology melbourne level 41 sydney ... · sms management & technology...
TRANSCRIPT
SMS Management & Technology Level 41
140 William Street Melbourne Victoria 3000
Australia T +61 1300 842 767 F +61 1300 329 767
www.smsmt.com
Melbourne Sydney Brisbane Canberra Adelaide Perth Hong Kong Vietnam Singapore
SMS Management & Technology Ltd ACN 009 558 865 SMS Consulting Group Ltd ACN 006 515 028 M&T Resources Pty Ltd ACN 132 349 458 SMS Management & Technology Asia Pty Ltd ACN 141 797 480
SMS Management & Technology Malaysia Pty Ltd ACN 156 456 361 SMS Management & Technology Singapore Pty Ltd ACN 143 117 819 SMS Management & Technology Vietnam Pty Ltd ACN 110 232 623
4 June 2013 Manager, Companies Australian Stock Exchange Limited Company Announcements Office Level 4 Stock Exchange Centre 20 Bridge Street SYDNEY NSW 2000 Dear Sir Pursuant to Listing Rule 3.1, attached is a presentation to be presented today by the Company’s Chief Financial Officer, Mr. Rick Rostolis, at the Morgan Stanley 2013 Emerging Companies Conference. Yours faithfully
Anna Gorton Company Secretary
For
per
sona
l use
onl
y

SMS Management & Technology Limited Q4 FY13 Update Morgan Stanley 2013 Emerging Companies Conference Rick Rostolis, Chief Financial Officer
4 June 2013
For
per
sona
l use
onl
y

Strategic Overview
1H FY13 Summary of Key Results
Q4 FY13 Update
Summary
1
Contents F
or p
erso
nal u
se o
nly

Differentiated business model
• Occupies ‘sweet spot’ between global and niche local competitors
• Lead with business process services - technology agnostic
Grow organically via specialised service offering
• Provides margin maintenance
• Greater breadth of coverage and share of industry spend
• Mitigates risk of competing with commodity service providers
Develop new capability to service emerging high demand trends
Leverage operational efficiency including utilisation management
Extend dual-shore model to improve price competitiveness
Acquire businesses focused on customer, capability or geographic expansion
2
Strategic Overview F
or p
erso
nal u
se o
nly

3
Market Positioning is in a “Sweet Spot” F
or p
erso
nal u
se o
nly

Hong Kong
Vietnam
Singapore
Australia Adelaide Brisbane Canberra Melbourne (Head Office) Perth Sydney . . .
.
. . .
.
Leveraging our strengths:
27 year history
Culture & people
Scale: 1,500 experienced professionals
Financial strength
• Strong cash generation
• Reliable dividend history
Breadth of capability
Business transformation practice that pulls
through specialist service offerings
4
Positioned to become a Regional Leader
.
For
per
sona
l use
onl
y

Defence against commodity providers
Helps open up new opportunities
Further expansion of service categories in FY14
Scale and breadth of services together with
investment in intellectual capital, differentiates
SMS from many local competitors
5
Comprehensive Service Offering F
or p
erso
nal u
se o
nly

Mobility
Enterprise Mobility Strategy
Mobile and Web Apps
Devices & Platforms
Context Based Services
BYOD
Business Innovation
Cost Out Divestment Agile Delivery Process
Automation Pace Layering
IT & Big Data
Cloud Computing Hybrid Services Picking the Right
Technology for your Business
Optimising (current IT Function)
‘Incubate and Grow’ Projects
Customer
Customer Centric Transformation
Net Promoter Score Improvement
Single View of Customer (via Big Data)
Digital Transformation
Enterprise Risk Mediation
Gamification e-Learning Mobility Customer
Experience Improvement
Social Media/The Social Enterprise
6
SMS Go-to-Market - addressing emerging high demand trends F
or p
erso
nal u
se o
nly

EBITDA
Basic EPS (cents) 18.8 28.1 38.2 36.7 41.9 44.3 44.8
7
EBITDA and EPS History F
or p
erso
nal u
se o
nly
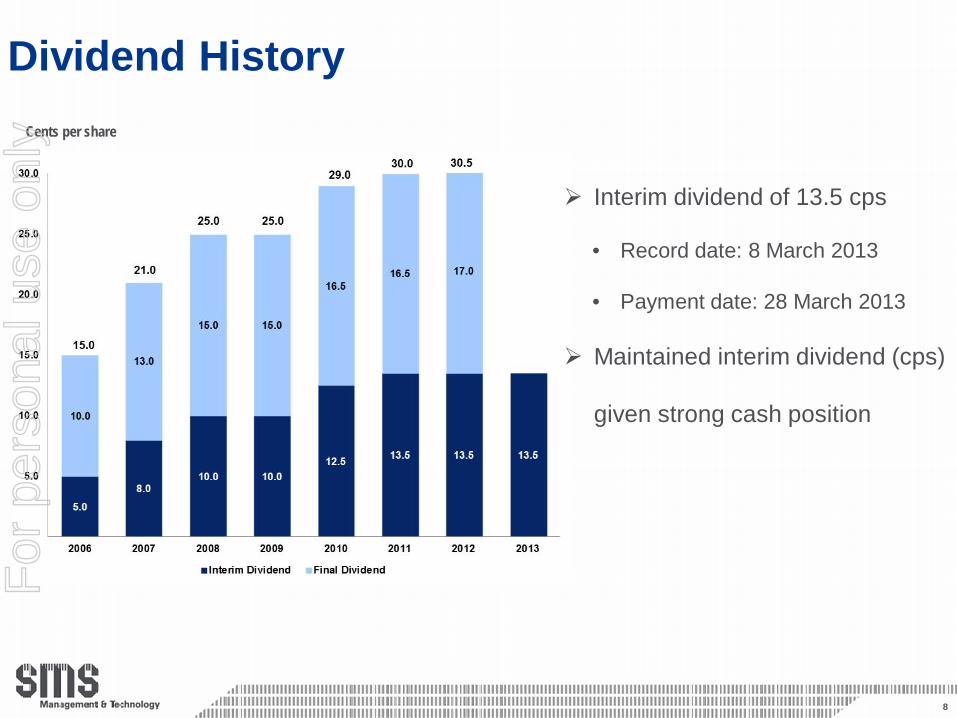
Cents per share
Interim dividend of 13.5 cps
• Record date: 8 March 2013
• Payment date: 28 March 2013
Maintained interim dividend (cps)
given strong cash position
Dividend History
8
For
per
sona
l use
onl
y

Revenue from services $144.8m, down 15% on pcp
• Reduction primarily from ICT and Transport clients
• Other sectors resilient (in total) despite difficult environment
EBITDA* $18.1m, down 17% on pcp
NPAT* of $12.9m, down 15% on pcp
Maintained fully franked interim dividend of 13.5 cents per share
Strong capital position - zero debt with cash balance of $29.3m
Dual-shore development capability improves competitiveness
* Earnings before interest, tax, depreciation and amortisation (EBITDA) and net profit after tax (NPAT) include a $0.9m deferred consideration gain relating to a previous business combination.
9
1H FY13 Summary of Key Results F
or p
erso
nal u
se o
nly

Client sentiment characterised by:
• Shifting focus from expansion to cost control
• Capital project deferrals, slow decision making on new initiatives
Q4 showing continued weakness exacerbated by fixed price project delays
Significant projects expected to commence in 2H have slipped and will not make expected
contribution to 2H result.
Some of these multi-year projects have now been signed:
• Business process improvement Transport starts May-13
• Business transformation Transport starts Jun-13
• Geospatial information solution Defence starts Aug-13
• Communications network ICT starts Aug-13
• Systems integration State Government starts Jun-13
Dual-shore development centre continues to grow and augments on-shore services
Assessing EPS accretive acquisitions which can accelerate growth
10
Q4 Update F
or p
erso
nal u
se o
nly

11
( ) prior year
ICT and Transport accounted for the bulk of revenue decline in 1H13. Despite stabilisation in sales pipeline the risk to revenue persists
Continued delays with major corporate clients, combined with uncertainty in Federal and State Government budgets have impacted 2H earnings expectations
Industry softness has impacted billable utilisation in Victoria and Asia
Well positioned for an industry rebound. Core business is positioned to benefit from, rather than be challenged by, offshoring and infrastructure commoditisation
Revenue by Industry - March FY13 YTD F
or p
erso
nal u
se o
nly

Mar-12 Jun-12 Dec-12 Mar-13 Billable Permanent Consultants 1,151 1,127 1,014 995 M&T Resources* 362 364 333 319
1,513 1,491 1,347 1,314 Non-Billable Sales, Admin & Management 191 191 183 170 Total 1,704 1,682 1,530 1,484
* Represents respective 6 month average FTEs
Recruitment activities adjusted to match market conditions
Non-billable headcount reduction on track to deliver $2m in annualised savings
Contractor market continues to be impacted by weak demand from ICT sector
Asia (excluding Vietnam) billable FTEs of 64
Vietnam dual-shore development centre continues to grow - 70 FTEs
12
People F
or p
erso
nal u
se o
nly

Well positioned to benefit from upswing in IT services demand
Key player in consulting & delivery services, given strong management
performance across cycles
Low-risk time & materials business model avoids contract blowouts
Strong multi-year client relationships, diversified portfolio of contracts
Strong balance sheet and cash flow present opportunities for capital
management initiatives
Acquisitions to supplement organic growth
13
Summary F
or p
erso
nal u
se o
nly

14
QUESTIONS
For
per
sona
l use
onl
y

This presentation has been prepared by SMS Management & Technology Limited (“SMS”) consisting of the slides for a presentation concerning SMS. The information contained in this presentation prepared by SMS is not investment or financial product advice and is not intended to be used as the basis for making an investment decision. By reviewing/attending this presentation you agree to be bound by the following conditions. Forward-looking statements This presentation includes forward-looking statements. All statements other than statements of historical facts included in this presentation, including, without limitation, those regarding SMS’ financial position, business strategy, plans and objectives of management for future operations are forward-looking statements. Such forward-looking statements involve known and unknown risks, uncertainties and other factors which may cause the actual results, performance or achievements of SMS, or industry results, to be materially different from any future results, performance or achievements expressed or implied by such forward-looking statements. Such forward-looking statements are based on numerous assumptions regarding SMS’ present and future business strategies and the environment in which SMS will operate in the future. Among the important factors that could cause SMS’ actual results, performance or achievements to differ materially from those in the forward-looking statements include, among others, levels of client demand, operational problems, political uncertainty and economic conditions, the actions of competitors, activities by governmental authorities such as changes in taxation or regulation and other risk factors. Forward-looking statements should, therefore, be construed in light of such risk factors and undue reliance should not be placed on forward-looking statements. These forward-looking statements are made only as of the date of this presentation. To the maximum extent permitted by law, none of the SMS Group of Companies, its directors, employees or agents accepts any liability, including, without limitation, any liability arising out of fault or negligence, for any loss arising from the use of the information contained in this presentation. Nothing in this presentation should be interpreted to mean that future earnings per share of SMS will necessarily match or exceed its historical published earnings per share.
Disclaimer
15
For
per
sona
l use
onl
y