são paulo peri-urban dynamics: some social causes and
TRANSCRIPT

1
São Paulo Peri-Urban Dynamics: Some Social Causes and Environmental Consequences
Haroldo Torres*
Humberto Alves** Maria Aparecida de Oliveira***
Introduction
There has been great expectation in Brazil that the decline in the rate of
population growth of the São Paulo’s Metropolitan Area would positively impact this
metropolis, reducing the need for public investment in urban infrastructure and social
policies. This local hypothesis relates to some extent to the so-called “urban transition
theory”, which assumes that with the long-term reduction of the rural-urban migration,
cities could achieve a more sustainable pattern of development (Livi-Bacci and De
Santis, 1998; Martine, 2001).
In fact, between the 1970s and the1990s, the rate of population growth declined
remarkably in the São Paulo Metro Area, from 4.5% to 1.7% a year, reaching the
national average. Different demographic projections, such as the one produced by the
São Paulo State Bureau of Statistics (Seade) project a stable population for the Metro
Area in the near future (Waldvogel et all, 2003). However, the expectations of a more
sustainable development have not being fulfilled in the case of São Paulo. This has
happened because while the center of the city is significantly losing population, the
share of population living in peri-urban areas are still growing very fast, rising from
19% to 30% between 1991 and 2000. As a result of this urban dynamics, the region still
demands strong public investment in transportation and other urban infrastructure, with
considerable environmental impacts.
In general terms, the argument presented in this paper is that the connection
between population growth and urban environment should not be considered in an
abstract form, as if all urban environments and institutional contexts were the same. The
interplay between population and environment must be considered in “concrete
territories”, with all their social and environmental diversity and their institutional
complexity. In the case of Brazilian metropolitan areas, we propose that particular
dynamics of the land market - affected by land use regulations, as well as by public
* Doctor in Social Science at University of Campinas (UNICAMP). GIS coordinator and PI researcher at CEM-CEBRAP. ** Doctor in Social Science at University of Campinas (UNICAMP) and post-doctoral researcher at CEM-CEBRAP. *** Master in Geography at University of São Paulo (USP) and researcher at CEM-CEBRAP.

2
policies (i.e., transportation and housing) - strongly influence the urban sprawl
dynamics and its environmental impacts.
In view of these elements, the first objective of this paper (Section 1) is to
understand the evidence on urban sprawl. In Section 2, we will try to discuss why this
intra-urban dynamic is happening by comparing spatial patterns of population growth
and real state investments. We intend to show that – surprisingly – the city is losing
population exactly in the same places where real state investments are growing more
significantly.1 Population growth, on the other hand, happens mainly where the price of
land is low.
In Section 3, we intend to argue that such sprawl is producing an important land
use transformation, leading to the destruction of the natural environment around the
Metropolitan Area and the contamination of water sources. We show that the urban
sprawl is connected to the deforestation and occupation of environmentally protected
areas, specially those with less environmental restrictions such as the APAs and APMs.2
However, the connection between population growth and environmental degradation in
São Paulo peri-urban area is not clear cut, as implied by most environmental literature
(Mather & Needle, 2000; Allen & Barnes, 1985). Finally, we also present a brief
conclusion trying to explore the arguments presented here from the point of view of
public policies.
1. Urban sprawl and peri-urban areas
Map 1 below presents the spatial distribution of the rate of population growth of
the census survey areas (“áreas de ponderação”) of the urbanized area of São Paulo
comprised by 21 municipalities.3 It is possible to observe that the demographic growth
of this region has been very uneven by distributed in the past decade. While the central
1 Most of those analyses benefit from the GIS database developed at the Center for Metropolitan Studies (CEM-Cebrap), where census data (1991, 2000), satellite images, real state data, etc. are all available in GIS format. The authors used Maptitude, Envi and Arcview as their GIS software. See, www.centrodametropole.org.br 2 APA (Area de Proteção Ambiental) are environmental protected areas. APM (Área de Proteção de Mananciais) area water sources protected areas. Those are mainly private land with strong usage restrictions. The Atlantic Forest Biosphere Reserve, the Billings/Guarapiranga Water Reservoirs and the Serra da Cantareira’s APA are the most important examples. 3 The Metropolitan Area of São Paulo is an official definition that includes 39 municipalities. The 21 municipalities considered here are the ones that form a continuous urban area with 92% of the total population of the Metro region. The Census Survey Areas are the spatial units of the 2000 Census that allow tabulations for the Census Survey.

3
areas of the most important municipalities of the region – including São Paulo
(Expanded Downtown Area) Guarulhos (Northeast), ABC (Southest) and Osasco
(West) – have lost population in absolute terms, some areas located in the outskirts of
the city that grown very fast.
Map 1 Rate of Population Growth of Census Survey Areas (1991-2000). São Paulo Urbanized Area.
Source: IBGE, 1991 and 2000 Census.
The areas located in the external ring of the region have presented a significant
growth rate, often higher than 5% a year. We can also observe that there are practically
no census areas in the expanded downtown part of the city that present positive growth.
The only exceptions refer to the areas in which the shantytowns of Paraisópolis and
Heliópolis – the largest of São Paulo - are located.
Contrary to the American medium-high income urban sprawl (Duany, Zyberk
and Speck 2000), the demographic growth of the Brazilian peri-urban region occurs due
to the extension of existing poor areas, almost all located in the suburbs in the case of
São Paulo (Torres, 2002). As to the high and medium income areas of the city, almost

4
all are losing population, the only exceptions being Alphaville and Vila Andrade - both
in the western part of the region.
In aggregate terms, the recent demographic change of São Paulo may be
considered rather unsettling. While the region as a whole was growing in moderate
terms (1.5% a year in the 1990s), the central negative-growth areas lost population quite
fast (-2.1% a year). In contrast, peri-urban fast-growth areas were growing at the
impressive rate of 8.1% (Table 1 and Map 1).
Table 1 Population and Rate of Population Growth According to Groups of Areas. São Paulo Urbanized area, 1991-2000
Population Groups of areas according to population growth rate, 1991-2000 1991 2000
Population growth rate 1991-2000
-8 to -1.5 2316493 1916522 -2.08 -1.5 to 0 4401256 4130804 -0.70 0 to 1.5 3076605 3299875 0.78 1.5 to 3 1844554 2246932 2.22 3 to 5 1259512 1772233 3.87 5 and more 1534626 3102189 8.13 Total 14433045 16468555 1.48 Source: IBGE, Demographic Census, 1991 and 2000.
As a consequence, the population in negative-growth areas has decreased from
6.7 to 6 million inhabitants between 1991 and 2000. In slow growth areas (less then 3%
a year), it has increased from 4.9 to 5.5 millions while in the peri-urban fast-growth
areas (more than 3% a year) it raised in 2.1 million inhabitants (from 2.8 to 4.9). In
2000, this area represented 30% of the total population of the region. Without such
contribution, the urbanized region of São Paulo would have kept its population stable in
the 1990s.
Intense demographic variations of this kind have important consequences for
public policies. The expectation that a slower population growth rate would reduce the
pressure over the offer of public services is only partially true. In the new peri-urban
areas, the state must build new infrastructure – i.e., streets, schools, healthcare facilities
and basic sanitation. The persistent horizontal growth of the city requires a continuous
extension of the network of public services to the peri-urban areas, even when the
equipment located in the central areas are is not being used to its full potential. It is also
important to notice that this region corresponds to an average extension of 70x60 km,

5
and that the transportation system is crowded and expensive. In other words, it is not
realistic to imagine that peri-urban residents would easily access services only available
in central areas (Torres, 2002a).
Besides having the highest population growth rates of the city, the peri-urban
areas also unsurprisingly show the worst socioeconomic indicators, with high levels of
poverty, illiteracy and unemployment. Table 2 shows that per capita family income in
very negative growth areas (8.1 minimum wages) is almost five times the one observed
in fastest growing peri-urban areas (1.7 minimum wages). This table also shows that
such income differentials are associated with high levels of unemployment and illiteracy
and are additionally expressed in terms of sanitation indicators, such as water supply,
garbage and sewage collection. This poor and illiterate peri-urban region also
concentrates the largest proportion of black population (45%).
Table 2 Socioeconomic and sanitation indicators of the Urbanized Area of São Paulo, 1991-2000
Groups of areas according to population growth rate, 1991-2000 -8 to -1.5 -1.5 to 0 0 to 1.5 1.5 to 3 3 to 5 5 and more Total
Per capita family income (*) 8.11 4.75 3.26 2.70 1.87 1.66 3.86 Average years of schooling of head of households 9.89 8.14 7.08 6.44 5.89 5.55 7.27 Unemployment rate (**) 13.13 16.32 19.31 21.68 23.72 24.93 19.32 Proportion of blacks (%) 13.87 20.88 31.12 37.30 41.85 44.99 30.12 Proportion of children 0-4 years (%) 5.39 6.95 8.74 9.86 10.73 11.68 8.82 Water (%) 99.86 99.79 99.41 97.99 95.39 92.00 97.69 Sewage (%) 97.94 94.84 87.64 80.11 74.66 59.46 83.74 Household density 2.92 3.36 3.56 3.69 3.77 3.83 3.50
Source: IBGE, Demographic Census de 2000. Notes: (*) In minimum wages (~US$100 in 2005). (**) It does not correspond to the official unemployment estimates, due to a different methodology
adopted by Brazilian Census.
Such an urban sprawl has also significant environmental consequences in terms
of transportation and pollution. On the one hand, peri-urban housing means longer
journeys and increase in air pollution; on the other, poor peri-urban areas not only mean
lack of sanitation and pollution of river and streams (Torres, 2002a) but also
deforestation and destruction of natural landscapes that still surround São Paulo.4
4 We further discuss this issue in Section 3.

6
2. Urban sprawl and land markets
Between 1995 and 2003, there was a significant residential real state investment
in São Paulo, with private companies launching more than 7.5 thousand residential
projects, including nearly 400 thousand residential units, 3 million square meters of area
and almost 10 billion dollars in private investments.5 Such projects refer to those by
private companies only, and not include the investment made by families and
individuals themselves. Surprisingly, the bulk of such investment happened in areas that
lost significant amount of population between 1991 and 2000. Evidence of this
argument is presented in Map 2.
Map 2
Real State Investment (1985-2003) and Rate of Population Growth of Census Survey Areas (1991-2000). São Paulo Urbanized Area
Sources: IBGE, 1991 and 2000; Embraesp, 1985-2003.
In other words, there seems to be limited connections between private
companies housing production and the strong dynamic of population growth in the far
suburbs. The housing built by private companies has been almost exclusively offered
for high and medium income families,6 with only 11% of such projects referring to
houses or apartments of less than 50 square meters of residential area, considered to be
more cost effective for low-income families. Even in this case, most small apartment
5 See Embraesp 1985-2003, which register all new real state investments advertised in newspapers.

7
projects were located in rich areas, and sold as residencial-hotels, not affordable for the
poor. Overall, private companies has never intended to sell housing projects to poor
dwellers, since their income levels made such housing units unaffordable for either
acquisition or rental purposes. This dynamic is strongly associated with real state prices.
In Map 3 we present the average distribution of land prices in metropolitan area of São
Paulo.
Map 3 Average Square Meter Price of New Real State Investment (1985-2003). São Paulo Urbanized Area.
Sources: Embraesp, 1985-2003.
By comparing Maps 1 and 3, it is possible to observe that there seems to be a significant
correlation between high land prices and negative population growth. Areas with strong
population growth presented mostly low land prices or no real state development in the
last two decades. Although we have few individual data to support such an argument,
the ecological presented here also works as evidence in this case, as almost no private
companies invest in the fast-growing poor suburbs. Table 3 summarizes the data
available on this issue.
6 This process has been described in the urban planning literature as “gentrification” (Smith, 1996).

8
Table 3 Total Population and Growth Rate for Areas Classified According to its Average Square Meter Price of New Real State Investment. São Paulo Urbanized Area.
US$ per square meter (1985-2003)
Population 1991
Population 2000 Growth Rate 1991-2000
No development 5794062 7462966 2.85 Less than 1000 4131638 4590084 1.18 1000 to 1500 4004931 3962867 -0.12 1500 and more 502645 452638 -1.16
Sources: IBGE, 1991 and 2000 and Embraesp, 1985-2003.
In fact, the data shows that the areas with high land prices (and strong real state
investment) are loosing population.7 On the other hand, those areas with no
development and probably low land prices are the ones growing faster. Self-
construction houses in areas with low land price or in illegal settlements explain poor
suburbs growth. By analyzing the available information, we also conclude that no
private investment exist in poor areas. These trends also indicate an increasing of the
already high level of residential segregation (Torres, 2004).
In summary, we can say that, in the 90s, the Metro Area received additional 96 thousand
households every year.8 On average, the investment provided by private companies as
presented above was responsible for only 23% of such increase. Public housing projects
were almost insignificant,9 indicationg that most of the new housing has been built by
families and individuals in very far suburbs, which explains the significant peri-urban
demographic growth. This also shows that the general pattern described in the 70s - of
poor urban dwellers living in self-constructed houses in the so-called “peripheries” of
the city - is still true for São Paulo in the 90s (Kowarick, 1979).
2.1 The Role of the Informal Markets
Informal settlements are yet another important dimension of this process. Due to
the lack of affordable housing, the poor population ends up living in different types of
7 The negative growth areas received the largest amount of private investment (70%), while the fast growth areas (growing at more than 3% a year) received only 6% of the total investment between 1985 and 2003. 8 The total number of households (occupied or not) reached 3.8 million in 1991 and 4.7 million in 2000 in the 21 municipalities considered in this analysis. It represents an yearly growth rate of 2.3%. 9 The data available is quite controversial and incomplete. Considering only the City of São Paulo (that accounts for 60% of the population of the Metro Area), the average production of new households by the

9
informal settlements, such as slums, irregular developments and shantytowns. A recent
study by the Secretariat for Housing of the city of São Paulo estimates that at least 25%
of the city’s households are either in shantytowns or in illegal developments (Sehab,
2003). However, illegality and/or informality in São Paulo should be even higher since
it also refers to a more complex arrangement of land use regulations: building norms,
environmental constrains for land occupation, infrastructure regulation on neighborhood
development, zoning, and property rights (Figure 1).
FIGURE 1: Forms of regulation and of housing occupation in São Paulo
REGULATIONS ON PROPERTY RIGHTS
Legal Illegal
Legal A Regular housing areas
B REGULATIONS ON
LAND USE, ENVIRONMENT AND INFRAESTRUCTURE Illegal C
Slums Irregular developments
D
Shantytowns Source: Adapted from Lim (1995: 525). See also Torres (2002b).
As a consequence, only a small part of the city - which has also been called
“the legal city” (Situation A in Figure 1) - can be to some extent comparable to a city of
a developed country (Grostein, 1987). Private investments usually happen in such legal
city such as the central areas of São Paulo. Most shantytowns and illegal settlements are
located in poor suburbs and in peri-urban areas (Map 4 and Table 4).10
One can see that shantytowns are much more frequent in the peri-urban areas
(19.3% of the local population) than in the central negative growth areas (4.3%). The
same pattern occurs with illegal settlements, which represent almost 24% of the
population of peri-urban areas while only 10% of the population of central areas. In the
poor slow growth areas (less than 3% a year), the percentage of population living in
shantytowns and illegal settlements is 15.5% and 17.4% respectively.
city government was less than 4 thousand per year between 1989 and 2003 (Marques and Saraiva, 2004). This amount does not include the investment in urban regularization and shantytown urbanization. 10 Unfortunately, we only have data for the city of São Paulo to support this argument.

10
Map 4 Distribution of Shantytowns and Illegal Settlements in the City of São Paulo, 2000
Source: Secretariat for Housing of the City of São Paulo, 2002.
Table 4 Population living in shantytowns and illegal settlements. City of São Paulo , 2000.
Groups of Areas Negative
growth areas Slow growth
areas > 0 & < 3%
Fast growth areas
> 3% a year
Total
Population living in shantytowns 208,478 527,462 430,283 1,166,223 Population living in illegal settlements 470,112 591,009 529,862 1,590,983 Total 678,590 1,118,471 960,145 2,757,206 % Population living in shantytowns (*) 4.34 15.50 19.27 11.18 % Population living in illegal settlements (*) 9.80 17.37 23.72 15.25 Total (%) 14.14 32.87 42.99 26.43 Source: IBGE, 2000 and Secretariat for Housing of the City of São Paulo, 2002. Note: (*) Percentage of population living in shantytowns or illegal settlements in relation to the total
population of the group area.

11
Illegal occupation accounts for 43% of the population living in fast growing
peri-urban areas of the city of São Paulo. Such illegal occupation of the poor peri-urban
areas seems to be part of the same process that induces the strong rate of population
growth in poor areas. In the case of São Paulo, there are diverse institutional barriers for
the provision of proper infrastructure and social services in irregular and/or invaded
areas. This high level of irregularity “justifies” the non-provision of social services, or
the limits imposed upon their potential availability.
Even when the State decides to invest in irregular settlements, it is more difficult
to find proper site location for social equipment in irregular or illegal land. Moreover,
the State must follow complex legal procedures in order to appropriate private land, and
also takes more time to find proper land for public equipment close to illegal
developments and shantytowns. Sometimes the State decides not to invest in such areas
due to the risk of losing public investments made in those places – which may be later
incorporated by their private owners. Lawsuits against public administrators that do not
follow the complex set of standard procedures may also happen in regard to land use
regulations (Maricato, 1996; Torres, 2002).
Different authors have argued that informal land use is a major issue for
developing countries. Some defend the regularization of land property and the
simplification of norms and regulation as important preconditions for further social and
economic development in this kind of urban area (World Bank, 1999).11 However, the
links between land use and social policies need to be addressed more extensively, since
public services must be present even when land regularization is not in force. In the case
of Brazil, some of these services are even considered to be constitutional rights.
In summary, in the case of São Paulo, it seems quite clear that the urban sprawl
shows a stronger relation to land market dynamics (and the role of the government) than
to the demographic dynamics per se. Quoting Sabatini (2001), who studies the
segregation patterns in Chile, we can also say for São Paulo that “the land market is in
the eye of the storm”.
11 “Only well functioning land markets can provide an adequate supply of housing, and maintaining these markets is another task that deserves attention from the public sector. Providing universal registration and establishing clear property rights to all urban land will require strengthening existing institutions. Ill-defined land rights render land useless and discourage the redevelopment of entire portions of a city. But simply providing security of tenure creates incentives to improve housing and infrastructure dramatically. To avoid adding to the backlog of problem housing and neighborhoods, new development must meet basic – but not excessive – compliance standards” (World Bank, 1999: 146)

12
3. Urban Sprawl and Environmental Degradation
One of the most significant environmental impacts of the urban sprawl of São
Paulo seems to be the massive destruction of the green belt of Atlantic Rainforest
surrounding the city. The Atlantic Rainforest is one of the most endangered eco-systems
in the world. Different studies on deforestation estimate that less than 10% of the
original forest remnants are preserved in Brazil, and the rate of destruction is still high
(Fundação SOS Mata Atlântica, 1998).
São Paulo’s Atlantic Rainforest greenbelt has been partially preserved –
especially on its Northern and Southern parts - mainly because the topography of
remaining areas does not allow for its agricultural exploitation. The South Region is part
of the water sources protection area, and has intensified its already high population
growth in the last decade. More recently, the North of São Paulo has also been growing
fast around the fringes of the Cantareira mountain range.
A recent green coverage study conducted by the government of the city of São
Paulo using satellite images has indicated that the city lost 53.4 square km of of green
coverage in the last decade (PMSP, 2002). The greatest part of this deforestation (56%)
was concentrated in only 10 of a total of 96 districts, all located in the poor suburbs, in
which there has also been high rate of population growth.12
In other words, the urban sprawl was followed by a significant destruction of the
remaining forests in the metro area, with little respect for the restrictive environmental
legislation that forbids any deforestation of the Atlantic Rainforest – Bylaw 750/93
(Marcondes, 1999). Those green areas are part of the so-called Atlantic Forest
Biosphere Reserve, an UN initiative, and are key for different ecological dynamics,
since they serve as ecological corridors and routes for migratory species (Lino, 1992).
They also play a fundamental role in the conservation of water sources.
Not surprisingly, the city has an important deficit of public spaces and green
areas, a situation unlikely to be reversed since in the most consolidated portions of the
city there are very few public areas available for building new parks. The available
maps of green coverage show that half of the city districts present no significant forest
coverage in terms of both the trees planted along the street network and parks or squares
12 Districts include Jardim Ângela, Parelheiros and Grajaú in the South; Tremembé, Perus, Anhanguera and Jaraguá in the North; and Iguatemi, Cidade Tiradentes and São Rafael in the East.

13
(PMSP, 2002). In poor suburbs several public areas were invaded and turned into
shantytowns and illegal settlements.13
In 1991, the municipalities of the Metropolitan Area considered in our study still
presented a forest coverage of 1.23 thousand square kilometers, representing 35.7% of
the Metropolitan Area, mostly located in preserved areas and strategic sites for the
protection of water reservoirs. By 2000, the remaining forest in the same municipalities
equaled 1.17 thousand square kilometers (34% of the region). Such figures are
nevertheless good news, indicating that the São Paulo Metropolitan Area still possess
substantial forest coverage.
However, this data also indicates an important net loss of forest cover (57.2
square kilometers) during the 90s, at a rate of 4.7 in nine years.14 Although such
deforestation could not be considered very high when compared with the rate of
destruction of other Brazilian areas such as the Amazon Rainforest (PRODES-INPE,
2004), it is quite damaging for São Paulo both because of previous loss and the
strategic services it provides for the metropolis in terms of protection of water sources
and reduction of air pollution.
In Map 5 we present the distribution of forested areas in São Paulo in 2000
according to our own estimates, highlighting the areas that suffered higher levels of
deforestation during the 90s (more than 2% of its area within the decade). In geographic
terms, most of the deforestation took place in some of the far suburbs that had grown
significantly in the 90s.
One can see that the center of the city is almost completely deforested. On the other
hand, large parts of the suburbs are still covered with their original vegetation. We did
not considered in this account pasture or grassland, although secondary forest
succession and reforestation areas are also included in this estimate.
Additionally, Map 5 shows that the region in which the most important water
sources for São Paulo are located – the reservoirs of Billings and Guarapiranga in the
South of the city – present not only significant deforestation but also rapid population
growth. The consequences of such dynamics are of concern and subject to extensive
debate by the local press. The annual investment needed to preserve such reservoirs is
13 See section 2. 14 Such estimate simply subtracts the forested areas accounted for in 1991 from the ones in 2000. Therefore, it also includes forest plantation and forest regeneration.

14
impressive, and other alternatives would imply, for instance, bringing water from Vale
do Ribeira, located further down South. Such an expansion of the water network would
demand huge public investment due to the distances and topographic difficulties
involved.
Map 5 Forest Coverage and Areas with High Level of Deforestation. Urbanized Area of São Paulo, 2000
Source: CEM-CEBRAP. Satellite images (LANDSAT TM 1991 and LANDSAT ETM 2000).See Annex 1.
It is also important to notice in Map 5 that the areas highlighted - with more
than 2% of deforestation in the 90s - showed a total population of 1.7 million in 1991
and 2.8 million in 2000, a rate of growth of 5.3% a year. Considering this evidence, we
try to interpret this forest data by employing the same geographic divisions previously
used for analyzing these demographic trends (Table 5 and Figure 2).

15
Table 5 Changes in forest cover between 1991 and 2000. Urbanized Area of São Paulo.
Groups of areas according to population growth rate, 1991-2000 -8 to -1.5 1.5 to 0 0 to 1.5 1.5 to 3 3 to 5 5 and more Total Total Area (km2) 255.46 383.35 323.71 434.31 650.90 1542.43 3590.16Forest coverage 1991 (km2) 9.37 13.13 26.36 129.84 313.20 751.28 1243.19Proportion of forested land 1991 (%) 3.67 3.43 8.14 29.90 48.12 48.71 34.63 Forest coverage 2000 (km2) 10.18 12.94 24.10 123.67 295.99 712.34 1179.22Proportion of forested land 2000 (%) 3.99 3.37 7.44 28.48 45.47 46.18 32.85 Change in forested area 1991-2000 (km2) 0.82 -0.20 -2.27 -6.17 -17.21 -38.95 -63.97 Change in forested area 1991-2000 (%) 0.32 -0.05 -0.70 -1.42 -2.64 -2.53 -1.78 Spatial distribution of deforestation -1.27 0.31 3.54 9.64 26.91 60.88 100.00
Source CEM-Cebrap. Satellite images (Landsat TM 1991, Landsat ETM 2000).15
Figure 2
Deforestation and rate of population growth between 1991 and 2000. Urbanized Area of São Paulo.
Source CEM-Cebrap. Satellite images (Landsat TM 1991, Landsat ETM 2000) and IBGE, 1991 and 2000.
In 2000, almost 50% of the fast growing (peri-urban) areas were still forested,
particularly in the North and the South. In slow growth areas, 20% of the territory
presented forest coverage, while negative growth areas showed a forest coverage of
only 4%. Ironically, the rate of population growth is strongly positive in forested areas
and negative in denser urban ones. Additionally, over 85% of all forest coverage of São
Paulo’s Urbanized Area are located in peri-urban areas, totalling more than one
thousand square kilometers. On the whole, almost 5% of the forest coverage that existed
in 1991 was destroyed by 2000, a trend that will most likely continue in the near future.
Forest loss (%) 1991-2000
-0,50
0,00
0,50
1,00
1,50
2,00
2,50
3,00
-8 to -1.5 -1.5 to 0 0 to 1.5 1.5 to 3 3 to 5 5 and more
groups of areas according to population growth

16
Available data shows that fast growing areas (more than 3% of population
increase a year) presented a net loss of almost 50 km2 of forest coverage between 1991
and 2000, i.e. a reduction of 5% of their original 1991 coverage. In other parts of the
city, such loss was less significant, and even includes a small grow in the forested area
of the central parts of the city (in which population is negatively growing).
However, this kind of ecological data may not precisely establish the
connections between population growth and deforestation. While it is clear that most of
the deforestation occurs in areas with very fast population growth, it is not an exclusive
feature of such areas. We present evidence of this argument in figure 3, below.
Figure 3 Relationship between population growth and forest loss in the Urbanized Area of São Paulo, 1991 and 2000.
Source: IBGE, Demographic Census of 1991 and 2000 and Satellite Images. Notes: 1) Each point refers to a census survey area.
2) The percentage of forest loss was calculated for each area. 3) Pearson correlation coefficient r = 0.426
15 See Annex 1.

17
This figure shows that there are very few situations in which high rate of
deforestation occurs in the negative and slow growth areas, and that almost all
deforestation has happened in the fast growth (peri-urban) areas. However, it is also
important to consider that not all peri-urban areas present high rates of deforestation,
with some of them even showing forest regeneration. In this context, public intervention
should consider a targeted pproach, focusing on the Eastern portion of the city, for
instance, which concentrates an important share of forest loss.
Considering theses problems, we have tried to test such arguments through
different statistical Models. First, we tested a space regression model (Anselin, 1996),
presented in Annex 3. Besides a significant heteroskedasticity, the regression did not
presented a strong correlation between population growth rate and deforestation. The R2
achieved was 36%, even when using controls for other variables, such as 1991 forest
coverage. Secondly, we used Moran techniques (LISA map) to try to observe the
relationships between clusters of deforestation and clusters of population growth.16
Those maps were produced with Geoda software; final results are in map 6, below.
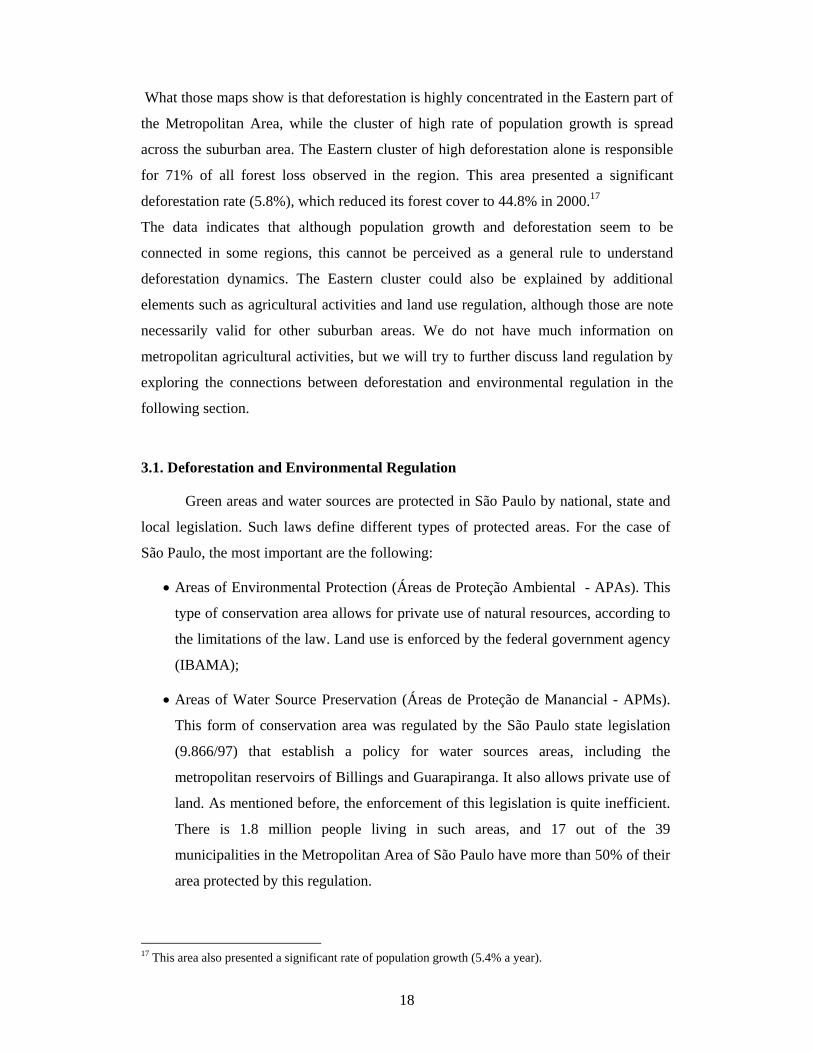
Map 6: Clusters of Deforestation and Growth Rate (LISA map). Urbanized Area of São Paulo, 1991-2000.
Source CEM-Cebrap. Satellite images (Landsat TM 1991, Landsat ETM 2000) and IBGE, 1991 and 2000.
16 Moran and LISA are techniques to measure and locate cluster occurrences.
Deforestation Growth Rate
High-highLow-lowHigh-lowLow-high
18
What those maps show is that deforestation is highly concentrated in the Eastern part of
the Metropolitan Area, while the cluster of high rate of population growth is spread
across the suburban area. The Eastern cluster of high deforestation alone is responsible
for 71% of all forest loss observed in the region. This area presented a significant
deforestation rate (5.8%), which reduced its forest cover to 44.8% in 2000.17
The data indicates that although population growth and deforestation seem to be
connected in some regions, this cannot be perceived as a general rule to understand
deforestation dynamics. The Eastern cluster could also be explained by additional
elements such as agricultural activities and land use regulation, although those are note
necessarily valid for other suburban areas. We do not have much information on
metropolitan agricultural activities, but we will try to further discuss land regulation by
exploring the connections between deforestation and environmental regulation in the
following section.
3.1. Deforestation and Environmental Regulation
Green areas and water sources are protected in São Paulo by national, state and
local legislation. Such laws define different types of protected areas. For the case of
São Paulo, the most important are the following:
• Areas of Environmental Protection (Áreas de Proteção Ambiental - APAs). This
type of conservation area allows for private use of natural resources, according to
the limitations of the law. Land use is enforced by the federal government agency
(IBAMA);
• Areas of Water Source Preservation (Áreas de Proteção de Manancial - APMs).
This form of conservation area was regulated by the São Paulo state legislation
(9.866/97) that establish a policy for water sources areas, including the
metropolitan reservoirs of Billings and Guarapiranga. It also allows private use of
land. As mentioned before, the enforcement of this legislation is quite inefficient.
There is 1.8 million people living in such areas, and 17 out of the 39
municipalities in the Metropolitan Area of São Paulo have more than 50% of their
area protected by this regulation.
17 This area also presented a significant rate of population growth (5.4% a year).

19
• Parks, forest reserves and urban parks, under local or state jurisdiction.18 Those
areas are basically government property and their occupation by private dwellers
is forbidden. The most important and preserved remnants of the Atlantic
Rainforest are located in parks in the farthest Southern portion of the Metro Area.
In the North, the public parks of Cantareira and Jaraguá - sponsored by the State
government - also include important remnants of native forest with medium to
advanced stages of forest succession. Both the Western and Eastern areas of the
city are less protected by the presence of parks and reserves.
Map 7 and Table 6 present the spatial distribution of these environmental
protected areas within the urbanized area of São Paulo.
Map 7 Distribution of Environmental Protected Areas. Urbanized Area of São Paulo.
Source: CEM/CEBRAP, 2004
18 The State Parks in the metropolitan area are the following: Cantareira, Alberto Löefgren, Jaraguá, Juquery, Jurupará, Várzea do Embu-Guaçu, Guarapiranga e Estação Ecológica de Itapeti. See: www.if.sp.gov.br

20
For analytical purposes, we have aggregated APAs and APMs in a single
category due the similarity of their legal characteristics, i.e. land property status
(private) and the possibility of land use under the terms of the environmental
regulations. Together, they correspond to 40.8% of the total Metropolitan Area and
61.5% of its forest coverage. Parks and reserves account for 7.8% of the total area and
19.4% of the forest coverage. The areas under now environmental protection aggregate
51.4% of the territory and only 19.1% of its forest coverage.
Table 6 Changes in the forest cover between 1991 and 2000 according to land use status. Urbanized Area of São Paulo.
Parks and Reserves
APMs and APAs
No protection Total
Total Area (km2) 279,01 1465,02 1846,13 3590,16 Urban area 1991 (km2) 15,57 142,24 1005,56 1163,37 Forest coverage 1991 (km2) 224,10 769,04 250,06 1243,19 Urban area 2000 (km2) 12,05 159,82 1152,17 1324,04 Forest coverage 2000 (km2) 228,65 725,29 225,28 1179,22 Proportion of forested land 2000 (%) 81,95 49,51 12,20 32,85 Change in forested area 1991-2000 (km2) 4,55 -43,74 -24,79 -63,97 Change in forested area 1991-2000 (%) 1,63 -2,99 -1,34 -1,78 Source: Source CEM-Cebrap. Satellite images (Landsat TM 1991, Landsat ETM 2000) .
Considering deforestation data regarding the land use status, we find some
surprising results. While non-protected areas have lost some of their remaining forest
between 1991 and 2000 (1.,3%), and parks and reserves presented some level of forest
regeneration (1,6%) – which was to be expected, the other protected areas (APAs and
APMs) presented a significant forest loss, corresponding to 3.,0% of their territory, or
43.7 square km. Such unexpected data strongly suggest that this form of environmental
legislation is not working as planned.
In general terms, this data indicates that part of the environmental legislation
(APAs and APMs) is not being able to controll land occupation, population growth and
forest loss. The so-called “law of protection of water sources” has not been able to limit
urban expansion around major lakes and forest remains in the Southern part of the
metropolis. On the contrary, the law has produced a reduction in land prices, which led
to expanded in illegal occupation and the consequent pollution of the water sources and
deforestation (Marcondes, 1996). For instance, in a buffer of 1km around the two major

21
reservoirs (Guarapiranga and Billings), for instance, the population has grown from 554
thousand in 1991 to 881 thousand in 2000, or 4.3% a year.
However it is also important to understand the role played by the deforestation
cluster we have previously identified. We present in Table 7, deforestation data according to
land use status and the Eastern cluster location.
Table 7 Changes in the forest cover between 1991 and 2000 according to land use status and presence of the Eastern cluster. Urbanized Area of São Paulo.
Types of Area Forest coverage 2000 (km2)
Change in forested area 1991-2000 (km2)
Change in forested area 1991-2000 (%)
Parks and Reserves 228.65 4.55 1.63 APAs and APMs that belong to the Eastern cluster 229.45 -29.1 -6.58
APAs and APMs outside the Eastern cluster 495.84 -14.65 -1.43 Eastern Cluster without APAs and APMs 54.77 -15.61 -5.75 Other areas 170.51 -9.17 -0.58 Total 1179.22 -63.98 -1.78
Source: CEM-Cebrap. Satellite images (Landsat TM 1991, Landsat ETM 2000) .
One can see that although deforestation happens in all areas, with the exception
of parks and reserves, it is much more significant in the areas - be them protected or not
- that belong to the Eastern cluster. Such result points to the need of a better
understanding of this particular region of the Metropolitan Area. However, it is also
important notice that deforestation in APAs and APMs are significant even outside such
cluster.
5. Conclusion
This paper has first shown that the demographic growth of the city is very
uneven. While the center of the city is losing population, its farthest suburbs are
growing fast. Associated to this observation, we have also noted that those areas are the
poorest and with less infrastructure of the region within the Metro Area and that they
present high levels of deforestation and informality in terms of land use. The high
concentration of social, environmental, and legal problems in the far suburbs makes
them very ill suited for population growth, which ironically persists to expand.
However, it is not necessarily true that this pattern of growth – all city growth focused
on the “periphery” – must continue. There is right now a significant amount of non-

22
occupied land in central parts of the Metro Area – especially in the old industrial belt
and along some railroad corridors, as shown in Map 8.
Map 8 Population Density. Urbanized Area of São Paulo, 2000
Source: IBGE, Demographic Census, 2000.
In this sense, such trends seem to be related to the land markets rationales.
Should the population growth happen in denser areas, much of the current damage could
be reduced. In our point of view, only a significant change in the dynamics of local land
markets could allow for a more sustainable pattern of growth.19 This land has not been
occupied because of both their high prices and the lack of public policies that could
redirect it to low-income dwellers and housing projects. Taxation, for instance, could be
more extensively used to stimulate vertical building and punish vacant lots. Current
zoning regulations also prohibit tall buildings in large, high-income, low-density
neighborhoods, significantly restricting the possibility of other families to live in areas
that have full infrastructure.
19 In other words, we totally agree with Martine (2001) that density should be stimulated in order to revert such trend.

23
Secondly, it is important to notice that it is not the case to blame the poor
migrants that move to these least structured suburbs. They are the first to be affected by
the degradation of the environment, not only through their exposure to environmental
hazards and vectors of contagious diseases, but also because their places of residence
are less protected in terms of equipment and/or construction patterns that could avoid
such hazards.
The logic that produces the urban sprawl in metropolitan areas such as São Paulo
is quite complex, and related to the role of different branches of the government
(regulation, taxation, infrastructure, housing policy, etc.) and private companies. Most
likely, this sprawl would be happening even with a zero population growth scenario.20
Therefore, the most significant issue here is how to change such unfortunate
trends. The idea that general land use (and environment) regulation could cope with
such problems is quite naïve, since it has not been able so far to properly regulate illegal
settlements in São Paulo. Urban environmental legislation, for instance, often falls
victim of such logic. The example of the “law of water sources protection” in
stimulating land occupation is just one tragic example of the failure of a series of
attempts to enforce land regulation.
References
ADR 1997. Asian Development Bank on Megacities. In: Population and Development Review, v23, n.2, p. 451-461.
Allen J. C. & Barnes D. F. (1985). “The causes of deforestation in developing countries”. Annals of the Association of American Geographers 75, pp. 163–184.
Anselin, L. 1996. Interactive Techniques and Exploratory Spatial Data Analysis. In: West Virginia University Regional Research Institute Working Papers, 9627.
Arriagada, Camilo 2000. Pobreza en América Latina: Nuevos escenarios e desafíos de políticas para el hábitat urbano. In: CEPAL – Série Medio Ambiente de Dessarrollo, n. 27.
Baldassare, Mark 1986. Trouble in paradise: the suburban transformation of America. New York: Columbia University Press.
Bilsborrow, R. E. (ed.) 1998. Migration, urbanization and development: new direction and issues. New York: UNFPA and Kluwer Academic Publishers.
Bonduk, Nabil and Rolnik, Rachel. 1979. Periferia – Ocupação do Espaço e Reprodução da Força de Trabalho. São Paulo: Faculdade de Arquitetura e Urbanismo/Universidade de São Paulo/Fundação para a Pesquisa Ambiental.
Brockerhoff, Martin 1999. Urban growth in developing coutries. A review of projections and predictions. In: Population and Development Review, v.25, number 4. p.757-778.
20 In fact, it is already the case of the city of São Paulo that is growing quite slowly (0.8% a year between 1991 and 2000).

24
Brockerhoff, Martin and Brennan, H. 1998. The poverty of cities in developing regions. In: Population and Development Review, v.24, number 1. p.75-111.
Caldeira, Teresa, P. 2000. City of walls: crime, segregation and citizenship in Sao Paulo. Berkeley: University of California Press.
Clark, D. 1996. Urban world/global city. London: Routledge. Crósta, A.P. 1993. Processamento digital de imagens de sensoriamento remoto. Campinas: Unicamp (Instituto
de Geociências, Departamento de Metalogênese e Geoquímica). Dean, Warren 1995. With broadax and firebrand: the destruction of the Brazilian Atlantic Forest. New York:
Stuart B. Schwartz. Duany, Andres; Zyberk E. P. and Speck, J. 2000. Suburban nation: the rise of the sprawl and the decline of
the American Dream. New Yoek: North Point Press. Elsom, Derek M. 1992. Atmospheric pollution: a global problem. Cambridige: Blackwell. Fundação SOS Mata Atlântica. (1998). Atlas da Evolução dos Remanescentes Florestais e Ecossistemas
Associados do Domínio da Mata Atlântica no Período 1990-1995. São Paulo, Fundação SOS Mata Atlântica/Instituto Nacional de Pesquisas Espaciais.
Grostein, Marta D. 1987. A cidade clandestina: os ritos e os mitos. O papel da irregularidade na estruturação do espaço urbano no município de São Paulo - 1900-1987. São Paulo: FAU/USP (tese de doutorado).
Gugler, J. 1996. The urban transformation of the developing world. New York: Oxford University Press. Habitat, 1996. The Istanbul declaration on urban settlements. In: Population and Development Review, v22,
n.3, p. 591-594. Hardoy, J.E. and Satterthwaite D. 1989. Squatter citizen: life in the urban third world. Londres: Earthscan. Hogan Daniel et al (2001a). Migração e Meio Ambiente nas Aglomerações Urbanas. Campinas:
Nepo/Unicamp. Hogan, Daniel J. et al 2000. Um breve perfil ambiental do estado de São Paulo. In: Hogan, Daniel J. et al (eds).
Migração e ambiente em São Paulo: aspectos relevantes da dinâmica recente. Campinas: Nepo/Unicamp, p. 275-381.
Hogan, D.J. (1992). Migração ambiente e saúde nas cidades brasileiras.In: Hogan, D.J. e Vieira, P.F. (orgs.). Dilemas sócio-ambientais do desenvolvimento sustentável. Campinas: Editora da UNICAMP, p.149-70.
Inforregio, 2000. The urban audit: toward a benchmark of quality of life in 58 European Cities. Luxembourg: Office for Official Publications of the Eurpoean Comunities. see www.inforegio.org
Jacobi, P. R. (1994). Households and environment in the city of São Paulo: perceptions and solutions. In: Environment and Urbanization. Londres: vol.6, nº2, p.87-110.
Jones, Gavin, W. and Visaria P. (eds.) 1999. Urbanization in Large Developing Countries China, Indonesia, Brazil, and India: London: Oxford University Press.
Kovarick, L. 1979. A Espoliação Urbana. Rio de Janeiro: Paz e Terra. Lim, Gill-Chin 1995. Housing policies for urban poor in developing countries. In: Stein, Jay M. Classic
readings in urban planning. New York: McGraw-Hill, p. 521-537. Lino, L. F. (ed.). 1992. Reserva da Biosfera da Mata Atlântica. Plano de Ação. Vol. 1: Referências Básicas,
junho/1992. Consórcio Mata Atlântica e Universidade Estadual de Campinas. Livi-Bacci, M. and G. De Santis. 1998. Population and poverty in developing countries. Oxford, Oxford
University Press, International Studies in Demography. Marcondes, M. J. A. (1999). Cidade e natureza: proteção dos mananciais e exclusão social. São Paulo: Studio
Nobel / Editora da USP / FAPESP (Coleção Diade Aberta). Marcondes, M.J.A. (1996). Urbanização e meio ambiente: os mananciais da metrópole paulista. São Paulo:
FAU/USP (tese de doutorado). Maricato, Ermínia 1996. Metrópole na Periferia do Capitalismo: ilegalidade, desigualdade e violência. São
Paulo: HUCITEC. Martine, George. 2001. The sustainable use of space: advancing the population/ environment agenda. Paper
presented at the Cyber Seminars of the Population-Environment Research Network. www.populationevironmentresearch.org
Martine, George. 1996. Population and environment in the current development scenario. Harvard Center for Population and Development Studies, Working Paper Series No. 96.02, Harvard University, Cambridge MA.

25
Massey, Douglas S. 1996. “The age of extremes: concentrated affluence and poverty in the 21st century”. In: Demography 33, n.4, p.395-412.
Marques, E. And Saraiva, C. 2004. As políticas de habitação social no município de São Paulo. In: Marques, E and Torres, H.G. (eds.). São Paulo: Segregação, pobreza e desigualdade social. São Paulo: Editora do Senac (forthcoming)
Mather, A. S. & Needle, C. L. 2000. “The Relationships of Population and Forest Trends”. The Geographical Journal 166, pp. 2-13.
Melo, M.C. 1995. State retreat, governance and metropolitan restructuring in Brazil. In: International Journal of Urban and Regional Planning, Vol. 19, n.3 p. 342-357.
North, Douglass C. 1990. Institutions, institutional change and economic performance. New York: Cambridge University Press.
Olmsted, F.L. 1870. Public parks and the enlargement of towns. Republished by Gates, R.T. and Stout, F. 1996. The City Reader. Londres: Routledge, p. 337-344.
Pick, James B. and Butler, E. W. 1997. Mexico Megacity. Boulder: Westview Press. Platt, R.H. 1994. The Ecological city: introduction and overview. In: Platt, R.H., Rowntree, R.A and Muick,
P.C. The ecological city: preserving and restoring urban biodiversity. Boston: The University of Massachusetts Press, p.1-20.
PMSP 2002. Atlas Ambiental do Município de São Paulo. Prefeitura do Município de São Paulo: Secretaria Municipal do Meio Ambiente. São Paulo.
PRODES-INPE. 2004. Monitoramento Ambiental da Amazônia por Satélite. www.inpe.br Richards, J.A. 1986. Remote sensing digital image analysis - an introduction. Berlin:
Springer-Verlag. Roberts, Bryan R. 1994. Urbanization and the environment in developing countries: Latin America in comparative
perspective. In: Arizpe, L., Stone, M.P. and Major, D.C. Population and environment: rethinking the debate. Boulder: West View Press, p. 303-338.
Sabatini, F. 2001 Residencial segregation pattern changes in Chile’s main cities: scale shifts and increasing malignancy. Cambridge, Lincoln Institute of Land Policy. International Seminar on Segregation and the City.
SEHAB, 2003. Plano Municipal de Habitação. São Paulo: PMSP. Smith, N. 1996. The New Urban Frontier: gentrification and the revanchist city. New York: Routledge. Stein, M et. all. 1992 Urban research in the developing world: towards an agenda for the 1990s. Toronto:
University of Toronto, Center for Community Studies. Torres, H. 2004.Segregação residencial e políticas públicas: São paulo na década de 1990. In: Revista
Brasileira de Ciências Sociais, n.54, p.41-56. Torres, H.G. 2002a. Population and the environment: a view from Brazilian Metropolitan Areas. In: Hogan, D.,
Berquó, E. and Costa, H.M. Population and Environment in Brazil. Campinas, CNPD/ABEP/NEPO, p. 147-166.
Torres, H.G. 2002b. Social Policies for the urban poor: the role of population information systems. Mexico city: UNFPA Country Support Team for Latin America and Caribbean.
Torres, H.G and Marques, E. 2001. Reflexões sobre a hiperferiferia: novas e velhas faces da pobreza no entorno metropolitano. In: Revista Brasileira de Estudos Urbanos e Regionais, n.4.
United Nations. 1999. World population prospects: the 1998 Revision. New York, United Nations, Department of Economic and Social Affairs, Population Division.
United Nations, 1995. The challenge of urbanization: the world’s large cities. New York: United Nations. Waldvogel, B.C. et all (2003). Projeção de População como instrumento de planejamento. In: São Paulo em
Perspectiva, 17(3-4), p. 67-79. World Bank 1999. Entering the 21st Century: World Development Report 1999/2000. Oxford University Press. World Resources Institute (1992). Population, poverty and environment stress. Washington: World Resources
Institute.

26
Annex 1- Procedures for generating land cover estimates
In order to produce land cover indicators, we used the following satellite images
for the Metropolitan Area of São Paulo:
1. Landsat 5 TM (Thematic Mapper), orbit point 219/076 – October 23, 1991
2. Landsat 7 ETM+ (Enhanced Thematic Mapper Plus), orbit point 219/076 -
September 21, 2000.21
We adopted the software ENVI 4.0 to process such images and initially
registered the 1991 image, procedure later applied to 2000. These images were
geometrically corrected and registered with reference to the vector cartography of rivers
and streams for the region (scale 1:10,000).
We used different digital image processing procedures to enhance the images
regarding its vegetation, i.e., contrast enhancing, color composites, filters for special
frequencies and mathematic operations for image classification. The color images that
have presented the best results for visual interpretation were the ones produced with the
TM4, TM5 and TM3 bands and channels red (R), green (G) and blue (B). We produced
the color composites in 1991 and 2000, keeping the same contrast for both of them.
Since the main objective was to identify basic green coverage, we chose not to
use NDVI (Normalized Vegetation Index). The classification were based on TM4, TM5
and TM3 bands for 1991, which guided the mapping classes adopted here. We have
produced the following classes: urban areas, water, exposed soil, grassland (pasture,
etc.) and forest. We have made no attempt to discriminate primary forest, secondary
forest of planted vegetation, since it was not the paper’s objective.
Having produced such classes, we started the classification based on different samples.
Our basic source of information has been aerial photographs (scale 1: 8,000) of
significant targets. Based on the largest sample possible (at least 5,000 pixels) in the two
color composites (1991 and 2000), we started the process of supervised classification.
We used the classification algorithm known as Maxver (maximum likelihood),
following Richards (1986). After such initial classification, we used different filters
21 These dates refer approximately to the 1991 and 2000 census reference dates.

27
such as “clump” and “sieve”. Such procedures were adopted for the images of both
1991 and 2000.
In order to test classification accuracy, we used a confusion matrix generating a
Kappa coefficient of 0.9466 in 1991 and 0.9442 in 2000. Such coefficient varies
between 0 and 1, and the best classifications are those closest to 1. The Kappa
coefficients we have obtained are satisfactory, and we accepted the classification
(Richards, 1996). The classified images were transferred to the ArcGis 8.1 where the
images were converted to a grid format and than analyzed for each census survey area
for 2000.

28
Annex 2 – Land Market indicators Table 8 Indicators on Private Companies` Housing Investment (1985-2003) According to Groups of Census Survey Areas, Classified Based on Their Population Growth Rate (1991-2000). Urbanized Area of São Paulo. Groups of areas according to population growth rate, 1991-2000
Number of occupied
households 2000
Population density
(Pop./km2)
Average family income
(1)
New private investment in
residential area per household (2)
New investment per
household (3)
Investment per group of areas
(%) -8 to -1.5% 622918 7484 22.90 12.84 5.55 37.51 1.5 to 0% 1213558 10749 15.15 7.17 2.49 32.80 0 to 1.5% 916966 10836 11.17 7.09 1.63 16.19 1.5 to 3% 605315 10943 9.54 3.57 1.16 7.60 3 to 5% 466761 7961 6.97 3.26 0.60 3.04 5% and more 801623 8715 6.23 1.98 0.33 2.86 Total 4627141 9526 12.42 6.16 1.99 100.00 Sources: IBGE, 1991 and 2000; Embraesp, 1985-2003. Notes: (1) Expressed in number of monthly minimum wages of 2000. In 2004, one
minimum wage corresponded to approximately 90 dollars. (2) Total residential area (square meters) produced between 1987 and 2003
divided by the number of households in 2000. (3) Total investment (US$) between 1987 and 2003 divided by the number
of households in 2000.

29
Annex 3: Space Regression Model Dependent Variable: - PDVARBUST9 Deforestation between 1991 and 2000 (%) Explanatory variables: W_PDVARBUST9 Deforestation in neighborhood areas (Queen Contiguity) TAXDESEM Unemployment rate (2000) PSUBNORM Population living in shantytowns in 2000 (%) TAXA91_0 Population rate growth 1991-2000 PVARBUST91 Forest coverage in 1991 (%) SUMMARY OF OUTPUT: SPATIAL LAG MODEL - MAXIMUM LIKELIHOOD ESTIMATION Dependent Variable : PDVARBUST9 Number of Observations: 757 Mean dependent var : -0.861942 Number of Variables : 6 S.D. dependent var : 2.70072 Degrees of Freedom : 751 Lag coeff. (Rho) : 0.436037 R-squared : 0.359094 Log likelihood : -1671.42 Sq. Correlation : - Akaike info criterion : 3354.85 Sigma-square : 4.67469 Schwarz criterion : 3382.63 S.E of regression : 2.1621 ----------------------------------------------------------------------- Variable Coefficient Std.Error z-value Probability ----------------------------------------------------------------------- W_PDVARBUST9 0.4360368 0.04451628 9.794996 0.0000000 CONSTANT 0.2175727 0.2761531 0.7878698 0.4307727 TAXDESEM 0.01987509 0.01528693 -1.300136 0.1935545 PSUBNORM -1.296872 0.5664194 2.289596 0.0220447 TAXA91_0 0.1352656 0.020164 -6.708276 0.0000000 PVARBUST91 0.02847819 0.00669473 -4.253822 0.0000210 ----------------------------------------------------------------------- REGRESSION DIAGNOSTICS DIAGNOSTICS FOR HETEROSKEDASTICITY RANDOM COEFFICIENTS TEST DF VALUE PROB Breusch-Pagan test 4 481.9144 0.0000000 DIAGNOSTICS FOR SPATIAL DEPENDENCE SPATIAL LAG DEPENDENCE FOR WEIGHT MATRIX : pesos_mod1.GAL TEST DF VALUE PROB Likelihood Ratio Test 1 96.99473 0.0000000