social contagion and social structure - booth school of...
TRANSCRIPT
Pre-print of a chapter in Networks in Marketing (1996) edited by Dawn Iacobucci.
Social Contagion and Social Structure
Ronald S. Burt and Gregory Janicik University of Chicago
September, 1995
1996 © SAGE PUBLICATIONS

Social Contagion and Social Structure, Page 2
It is widely understood that social contagion, the process by which a person catches an idea or behavior from another person, is a function of social structure. Network measures of cohesion and structural equivalence operationalize the two social structural conditions in which ideas and behaviors are contagious. Both conditions are circumstances in which people are expected to see themselves as socially similar, and so believe that they should find value in the same ideas and behaviors. By cohesion, contagion occurs between people in the same primary group in the sense that the recipient has a strong relationship with the source. By structural equivalence, contagion occurs between competitors in the sense that recipient and source are defined by the same pattern of relations with friends, clients, and enemies. This chapter is not the place to belabor the distinction between cohesion and structural equivalence. That is available elsewhere (Burt, 1982:Chap. 5, 1987), and evidence of contagion by cohesion versus structural equivalence is debated in articles by diverse authors.
Our purpose in this brief chapter is to argue that social contagion processes, via cohesion or structural equivalence, are contingent on the broader social structure in which they occur. More complex social structures obscure the social frame of reference responsible for contagion. Where it is difficult to answer the question "Who am I?" it is difficult to answer the question "Who is like me?" — which lessens the importance of resolving differences from others' ideas and behaviors.
The chapter is in four parts. We describe contagion in three social systems; a system of corporate officers, a system of lobbyists, and a system of doctors. We conclude by describing how the strength of contagion in the three systems covaries with the relative complexity of their social structures. For the purposes here, we defer to other publications discussion of statistical issues and technical details of the network theory.
INTERORGANIZATION CONTAGION We begin with a moderately complex social structure. The study population is officers of corporate philanthropy in large corporations in the twin cities of Minneapolis and St. Paul around 1980. The study population is described in Galaskiewicz (1985, and a follow-up survey is described in Galaskiewicz, 1995). Galaskiewicz and Burt (1991) analyze the

Social Contagion and Social Structure, Page 3
relative importance of cohesion and structural equivalence for contagion processes among the officers. Figure 1 is a summary of social structure and contagion among the officers.
THE SOCIAL STRUCTURE OF CORPORATE OFFICERS Social structure is based on sociometric citations among 61 officers. Interviewed officers were presented with a list of all publically held companies in the Twin Cities area and asked to "check off those firms where you know personally individuals involved in corporate contributions, i.e., on a first name basis, would feel comfortable calling for lunch or drinks after work, etc." Their responses define a (61,61) choice matrix. The bar graph in Figure 1 shows close connections between the officers (16% direct citations, and another 33% indirect connections through one intermediary) at the same time that there are distinct groups among the officers (there is no chain of intermediaries that connects 34% of the officer pairs).
—— Figure 1 About Here —— Routine structural equivalence analysis reveals a center-periphery structure; a
social hierarchy stratified across six positions. Relations within and between positions are summarized in the sociogram in Figure 1.1 Numbers identify sets of structurally equivalent officers, and arrows indicate choice densities greater than average. Officers at the top of the hierarchy, position 1, have strong contacts with one another and the densest contacts with other positions. All are officers in the largest firms. All but two of the firms have their headquarters in Minneapolis or its suburbs. The officers in positions 2, 3, and 4 form a hierarchy of decreasingly prominent positions below the top position. Positions are linked to geographic boundaries. Officers in positions 2 and 4 are principally affiliated with firms headquartered in Minneapolis and its suburbs. Officers in position 3 are all affiliated with firms headquartered in St. Paul and its suburbs. There are two positions at the bottom of the hierarchy. Position 5 is a satellite to the most prominent officers. Officers in position 5 have little contact with one another, but claim to have contacts with the officers at the top of the hierarchy, in position 1. Contact with other positions is minimal. All but one of these officers is affiliated with a small firm.
1By routine structural equivalence analysis we mean that: (a) path distances were derived from the
(61,61) matrix of sociometric choices and converted (frequency decay function) to measure the strength of the direct or indirect relation from each officer to each other officer, (b) Euclidean distances were computed to identify the extent to which each pair of officers were structurally equivalent in the sense of having identical relations with other officers, (c) the distances were cluster analyzed to identify sets of structurally equivalent officers, and (d) the identified sets of structurally equivalent officers were tested for the degree to which they were structurally equivalent (cf., Burt 1982, for illustrative examples, or any network analysis textbook for the general idea).

Social Contagion and Social Structure, Page 4
Finally, there is an isolate position — officers in position 6 have no contact with one another and little or no contact with officers in other positions. They are a heterogeneous group, drawn from large and small firms, some headquartered in St. Paul and some in Minneapolis.
CONTAGIOUS EVALUATIONS The criterion variable is officer opinion of specific nonprofit organizations in the Twin Cities area. Selecting among these organizations for corporate gifts is the central business of the officers. Here, officers are compared for the extent to which they have similar opinions of the ten nonprofit organizations given the most variable ratings by the population of officers. Sixty of the officers provided opinion data. Four of the criterion nonprofits are cultural services organizations (Twin Cities Public Television, Minnesota Public Radio, the Minnesota Orchestral Association, and Film in the Cities). The other six are health and welfare organizations (the Fairview Community Hospitals, the Harriet Tubman Women's Shelter, the Wilder Foundation, the Opportunity Workshop, the Sabathani Community Center, and St. Mary's Rehabilitation Center).
Contagion is measured by correlating each officer's opinion (Y) with the average opinion of the officer's peers and contacts. Officer opinion is correlated .22 in Figure 1 with the average opinion of the officer's contacts (Coh, for cohesion); Coh = Σj yjwij, where yj is contact j's opinion, and wij is a proportional weight measuring i's closeness to j. Following Galaskiewicz's original analysis, cohesion weight wij is 1/N when i and j cite each other (where N is the number of officers with whom i has reciprocal citations), and 0 otherwise. Alternative measures computed from path distances, or with weaker criteria for a tie between officers, yield similar results (Galaskiewicz and Burt, 1991).
Officer opinion is correlated .54 in Figure 1 with the average opinion of structural peers (SE, for structural equivalence); SE = Σj yjwij, where wij is an equivalence weight. Two officers are structurally equivalent to the extent that they have identical relation patterns — they are directly connected to the same other contributions personnel, through these connections they reach the same other firms with which they do not have direct contact, and they are themselves directly and indirectly cited by contributions officers in the same other firms. Equivalence weight wij is based on a substitutability weight ωij that varies from zero to one measuring i's relative structural equivalence to j (detailed discussion of equivalence and substitutability weights is available elsewhere, Burt, 1982, 1987); ωij = (i-j equivalence)ν / [Σq (i-q equivalence)ν], where equivalence is measured
Social Contagion and Social Structure, Page 5
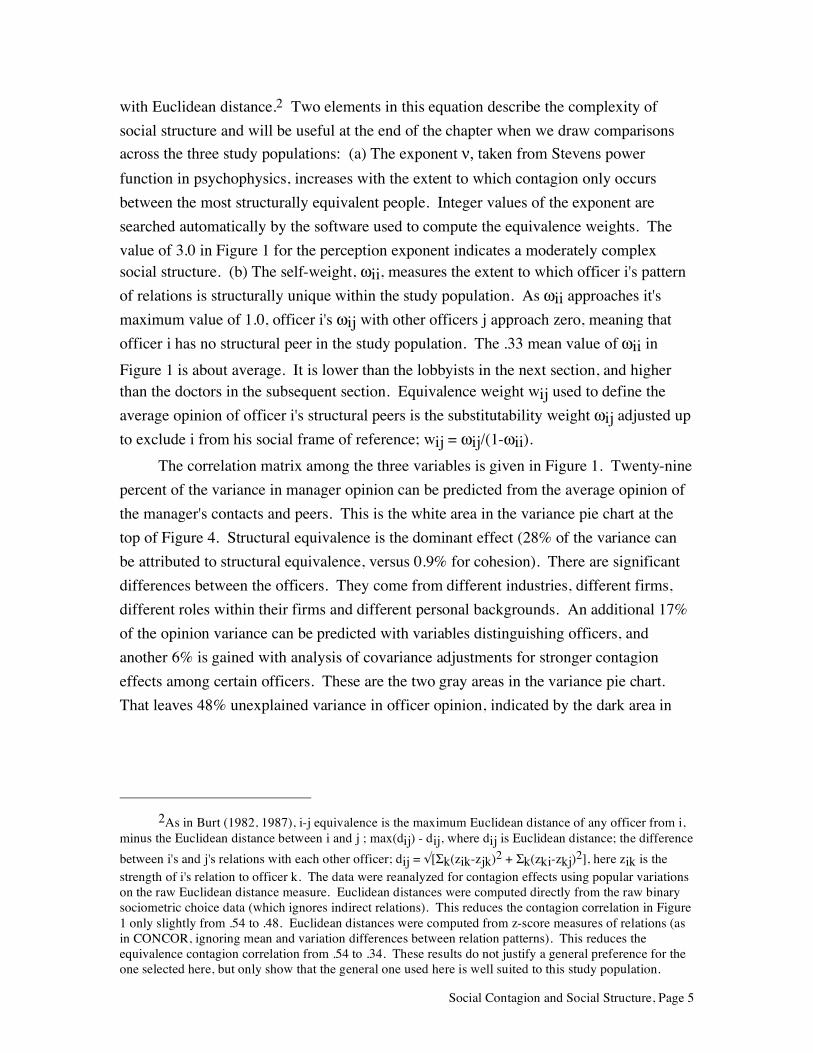
with Euclidean distance.2 Two elements in this equation describe the complexity of social structure and will be useful at the end of the chapter when we draw comparisons across the three study populations: (a) The exponent ν, taken from Stevens power function in psychophysics, increases with the extent to which contagion only occurs between the most structurally equivalent people. Integer values of the exponent are searched automatically by the software used to compute the equivalence weights. The value of 3.0 in Figure 1 for the perception exponent indicates a moderately complex social structure. (b) The self-weight, ωii, measures the extent to which officer i's pattern of relations is structurally unique within the study population. As ωii approaches it's maximum value of 1.0, officer i's ωij with other officers j approach zero, meaning that officer i has no structural peer in the study population. The .33 mean value of ωii in Figure 1 is about average. It is lower than the lobbyists in the next section, and higher than the doctors in the subsequent section. Equivalence weight wij used to define the average opinion of officer i's structural peers is the substitutability weight ωij adjusted up to exclude i from his social frame of reference; wij = ωij/(1-ωii).
The correlation matrix among the three variables is given in Figure 1. Twenty-nine percent of the variance in manager opinion can be predicted from the average opinion of the manager's contacts and peers. This is the white area in the variance pie chart at the top of Figure 4. Structural equivalence is the dominant effect (28% of the variance can be attributed to structural equivalence, versus 0.9% for cohesion). There are significant differences between the officers. They come from different industries, different firms, different roles within their firms and different personal backgrounds. An additional 17% of the opinion variance can be predicted with variables distinguishing officers, and another 6% is gained with analysis of covariance adjustments for stronger contagion effects among certain officers. These are the two gray areas in the variance pie chart. That leaves 48% unexplained variance in officer opinion, indicated by the dark area in
2As in Burt (1982, 1987), i-j equivalence is the maximum Euclidean distance of any officer from i,
minus the Euclidean distance between i and j ; max(dij) - dij, where dij is Euclidean distance; the difference between i's and j's relations with each other officer; dij = √[Σk(zik-zjk)2 + Σk(zki-zkj)2], here zik is the strength of i's relation to officer k. The data were reanalyzed for contagion effects using popular variations on the raw Euclidean distance measure. Euclidean distances were computed directly from the raw binary sociometric choice data (which ignores indirect relations). This reduces the contagion correlation in Figure 1 only slightly from .54 to .48. Euclidean distances were computed from z-score measures of relations (as in CONCOR, ignoring mean and variation differences between relation patterns). This reduces the equivalence contagion correlation from .54 to .34. These results do not justify a general preference for the one selected here, but only show that the general one used here is well suited to this study population.

Social Contagion and Social Structure, Page 6
the variance pie chart.3 The summary conclusion is that officer evaluations are strongly affected by social contagion, and the contagion is between structurally equivalent peers.
CONTAGION IN POLITICS
Now consider a relatively simple social structure. Heinz, Laumann, Nelson, and Salisbury (1993) describe the social system of elite lobbyists active in U.S. Government policy in agriculture, energy, health and labor during the early 1980s. Among the elite lobbyists are a few that Heinz et al. (1993:Chap. 10) describe as "notables" because of their special prominence as representatives. The 63 notables are the study population here. For the purposes here, we drop the "notable" qualifier to discuss the notable lobbyists as simply lobbyists. Figure 2 is a summary of social structure and contagion among them.
THE SOCIAL STRUCTURE OF LOBBYISTS Social structure is based on sociometric citations. Presented with a roster of the study population, each lobbyist was asked to indicate potential sources of support: "Please place a check by the names of people you know well enough to be confident that they would take the trouble to assist you briefly (and without a fee) if you requested it." The bar graph in Figure 2 shows closer connections between the lobbyists than between the corporate officers in the preceding section. The density of direct connections is similar (17%, versus 16% in Figure 1), but the lobbyists are much more often friends-of-friends (50% indirect connections through one intermediary, versus 33% in Figure 1), and very few pairs of lobbyists have no chain of intermediaries through whom they are connected to one another (6% of the lobbyist pairs in Figure 2, 34% of the officer pairs in Figure 1).
3The partitioned variance is a heuristic. Regression coefficients computed from the correlation
matrix in Figure 1 are .526 for structural equivalence and .041 for cohesion, with a .290 squared multiple correlation. The .290 squared multiple correlation defines the 29% in Figure 1, for which the independent contributions of structural equivalence (.281 = .526 x .535) and cohesion (.009 = .041 x .218) are given in parentheses. The correlations are computed across the 60 officers each expressing an opinion of 10 nonprofit organizations, for a total of 600 observations. Without defining specific qualities of the officers that might affect evaluations, we can get a sense of how much differences between them matter by regressing the 600 evaluations across dummy variables that distinguish each officer from every other. When we add 59 dummy variables distinguishing the 60 officers to the contagion prediction, the squared multiple correlation increases by .169 to .459 (thus the 17% in Figure 1 attributed to personal differences). When we use the dummies to capture interactions with contagion to test for slope adjustments to the aggregate contagion effect, the squared multiple correlation increases by .055 to .514 (thus the 6% in Figure 1 attributed to contagion slope adjustments). We cannot give a specific meaning to this additional explained variance, but we know that it has something to do with differences between the officers. In other words, we are not estimating network autocorrelation effects, nor testing contagion against personal differences. That work is reported elsewhere (Galaskiewicz and Burt, 1991). We are measuring contagion, then measuring how much personal differences matter above and beyond contagion.

Social Contagion and Social Structure, Page 7
—— Figure 2 About Here —— The frequenct indirect connections through one intermediary suggests that the
population has a center-periphery structure in which members are connected indirectly through shared relations with central leaders. The structure displayed in the Figure 2 sociogram is a simple star-shaped center-periphery pattern — five cliques distributed around a center position. The results are from a routine structural equivalence analysis (see footnote 1). Numbers identify sets of structurally equivalent lobbyists, and arrows indicate where the density of sociometric choices is above average. The generic pattern for a position in this structure is for people to expect support from other people in the position, and the central position. The one exception is position 2, occupied by people who do not have direct access to the central position.
The positions are linked to policy domains. All 14 of the agriculture lobbyists occupy position 1. The 15 energy lobbyists occupy position 6. Positions 2 and 3 contain all but one of the labor lobbyists, with position 2 containing the lesser players (lesser in the sense of not having direct access to the central position and in the sense of having an asymmetric acquaintance tie to position 3). Positions 4 and 5 contain all but one of the health lobbyists, with position 4 containing the lesser players (lesser in the sense of not being as widely connected to other policy domains).
The four lobbyists in position 5 operate at the center of the population. They have support contacts in all four policy domains. They come from the health policy domain, but their interests and contacts spill over into the other domains. All lawyers, the four lobbyists represent the interests of the Affiliated Food Producers, the American School Food Service Association, the California and Hawaii Sugar Companies, Farmland Industries, Land O'Lakes, the National Milk Producers's Federation, and the United Mine Workers. The boundary around them is nicely illustrated by considering the lobbyist most equivalent to them as a potential fifth member of the central position. That next person is another health lobbyist, the only person outside the agricultural domain who occupies position 1. However, he is a much more equivalent to his colleagues in position 1 than anyone in the central position 5 (equivalence reliabilities of .79 versus .49).
The four lobbyists in position 5 are not the only intermediaries that hold the other positions together. Heinz et al. (1993) emphasize the strength of ties between lobbyists in adjacent policy areas rather than through central people (thus the "hollow core"). There are 1,711 pairs of lobbyists not in position 5. The average path distance through support contacts between these 1,711 other pairs through support contacts is 1.95 if the four position 5 lobbyists are included in the network. The average path distance is almost unchanged (2.00) if the four are excluded from the network. In other words, the lobbyists

Social Contagion and Social Structure, Page 8
are separated by a single intermediary whether or not the four central people in position 5 are available to connect them.
CONTAGIOUS ECONOMIC IDEOLOGY The criterion variable is lobbyist opinion on national policy. Each lobbyist was asked to express on a scale from 1 to 5 his or her level of agreement with eight opinion items concerning government policy. The lobbyists share some beliefs. They agree that Americans should have equal access to quality medical care regardless of ability to pay. Reflecting their own positions and the interests they represent, they share a disbelief in the need to reduce income differences between occupations. We are more interested in ideas on which they disagree. The lobbyists have diverse beliefs regarding government regulation on behalf of consumers. They vary widely in their views on whether profits and power are too concentrated, and the extent to which labor unions are a benefit to the country. Still, lobbyist opinion is sufficiently correlated across items to construct a meaningful measure by averaging responses across the eight items. We have taken the average from Heinz et al. (1993), and following their analysis, we refer to the average as a measure of lobbyist "economic ideology." The measure distinguishes lobbyists on an ideological continuum ranging from extreme conservative to welfare-state liberal.
Contagion is again measured by correlating each lobbyist's ideology (Y) with the average ideology of supporters (Coh), and structural peers (SE), where Coh and SE are weighted averages computed as described on page 5.4 The perception exponent ν is only 1 in this population, indicating clearer social distinctions between the lobbyists (relative the corporate officers in the preceding section where the exponent is 3). The .09 mean substitutability weight ωii shows that the lobbyists have numerous structural peers; 91% of the average lobbyist's network position is shared with other lobbyists (versus 67% for the average corporate officer in Figure 1).
4The strong evidence of contagion by cohesion and structural equivalence between lobbyists is robust over alternative measures of cohesion and structural equivalence. In keeping with Heinz et al. (1993), lobbyist j is a key supporter for i if i cites j for support. We tried more extensive and more intensive measures. The more extensive measure was to include indirect connections. The proximity of j to i is the strength of the direct or indirect relationship from j to i as used to compute structural equivalence. This yields a contagion correlation slightly stronger than in Figure 2, but less robust in the sense that the correlation generates a slightly weaker jackknife t-test (6.9 t-test versus 7.6 for the .66 correlation in Figure 2). The more intensive measure was to limit cohesive relations to mutually recognized relations in which lobbyists i and j cite one another (as among the corporate officers in the previous section) Contagion through these relations is again slightly stronger than in Figure 2, but again less robust in the sense of generating a weaker jackknife t-test (5.7 t-test versus 7.6 for the correlation in Figure 2). We also reanalyzed the data with alternative equivalence weights. Euclidean distances were computed directly from the raw binary sociometric choice data, which reduces the contagion correlation in Figure 2 only slightly from .73 to .69. Euclidean distances were computed from z-score measures of relations, which generates an aggregate contagion correlation of .71, just about identical to the .73 result in Figure 2.

Social Contagion and Social Structure, Page 9
The correlation matrix in Figure 2 shows strong evidence of contagion by cohesion and structural equivalence. The two variables combine to describe 53% of the variance in lobbyist opinion; the white area in the variance pie chart. Personal differences between the lobbyists matter about as much as the did for the corporate officers, but with the stronger contagion effect, all but 21% of the variance in lobbyist ideology is explained.5
Structural equivalence is the stronger of the two contagion effects (50% of ideology variance can be attributed to structural equivalence, versus 3.3% for cohesion), but it is difficult to partition the contagion variance in this population. This is the kind of social structure in which cohesion and structural equivalence make similar predictions (Burt, 1987). The lobbyists are organized in terms of nonoverlapping cliques. The people in each clique are both cohesive (have strong relations with each other) and structurally equivalent (have similarly strong relations within the clique and similarly weak relations outside the clique). The result is that a lobbyist's supporters are often structural peers, so it is difficult to distinguish evidence of structural equivalence contagion from evidence of cohesion contagion. The correlation between Coh and SE in Figure 2 is higher than either variable's correlation with the criterion variable (.89 versus .73 and .66). The collinearity makes it difficult to separate cohesion from the structural equivalence effect. The most reliable conclusion is to say that social contagion has a strong effect on lobbyist economic ideology, and that cohesion and structural equivalence reinforce one another as the network conditions responsible for the contagion.
CONTAGION IN MEDICINE Last, consider a relatively complex social structure. The study population is doctors in four Illinois cities, in the mid 1950s, deciding when to begin prescribing a new antibiotic. The cities are Bloomington, Galesburg, Peoria, and Quincy. The new antibiotic is tetracycline. These are the doctors described in Coleman, Katz, and Menzel's (1966) classic study of contagion, Medical Innovation. These are the data reanalyzed to compare cohesion and structural equivalence as the condition responsible for contagion
5Detailed analysis of the diverse background data gathered in for the study led to a focus on 13
dummy variables to hold constant contagion-relevant personal differences between the lobbyists. The variables distinguish lobbyists by the policy domain in which they primarily operate (agriculture, energy, health, labor; from Laumann et al., 1992), political party (Republican, Independent, Democrat), profession (lawyer, lawyer-manager, manager), and prominence (low, average, high). Lawyers are lobbyists with law degrees working for law firms. Managers are executives and consultants without law degrees. Low prominence lobbyists are cited for support by less than eight other lobbyists. High prominence lobbyists are cited for support by more than 13 other lobbyists.

Social Contagion and Social Structure, Page 10
(Burt, 1987; Burt and Uchiyama, 1989). This is a well-known study, and the cohesion and structural equivalence contagion effects are described elsewhere in detail, so we can be brief. Figure 3 is a summary of social structure and contagion among the doctors. THE SOCIAL STRUCTURE OF DOCTORS Social structure is based on two kinds of sociometric citations among the doctors, advice and discussion. Doctors were asked to name names of advisors: "When you need information or advice about questions of therapy where do you usually turn?" They were also asked to name discussion partners: "And who are the three or four physicians with whom you most often find yourself discussing cases or therapy in the course of an ordinary week — last week for instance?" Their responses define a (240,240) matrix of sociometric choices where a 1 indicates that the row doctor cited the column doctor as an advisor or discussion partner. Embedded in the large network are 125 "prescription sample" physicians whose behavior is to be explained. There are no citations between cities, so the large matrix can be analyzed in four sections, one for each of the four study cities.
—— Figure 3 About Here —— The doctors lived in a complex social structure. The complexity is apparent from
the connections between individuals, and the aggregate structure of their relations. The bar graph in Figure 3 shows that the doctors are not close. Only 5% of the doctor pairs are directly connected, and another 10% are connected indirectly through one intermediary. The average physician is connected either directly or indirectly with the majority of other physicians in his city, however, that connection is typically through multiple intermediaries, and 39% of the doctor pairs have no chain of intermediaries through whom they are connected. The network image portrayed is one of communities held together by strands of asymmetric professional relations through one or more intermediaries. It is correct to view the physicians in each city as connected for the most part within a single professional community. At the same time, it would be incorrect to think of them as members of cohesive cliques.
The sociograms in Figure 3 illustrate the structural complexity of the networks. Peoria and Bloomington are presented. Each city was subjected to a routine structural equivalence analyses (see footnote 1). Numbers identify sets of structurally equivalent doctors, and arrows indicate where the density of choices is above average. Doctors are organized around central positions in each city, but the center is rarely unidimensional. Galesburg (not presented) is the least complicated, with a strong center position, an isolated clique, and a satellite position occupied by doctors who are not cited as advisors or discussion partners but claim direct access to the most central physicians.

Social Contagion and Social Structure, Page 11
Bloomington has a strong center position (position 1), but there are also two internally connected cliques affiliated with, but distinct from, the center (positions 2 and 3). Quincy has two center positions. The social structure of Peoria doctors is the most complicated, with two interlocked center positions (positions 1 and 2) and three internally cohesive cliques affiliated with the center (positions 3, 4, and 5).
CONTAGIOUS ADOPTIONS The criterion variable is the date by which each physician began writing prescriptions for the new antibiotic. Local pharmacy records were searched for prescriptions written by the 125 "prescription sample" doctors. The result is an "adoption date" variable ranging from 1 to 17 roughly indicating the month after tetracycline's release in which a doctor first began prescribing the new antibiotic. Sixteen doctors were nonadopters in the sense that the prescription sampling turned up prescriptions that they had written, but no tetracycline prescriptions. As in the original study, we use these doctors to define a final point in tetracycline's diffusion, category 18 on the adoption date variable.
Contagion is again measured by correlating each doctor's adoption date (Y) with the average adoption date of his advisors and discussion partners (Coh), and the average adoption date of his structural peers (SE), where Coh and SE are weighted averages computed as described on page 5.6 The search across alternative values of the power exponent ν yields different exponents for different cities, but in general reflects the complexity of these social structures. The exponent is 2 in Galesburg which contains a single center position, 10 in the more complex social structures of Bloomington and Quincy containing multiple center positions, and 12 in the still more complex social structure of Peoria. The average across prescription sample doctors is the 9.8 in Figure 3. The near-maximum .84 mean substitutability weight ωii shows that the doctors have few structural peers; only 16% of the average doctor's network position is shared with other doctors (versus 91% for the average lobbyist in Figure 2, and 67% for the average corporate officer in Figure 1).
The correlation matrix in Figure 3 shows evidence of contagion by structural equivalence, but no evidence of contagion by cohesion. The two variables combine to describe 14% of the variance in adoption dates (white area in the variance pie chart). Personal differences between the doctors matter. Five variables distinguishing personal
6We follow the original study in using direct sociometric choices to define sources of contagion.
Cohesion weight wij is one over the number of i's cited advisors and discussion partners. We get similar results with alternative measures of cohesion and alternative measures of structural equivalence (Burt, 1987; Burt and Uchiyama, 1989).

Social Contagion and Social Structure, Page 12
differences among the doctors describe another 26% of the variance in adoption dates (gray areas in the variance pie chart). The doctors predisposed toward adopting the new antibiotic were professionally young, kept up to date with scientific developments in medicine, and believed that such behavior was important to being a good physician. The greater effect of contagion by structural equivalence, and the stronger effect of personal predisposition toward adoption, are the central points developed at length in Burt (1987). The conclusion here is that social contagion affected doctor adoption, but the contagion is entirely between structurally equivalent peers, and it is a weaker cause than the doctor's personal predisposition toward adoption.
CONCLUSION Comparisons between the study populations are summarized in Figure 4 with data from Figures 1, 2, and 3. Populations are ordered on the horizontal axis by the relative strength of contagion and personal preferences within the population. For example, Figure 3 shows that 14% of the variance in Medical Innovation adoption dates can be attributed to contagion, versus 26% attributed to personal background variables that predispose a doctor to early adoption. The ratio is .53, which puts the Medical Innovation doctors to the left of Figure 4. Contagion has a stronger effect on the opinions of the corporate officers (1.71 = 29%/17% from Figure 1), and a still stronger effect on the opinions of the lobbyists (2.52 = 53%/21% from Figure 2).
Our argument is that more complex social structures obscure the social frame of reference responsible for contagion. Where it is difficult to answer the question "Who am I?" it is difficult to answer the question "Who is like me?" — which lessens the importance of resolving differences from others' ideas and behaviors. Consider this claim in light of Figure 4.
—— Figure 4 About Here —— The vertical axis to the left of Figure 4 describes the extent to which people are
connected by long chains of asymmetric relationships. Asymmetric relations means that you are talking to the back of someone's head as they talk to someone else; social influence is less likely than if the exchange is reciprocal. Short chains of relations make it easier to know the boundary of the social frame around you. Figure 4 shows that the doctors, where contagion is weakest, tend to be connected by long chains of asymmetric relationships; 75% of their advisors and discussion partners turn to someone else for advice and discussion, 85% of their connections with colleagues require more than one intermediary. The thin lines in Figure 4 continue down through the corporate officers, to their minimum among the lobbyists, where contagion is strongest. The lobbyists tend to

Social Contagion and Social Structure, Page 13
be connected by short chains of reciprocated citations; 69% of their support citations are reciprocated, and 67% of their connections with other lobbyists are direct or indirect through only one intermediary.
The vertical axis to the right of Figure 4 describes the extent to which people are structurally differentiated from one another. The substitutability coefficient ωii measures the extent to which a person's pattern of relations is unlike any other pattern in the study population (see page 5). The more unique the pattern, the more ambiguous the social frame of reference defined by the pattern. The power function exponent ν indicates the extent to which contagion is limited to people who have only the most similar patterns of relations. Figure 4 shows that structural differentiation is greatest among the doctors, where contagion is weakest. The patterns of advising and discussion among the doctors are so complex that the average doctor holds a unique position in social structure (.84 mean ωii). The bold lines indicating structural differentiation continue down in the graph through the corporate officers, to their minimum among the lobbyists, where contagion is strongest. The average lobbyist has an easily discerned group of colleagues with whom he or she shares a position in social structure (.09 mean ωii ).
In sum, ideas and behaviors are less contagious where social structure is more complex. The more general point is that social contagion processes are contingent on the broader social structure in which they occur.
REFERENCES Burt, Ronald S. (1982) Toward a Structural Theory of Action. New York: Academic
Press. Burt, Ronald S. (1987) "Social contagion and innovation, cohesion versus structural
equivalence." American Journal of Sociology 92:1287-1335. Burt, Ronald S. and Tetsuji Uchiyama (1989) "The conditional significance of
communication for interpersonal influence." Pp. 67-87 in The Small World, edited by M. Kochen. Norwood, NJ: Ablex.
Coleman, James S., Elihu Katz, and Herbert Menzel. (1966) Medical Innovation. New York: Bobbs-Merrill.
Galaskiewicz, Joseph (1985) Social Organization of an Urban Grants Economy. New York: Academic Press.
Galaskiewicz, Joseph (1995) "An urban grants economy revisited: company contributions in the twin cities, 1979-81, 1987-89." Department of Sociology, University of Minnesota.
Galaskiewicz, Joseph and Ronald S. Burt (1991) "Interorganization contagion in corporate philanthropy." Administrative Science Quarterly 36:88-105.

Social Contagion and Social Structure, Page 14
Heinz, John P., Edward O. Laumann, Robert L. Nelson, and Robert H. Salisbury. (1993) The Hollow Core. Cambridge, MA: Harvard University Press.
Laumann, Edward O., Tony Tam, John P. Heinz with Robert L. Nelson and Robert H. Salisbury (1992) "The social organization of the Washington establishment during the first Reagan administration: a network analysis." Pp. XX-XX in Research in Politics and Society, Vol. 8, edited by G. Moore and J. A. Whitt. Greenwich, CT: JAI Press.

Figure 1. Interorganization ContagionPeople: 60 corporate officers responsible for their company’s donations to local non-profits.Contagion: Opinion of specific non-profit organizations as worthy recipients of donations.Community structure: Hierarchical center-periphery in which officers often haveclear peers (perception exponent n is 3.0, mean structural uniqueness wii is .33, meandmaxi is 4.28).
Residual variance
1.00 0.54 0.22 Y 1.00 0.34 Equivalence 1.00 Connectivity
49%
Additional from contagion interaction withpersonal differences
6%
Additional variance from personal differences17%
Contagion variance (28.1% from equivalence,0.9% from connectivity)
29%
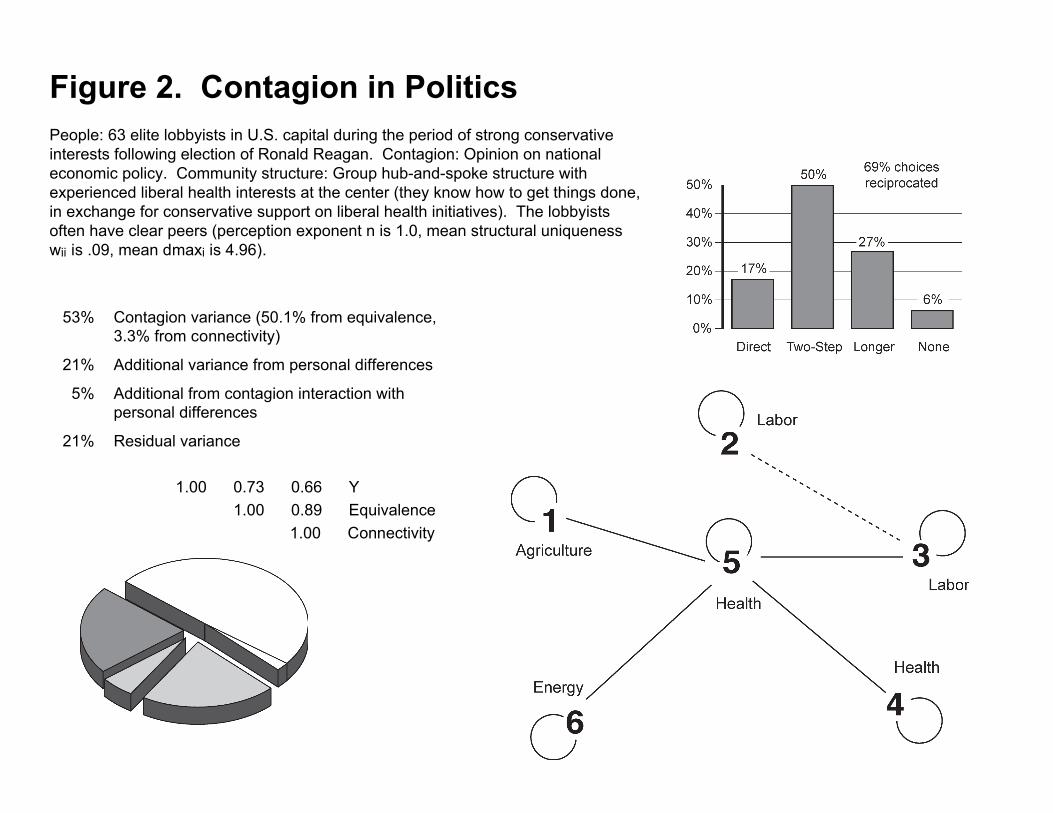
Figure 2. Contagion in PoliticsPeople: 63 elite lobbyists in U.S. capital during the period of strong conservativeinterests following election of Ronald Reagan. Contagion: Opinion on nationaleconomic policy. Community structure: Group hub-and-spoke structure withexperienced liberal health interests at the center (they know how to get things done,in exchange for conservative support on liberal health initiatives). The lobbyistsoften have clear peers (perception exponent n is 1.0, mean structural uniquenesswii is .09, mean dmaxi is 4.96).
Residual variance
1.00 0.73 0.66 Y 1.00 0.89 Equivalence 1.00 Connectivity
21%
Additional from contagion interaction withpersonal differences
5%
Additional variance from personal differences21%
Contagion variance (50.1% from equivalence,3.3% from connectivity)
53%

Figure 3. Contagion in MedicinePeople: 125 doctors likely to find use for a newly-released antibiotic (pediatricians,internists, and general practitioners). Contagion: Month in which doctor beganprescribing the new antibiotic. Community structure: Complex advice and discussionstructure in which doctors rarely have clear peers (perception exponent n is 9.8, meanstructural uniqueness wii is .84, mean dmaxi is 2.78).
Residual variance
1.00 0.35 -.01 Y 1.00 0.31 Equivalence 1.00 Connectivity
58%
Additional from contagion interaction withpersonal differences
2%
Additional variance from personal differences26%
Contagion variance (13.6% from equivalence,0.1% from connectivity)
14%
Peoria(62 doctors)
Bloomington(24 doctors)

Figure 4. Ideas and Behavior Are Less ContagiousWhere Social Structure Is More Complex.