social preferences and strategic uncertainty: an
TRANSCRIPT

2261
American Economic Review 100 (December 2010): 2261–2278http://www.aeaweb.org/articles.php?doi=10.1257/aer.100.5.2261
Many economists now accept that individuals have social (i.e., distributional) and/or reciprocal preferences. An important consequence of this is that they dislike inequality in rewards (Truman F. Bewley 1999). This consideration notwithstanding, Eyal Winter (2004) has shown that, in activities which display strategic complementarities (take, for example, Michael Kremer’s (1993) well-known “O-ring” production function), inequalities in rewards are necessary to implement the high-effort profile as the unique equilibrium of the game. This is because, “if agents’ exertion of effort induces a positive externality on the effectiveness of other agents’ effort, it is optimal to promise high rewards to some agents so as to make the others confidently believe that these highly paid agents will contribute, hence allowing the planner to save resources by offering other agents substantially less.”
Winter’s (2004) result abstracts from the existence of social preferences, but it adds an addi-tional ingredient to the debate on inequality by showing that the principal faces a trade-off between fairness and robustness: fairness can be obtained only at the expense of robustness to
Social Preferences and Strategic Uncertainty: An Experiment on Markets and Contracts
By Antonio Cabrales, Raffaele Miniaci, Marco Piovesan, and Giovanni Ponti*
This paper reports a three-phase experiment on a stylized labor market. In the first two phases, agents face simple games, which we use to estimate subjects’ social and reciprocity concerns. In the last phase, four principals compete by offering agents a contract from a fixed menu. Then, agents “choose to work” for a principal by selecting one of the available contracts. We find that (i) (hetero-geneous) social preferences are significant determinants of choices, (ii) for both principals and agents, strategic uncertainty aversion is a stronger determinant of choices than fairness, and (iii) agents display a marked propensity to work for principals with similar distributional concerns. (JEL D82, D86, J41)
* Cabrales: Department of Economics, Universidad Carlos III de Madrid, Madrid 126, 28903 Getafe, Spain (e-mail: [email protected]); Miniaci: Dipartimento di Scienze Economiche, Università di Brescia, Via San Faustino, 74/b, Brescia, Italy (e-mail: [email protected]); Piovesan: Department of Economics, University of Copenhagen, Øster Farimagsgade 5, DK-1353 Copenhagen, Denmark (e-mail: [email protected]); Ponti: Dipartimento di Scienze Economiche ed Aziendali LUISS Guido Carli and Departamento de Fundamentos del Análisis Económico, Universidad de Alicante, Campus de San Vicente, 03080 Alicante, Spain (e-mail: [email protected]). The authors are grateful to P. Battigalli, G. Charness, L. Collado, D. Di Cagno, G. Harrison, J. Hey, J. Kovarik, D. López-Pintado, S. Mancinelli, E. Martinez, R. Martinez, A. Nicolò, P. Rey-Biel, J. Sobel, J. Weibull, and seminar participants at Bocconi University, Catholic University of Milan, LUISS-Rome, and Stockholm School of Economics for stimulating comments and suggestions. We are also especially thankful to three anonymous referees and the coeditor, Vincent Crawford, whose detailed comments helped us to greatly improve the quality of the manuscript. The usual disclaimers apply. Financial support from MCyT (SEJ 2007-62656, SEJ2006-11665-C02-00 and Consolider-Ingenio 2010, CSD2006-00016), MIUR (PRIN 2007MCKEYA), Generalitat Valenciana (Rese Gruposo3/086) and the Instituto Valenciano de Investigaciones Económicas (IVIE) is gratefully acknowledged.
DEcEmBER 20102262 THE AmERIcAN EcONOmIc REVIEW
strategic uncertainty.1 In this respect, one can only expect this trade-off to be exacerbated by the presence of (inequality-averse) distributional preferences.
The aim of this paper is precisely to test experimentally the idea that workers’ (heterogeneous) social preferences are crucial in determining the contracts they are offered and choose.2 We are also interested in the way our experimental subjects resolve the trade-off between fairness and robustness, as they can choose either (i) contracts in which—following Winter (2004)—the all-effort profile is the unique equilibrium, but inequality is enhanced; or (ii) contracts in which the all-effort profile is not the unique equilibrium, but inequality is mitigated. In this respect, subjects more concerned with equity (and less worried about coordination failure) may find convenient to opt for the latter alternative. Finally, since another solution to the trade-off is sorting (agents with similar distributional concerns work for the same firms), this will also be an important element of our experimental design.3
With these goals in mind, we design and perform an experiment with three phases.
(1) In the first phase (P1), subjects are matched for 24 rounds with a different partner and have to choose among four possible options involving a payoff pair—one for them, one for their matched partner—in a (Random) Dictator Game-type protocol. We use evidence from P1 to estimate subjects’ purely distributional preference parameters within the realm of Gary Charness and Matthew Rabin’s (2002, C&R hereafter) model.
(2) In the second phase (P2), subjects are again matched in pairs for 24 rounds and asked to choose among the same sets of payoff pairs. However, this time options correspond to contracts, as they yield a 2 × 2 effort game induced by Winter’s (2004) technology, which subjects have then to play at a second stage. In P2 reciprocity may play a role, since agents may condition their second-stage effort decision on their teammate’s con-tract choice. Thus, we use P2 to estimate subjects’ C&R reciprocity parameters, together with their beliefs in the effort game.
(3) Finally, in the third phase (P3), there are four principals and four pairs (“teams”) of agents. Principals offer a contract (a 2 × 2 game, such as those played in P2) selected from the round choice set. The presence of several competing principals acts as a kind of menu of contracts, among which agents may sort themselves.
This three-stage experimental design (and the associated estimation strategy) is especially designed to solve the identification problem discussed by Charles F. Manski (2002), as we use it to disentangle preference and belief parameters. Since in P1 beliefs do not play any role, we use data from P1 to identify distributional preference parameters and data from P2 to estimate reciprocity concerns and beliefs.
1 John B. Van Huyck, Raymond C. Battalio, and Richard O. Beil (1990, 1991) and Frank Heinemann, Rosemarie Nagel, and Peter Ockenfels (2009) experiments measure the extent and importance of strategic uncertainty in coordina-tion games. Vincent P. Crawford (1995) and Crawford and Hans Haller (1990) are theoretical papers partly inspired by these experimental results. Dunia López-Pintado, Ponti, and Eyal Winter (2008) test directly Winter’s (2004) model in the lab.
2 See Chaim Fershtman, Hans K. Hvide and Yoram Weiss (2005), Pedro Rey-Biel (2008), and Michael Kosfeld and Ferdinand von Siemens (2009) for theoretical results and Ernst Fehr, Alexander Klein, and Klaus M. Schmidt (2007) for experimental evidence.
3 Cabrales, Antoni Calvó-Armengol, and Nicola Pavoni (2008), Cabrales and Calvó-Armengol (2008) and Sabrina Teyssier (2008) show that social preferences lead to more productive workers sorting themselves into different firms than the remaining workers. On the empirical literature on (social) preferences and sorting, see also Thomas Dohmen and Armin Falk (2006), Alan B. Krueger and David A. Schkade (2008) and Charles Bellemare and Bruce S. Shearer (2006).

VOL. 100 NO. 5 2263cABRALEs ET AL .: sOcIAL PREfERENcEs AND sTRATEgIc UNcERTAINTy
We here summarize the main results of our study.
(1) subjects display a significant degree of heterogeneity in their decisions, and thus, in esti-mated preferences and beliefs.
(2) This heterogeneity explains, to a large extent, agents’ behavior. That is, preferences and beliefs which best explain agents’ behavior in P1 and P2 also predict well their effort deci-sions in P3.
(3) We also observe that equality is a less important concern than robustness, for both princi-pals and agents, since the egalitarian (but not robust) contract is rarely selected and, when it is selected, very often yields the (inefficient) low effort outcome. This, in turn, implies lower profits, for both principals and agents.
(4) Finally, we find that principals and agents sort themselves according with their social preferences. An agent’s probability of selecting a contract in P3 decreases with the dis-tance between her estimated preferences and those of the principal for whom she ends up working. Moreover, principals usually offer contracts in tune with their own estimated distributional preferences.
The remainder of this paper is arranged as follows. Section I presents the experimental design, while in Section II we develop an econometric model to estimate distributional preferences and beliefs. Section III presents the experimental results and discusses our testable hypotheses. Final remarks are placed in Section IV. Web Appendices provide proofs, additional statistical evidence and the experimental instructions. http://www.aeaweb.org/articles.php?doi=10.1257/aer.100.5.2262.
I. Experimental Design
A. sessions
Nine experimental sessions were conducted at the Laboratory of Theoretical and Experimental Economics (LaTEx), of the Universidad de Alicante. A total of 216 students (24 per session) were recruited among the undergraduate population of the Universidad de Alicante. The experi-mental sessions were computerized. Instructions were read aloud, and we let subjects ask about any doubt they may have had.4 In all sessions, subjects were divided into two matching groups of 12, with subjects from different matching groups never interacting with each other throughout the session.
B. choice sets
Our experiment involves, for each one of the 24 rounds t constituting each phase, two subjects, 1 and 2, deciding over a set of four options ct = {bt
k}, k = 1, ... 4. Each option constitutes a mon-etary payoff pair bt
k ≡ (b 1tk , b 2t
k ), with b 1tk ≥ b 2t
k by construction. Each pair determines the payoff matrix of a simple 2 × 2 effort game, g(k). The rules of g(k) are as follows. Each agent i = 1, 2, has to decide, simultaneously and independently, whether to make a costly effort. We denote
4 The experiment was programmed and conducted with the software z-Tree (Urs Fischbacher 2007).

DEcEmBER 20102264 THE AmERIcAN EcONOmIc REVIEW
by δi ∈ {0, 1} agent i’s effort decision, where δi = 1 (0) if agent i does (not) make effort. Let also δ = (δ1, δ2) denote agents’ action profile. Agent i’s monetary payoff, π k
it (δ), is described by
(1) π itk (δ) = B + P(δ)bit
k − δi c;
with
(2) 0 if δ1 + δ2 = 0,
P(δ) = µ γ if δ1 + δ2 = 1,
1 if δ1 + δ2 = 2,
where B is a fixed monetary prize independent on effort decision, c is the cost of effort, and γ ∈ (0, 1 _
2 ).5 By (2), players receive their full payoff, bit
k , if they both coordinate on the effort decision, and a fixed share of the latter if only one makes effort. If nobody makes effort (i.e., if δ1 + δ2 = 0), both agents only get B. In our experiment we fix B = 40, c = 10 and γ = 1 _
4 .
In Figure 1 we report all payoff pairs btk used in the experiment. As Figure 1 shows, these
payoff pairs are drawn at random in the positive orthant, but not uniformly. Precisely, they are concentrated in two “clouds,” which differ from one another by the fact that, for one of them, player 1 (the “advantaged” player within the two-member team) receives substantially more. As we explain in detail in Appendix A, these two clouds include pairs bt
k which are the solutions of two different mechanism design problems aimed at inducing both players to make effort. The two mechanism design problems differ in that:
(1) Under the “weak effort inducing” solution (wing hereafter) players have a strict incentive to make effort only if the other does;
5 See Winter (2004) for details.
b2
20 40 60 80 100
10
20
30
40
50
b1
b1 = b2
STING
WING
Figure 1. The Experimental Choice Set

VOL. 100 NO. 5 2265cABRALEs ET AL .: sOcIAL PREfERENcEs AND sTRATEgIc UNcERTAINTy
(2) Under the “strong effort inducing” solution (sting hereafter) player 1’s payoff is suf-ficiently high to provide her with a strict incentive to make effort independently of what player 2 does, while player 2, as in the wing solution, has a strict incentive to make effort only if player 1 does.
This implies that, under the sting solution, the all-effort profile is the unique equilibrium of the induced game, while under the wing solution the all–no effort profile is an equilibrium.
Unlike Winter (2004), who focuses on Egoistic (i.e., non distributional) Preferences (EP), we solve the two mechanism design problems under a wide variety of distributional preferences ana-lyzed by the literature. This explains the additional payoff variability within each cloud (where the larger points in each cloud identify the corresponding EP solutions).
The interested reader can find in Appendix A all the details. What is important to stress here is that our choice set provides sufficient variability in payoffs to estimate individual social pref-erences in Section II, and that the specific variability we created (essentially, payoffs of similar magnitude for player 2, but a substantial difference in prizes in favor of player 1, depending on whether a wing or a sting solution is applied) allows us to quantify the discussion on the trade-off between equality and robustness we proposed earlier.6
Depending on the round t, the choice set ct can be composed of (i) four wing contracts; (ii) four sting; or (iii) two wing and two sting. We group rounds into time intervals. A time inter-val is defined as a group of three consecutive rounds: τp = {3(p − 1) < t ≤ 3p}, p = 1, ..., 8. Within each time interval τp , subjects experienced each and every possible situation, (i) to (iii). The particular sequence of three situations within each time interval was randomly gen-erated. We did so to keep under control the time distance between two rounds characterized by the same situation.
C. Phases
Subjects played three phases, P1 to P3, of increasing complexity, for a total of 72 rounds (24 rounds per phase).7
P1: Dictator Game (24 rounds).—In this phase we use a variant of the classic protocol of the Dictator Game. The timing for each round t and matching group is as follows:
(1) At the beginning of the round, six pairs are formed at random. Within each pair, another (independent and uniformly distributed) random device determines player position (i.e., the identity of the best paid agent).
(2) Both agents choose their preferred option. In P1, monetary payoffs associated with each option correspond to the all-effort profile payoff, π k
it (1, 1).8
6 The fact that monetary payoffs are derived from a specific theoretical exercise—instead of being simply randomly generated—has no further impact on our experimental design. Subjects were not told at any time where those numbers came from. They simply had to choose, at each round, one out of four different options, with no further explanation.
7 A new set of instructions was distributed at the beginning of each phase. In this sense, subjects were not aware at all times about the rules of the phases to follow.
8 In P1 agents see only the four payoff pairs (π k1t(1,1), π k
2t(1,1)), without any reference to the game-form that generated them, g(k). By contrast, in P2 and P3 agents see the full payoff matrices, both when they have to choose their preferred contract, and when they have to play it. Snapshots of the user interfaces for all phases are provided in Appendix C, together with the experimental instructions.

DEcEmBER 20102266 THE AmERIcAN EcONOmIc REVIEW
(3) Once choices are made, another independent draw fixes the identity of the Dictator.
(4) The Dictator’s choice, k, determines monetary payoffs for that pair and round.
P2: Effort Game (24 rounds).—Stages 1 to 3 are identical to those of P1. Instead of stage 4, we have:
Four subjects are asked to play the 2 × 2 effort game, g(k), described in Appendix A. Subjects’ action profile determines their financial reward (1).
P3: Market (24 rounds).—At the beginning of P3, within each matching group, four subjects are randomly chosen to act as “principals.” Then, in each round t, these four principals have to select one contract within the choice set ct to be offered to the four teams of agents in their matching group. We denoted by ct
0 ⊆ ct the set of contracts offered by at least one principal (this set may be a singleton, since contracts offered by principals may all coincide, as often hap-pened in the experiment). Agents have then to choose within this subset ct
0. Stages 2–4 are then identical to those of P2. The payoff for the principal—associated with each team that selected his contract—is calculated as the difference between total output, V, and total costs:
π k0(δ) = P(δ)(V − b1
k − b2k),
with V uniformly distributed within the interval [100, 150]. In other words, when a single princi-pal is matched with several teams, the payoff for that principal simply adds the ones he receives by the interaction with each team. Suppose, on the other hand, that the same contract is offered by more than one principal and that contract is accepted by some team (or teams). Then, the principal receives, for each accepting team, the payoff derived from the interaction with that team, divided by the number of principals offering that contract. Notice that this is equivalent to the payoff that would be obtained by randomly and independently matching each accepting team with one of the principal suppliers of that contract.
D. Player and Dictator Assignment
As we just explained, player position (either 1 or 2) is assigned randomly, for each team and round. This is to fully identify the distributional parameters of our model for each individual sub-ject participating in the experiment—see (3) below. The Dictator position is also assigned ran-domly, for each team and round. In this respect, we apply the so-called Random Dictator protocol (Glenn W. Harrison and Tanga McDaniel 2008). In Section IIID we further discuss the robustness of our results with respect to these two delicate design choices, presenting evidence from two alternative treatments, in which we vary both players and Dictator assignment protocols.
E. feedback
At the end of each round, agents obtained full information about the other teammate’s behavior. This applies to P1 (where only one decision is made) as well as P2 and P3 (where the other teammate’s contract choice is communicated before agents have to make their effort decisions). As for principals in P3, all payoff relevant information is revealed at the end of each round (how many Dictators and other principals have selected their option, together with the agents’ effort profiles).

VOL. 100 NO. 5 2267cABRALEs ET AL .: sOcIAL PREfERENcEs AND sTRATEgIc UNcERTAINTy
F. monetary Payoffs
All monetary payoffs in the experiment were expressed in Spanish pesetas (1 euro is approxi-mately 166 ptas.). Subjects received 1,000 ptas. just to show up, to which they summed up all their cumulative earnings throughout the 24 × 3 = 72 rounds of the experiment. Average earn-ings were about 21 euros, for an experimental session lasting for approximately 90 minutes.
G. Three Testable Questions
We are now in the position to specify the main objectives of our experiment.
(1) Is it inequality aversion or strategic uncertainty aversion? Contracts have been calculated using two different mechanism design strategies, with rather different distributional proper-ties. Two kinds of questions arise here.
(a) Which contract type (sting or wing) is chosen more often by principals and agents? Evidence for this in Remark 1.
(b) What is the role of strategic uncertainty? That is, to what extent does the (non) existence of multiple equilibria in wing (sting) affects agents’ behavior in the effort game? Evidence for this in Remark 2 and Remark 3.
(2) Do models of social preferences work? That is, does a model with distributional and reciproc-ity preferences provide a reliable framework to predict principals and agents’ behavior? Evidence for this in Remark 4 and Remark 5.
(3) Does separation emerge? That is, is the market able to sort (principals and) agents according to their social preferences? Evidence for this in Remark 6.
II. Identifying Preferences and Beliefs
In what follows, i and j identify our subjects matched in pairs, and we drop the round index, t, whenever this does not create any ambiguity. We assume that our subjects’ preferences follow C&R, as we explain in the following:
Definition 1 (C&R Preferences)
(3) ui(δ) = πi(δ)
− (αi − θi ϕj)max{πj(δ) − πi(δ), 0} − (βi + θi ϕj)max{πi(δ) − πj (δ), 0},
where ϕj = − 1 if j “has misbehaved,” and ϕj = 0 otherwise (we provide an operational definition of misbehavior in equation (4) below). In words, if player j has misbehaved, player i increases her “envy” parameter αi (or lowers her “guilt” parameter βi) by an amount equal to θi. Thus, θi can be interpreted as player i’s sensitivity to negative reciprocity. Model (3) has the useful feature that it subsumes parameters which account for subjects’ distributional tastes à la Fehr and Schmidt (1999, F&S hereafter), αi and βi, as well as for their tastes for reciprocity, θi.
In P1, both agents select their preferred option, after which a random draw determines the identity of the Dictator and both agents earn the monetary payoff associated with the Dictator’s choice. Thus, by design, agents in P1 cannot reciprocate their teammates’ decision. In this

DEcEmBER 20102268 THE AmERIcAN EcONOmIc REVIEW
sense, we can use evidence from P1 to estimate the distributional preferences parameters of (3), αi and βi.
In P2, after selecting in Stage 1 their favorite contract, k, agents are asked to play the induced effort game, g(k), in which they may condition their effort decision upon the (publicly known) contract choice of their teammate. This, in turn, implies that we can use evidence from P2 to esti-mate subjects’ reciprocal concerns. To do this, we need first to operationally identify what mis-behavior means in the context of our experimental set-up. In this respect, we shall use contract choice decision by j in Stage 1, kj:
− 1 if bjkj = maxc bj
k, and bikj ≠ maxc bi
k,(4) ϕj = e
0 otherwise.
By (4), j misbehaves by choosing a contract kj which gives him the highest possible benefit (max c bj
k) but does not give i her highest possible benefit (maxc bik).9
We can now look at agents’ effort decisions in P2 as the result of a process of expected utility maximization. Individual i will choose to make effort in Stage 2 (δi
k = 1) if
(5) Eλik Cui
k(1, δjk) − ui
k(0, δjk)D > 0,
where Eλik [·] indicates the expected value taken with respect to player i’s beliefs on j’s effort
decision, λik. We parametrize λi
k as a logistic function of the distributional features of con-tract k, bj
k and (bik − bj
k), and on player i’s role (Di = 1 if individual i is the Dictator, and zero otherwise)
(6) λik =
exp Aψ1Di + ψ2bjk + ψ3(bi
k − bjk)B ____
1 + exp Aψ1Di + ψ2bjk + ψ3(bi
k − bjk)B.
Notice that, in contrast with Bellemare, Sabine Kröger, and Arthur van Soest (2008) or Nagore Iriberri and Rey-Biel (2008), we do not directly ask subjects to elicit their beliefs, λi
k. Instead, we derive them—indirectly—via their own effort decision. We opted for this design because it allows us to identify cleanly the distributional preferences, separating them from belief identifi-cation, without distracting the subjects with new tasks.10
Our belief specification (6) allows player i to anticipate that her own Dictator role in Stage 1 may affect j’s willingness to make effort. In addition, ψ2 and ψ3 proxy the effect associated with absolute and relative payoffs. Our specification for the reciprocity parameter θi in (3) allows j’s behavior to affect i’s effort decision differently, according to i′ s player position (Li = 1 if indi-vidual i is player 2, and zero otherwise) and to the Dictator assignment:
(7) θi = θ0 + θ1Di + θ2Li.
9 This definition has the advantage of being well defined for the three experimental treatments we have run. Results are qualitatively similar for many other definitions we have tried.
10 As Yaw Nyarko and Andrew Schotter (2002) acknowledge, belief elicitation has its own problems, since “As is true of all scoring functions, while payoffs are maximized by truthful revelation of beliefs, there are other beliefs that could be stated that are more secure [...] If subjects were risk averse, such an action might be desirable.”

VOL. 100 NO. 5 2269cABRALEs ET AL .: sOcIAL PREfERENcEs AND sTRATEgIc UNcERTAINTy
We exploit the observed contract choice in P1 to estimate, for each individual, subjects’ distribu-tional preference parameters (αi , βi ) by modeling the probability that individual i chooses option k at round t of P1 as
(8) Pr Ayit = k|αi , βi , ct = EbtkF, LitB = exp Auit
kB / ∑ m=1
4
exp AuitmB ,
where uitm is the all-effort utility of individual i when option m is chosen at round t. Since we posit
that distributional preferences estimated in P1 are constant across phases, effort decisions taken in Stage 2 of P2 reveal individuals’ subjective belief over their teammates’ effort decision (i.e., ψ = (ψ1, ψ2, ψ3)′ ) and their own sensitivity to reciprocity (i.e., θ = (θ0, θ1, θ2)′ ). Consistently, our estimation strategy is a two-step procedure: (i) we first get estimates of the distributional parame-ters, α i and β i, by maximizing the individual log-likelihood lni = ∑ t,k
1 (yit = k) lnPr(yit = k | αi,
βi, ct, Li) using data from P1; (ii) we then model the probability that individual i provides effort in Stage 2 of P2, given the contract k chosen by the Dictator, as
(9) Pr Aδik = 1|αi, βi, ψ, θ, (b1
k, b2k), Li, Di, ϕjB =
exp A E λ i k [ui
k(1, δjk)]B ___
exp A E λ i k [ui
k(1, δjk)]) + exp( E λ i
k [uik(0, δj
k)]B
and we estimate—via partial maximum likelihood—the parameters of interest ψ and θ replacing α i and β i in (9). Given the two-step nature of the procedure, we use P1 data to obtain N = 150 bootstrap estimates of (αi, βi) for each of the 72 subjects, and we use them to obtain a bootstrap distribution of Step 2 estimates.
In Figure 2 we plot the estimated αi and βi of each member of our subject pool. Figure 2 is composed of two graphs:
1) In Figure 2 panel A each subject corresponds to a point in the (αi, βi) space. Figure 2 panel A makes clear that our subjects display significant heterogeneity in their distribu-tional preferences. As we discuss in Appendix B1, (some subsets of) the different quad-rants in Figure 2 are related to some classes of social preferences which the literature
0 1 2 3
–2
–1
0
1
2
3
0 1 2 3
0
1
2
3
αi
–2
–1
–2 –2–1 –1
βi
Panel A Panel B
Figure 2. Estimating Distributional Preferences

DEcEmBER 20102270 THE AmERIcAN EcONOmIc REVIEW
has been interested in. Our estimates can shed light on the prevalence of these different classes among our subjects (see Table B1 in Appendix B).
2) Figure 2 panel B reports, together with each estimated (αi, βi) pair (as in Figure 2 Panel A, the corresponding 95 percent confidence intervals associated with each individual esti-mated parameter. As Figure 2 panel B shows, we have now many subjects whose esti-mated distributional preferences fall, with nonnegligible probability, in more than one quadrant. Moreover, for some of them (about 20 percent of our subject pool), we cannot reject (at the 10 percent confidence level) the null hypothesis of Egoistic Preferences, αi=βi = 0.
Before we present our estimates of beliefs and reciprocity parameters, Table 1 provides a sketch of average positive effort decisions conditional on misbehavior.
As Table 1 shows, (i) player 2 always provides less effort than player 1 (0.54 vs 0.76); (ii) being or not the Dictator does not affect player 1’s effort decision; while (iii) player 2 pro-vides less effort if she is not the Dictator. Moreover, (iv) misbehavior is limited: player 2 misbe-haves only 17.6 percent of the time, player 1 only 13.9 percent of the cases. As far as reciprocity is concerned, (v) player 1, basically, never reacts to misbehavior: the ratios between conditional effort rates are 0.74/0.76 = 0.97 for non-Dictators and 0.68/0.78 = 0.87179 for Dictators. By (slight) contrast, (vi) player 2 reacts to misbehavior only when she isn’t the Dictator (0.38/0.51 = 0.74510 and 0.57/0.6 = 0.95, respectively). Points (iv)–(vi) are important to explain why we do not find reciprocity effects in the estimates of Table 2, where we report the estimated coef-ficients for belief (ψ) and reciprocity (θ) parameters.
As for our belief specification (6), our estimates of Table 2 indicate that player i is expecting more effort the higher j’s payoff (∂λi
k/∂λbjk = (ψ2 − ψ3)λi
k, and ψ2 − ψ3 is significantly above zero) and lower effort if her teammate is player 2 (ψ3 < 0 and bi
k −bjk> 0). As for our account
for Dictator role in i’s beliefs, ψ1, we find a not statistically significant coefficient. Also, our esti-mates of the three coefficients θ are not statistically significant, and the same holds for all their relevant linear combinations.
To summarize, our estimations yield statistically insignificant reciprocity effects, and only (absolute and relative) payoffs seem to have an impact on how subjects form their beliefs.
Table 1
i is Player 1
% ϕj = −1 ϕj = −1 ϕj = 0 Total
No dictator (443) 19.6 0.74 0.76 0.75Dictator (421) 15.4 0.68 0.78 0.76
Total (854) 17.6 0.71 0.77 0.76
i is Player 2
% ϕj = −1 ϕj = −1 ϕj = 0 Total
No dictator (421) 11.9 0.38 0.51 0.49Dictator (443) 15.8 0.57 0.60 0.59
Total (854) 13.9 0.49 0.55 0.54
Notes: Incidence of misbehavior (first column) and average effort rates P2 conditional on Dictator and player position. Number of cases in parentheses.

VOL. 100 NO. 5 2271cABRALEs ET AL .: sOcIAL PREfERENcEs AND sTRATEgIc UNcERTAINTy
III. Discussion
We devote this section to providing answers to our conjectural hypotheses and discuss several methodological (as well as empirical) issues raised by our theoretical and experimental setting.
A. Q1. Is It Inequality Aversion or strategic Uncertainty Aversion?
We first analyze subjects’ revealed preferences over the type of contract, wing or sting, to see how subjects resolved the tension between fairness and strategic uncertainty we discussed earlier, and how this depends on their individual social preferences. As explained in Section I, in eight out of 24 rounds of each phase, the choice set ct was composed of two wing and two sting contracts, built upon two pairs of distributional preferences. In what follows, we shall refer to the latter as the “mixed rounds.” Table 3 reports the relative frequency of subjects’ choices of a sting contract in the mixed rounds.11
Remark 1: sting is the most frequent choice for all players and phases.As Table 3 shows, in all phases, sting is by far the most popular choice, and this is particularly
true for player 1 (who, in P2, goes for wing only seven out of 288 times). Principals also display a marked preference for sting, even though choice frequencies are much closer to those of player 2. To assess the extent to which social preferences affect the probability of choosing a sting contract, we need to control for the relative inequality associated with the wing options, which varies substantially from round to round. In Appendix B2 we run two logit regressions, whose main conclusions are:
(1) The more “unequal” is the wing choice (i.e., the bigger are the payoff differences bk
1t − bk2 t of the two wing contracts, relative to those of the two sting contracts in ct), the
more likely is the choice of a sting contract. On average, a 1 percent increase of a “relative inequality index” we build for this purpose yields an increase of 29 percent of the prob-ability of choosing sting for player 2, and of 14 percent for the principals in P3.
(2) For principals, distributional parameters are not significant to explain the choice of con-tract type, while for players 2 in P2, both α and β are significant, with opposite signs.
11 The statistics of Table 3—as far as agents in P3 are concerned—do not include observations from mixed rounds in which all principals were offering either a wing or a sting contract.
Table 2
Beliefs (λki) Coef f. Standard error p-value
Di ψ1 0.3135 0.2629 0.23bk
j ψ2 0.0110 0.0094 0.24bk
i − bkj ψ3 −0.1112 0.0389 0.00
Reciprocity (θi) Coef f. Standard error p-value
Constant θ0 −0.1464 0.1159 0.21Di θ1 0.0895 0.1559 0.57Li θ2 0.1667 0.1466 0.26
Notes: Estimated parameters of belief function and reciprocity. Bootstrap and matching group adjusted standard errors.

DEcEmBER 20102272 THE AmERIcAN EcONOmIc REVIEW
We now look at the extent to which contract choices are able to solve the coordination prob-lems agents face in the effort game of Stage 2. Table 4 shows that the relative frequencies of the all-effort efficient equilibrium in sting are about twice as large as in wing (about 60 percent versus 30 percent).
Remark 2: In wing, the inefficient all–no effort equilibrium pools more than 1/3 of total obser-vations, and it is played more frequently than the efficient all-effort equilibrium.
Notice that about 30 percent of total observations correspond to a (nonequilibrium) strategy profile in which only one agent makes effort. While this frequency stays basically constant over phases and mechanisms, in sting the relative frequency of outcomes in which only player 2 makes effort never exceeds 4 percent, while, in wing, this frequency is three times as big. If we look at the evolution of outcomes over time, we see that, for both wing and sting, the relative frequency of efficient equilibria is falling, with this effect much stronger in wing. In addition, when we compare the first and the last 12 rounds of each phase, the frequency of the inefficient no-effort equilibria almost doubles.
We now discuss agents’ effort decisions in P2 and P3, which can be derived from Table 4. Here we see that i’s willingness to make effort is higher when she faces a sting contract: if we focus on P2 we see that, under a sting contract, player 1 makes effort in 92 percent of the cases, while the same statistic drops to 51 percent in the wing cases. For player 2, the corresponding figures are much lower (62 percent and 43 percent, respectively). If we compare effort decisions between P2
Table 3—Relative Frequencies of the Sting Choice in the Mixed Rounds
Phase 2 Phase 3
Player 1 0.98 0.89Player 2 0.68 0.76Principals 0.75
Table 4—Outcome Dynamics in the Effort Game. Absolute Values and Row Percentages
P2, wing P2, sting
None Pl. 1 Pl. 2 Both None Pl. 1 Pl. 2 Both
Rounds 1–12 44 26.2%
37 22%
24 14.3%
63 37.5%
10 3.8%
83 31.4%
8 3.0%
163 61.7%
Rounds 13–24 80 46.8%
31 18.1%
19 11.1%
41 24%
19 7.3%
90 34.5%
5 1.9%
147 56.3%
Total 124 36.6%
68 20.1%
43 12.7%
104 30.7%
29 5.5%
173 33%
13 2.5%
310 59.1%
P3, wing P3, sting
None Pl. 1 Pl. 2 Both None Pl. 1 Pl. 2 Both
Rounds 1–12 35 30.7%
22 19.3%
15 13.2%
42 36.8%
6 3.5%
46 26.4%
7 4.0%
115 66.1%
Rounds 13–24 59 54.6%
10 9.3%
15 13.9%
24 22.2%
17 9.4%
60 33.3%
2 1.1%
101 56.1%
Total 94 42.3%
32 14.4%
30 13.5%
66 29.7%
23 6.5%
106 29.9%
9 2.5%
216 61.0%

VOL. 100 NO. 5 2273cABRALEs ET AL .: sOcIAL PREfERENcEs AND sTRATEgIc UNcERTAINTy
and P3, we observe an overall reduction in average effort in P3 for player 1 only in the wing case (51 percent versus 44 percent).
Remark 3: Effort is much higher in sting than in wing.
To summarize, if we look at the mechanism design problem from the principal’s viewpoint, our evidence yields a clear preference for the “sting program.” Despite its being more expensive (since the sum of benefits to be distributed is higher), the difference in average team effort is sufficient to compensate the difference in cost. In addition, in the mixed rounds of P3, principals offering sting contracts were chosen with a much higher frequency. This, in turn, implies that average profits for a principal offering a sting contract in the mixed rounds were substantially higher, three times as much as when offering a wing contract (95.4 ptas. versus 30.1).
B. Q2. Does the social Preference model Work?
What we learn from the previous section is that distributional preferences play a role in resolv-ing the trade-off implicit in the wing-sting choice only for player 2. Matters change in nonmixed rounds, when ct is composed of the same contract type, either sting or wing, and differences across contracts in ct are less pronounced. In this case, the wing-sting trade-off is not an issue, and principals and agents may fine tune their contract decisions to their individual distributional tastes. In Appendix B3 we show that, when we focus on relative inequality and relative total cost of chosen contracts by principals and agents (compared with the other available options in ct), individual social preferences matter—and in the expected direction, as more inequality averse principals and agents choose, on average, contracts in which inequality is reduced. By the same token, more inequality averse principals go for “more expensive” contracts (i.e., contracts in which agents’ benefits are higher).
Remark 4: Estimated distributional preferences parameters account well for agents’ and prin-cipals’ observed contract choices in P2 and P3.
We also use data from P3 to check whether our structural model (3–9) is able to predict out-of-sample agents’ effort choices in P3.12 Once we provide agents with parameters on tastes for distribution, reciprocity, and beliefs about their teammate’s behavior in Stage 2, we can fully characterize agents’ effort decision in P3 at the individual level.
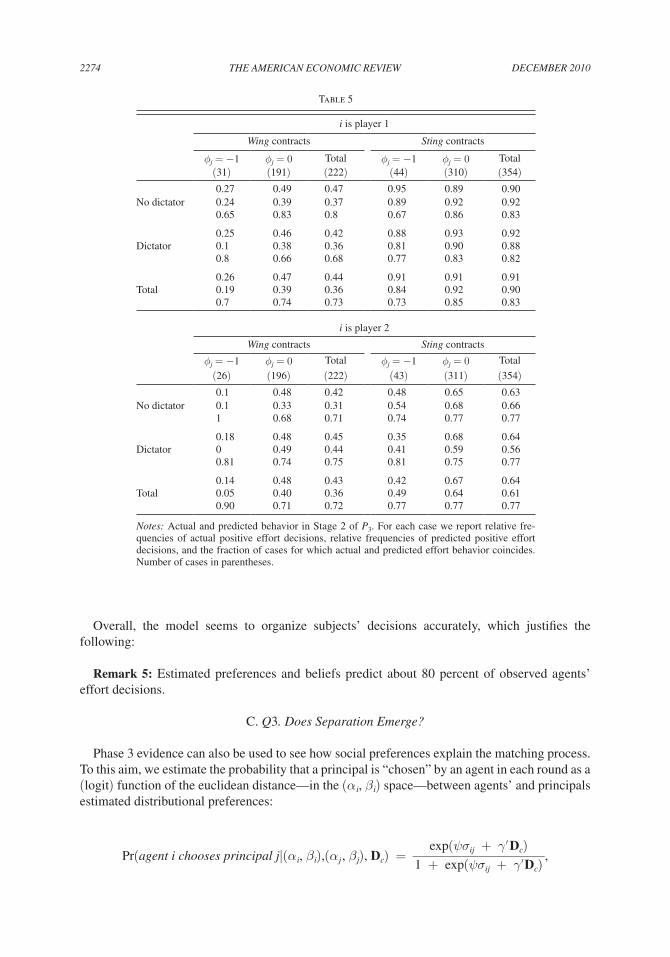
Using the evidence from P3, each cell of Table 5 reports a) relative frequencies of actual posi-tive effort decisions, b) relative frequencies of predicted positive effort decisions, and c) relative frequencies of instances in which actual and predicted behavior coincide. Predicted behavior is identified by subjects’ effort decision which maximizes expected utility (3) in the effort game, subject to their estimated preference parameters (αi, βi, θi) and their subjective beliefs, λi
k.
12 Our behavioral model (3) provides a suitable framework to predict agents’ effort decisions. To also predict contract choices, we should (i) model agents’ beliefs on the probability of teammates’ misbehavior in the contract decision (and, in consequence, principals’ beliefs over those beliefs); (ii) provide a robust model of competition among principals; and (iii) deal with the incomplete information about agents’ (and other competing principals’) preferences.
DEcEmBER 20102274 THE AmERIcAN EcONOmIc REVIEW
Overall, the model seems to organize subjects’ decisions accurately, which justifies the following:
Remark 5: Estimated preferences and beliefs predict about 80 percent of observed agents’ effort decisions.
C. Q3. Does separation Emerge?
Phase 3 evidence can also be used to see how social preferences explain the matching process. To this aim, we estimate the probability that a principal is “chosen” by an agent in each round as a (logit) function of the euclidean distance—in the (αi, βi) space—between agents’ and principals estimated distributional preferences:
Pr(agent i chooses principal j|(αi, βi),(αj, βj), Dc) = exp(ψσij + γ′ Dc) __
1 + exp(ψσij + γ′ Dc) ,
Table 5
i is player 1
Wing contracts sting contracts
ϕj = −1 ϕj = 0 Total ϕj = −1 ϕj = 0 Total(31) (191) (222) (44) (310) (354)0.27 0.49 0.47 0.95 0.89 0.90
No dictator 0.24 0.39 0.37 0.89 0.92 0.920.65 0.83 0.8 0.67 0.86 0.83
0.25 0.46 0.42 0.88 0.93 0.92Dictator 0.1 0.38 0.36 0.81 0.90 0.88
0.8 0.66 0.68 0.77 0.83 0.82
0.26 0.47 0.44 0.91 0.91 0.91Total 0.19 0.39 0.36 0.84 0.92 0.90
0.7 0.74 0.73 0.73 0.85 0.83
i is player 2
Wing contracts sting contracts
ϕj = −1 ϕj = 0 Total ϕj = −1 ϕj = 0 Total
(26) (196) (222) (43) (311) (354)0.1 0.48 0.42 0.48 0.65 0.63
No dictator 0.1 0.33 0.31 0.54 0.68 0.661 0.68 0.71 0.74 0.77 0.77
0.18 0.48 0.45 0.35 0.68 0.64Dictator 0 0.49 0.44 0.41 0.59 0.56
0.81 0.74 0.75 0.81 0.75 0.77
0.14 0.48 0.43 0.42 0.67 0.64Total 0.05 0.40 0.36 0.49 0.64 0.61
0.90 0.71 0.72 0.77 0.77 0.77
Notes: Actual and predicted behavior in Stage 2 of P3. For each case we report relative fre-quencies of actual positive effort decisions, relative frequencies of predicted positive effort decisions, and the fraction of cases for which actual and predicted effort behavior coincides. Number of cases in parentheses.

VOL. 100 NO. 5 2275cABRALEs ET AL .: sOcIAL PREfERENcEs AND sTRATEgIc UNcERTAINTy
where σij = √ __
(αi − αj)2 + (βi − βj)2 and Dc is a full set of matching group dummies. We esti-mate the model using only those rounds in which not all the principals offer the same contract. The estimated coefficient ψ is −0.422 (bootstrap and cluster adjusted standard error 0.099) for a p-value of 0.001. This evidence justifies the following:
Remark 6: Agents are more likely to choose a contract offered by a principal with more similar distributional preferences to their own.
D. Robustness check
We now check the stability of subjects’ behavior and structural estimates across alternative design specifications. In this respect, two features of our experimental design looked particularly likely to have affected our inferences from the data.13
(1) In our experiment, player position assignment is the outcome of an i.i.d. draw. By record-ing individual choices in P1, we are able to identify both distributional parameters, α and β, at the individual level. On the other hand, fixing player position across the entire experiment may bias subjects’ distributional behavior. For example, inequality might be perceived as less important, since subjects could “smooth” it across rounds. This cannot be done if the player position is fixed throughout.
(2) By the Random Dictator protocol, both agents choose their favorite contract before knowing the identity of the Dictator. We employed Random Dictator to collect observa-tions on contract decisions for all subjects and rounds (not only for Dictators). However, in this case, fairness can be achieved in two ways: either by choosing the “fair” contract in each round, or by choosing the “unfair” contract in each round, letting the Random Dictator assignment provide overall fairness.
To investigate these issues, we run two extra treatments (three sessions each, as in the “origi-nal” treatment, TR1 hereafter):
(i) TR2: where we apply the Random Dictator protocol, but we fix player position through-out the session;
(ii) TR3: where we apply the Reversal Dictator protocol (i.i.d. Dictator assignment is revealed before option choice, with only the Dictator deciding on her favorite option); and—just as in TR2—player position is fixed throughout.
Unlike in TR1, for our alternative treatment conditions TR2 and TR3 data from P1 do not allow identification of both distributional parameters, α and β, at the individual level, but only one or the other, depending on player position. In addition, in TR3 we collect exactly half of the observa-tions of the contract decisions across all phases (since non-Dictators do nothing). This, in turn, implies that we can measure reciprocity only on behalf of non-Dictators.
In Appendix B, Section 4.1 we first document the (small and nonsignificant) differences in distributional choices across treatments. Then, in Section 4.2 we examine the observed differ-ences in average effort rates in P2 and P3 (compared with those of our baseline treatment, TR1) and evaluate potential explanations for such differences.
13 We thank two anonymous referees for pointing out these critical aspects of our original design.

DEcEmBER 20102276 THE AmERIcAN EcONOmIc REVIEW
Robustness check 1: contract choices.—There is very little difference across treatments in the purely distributional choices of P1. Since, in any given round t, the available choice set ct is constant across treatments, we can study whether P1 choices are different across treatments using a Pearson test for the null hypothesis that, for a given choice set ct the distribution of the chosen contracts is independent of the treatment considered. As Table B6 (in Appendix B) shows, there are very few rounds (three in the comparison between TR1 and TR2, two in the comparisons between TR1 and TR3 , and one between TR2 and TR3) where choices within rounds are signifi-cantly different. By the same token, contract choices are essentially constant across treatments also in P2 and P3 (details in Appendix B4).
Robustness check 2: Effort Decisions and Parameter Estimations.—Contrary to contract choices, effort levels differ significantly across treatments. Table B7 (in Appendix B) shows that effort levels are rather smaller in TR3, compared to those in TR1 or TR2, themselves actually similar to one another (in Appendix B6 we show how these similarities and differences translate into statistical significance).
These differences require some explanation. One could reasonably conjecture that the dif-ference between TR1 and TR3 arises because player 2, who is continuously getting the worse outcome in TR3, tries to balance this by “shirking,” whereas the switching of roles (and the large number of rounds) does the balancing in TR1. The strong similarity of effort rates between TR1 and TR2 disposes of this conjecture since, in TR2, player positions are also fixed, and the dif-ferences in effort rates between TR1 and TR2 are much lower than those between TR1 and TR3 (see Table B7, Appendix B).
Another potential explanation could be that fixing player position and revealing Dictator role before option choice make reciprocity more salient. Hence the “punishment” for misbehavior (i.e., lower effort) would be more frequent. The evidence from Table B8 (in Appendix B) dis-poses of this conjecture, too, showing that there is no more punishment for misbehavior in TR3 than in the other treatments; there is simply less effort. As further confirmation of this, Table B9 compares the estimates of (a suitably modified version of) our structural model of Section II across treatments. As Table B9 shows, the estimates of our reciprocity parameters show little difference across treatments.
According to our estimates, the most likely explanation for the difference in behavior comes from beliefs. Table B10 (in Appendix B) shows that players believe (and their experiences will confirm) that others are going to make less effort in TR3.
IV. Conclusion
Our experimental results show that strategic uncertainty should be an important concern for those in charge of designing organizational incentives. In our context, where strategic uncertainty conflicts with social preferences in terms of their respective recommendations on contract design, the former seems to be subjects’ primary concern. Nevertheless, we also provide evidence show-ing that distributional preferences are a key determinant of contracts offered and accepted, on effort levels, as well as on how markets sort different distributional attitudes toward different organizations.
Our experimental environment is certainly ad hoc in some respects (take, for example, our decision to give only one agent the monopolistic power to decide the ruling contract for the entire team), although our findings seem fairly stable across some important design modifications, such as those concerning player position or Dictator assignment. In this respect, our results are encour-aging, because a parsimonious model of individual decision making seems capable of organizing consistently the evidence from a complex experiment, across various treatment conditions.

VOL. 100 NO. 5 2277cABRALEs ET AL .: sOcIAL PREfERENcEs AND sTRATEgIc UNcERTAINTy
As for avenues for future research, it would be interesting to solve theoretically the mechanism design problem under incomplete information about agents’ social preferences. From an empiri-cal standpoint, it would also be interesting to observe the effect of having agents with different productivities, which are also private information. In this way we could see how finely and in which ways “corporate culture” partitions the agents. Also, notice that, in our set-up, the num-bers of principals and agents exactly balance one another. On the other hand, the effect of more intense competition on either side is another empirically interesting extension.
We conclude by mentioning a development of our set-up that has already been explored. Nicola Frignani and Ponti (2008) use our experimental design (and the evidence of TR1, as a control) to collect experimental evidence of the Random Dictator set-up (P1) in which (i) subjects choose under the “Veil Of Ignorance” (VOI), that is, choose their favorite option knowing that they will eventually be assigned to either player position with equal probability or (ii) our choice sets ct correspond to binary lotteries (LOTT), in which subjects may win the high or the low prize with equal probability, but their decisions do not affect other participants. Subjects’ decisions are framed within the realm of a simple mean-variance utility maximization problem, where the parameter associated to the variance is interpreted, depending on the treatment, as a measure of pure risk aversion (LOTT), pure inequality aversion (TR1), or some combination of the two (VOI). In this respect, they find that both pooled and individual estimated parameter distributions in the VOI and LOTT treatments are remarkably similar. In stark contrast, the estimated inequal-ity aversion in TR1 is significantly lower. In other words, we could simply rely on risk aversion to explain subjects’ behavior under the VOI, suggesting that, in the presence of both risk and distributional issues, the former seem to have a primary consideration. This result nicely comple-ments our findings on the predominance of strategic uncertainty considerations in the wing-sting decision reported in Section IIIA.
REFERENCES
Bellemare, Charles, Sabine Kroger, and Arthur van Soest. 2008. “Measuring Inequity Aversion in a Hetero-geneous Population Using Experimental Decisions and Subjective Probabilities.” Econometrica, 76(4): 815–39.
Bellemare, Charles, and Bruce S. Shearer. 2006. “Sorting, Incentives and Risk Preferences: Evidence from a Field Experiment.” Economic Letters, 108(3): 345–8.
Bewley, Truman F. 1999. Why Wages Don’t fall During a Recession. Cambridge, MA: Harvard University Press.
Cabrales, Antonio, and Antoni Calvó-Armengol. 2008. “Interdependent Preferences and Segregating Equi-libria.” Journal of Economic Theory, 139(1): 99–113.
Cabrales, Antonio, Antoni Calvó-Armengol, and Nicola Pavoni. 2008. “Social Preferences, Skill Segrega-tion, and Wage Dynamics.” Review of Economic studies, 75(1): 65–98.
Charness, Gary, and Matthew Rabin. 2002. “Understanding Social Preferences with Simple Tests.” Quar-terly Journal of Economics, 117(3): 817–69.
Crawford, Vincent P. 1995. “Adaptive Dynamics in Coordination Games.” Econometrica, 63(1): 103–43.Crawford, Vincent P., and Hans Haller. 1990. “Learning How to Cooperate: Optimal Play in Repeated
Coordination Games.” Econometrica, 58(3): 571–95.Dohmen, Thomas, and Armin Falk. 2006. “Performance Pay and Multi-dimensional Sorting:Productivity,
Preferences and Gender.” Institute for the Study of Labor (IZA)Discussion Paper 2001.Fehr, Ernst, Alexander Klein, and Klaus M. Schmidt. 2007. “Fairness and Contract Design.” Econometrica,
75(1): 121–54.Fehr, Ernst, and Klaus M. Schmidt. 1999. “A Theory of Fairness, Competition, and Cooperation.” Quar-
terly Journal of Economics, 114(3): 817–68.Fershtman, Chaim, Hans K. Hvide, and Yoram Weiss. 2006. “Cultural Diversity, Status Concerns and the
Organization of Work.” In The Economics of Immigration and social Diversity (Research in Labor Eco-nomics). Vol. 24, ed. Carmel Chiswick, Hillel Rapoport, and Solomon Polachek, 361–96. San Diego, CA: Elsevier.

DEcEmBER 20102278 THE AmERIcAN EcONOmIc REVIEW
Fischbacher, Urs. 2007. “Z-Tree: Zurich Toolbox for Ready-Made Economic Experiments.” Experimental Economics, 10(2): 171–78.
Frignani, Nicola, and Giovanni Ponti. 2008. “Social vs Risk Preferences under the Veil of Ignorance.” Uni-versita Degli Studi Di Ferrara Quaderno DEIT n. 8/2008.
Harrison, Glenn W., and Tanga McDaniel. 2008. “Voting Games and Computational Complexity.” Oxford Economic Papers, 60(3): 546–65.
Heinemann, Frank, Rosemarie Nagel, and Peter Ockenfels. 2009. “Measuring Strategic Uncertainty in Coordination Games.” Review of Economic studies, 76(1): 181–221.
Iriberri, Nagore, and Pedro Rey-Biel. 2008. Elicited Beliefs and social Information in modified Dictator games: What Do Dictators Believe Other Dictators Do? Universitat Pompeu Fabra Department of Eco-nomics and Business Working Paper 1137.
Kosfeld, Michael, and Ferdinand A. von Siemens. 2009. “Worker Self-Selection and the Profits from Coop-eration.” Journal of the European Economic Association, 7(2–3): 573–82.
Kremer, Michael. 1993. “The O-Ring Theory of Economic Development.” Quarterly Journal of Econom-ics, 108(3): 551–75.
Krueger, Alan B., and David A. Schkade. 2007. “Sorting in the Labor Market: Do Gregarious Workers Flock to Interactive Jobs?” Journal of Human Resources, 43(4): 859–83.
López-Pintado, Dunia, Giovanni Ponti, and Eyal Winter. 2008. “Inequality or Strategic Uncertainty? An Experimental Study on Incentives and Hierarchy.” In games, Rationality and Behaviour: Essays in Behavioural game Theory and Experiments, ed. A. Innocenti and P. Sbriglia, 235–55. New York: Pal-grave Macmillan.
Manski, Charles F. 2002. “Identification of Decision Rules in Experiments on Simple Games of Proposal and Response.” European Economic Review, 46(4–5): 880–91.
Nyarko, Yaw, and Andrew Schotter. 2002. “An Experimental Study of Belief Learning Using Elicited Beliefs.” Econometrica, 70(3): 971–1005.
Rey-Biel, Pedro. 2008. “Inequity Aversion and Team Incentives.” scandinavian Journal of Economics, 110(2): 297–320.
Teyssier, Sabrina. 2008. “Optimal Group Incentives with Social Preferences and Self-Selection.” Groupe d’Analyse et de Théorie Economique (GATE) Working Paper 0710.
Van Huyck, John B., Raymond C. Battalio, and Richard O. Beil. 1990. “Tacit Coordination Games, Strate-gic Uncertainty, and Coordination Failure.” American Economic Review, 80(1): 234–48.
Van Huyck, John B., Raymond C. Battalio, and Richard O. Beil. 1991. “Strategic Uncertainty, Equilib-rium Selection, and Coordination Failure in Average Opinion Games.” Quarterly Journal of Economics, 106(3): 885–910.
Winter, Eyal. 2004. “Incentives and Discrimination.” American Economic Review, 94(3): 764–73.