social security health insurance for the informal sector in nicaragua
TRANSCRIPT

1
Social Security Health Insurance for the Informal Sector in Nicaragua:
A Randomized Evaluation
October 2009
Rebecca Thornton1, University of Michigan
Erica Field, Harvard University Laurel Hyatt, PSP-One Project, Abt Associates Inc.
Mursaleena Islam, PSP-One Project, Abt Associates Inc.
Freddy Solís, ALVA Consultores, Nicaragua
Abstract
In January 2007, the government of Nicaragua extended a voluntary health insurance program to informal sector workers using microfinance institutions MFIs as deliver y agents. This paper presents an experimental evaluation o f this progra m among workers in Managua in which we randomly varied the costs as well as the convenience of enrolling in the insurance program. We find that costs and streamlined bureaucratic procedures were im portant determinants of enrollm ent while the participation of MFIs had only a m inor effect on take-up. In terms of the effect of the p rogram on health care utilization and expenditures, we find that, although ins ured individuals substituted towards ser vices at covered facilities and total out-of-pocket expenditures fell, the y fell by less than the insurance pr emiums. Surprisingly, we find no evidence of an increase in health care utilizations among the newly insured. We also find very low retention rates after the expiration of the subsidy , with less than 10 percent stil l enrolled after one y ear. To shed light on these patterns, we present qualitative evidence of institutional and contextual factors that limited the success of this program.
1Funding for t his st udy was pr ovided by USAID’s Private Sect or Pa rtnerships-One (PSP -One) project and the Global Development Network (GDN). The authors’ views expressed here do not necessarily reflect the views of the United States Agency fo r In ternational Dev elopment or t he United States Governm ent. The e valuation was coordinated f or G DN by EA Consultants. The evaluation team wo uld lik e to acknowledge the ex tensive contributions of the field team at ALVA Consultores including Dr. Ana del Carmen Rojas and Ms. Rosario Duarte, as well as t he project coordination and support of Barbara Magnoni, EA Consultants, and t he contributions in the project desi gn of Tania Dmytraczenko, t he World Ba nk. We a re grateful for hel pful comm ents and s uggestions from Robert Lalonde, Jeff Smith, and other GDN mentors and participants as well as participants at Harvard School of Public Health , th e World Bank Research Group, t he Popu lation Association of Iran , and the Popu lation Association of America seminars. We also thank research assistance from Anne Fitzpatrick.

2
1. INTRODUCTION In recent years, interest has grown in providing health insurance programs to poor and vulnerable
populations throughout t he world as a means of increasing access to priority health services and
protecting families from catastrophic health care costs. 2 Implementation of such programs, however, may
be difficult. Research suggests that take-up of voluntary health insurance among the poor is typicall y low
(Behrman & Knowles, 1999; Jowett, 2003; Mord uch, 199 9; Chankova et al., 2008; Gine et al., 2007;
Alderman & Paxson, 1992; Fafchamps, 1992). Moreover, collecting payments from this population, who
are generally employed in the informal sector, is challenging (Abel-Smith, 1992). Finally, if the program
is not carefully designed and marketed, insurance schemes targeted to the poor may be particularly prone
to adverse selection, disproportionately attracting those who are relatively sick.
Despite the r ecent and increasing intere st in hea lth insurance progra ms for excluded populations
in developi ng countries (Preker et al., 2002; Gum ber & Kulkarni, 20 00; Fra nco et al., 20 08; Sm ith &
Sulzbach, 2008), there is little rigorous evidence on the optim al design of vol untary health insurance
schemes targeting the informal sector in terms of their ability to attract a large enough pool of individuals
or to i ncrease utilization of quality health services. Fo r instance, in m any developing countries, existing
synergies between the delivery of financial servic es and health services to clie nts in the informal se ctor
have led pol icy-makers to believe that m icrofinance institutions (MFIs) may be a prom ising deli very
agent to extend health insurance to low-income and other vulnerable groups (Matin, Hulme & Rutherford,
2002; Churchill, 2003; Churchill & Cohen, 2006), particularly in settings where MFI penetration is high.
Despite this belief, however, to date no evidence s upports the utilit y of usi ng MFIs in marketing and
delivering insurance products.
One of the main rea sons for the dearth of ev idence on the efficacy of alternative insuranc e
2 There are a growing number of health insurance programs and academic evaluations on these programs in developing countries. See for example Abel-Smith (1992); Barros (2008); Dow and Schmeer (2003); Duflo, Banerjee, and Deaton (2004); Gakidou et. al. (2006); Gertler and Gruber (2002); Gertler and Solon (2002); GTZ, ILO and WHO (2005); Kremer et al. (2006); Miller et al. (2008); Panopoulus and Velez (2001): Pauly, Zweifel, Scheffler, Preker, and Bassett (2006); Pauly et al. (2008); Wagstaff (2007).

3
schemes for the poor is the difficulty in making causal inferences from cross-sectional or p anel studies.
Non-experimental studies that ai m to mea sure the impact of voluntar y health insurance coverage are
prone to om itted variable bias. For inst ance, if tho se who are more likely to be sick or utilize health
services are more likely to purchase health insuran ce, unobservable differences between t he insured and
the uninsured will confound estim ates of the effect of insurance, although t he direction of the bias is
ambiguous.
This paper evaluates a voluntar y public health in surance progr am targeted to inform al sector
workers in Nicaragua and provides experimental evidence on both the determinants of enrollment and the
causal effects of insurance on health care expenditu res, outcomes and patt erns of utilization am ong
informal sector workers. Specifically , in Ja nuary 2007 the government of Nicaragua initiated a
demonstration project that extended the Nicaraguan Social Security Institute’s (INSS’s) heal th insurance
program for formal sector employees to informal sector workers using microfinance institutions (MFIs) as
delivery agents.
To evaluate the im pact o f the program , we randomly varied the costs and convenience of
enrolling in t he new health insuran ce program across a large sample of m arket vendors in Managua. To
study the effectiveness of MFIs as del ivery agen ts, we rando mly assigned individuals to purchase the
insurance at either the INSS central office or the branch offices of three participating MFIs. We then used
baseline and follow-up surveys to examine changes in health and health care utilization.
Differences in take-up rates across tre atment arms p rovide evidence on the extent to which the
financial cost and the convenience of enrollment pr ocedures influence enrollment and retention in the
insurance program , a s w ell as the eff ectiveness of MF Is as health insurance de livery agents. In turn,
variation in take-up by treatment assignment generates random variation in i nsurance coverage, allowing
us to test us ing baseline and follow-u p surve ys conducted o ne year apart whether access to health
insurance improves pop ulation health b y encouragi ng preventive, pri mary, and emergenc y health care
utilization. Together, these two components of the study provi de evidence on both the costs and th e

4
benefits of insuring the poor in deve loping countr ies. In addition to the quantitative analy sis of the
demand for and effects o f health insurance, we al so conducted a series of focus groups and in-depth
interviews to better understand take -up of the insurance program , rete ntion, and utilization of health
services.3
We find that, while insured individuals switched from using services at private and Ministry o f
Health facilit ies to visiting covered he alth facilities, insurance coverage did not appear to substantially
increase their overall utilization of services. M eanwhile, although total out-of -pocket expenditures fell
when indivi duals were insured, average out-of- pocket savings were lo wer than the equivalent
unsubsidized insurance prem iums. More fundam entally, we find very low tak e-up and retention rates,
with less than 23 percent enrolling at baseline and fewer than 10 percent still enrolled in the insurance
program after one y ear. While there are various possi ble explanations for the failure of the program to
attract and retain clients, t he finding is consis tent w ith case studies fro m d eveloping countries, which
suggest that, in settings in which individuals have lower levels of discretionary income, insurance is often
perceived as a net gain only for those with health care costs above the price of insurance. Nonetheless,
77% of individuals who did not enroll had higher baseline health expenditures than the cost of the annual
premium, which suggests that uncertainty or distrust of the insurance product also pla yed a role in
reducing demand for coverage.
In addition, take-up and retention of insurance was not higher when individuals were assigned to
enroll at an MFI rather than at th e INSS, suggesting that MFIs were not a more effective health insurance
delivery agent than the government in this setting. Qualitative d ata point to a nu mber of obstacles in
working with MFIs that must be addressed before si milar strategies are successful, including bureaucratic
and administrative challenges and those related to promotion and marketing.
3 Perhaps the most similar study to this one is a recent evaluation by Barros (2008) of the expansion of government health insurance to the informal sector in Mexico in 2002. They found, as we did, a substitution of visits to service providers and a reduction in out of pocket expenditures. Our study differs from this and others in two main ways. First, we evaluate a randomized experiment that allows for causal inference for a variety of research questions without the usual concerns of selection bias or endogenous program take-up. Second, our quantitative results are complemented with in-depth qualitative research that explores the influence of contextual factors on both take-up rates and efficacy of the insurance program in Nicaragua.

5
The findings from Nicaragua provide valuable evidence for other developing co untries interested
in expandi ng public health insurance programs to the inform al sector. Although t he insur ance product
considered in this evaluation has several cont ext-specific d esign featur es that may affect the
generalizability of our fin dings, the program in Ni caragua is in most ways a very typical government
health insurance sche me, comparable to public sect or programs for formal s ector workers in many parts
of the world. Hence, our study provides useful evidence on the efficacy of extending existing public
insurance programs in many develo ping countries to the informal sector. Such an approach has th e
potential to be particularly cost effective since governments already have a broad risk pool of mandatory
insured workers and higher volumes may reduce the overall cost of service delivery . Similarly, although
this program was not designed to reach the ultra-poor (for instance, by requiring non-trivial premiums and
a fair amount of paperwork), it is a logi cal first step for a govern ment interested in extendi ng its existing
program to the self-employed.
The paper proceeds as fol lows: Section 2 presen ts the background and program description for
the health insurance product in Nicarag ua. Section 3 presents the quantitative methodology and empirical
strategy, and Section 4 discusses the quantitative results of the evaluation. Section 5 discusses contextual
findings and qualitative results, and Section 6 concludes.
2. BACKGROUND AND PROGRAM DESCRIPTION
Prior to the expansion of health insurance to informal sector workers in January 2007, only formal sector
workers and government em ployees in Nicaragua were eligible for INSS he alth insurance and health
services provided at 17 INSS-contracted facilities. T his participation represented just 18.5 pe rcent of the
economically active popu lation in Nicaragua. Indi viduals work ing in t he in formal sector, the self-
employed, and the unem ployed were eligible onl y for care at a handful of Ministry of Health (MINSA)
facilities, wh ich were under-resourced and lacked t he infrastructure, staff, and m edications needed to
respond ade quately to the pop ulation’s health n eeds. Focus grou ps with inform al sector workers

6
conducted in 2006 revealed that they perceived MINSA facilities as offering significantly lower quality of
care than INSS-contracted facilities and other private health providers, including very long wait times and
stock-outs. As a result, workers reported that they tended to avoid MINSA facilities and instead generally
went directly to pharm acies for basic care. In other ca ses they preferred pa ying private doctors or
avoiding care altogether, incurring the risk of more extensive (and expensive) procedures down the line.
Micro-entrepreneurs in N icaragua, a s in many parts of the developing worl d, are extremely
vulnerable to any family health crisis i n terms of their household income and business cash flows (s ee
Dercon, 2002). They typically divert resources from their businesses to meet immediate health care needs
at the expense of investing in their bus iness and its future growth, which in turn can have a significant
impact on future househol d income (McInty re et al., 2006; Mord uch & Sharma, 2002; Naray an et al.,
2000; Russell, 2004). In these ca ses, therefore, health insurance serves to reduce financial ri sk for small
businesses, as well as for informal workers and their families.
The health insurance provided through the Nicar aguan government’ s social security s ystem
(INSS) extends care to for mal se ctor workers base d on mandatory payroll and em ployer contributions.
INSS contracts with co mmercial, no t-for-profit a nd pub lic providers called Clinics for the Insured
(formerly Empresas Médicas Previsionales and referred to in this paper as EMPs ), purchasing services on
a c apitated basis. The INSS insura nce provides a ll subsc ribers with a comprehensive package of
preventive, diagnostic, and curative health services, including primary and specialist care, medication and
laboratory exams, hospitalization, 24- hour emergency care, prenatal care, chil dbirth and post-natal care ,
infant care and vaccinations, child wellness visits thr ough age 5, pediatric care through age 11, voluntar y
family planning counseling and contraception, breast and c ervical c ancer sc reenings, HI V and ST D
counseling, and prevention and treatment of den gue fever and malaria. In addition to the subscriber, the
subscriber’s wife is eligible for maternity services, including deliveries, and de pendent children up to the
age of 12 are also fully covered.
In 2007, a parallel version of this health insura nce was made available to informal sector workers

7
through a vol untary mechanism known as Seguro Facultativo de Salud. Although the prog ram for this
sector was n ecessarily voluntary ,4 the coverage and cost were designe d to be as si milar a s possible to
those associated with the program for workers employed in the formal sector. In this program, individuals
had the opportunity to pay a flat monthly fee for a wide range of covered services without co-pay ment at
the time of service. The cost of the progra m was structured such that the monthly fee wa s higher in the
first two months, at approxim ately 18 dollars per month, and then fell to approxim ately 15 dollars per
month in subsequent months. When subscribers un-enro lled, they would continue to be covered during a
three-month grace. Enrolled individuals could make monthly pa yments direc tly at the INSS office or
through most banks in the country.
Given the hi gh rate of MFI use among i nformal sector workers in Nicar agua, polic ymakers
hypothesized that it would be convenient for these workers to enroll and make health insurance payments
at MFIs, perhaps concomitant with m aking payments on MFI loa ns.5 The govern ment contracted three
MFIs to market the new insurance sc heme and collect prem iums: ACODEP, Banco ProCredit, and
Findesa. Each MFI recei ved technical assist ance with manage ment information s ystems, operations,
enrollment procedures, and marketing health insurance to informal workers.6 The MFIs signed a one-year
contract with INSS in October 200 6 for registering s ubscribers and collecting pay ments in exchange for
which they received a small fee for each enrolled worker.
Over the course of the evaluation, a num ber of institutional and political changes took place that
influenced p roject im plementation. Importantly, the MFI par tnerships were established un der the
government of Enrique Bolaños, who was replaced in January 2007 by incoming President Daniel Ortega
– representing an ad ministration with a radically di fferent political ideology . In October 2007 INSS
4 The voluntary nature of the program was considered a financial necessity for cautiously extending such a scheme given that informal sector workers cannot be easily taxed for their participation. 5 In Nicaragua, there are over 200 MFIs with over 20 that cover the majority of the unbanked market, offering a variety for public-private partnerships in health insurance delivery. 6 The USAID-funde d Private Sector Pa rtnerships-One project (PSP-One) supported the INSS in c oordination and training activities between July 2006 and March 2007. Initial trainings took place prior to the project’s expected roll out in July/August 2006 and were replicated in October and November 2006 by the INSS. However, the project was actually rolled out in January 2007. Delays were primarily caused by the presidential elections in Nove mber 2006 and the initiation of the new administration in February 2007.
8
chose not to renew the contracts with the three MFIs for registering subscribers and collecting payments.
Interviews with senior INSS official s suggested that this decision was motivated by a number of factors,
including INSS’s perspective that th is was a low-priorit y project and a political backlash against MFIs,
which were being accused of predatory lending by the government. We discuss more details about these
institutional changes and their implications for our research in Section 6.
3. RESEARCH DESIGN
3.1. Data Collection and Study Design
To measure the determinants of insurance enrollment as well as the causal effects of having insurance, we
implemented an evaluation that randomly varied the costs (financial, informational, and con venience) of
signing up f or health insur ance for each indi vidual. Data collection i nvolved a baseline and one- year
follow-up survey of a sa mple of elig ible participants in addition t o consolidated administrative data on
insurance affiliation from INSS.
Appendix A presents a su mmary of the project ti meline. Between March and June 2007, a few
months aft er the insurance program w as rolled out to inform al sector worke rs, a baseline survey was
administered to a representative sample of vendors in the three largest op en-air markets in central
Managua. These markets were chos en because t hey were likely to contain a large population of
uninsured informal sector workers who were micro-finance clients. Although clearly this method did not
produce a ran dom sample of ind ividuals eligible for the insurance product, sam pling the largest markets
was a cost- effective means of locating a relatively representative sub-population of informal sector
vendors. Moreover, since these workers are somewhat better off than either vendors in very small markets
or informal sector workers outside of the retail market, they were presumed to be a key target group of the
new insurance scheme. However, it is im portant to b ear in m ind that our co nclusions pertain to this
specific sub-population.
The baseline survey co llected information in tw o ro unds on demographic characteristics, prior

9
and current health services utilization, socioeconomic characteristics, and health care expenditures.
Government ID num bers were collected to m atch respondents to health i nsurance enrollm ent data
subsequently provided b y the gove rnment. The first round of the baseline survey was conducted in
March and April 2007 in a section of th e Mercado Oriental, Managua’s largest marketplace. The second
round was conducted in June and July 2007 in the remaining portion of the Mercado Oriental and i n the
somewhat smaller Mercados Huembes and Iven Montenegro marketplaces.7
Prior to the fi rst round of the baseline surve y, we conducted a census of market booths to define
the sam pling frame of possible res pondents. Participants deemed eligible through the census were
selected randomly and ad ministered the full surve y.8 Eligi bility depended on age (between ages 18 and
54), having a government ID, being the owner of th e booth, and lacking health insurance coverage.9 The
first two criteria wer e deter mined by government eligibility requirem ents, while the second two were
research design considera tions intended to target those with relatively high demand for insurance .
Appendix B, Panel A, presents the completion rates of the baseline survey. While overall completion rates
were relatively low at 51 and 53 percent for the two rounds, the main reasons fo r non-participation were
inability to locate vendors at their booths (22%) and ineligibility of vendors on either the age criterion or
their lack of an on-hand government ID (15.1%). Rates of refusal among eligible vendors who were found
at their booths wer e low ( 7.7%). Nonetheless, sam ple selection based on the availabilit y of respondents
and possessi on of IDs may affect the external validity of the study. In particular, those who wer e
available and carried govern ment IDs might be rela tively stabl e or cooperative types – and as such,
perhaps more likely than the average informal worker to sig n up for government-sponsored insurance. In
7 In addition, the baseline survey also included respondents in four other smaller markets; because these respondents were not followed over time, we do not include them in our analysis. 8 In round one, the census of the Mercado Oriental recorded all of i ndividuals who worked in a bo oth in the past twelve months. The market was divided into 98 blocks using a map of the market; 25 blocks were excluded from the sample either because they were dangerous or ha d no businesses. We then ra ndomly selected eligible respondents stratified by gender, marital status, and MFI client status. To ov ersample MFI clients, all booths identified in the census as containing an eligible MFI client were selected. 9 Participants were required to display their government ID cards or a legible copy of their card. Surveyors offered vendors t he o pportunity t o bri ng t heir car ds o n a s ubsequent day i f t hey were i nterested i n pa rticipating a nd re-visited vendors three times before disqualifying them as ineligible.

10
this case our results would overstate the im pact of introducing a health insurance program to all workers.
Alternatively, absent workers may have higher dem and for insurance if, for instan ce, they are sicker or
have larger fa milies. Or, i t may simply be the case that all worke rs periodically take da ys off from the
market, making those missing on survey days a quasi-random sample. Hence, while sample selection bias
may limit the generalizability of the study , it is also difficult to draw conclusions about the likely nature
of the bias. In term s of internal validity, particip ation rates do n ot generate a bias since we random ly
allocated subsidies for he alth insurance only after indi viduals ha d agreed to participate, so selection is
orthogonal to treatment assignment.
During the s pring of 2 008, 2, 805 respondents were approached for the foll ow-up surve y, and
2,608 (93%) were successfully re-interviewed.10 The reasons for attrition are presented in A ppendix B,
Panel B. In formation on enrollm ent – includin g whether at INSS or an MFI – was provided by
administrative data from INSS, and linked to our survey data via government ID numbers.
3.2. Sample Characteristics
Our analysis is restricted to the 2,608 respondents who completed interviews at both baseline and follow-
up. Table 1 presents key characteristi cs of the sam ple. In addition to presenting averages across the
pooled sam ple, we show mean values separately for responden ts who were and were n ot MFI l oan
recipients at the time of the first survey.
The average respondent was 38 y ears old and had 9. 3 years of education. Abo ut 35 percent o f
respondents were male and 70 percent were married or had a co mmon-law spouse, a propo rtion higher
than the national average of 56 percent (ENDESA household survey, Nicaragua, 2006). Respondents had
two children on average, with two-thirds having at least one child under age 12, the maxim um age for
coverage of dependents by the INSS health insurance. Only 3 percent of the sample was pregnant or had a
spouse who was pregnant.
10 Baseline characteristics do not vary systematically between the full sample of baseline respondents and the 2,608 who were interviewed one year later and used for the analysis in this paper (results not shown).

11
MFI clients were about 2 years older on average than non-MFI clients, and were more likely to be
female (72% vs. 61% respectively). In addition, MFI clients had slightly more children.
Respondents had an ave rage monthly incom e of US$238 (P anel B). 11 Average monthly
disposable income after business and household expenses was reported at US$25, with an average current
savings balance of US$146. However, only 29 percent declared having disposable income at month end.
Almost 58 percent had an outstanding loan, and ab out one-third had a loan with an MFI (unreported) .
MFI clients reported hig her monthly income (by approximately US$38), b ut their likelihood of savin gs
and average savings balance were about the same as non-MFI clients. MFI clients spent about US$7 more
on health care for themselves than did their counterparts.
In terms of health status, 80 percent of those surv eyed reported being sick in the y ear prior to the
baseline survey , with a m ean value of 2.6 episode s (Table 2, Panel A). Many respo ndents reported
chronic or common recur ring conditions such as k idney problems, diabete s, hy pertension, respiratory
problems, vi sion or hearing problems, stress, head aches, or all ergies. Table 2, Panel B su mmarizes
information on the last illness respondents reported e xperiencing in the previous 12 months. Almost half
were related to allergies or respiratory illnesses such as cold or flu and 60 percent reported suffering fr om
flu sy mptoms in the previous y ear. The majority of reported illnesses were minor conditi ons. Only 11
percent missed more than a week of work due to their last illness and the m ajority (57%) missed zero
days of work . Our data d o not p oint to an y si gnificant advantage of targeti ng MFI clien ts for m icro-
insurance programs based on relative health status. Although MFI clients were slightly more likely than
non-MFI clients to report having diabet es, stress, and hypertension in the y ear prior to the baseline, they
were less likely to report smoking.
Pharmacies were the m ost visited of any health facility , with 72 percent of all respondents
reporting three pharmacy visits in the prior year (Table 3). Private sector facilities were utilized more than
public sector facilities, with 28 percent reporting visits to private doctors and 14 percent to private
11 R eported i ncome for re spondents a nd t heir sp ouse was reported i n Nicaraguan C ordoba was c onverted t o US Dollars at the rate of US$1 = 18.7 NIO.

12
clinics/hospitals in the prior y ear, compared to 16 pe rcent reporting visits to p ublic health centers and 9
percent to public hospitals. Only 1 percent of survey respondents reported visiting an INSS clinic (EMP)
in the year prior to the baseline survey.12 The high representation of pharmacy visits is especially notable
because public health cen ters and hospitals are supposed to pr ovide m edication free of charge, bu t
anecdotally l ack inventor y on a regul ar basis. Results fro m focus group di scussions co nfirmed this
anecdotal evidence. Busy market workers often do not bother to visit a free clinic, wh ere they ris k
finding out t heir medication is unavailable after wa iting hours to see a doctor . Instead, t hey generally
prefer to go to a phar macy, where a p harmacist might also recommend a medication and provide it
immediately, and pay for the service.
Correspondingly, respon dents reported significantl y lower m ean expenditu res at subsidized
public health centers (US$0.26; N=407) than at pharm acies (US$42.66; N=1,862) or for lab oratory tests
(US$25.67; N=678). In contrast, those attending a pr ivate doctor (N=709) reported spendi ng US$0.91 in
annual visits, which may reflect the prevalence of bot h NGOs that provide health services at subsidized
costs for low-income groups in Nicaragua and private doctors and nurses who practice out of their homes
at reduced fees. Similarly, am ong those who visi ted a hospital, respondents spent US$24 at private
hospitals (N=363) and US$2.33 at public hospitals (N=227). The median amount spent at each facility
was substantially lower than the average, indicating that some individuals had very high expenses.
On average, total expenses for health care over th e year prior to the baseline s urvey were quite
substantial, at US$88 (or 3 7% of mean household income) for the respondent and children u nder age 12
and US$42 for the respondent alone (Table 1, Panel B) . However, it is important to note that averag e
total expenses over the year wer e substantially l ess than annua l insurance prem iums under the new
program, which were US$176.13 In fact, only 13 percent of respondents spent more than $176 per year on
themselves and their child ren under age 12 duri ng the year prior to the program. The fact that prem iums 12 EMPs primarily p rovide serv ices to tho se eligible fo r INSS health i nsurance, altho ugh m any o ffer services to noninsured paying customers as well. 13 These expenditures are substantially higher than out-of-pocket family health costs in the general population (US$28) according to the 2003 National ENDESA survey in Nicaragua, even considering an additional $12 adjustment for inflation over the period, though much of the difference surely reflects an urban bias.

13
well exc eed expected out-of-pocket (OOP) expe nses fo r the vast majority of individuals indicate s
potentially low willingness-to-pay for the new health insurance plan, which is likely to be the
fundamental reason for the low rates of enrollment and retention found.
Baseline differences between MFI clie nts’ and n on-MFI clients’ health expenditures were small
overall. MFI clients were less likely to use public fac ilities, and as a result reported slightl y higher health
care expenditures (approximately US$7 more; Table 1 Panel B), mainly driven by laboratory costs.
3.3 Randomization Process
To evaluate factors influencing health insurance enrollment and also gene rate random variation in
insurance coverage, our r esearch design randomly assigned individuals to treat ment arms with differing
prices and en rollment procedures. Rand omization was conducted at the individual level in t wo stages.
First, at the end of the baseline survey, participants were invited to choose a lottery ticket out of a stack of
unmarked, pre-sealed envelopes. The possible lottery prizes included a blank ticket (no priz e); an INS S
brochure detailing the insurance product; a brochure a ccompanied by a six-month insurance subsidy with
instructions to sign up at the INSS office; or a brochure accompanied by a six-m onth insurance subsidy
with instructions to si gn up at an MFI office.14 The six-month subsidy was wo rth approximately US$96
and was provided in the form of a voucher; respondents were told that payments would be made on their
behalf directly to the INS S.15 The distribution of lottery tickets is presented in Appendix C, which also
presents the attrition rates by randomization group.
In addition, immediately following the second round of the baseli ne survey, a random sample of
112 respondents who had been offered a 6-month subsidy and 63 respondents who had been offered no
subsidy – none of whom had yet subscribed – were offered the opportunity to sign up for health insurance 14 There were also two additional treatment arms that gave a brochure accompanied by a two-month insurance subsidy with instructions to sign up at the INSS office and one that gave a brochure accompanied by a two-month insurance subsidy with instructions to sign up at a MFI. These individuals were not interviewed at the follow-up survey and we do not include them in the analysis of this paper. 15 In the second round, only three prizes were offered: an INSS brochure, a 6-month insurance subsidy (instructed to sign up at INSS office), and a 6-month subsidy (instructed to sign up at MFI).

14
at their market booth. Surveyors were trained to fill out t he registration forms on site and were
accompanied by a photographer who took required photos.
4. EMPIRICAL STRATEGY
Most cross-s ectional or panel studies that exa mine the im pact of being insured suffer from potential
omitted variable bias, in which an individual’s unobservable propensity to purchase insurance is related to
her underl ying health pr ofile or risk pr eferences. Th is makes cau sal inference of the im pact of health
insurance on health and related outcomes difficult because if those who have a greater risk of illness are
both more likely to enrol l in health insurance and more likely to b e sick, the observed im pact of having
insurance is biased. A randomized study design such as that used in this evaluation reduces potential bias
due to selection effects by guaranteeing that, in expectation, comparison groups are composed of the same
underlying types. Indeed, Appendix D verifies that random assignment in this case achieved comparison
groups that were si milar on observable baseline ch aracteristics. There are some differ ences b etween
insurance subsidy and control groups; however, these differences are small in magnitude. The results ar e
similar across MFI clients and non-MF I clients (resu lts not shown), which is unsur prising given that the
sample was stratified by MFI membership prior to randomization.
To measure t he determinants of insurance enro llment, including the amount of subsidy received
and the assigned location for enrollment, we estimate the following regression equation:
(1) iiiiii XMFIMonthsINSSMonthsnInformatioInsurance )(6)(6 321
where “ Insurance” is an indicator if respondent ‘i’ signed up for health insurance. “ Information,”
“6Months(INSS),” and “ 6Months(MFI)” are indicat ors of the random ized lot tery received. The pure
control group is the om itted category. The vector of contro l va riables, X, includes age, age squared,
gender, years of education, marital status, and market fixed effects. In some specifications we also control
for baseline health expenditures and health status indicators. Data are pooled from both rounds of baseline
surveys and round fi xed effects are included. To test whether MFI clients respond differentially to

15
affiliation assignment, we also estimate equation (1) separately by MFI client status.
In the second stage, we evaluate the effects of health insurance on health c are utilization and
expenditures. The randomized first stage predicting health insurance enrollment – specification (1) above
– allows for an instrumental variab les (IV) analy sis of the effects of insurance . In t he second stage we
estimate:
(2) iiii XInsuranceY 1
where “ Y” is the outcom e variable of interest (heal th expenditures or num ber of health care visits at
follow-up) and “ Insurance” enroll ment is instru mented with the vector of tr eatment indicators (blank
ticket/no-incentive control ; INSS broc hure/information only ; subsidy for enrollment at INSS office;
subsidy for e nrollment at MFI office). The F-statisti c of the excluded instru ments is large, at 213.33 ,
indicating a strong first-stage effect of the subsidies. It is im portant to keep in mind that an IV model
estimates a local average treatment effect (LATE), or th e mean effect of insuring those on the margin of
enrolling if offered a subsidy rather than the populat ion average effect (ATE). Hence, these estimates do
not tell us the expected impact of providing insurance coverage to all informal sector workers.
To esti mate the deter minants of ret ention, we re- estimate (1) with the d ependent variable
indicating whether the respondent was still pa ying for health insurance at the fol low-up survey and only
include the 530 indi viduals who had enrolled in th e health insurance program . We examine both the
impact of receiving an ins urance subsidy as well as pot ential differential effec ts of being a n MFI client.
Because of the s mall number of enrolle es in the c ontrol and information-only treatment groups, we us e
only the 6-month subsid y groups to stu dy differential e ffects of signing up at an MFI on retention. It is
worth noting that, while signing up at an MFI was rando mized, esti mating the effects of place of
affiliation on retention is complicated by the fact that this specification is estim ated only among those
who chose to sign up for insurance – which is endogenously determined.
5. RESULTS

16
5.1 Take-up of Insurance
Overall, 20.3% of our sam ple enrolled in the insu rance sche me. Table 4 presents the O LS regression
results predicting take-up. Curiously, those receiving an informational brochure alone were approximately
five percentage points less likely to en roll in the insurance pr ogram relative to the control group who
received nothing, although the difference is small (Column 1). This potentially indicates that expectations
about the pro duct were overly optimistic, which is consistent with the f act that all those in the control
group who enrolled dropped out of t he program by the second year. Those receiving a 6-month subsidy
and assigned to register at the INSS office wer e 33 pe rcentage points m ore likely to purchase insurance
than the control group, and those recei ving a 6-m onth subsidy and assigned to register at a participating
MFI were 28 percentage points more likely to enroll relative to the controls.
Surprisingly, the difference in take-up between those assigned to enroll at an MFI versus at INSS
is marginally statistically significant and negative (p-value = 0.07; results not shown). The results of focus
group interviews held in 2008 shed ligh t on this finding, indicating that many survey respondents did not
understand the purpose of the MFI serving as an agent fo r the insurance, and preferred enrolling directl y
at the INSS.16 Other reports indicated coordination problems between central MFI management and MF I
branches about the enroll ment pro cess. Overall, 98.5% of indi viduals who enrolled adhered to their
randomly assigned locatio n for enrollment. 17 Of tho se who enrol led at an M FI, 47 perce nt went to
ProCredit, 15 percent went to Findesa, and 37 percent went to ACODEP (results not shown).18
16 In some cases, the INSS reported that some respondents assigned to sign up at MFIs attempted to first sign up at INSS but were turned away and told that their lottery award was only valid at an MFI, suggesting that, were clients able to enroll at either location, the difference between MFI and non-MFI assignment may disappear. 17 Of those who were clients of a participating MFI, the majority of those receiving the 6 month subsidy and who were told to sign up with an MFI signed up at their own institution (77 percent of ACODEP clients, 57 percent of Findesa clients, and 85 percent of ProCredit clients). Of those who were a client of a different MFI or who were not a MFI client, affiliation was fairly evenly split at ACODEP and Procredit, with low affiliation rates at Findesa. 18 The higher uptake for ProCredit clients is likely influenced by the large and convenient branch located near the Oriental Market where many respondents worked. In addition, key informant interviews and our monitoring of the MFIs’ activities related to the program revealed higher levels of effort in participating in the project, including training its staff and arranging events to market the program to its clients. Administrative problems may also have influenced the results. While ACODEP had a marketing effort in place, we learned that its branch manager in the Oriental Market was changed shortly after our baseline survey and that the new manager was not informed of either the demonstration project nor of the MFI’s commitment to sign up survey respondents. As a result, many people were turned away when they tried to sign up.

17
Men were slightly less likely to enroll t han female respondents, although the difference was not
statistically significant; there wa s no significant difference in ta ke-up between m arried and unm arried
respondents – with the exception of non-MFI clients, among whom married individuals were 4 percentage
points more l ikely to enroll. Controlling for the tota l number of children in the fam ily, having children
under the age of 12 (the age of eligible dependents) increased the likelihood of take-up by approximately
3 percentage points; however the total number of children was negatively related to uptake. Conditional
on the above variables, age (not shown) and education had no additional explanatory power.
Even more surprisingly, baseline health expenditures and utilization of health care had very little
predictive power in determining enro llment. Similarly, income h ad no statistically significant effect on
insurance take-up, control ling for all o ther factor s, which may reflect the high degree of correlation
between income and other household characteristics. However, having a chronic or co mmonly recurring
disease, such as diabetes or hypertension, was positiv ely associated with rates of uptake, increasing the
likelihood of enrollment by 4.4 percentage points, and indicating some degree of adverse selection in this
type of voluntary insurance program.
Certain markets were associated with significantl y higher take-up than others. Vendors in the
Huembes market had higher take-up rates than those in the Oriental market , an effect that re mains
significant after controlling for the respondents ’ own income, indicating unobs ervable differences across
marketplaces in latent demand for health insurance. For instance, vendors in Huem bes market tend to
have longer market t enure than vendors in other markets in Managua because of the r eportedly better
conditions, greater safety , and m ore “upscale” cli entele. Additionally , Hue mbes market is anecdotal ly
associated with a greater level of for malization (more officially registered businesses) than some of th e
other markets.
In total, the basic p atterns in enrollment are relatively similar between MFI clients and non-MFI
clients. Subsidies are the most important determinants of take-up. Having children under 12 was a more
important determinant among MFI clients than among non-MFI clients. Baseline costs of healthcare also

18
seem to have opposite relationships with take-up between MFI clients and non-MFI clients. However,
these differences are small in magnitude.
5.2 On Site Enrollment
Individuals enrolling for insurance at either the INSS central office or at an MF I were required to provide
photocopies of their government identification cards, two passport size photos, and birth certificates of all
beneficiaries. The y also had to com plete a regist ration form and then travel to the INSS or MFI office
and wait in li ne to register in person. According to our survey, this process took about one day’s time, a
substantial cost for small business ow ners who would need to fi nd someone to watch their market booth
or forego a day’s revenue.
Given the potential barrier s to enrollment posed by t hese costs, a random sample of 175 non-
enrolled respondents (11 2 who had be en offered a 6- month subsid y and 63 who had been offered no
subsidy) were given the opportunity t o enroll for health insurance at their market booth. On-site
enrollment eliminated respondents’ travel costs and reduced the time costs related to taking photographs
and m aking copies of the ir ID cards. In addition, it m inimized potential ps ychological influences on
enrollment such as procras tination or im perfect recall and addressed constraints i mposed by uncertainty
regarding the enrollment process.
Providing respondents the convenience of signing up for insurance directly from their market stall
had a large ef fect on enrollment rates. Within the market that was chosen for the on-site enrollment, only
one percent of those receiving inf ormation alone en rolled com pared to 23 percent of those who als o
received the opport unity t o enroll on t he spot but no financial s ubsidy. Sim ilarly, 34 percent of t hose
offered the 6-m onth subsidy without on-site enrollment purchased insurance, co mpared to 70 percent of
those offered both on-the-spot enrollment and the six month subsidy (results not shown). In sum, simply
reducing the time costs of going to an office to sign up (without offering a subsidy) had more than half the

19
effect of a 6-month subsidy worth approximately $100.19
5.3 Effect of Insurance: Utilization and Expenditures
We next use follow-up survey data to examine the effects of insurance coverage on health care utilization
and expenditures after one year. In light of the larg e differences in enrollment between those offered six-
month subsidies versus information only, we in strument for insurance coverage using treatm ent
assignment with specification (1); that is, having bee n offered a six-m onth subsidy.20 The instrumental
variables estimates are presented in Table 5.
Overall, enrolling in health insurance did not lead to an increase in the probability of seeking any
health care from a provider, but it did significantly im pact substitution away fro m use of public and
private facili ties into EM P facilities covered by th e insurance. Those who were insured were 42.9
percentage points more likely to have visited an EMP in the prior year, 9.0 percentage points less likely to
have visited a private clinic, 5.9 pe rcentage points less likely to have visited a public health center, and
11.9 percentage points less likely to h ave visited a public hospi tal than the uninsured. No differences
between MFI and non-MF I clients were found in the general pattern of this s ubstitution. Although most
pharmaceuticals were covered under the INSS insurance and could be obtained for free from EMPs, visits
to pharm acies did not change with health insuran ce enroll ment, likely reflecting the net effect of
substitution away fro m pharmacies f or primary car e and increased demand for drugs covered by
insurance.21 Unfortunately, our data do not allo w us to measure the to tal am ount or t ypes o f
pharmaceuticals used, which would help determ ine whether the co mposition or the total value of drug
consumption changed in response to the insurance, although th e fact that p harmacy visits remained
19 The impressive t ake up of lottery winners who were approached in their booths suggests that this and similar project interventions that target this population may be underestimating the value of their time or the range of factors inhibiting enrollment. 20 Note that almost all of the individuals in the analytic sample with insurance were those who had received a 6-month subsidy. The winners of the 2-month subsidy were not interviewed during the follow-up survey. 21 The survey did not identify the ownership of pharmacies. Most pharmacies are independent private facilities, but respondents may have included some on-site EMP pharmacies within this category.
20
constant suggests that it did not.
In terms of utilization, having health insurance in creased the total number of health care visit s by
almost one visit per y ear (0.892), but t his was not st atistically significant (standard error 0.746). There
was a sim ilar amount of substitution a way from public and private provider visits into free EMP visits
(both annually and for last illness – results not show n). For MFI and non-MFI clients, th e patterns are
quite similar: visits to the EMP increase, with a decrease in use of private and public health facilities.
Health expenditure patterns mirror the changes in utilization patterns. Enrolling in health
insurance led to a 70 percent declin e in total out-of-pocket expenditures for respondents, although this is
not statistically significant (standard error of 0. 454), with the largest expenditu re reductions for private
clinics (particularly among non-MFI cli ents), laboratories, and phar macies. As services from pharmacies
and laboratories often account for the largest and most frequent out-of-pocket expenses among uninsured
informal sector workers, these servic es are the most valuable categories of care covered by INSS. It
should be noted, however, that, just as with baselin e health expenditures, total health expenditures
between baseline and fol low-up fell below the average annual insurance premium. Hence, insurance did
not provide an absolute cost savings for the average individual. 22 However, for risk-averse individuals, an
important component of the value of insurance is havi ng coverage in cases of large unanticipated health
shocks, a benefit that accr ues to all those covered r egardless of utilization. Unfortunately , our sam ple is
too small and period of coverage t oo short to observe enough large hea lth shocks and therefore measure
the benefit to indivi duals of being co vered in such events in terms of avoiding forego ne care, sale of
productive assets, or entry into debt.
5.4 Effect of Insurance: Family Planning and Other Services
An additional outcom e of i nterest in this analy sis was the associati on between insurance enr ollment and
utilization of reproductive health and f amily planni ng (RH/FP) services, especially at INSS-contracted
22 Note that an actuarially fair health insurance plan would not result in absolute costs savings to the average member.

21
EMP facilities. At baselin e, 74.8 percent of the r espondents had been sexually active in the previous 6
months and 74.3 of t hose (or 66% o f the total sa mple) were using som e form of birth control. We
witnessed no difference in use over time between those who enrolled in insurance and those w ho did not,
and no significant change in use of EMPs as a source of family planning (results not shown). Sim ilarly,
insurance coverage did not significant ly increase th e likelihood of using re productive health service s
(defined to include antenatal care, delivery in a health facility, or receipt of RH screening tests; results not
shown).
Among the 220 individuals in the sample who had been pregnant or had a pregnant partner in the
12 months prior to the foll ow-up survey, we found no significant differences b etween insured and non-
insured on t he likelihood of receiving prenatal care, receiving multi-vitamins, or having a n ultrasound ,
although rates of these ser vices were already high. However, insured women were more likely to receive
prenatal attention from EMPs (28 percent of the ins ured individuals versus 7 percent of th e uninsured),
suggesting a potential improvement in qualit y of car e. In addition, insured women were more likely to
have had their babies at an EMP (28 percent of the insured versus 8 percent of the uni nsured). These
statistics should be viewed with caution given the small sample size of women who were pregnant or who
had a birth. We found no im pact of being insure d on the utilization of preve ntive tests (such as pap
smears, prostate exams, mammograms, HIV tests, colonoscop y, vision, hearing, dental exam s, blood
pressure, overall checkups, pregnanc y t ests, or malari a tests), nor on the like lihood of hospitalization
(results not shown).
Finally, we found no significant effects on an y measures of health status including an y type of
sickness such as flu, f ever, diarrhea, or on measures of length of ti me sick – fo r example, the number of
days of missed work the last time the respondent w as ill. This is consistent with finding no significant
effect of being insured on the likelihood of receiving shots or antibiotics at the time of last illness. We
also found no significant effect of being insured on perceived health or perceived life expectancy (results
not shown). The absenc e of an effect of insurance coverage on health status suggests that quality of care
22
did not dramatically improve as a result of shifting f rom public and private health care providers to EMP
clinics, although i t is im portant t o be ar in m ind th at the perio d of st udy is ver y short f or observin g
changes in crude measures of health status.
Overall, the most striking finding from this analysis is that the he alth insurance coverage did not
appear to substantially c hange health care utili zation, and as a result, had little im pact on health.
Unfortunately, our data do not permit us to assess and compare the total value of health care s ervices
consumed over the period for th e i nsured and uninsured, but the health care utilization a nd health
outcomes data show little difference between t he insured and the uni nsured in num ber of
visits/tests/hospitalizations or health status m easures, suggesting the quality of care was unchanged. T he
absence of an increase in health care consum ption in response to the insuran ce suggests both that moral
hazard is not an important feature of behavior in this segment of the market and that up-front payments do
not pose a major barrier to health care utilization am ong this po pulation, for instance, due to liquidit y
constraints. This result h as i mportant i mplications for the affo rdability of health insurance schemes
targeted to similar sub-populations. F or instance, th e result provi des evidence that co-payments are not
important for preventing “over-consumption” of health care among the insured.
5.5 Retention
Consistent with the absence of a perceived benefit to health insurance a mong those on t he margin of
enrolling, retention rates in the progra m were very low after the expiration of the subsidy. At the follow-
up surve y, less than 10 percent of those who had enrolled in the previous y ear were sti ll pay ing for
insurance. Table 6 presents OLS regressions predicting retention rates among those who had enrolled for
insurance. Not surpri singly, the results suggest that those r eceiving the largest subsidies to sign up for
insurance were least likely t o be retained over time; however, the differenc es in retenti on are not
statistically significant (not shown). Other baseline measures of health care cost had no significant impact
on the likelihood of remaining insured (Column 2). Smokers and those who had any chronic or recurring

23
disease were less likely to continue on the plan (although this is not statistically significant).
We find the same general pattern of d eterminants o f retention co mparing MFI clients and non-
MFI clients. Given the s mall s ample size of those who purchased insurance (especi ally, for exa mple,
among those receiving the informational brochure only), we restrict the sam ple to those offer ed 6-month
subsidies (Columns 3, 4) to test whether there we re differences i n retention by assignment to enroll at
MFIs or at the INSS. MFI clients assign ed to affiliate at an MFI branch were 4.4 percentage points m ore
likely to remain insured (Column 4) than those assigned to affiliate at the INSS, although the difference is
not statistically significant. While this is suggestive of the convenience of MFIs as payment channels, it is
important to note that, while place of en rollment was randomized, the above estimates are conditional on
having purchased insurance, which is endogenous.
The patterns of retention in the progra m are arguably some of the most strik ing finding o f the
study and have important implications for the feasibility of creating sustainable health insurance programs
for informal sector worker s through voluntary schemes. If few pe ople remain in the progra m, or if those
that remain are the most sick, the program will neither be effective in reaching the bulk of the uninsured
nor sustainable from a cost perspective for the few that are reached. And while low enrollment rates may
improve over time as information about the program spreads, low retention rates may be a much m ore a
fundamental indicator of program failure. Very l ow retention speaks to basic flaws in the program ’s
design that would need to be changed to make the program viable. For instance, the program may have to
increase the number and quality of providers or change the pay structure to a system with lower premiums
and higher co-payments.
6. CONTEXTUAL CONSIDERATIONS
To better u nderstand our findi ngs, w e conducted a ser ies of individ ual int erviews and focus grou p
discussions to learn more about informal sector workers’ experiences with the INSS insurance. 23 First, to
23 These interviews also functioned as audits to ensure the rigor of local surveyors.

24
gain insig ht into reasons for no n-enrollment, we conducted ind ividual i nterviews with 40 rand omly
selected Huembes market vendors who had won subsidies but not enrolled. To better understand whether
participating EMPs were meeting the standards nece ssary to attract and retain subscribers and providing
appropriate services to the informal sector, we also interviewed 20 participants who had enrolled.
In total, we conducted ni ne focus group discussions am ong fiv e strata of p articipants defined
according to MFI client status, receipt of a subsidy, and enrollment in the insurance:
Won subsidy No subsidy Enrolled Did not enroll Did not enroll
MFI client Stratum 1 Stratum 3 Stratum 5 Non-MFI client Stratum 2 Stratum 4
With the exception of stratum 5, two f ocus group discussions were organized for each strat um,
one each with vendors from the Oriental and Huembes markets.24 In total, 73 market vendors participated
in the discussions. Selected qualitative findings, grouped by theme, ar e discussed below. I n addition to
these focus groups, we also conducted interviews with MFI representatives.
Time and convenience costs: Interviews with the 40 randomly selected vendors in the Huembes
market who had not purchased insurance even after winning a 6-month subsidy revealed that 25 intended
to enroll. Half of these explained the y had not fo und the tim e to do so. Other reasons for not signing up
included problems obtaining all of the required documentation (photos, copy of ID card, children ’s birth
certificates, and subscription forms) and confusion about the enrollment process.
Information: Few particip ants in our f ocus group discussions had heard of th e INSS insurance
program for informal workers prior to the baseline survey. In the focus groups, some expressed confusion
about the insurance benefits; in par ticular, some participants thought that the insurance provided benefits
24 Respondents that had provided telephone numbers during the follow-up survey were selected randomly within each stratum. Researchers first contacted potential participants via telephone, and followed up with an in-person visit to the market stall to administer an informed consent protocol to those who agreed to participate. Despite confirming their consent to participate, some did not attend. Only 2 out of 30 recruited Stratum 5 participants in the Oriental market showed up as planned, so that discussion was cancelled. Focus group discussions were held at quiet locations near each market. All participants were paid a transportation stipend of approximately 5 dollars. A professional facilitator recruited the participants and moderated each discussion. All discussions were tape recorded and transcribed.
25
during old a ge. This confusion m ay have been relate d to the fact that INS S formal s ector coverage
bundles pension, health insurance, and worker’ s compensation into one package. Discussan ts also noted
difficulties obtaining clear inform ation about t he pr ogram, particularly from the MFIs; 12 MFI clients
said that they received no inform ation about the progr am from their MFI. A few wer e skept ical of the
program and its legitimacy, and worried that they might get “trapped” into paying for the insurance after
the subsid y expired. The ke y recommendations su ggested b y participants for im proving the program
were better provision of information about what benefits were covered, how to enroll, what fees would be
charged, and how to make payments.
“I think that is the reason that most people don’t pay into the insurance, we don’t know where to do it or with whom to do it. I think there needs to be more publicity …”
–MFI client who won a subsidy but did not enroll [Huembes market]
Eight participants reported that they never received proof of their enrollment in the insurance from INSS.
This led to confusion about whether the program was “real,” whether they were indeed covered, and when
they could start using services.25
“I was told that … they would notify me when I could use the insurance, a thing that never happened. After a week passed, then two weeks, I said that it was a real joke because they never notified me. Then 8 months later, a statement arrived that owed two months of insurance payments.”
– Non-MFI client who enrolled [Oriental market] Attitudes toward MFIs as insurance intermediaries: In contrast to researche rs’ expectations,
focus group discussants expressed a pr eference for enrolling in the insu rance directly with INSS rather
than through MFIs. INS S was perc eived as a more stable insti tution, where as MFIs w ere potentially
vulnerable to bankruptcy and possibly less trustworthy. Respondents noted that health insurance wa s the
regular “business” of INSS, whereas MFIs were not experts in health insurance:
“INSS knows the benefits, what’s not covered, while the MFI is a lending institution and doesn’t understand [health]. Health is not its specialty; its thing is money.”
25 Another potential source of confusion about enrollment derived from the failure of INSS to deliver monthly billing statements. Under the traditional INSS (formal sector) insurance scheme, couriers on motorbikes hand-deliver monthly statements to each employer’s office; this system was administratively burdensome for the dispersed informal sector workers. While some workers received their statements, this was not always reliable and this may have caused more confusion.

26
– MFI client that enrolled [Oriental market]
Several discu ssants expressed concern that MFIs might charge hidden fees or interest for providing
insurance services. However, a handful of participan ts expressed a preference to make routine payments
at banks and MFIs, noting the long waiting lines at the INSS office.
One possible reason for poor service among the MFIs was conflict with the government over their
role in the program . As described earlier, approximately 10 months into the pro gram, INSS chose not to
renew their contracts with the participating MFIs. While the MFIs were engaged during the first phase of
the pilot and evaluation, once it became clear that INSS contracts with MFIs would not be renewed, MFIs
halted their efforts to market the voluntary program and discontinued offering payment services on behalf
of INSS. The change in t he process, and the accompanying lack of information, was likely to have been
a source of confusion among participants who had signed up with an MFI. In th e follow-up survey, 62%
of participants claimed they did not know where to make insurance payments.
Role of EMPs: The individual interviews with 20 selected survey participants who had registered
for insurance indicated that a s mall num ber of EM P clinics were aggressively encour aging subs idy
winners to enroll in the insurance and register with their clinic. Indeed, two small EMPs had over 40
percent of th e market share. Ho wever, enrollees reported that these EMPs d id not provide sufficient
information on when the y could begin to utilize ser vices, and they expressed wi despread dissatisfaction
with the clinics’ custo mer service and willingness to serve cli ents under the new insuran ce scheme.
Hence, a key factor in improving retention may be increasing provider quality of care and level of service.
Willingness to pay for insurance: Althoug h many focus group participants reported that health
insurance was worth buying, almost all indicated a preference for an insurance product with a lower price
tag. Those who enrolled and had young children indi cated that obtaining coverage for their children
under 12 was a key motivating factor. Other repor ted reasons for enrollm ent were ensuri ng access to
regular medical checkups and getting protection in c ase of future emergencies or surgeries. Reasons for
non-enrollment, cited by t hose who received a subsidy but did not purchase the insurance, included:

27
having children who were too old to be eligible; pref erence to visit a phar macy rather than a doctor for
most health care because it was faster and m ore convenient; concern that the prem ium was too high to
afford after the subsidy expired; and t he tim e co sts and i nconvenience associ ated with the enrollm ent
process. Given this, an important design consideration may be co-payment versus flat fee for service.
MFI Participation: Regarding i nvolvement of MFIs in voluntary health insurance schemes for
the poor, the challenges of a program fundam entally based on a public-priva te partnership cannot be
underestimated. First, it is challengi ng to coordinate programs between in stitutions that have substantial
differences in culture, manage ment sty les and processes. These differences can lead to
miscommunication and frustration am ong personnel on bot h sides and re quire significant coordination ,
transparency and co mmitment from senior management . Second, a lack of tr ust between INSS and the
MFIs about i ncentives for participating in the pr ogram tainted the partnership. INSS’s su spicion that
MFIs would unfairly pr ofit from th e program appears to have been unfounded, according to our
interviews with MFIs. The initial invest ment by MFIs in operations, traini ng, and m arketing for the
program were significant, and low volumes of s ales meant that MFIs recovered few of their costs. INSS
argued that MFIs would gain financially by having healthier clients who then repaid their loans more
steadily, but given MFIs ’ alread y very hig h loan repayment rates, this pote ntial benefit was rather
insignificant.
MFIs did have incentives to participate in the program, however. According to our interv iews
with MFI representatives, they saw the INSS insuran ce a s a marketable co mplement to their existing
credit services. Strong com petition in the microfinance sector in Nicar agua drives MFIs t o seek new
products that would gi ve them a co mpetitive advantage. In additi on, the MFIs ’ sense of social mission
played an important role i n their decision to participate. MFIs were aware that their clients lacked acc ess
to quality health care and saw the INSS product as a cost -effective solution to improve this access. The
incentives faced by individual MFI staff members to support the demonstration project, however, wer e
less clear. Loan officers who were charged with selling the product found that closing a “sale” of

28
insurance could take two visits and over an hour.
7. CONCLUSIONS
This paper presents the results from a randomized evaluation of the Nicaraguan government’s 2007 pilot
program to e xtend social security health insuran ce to the inform al sector on a voluntary basis. Our
analysis sheds light on the effective ness of some ele ments of the progra m’s design in term s of
encouraging enrollment and retention and the pr ogram’s effects on health service utilization and
expenditures. Our results provide im portant eviden ce on the cha llenges of pr oviding healt h insurance
coverage to informal sector wo rkers in developing countries through the extension of an existin g
mandatory public sector program to a population for whom enrollment is voluntary.
Ultimately, while the INSS program ai med to pr ovide greater accessibility to informal sector
workers by bringing the enrollment a nd pa yments processes closer to the p hysical locati on of these
workers (via MFIs), results fro m this study indicate that the Nicaraguan gover nment did no t succeed in
creating a sustainable health insurance program, largely because convenience and quality of care were not
adequately addressed. We emphasize six central policy-relevant conclusions based on our findings.
First, if individuals are risk averse, they should be willing to pa y at least as m uch for ins urance
premiums as their anticipated annual health expe nditures on services that would be cove red by the
insurance. In contrast, we find that 77% of informal market vendors in Managua who did not enroll in the
insurance program had higher baseline annual health expenditures than the annual cost of flat fee (no co-
payments) insurance cove rage. The fac t that many individuals choose to spend m ore on out-of-network
health care than the y would on in -network care suggests either signi ficant unobservable differences i n
utilization costs (e.g., trav el or waiting ti mes) or quality of withi n-network relative to out-of-network
providers, or uncertainty or distrust regarding th e value of services covered. Focus group discussions
suggest that both factors – utilization costs and quality concerns – were i mportant. Extr emely low
willingness to pay also suggests that the average indi vidual assigns little value to insurance as a means of
29
managing financial risk – that is, she is not willing to pay premiums much beyond what she expects to use
over the course of the year.
Second, although lowering the price of insurance through subsidies encouraged enrollment, only
one-third of subscribers on the margin of influence were willing to pay the full price of insurance once the
subsidy ran out, indicatin g that short-term price subsidies were not an effective means o f prom oting
insurance enrollment in the inform al sector. The low er initial price was designed to increase dem and for
insurance among t he previ ously uninsur ed. However, in this setting it appears that perm anently lower
prices (or hig her quality services) are needed to sust ain a voluntary program . This is i mportant evidence
on the lim itations of usi ng subsidies as a means of attracting new insurance custo mers. Instead,
governments should consider alternative payment structures, such as lowering prem iums and introducing
co-payments, to increase d emand for the product. Furthe rmore, the low cost of private and public sector
providers sought out b y th e uninsured – which kept out-of-pocke t health care costs below the cost of
INSS insurance premiu ms – suggests that respondents are combining available services more efficiently
than the INS S. Further analy sis m ight evaluate the quality of t he services b eing used an d determ ine
whether a more efficient “package” can be offered by the INSS or other insurers.
Third, streamlined enroll ment procedures by offering on-sit e affiliation were valuable in
attracting new custo mers, indicating that time cos ts were i mportant for Nicaraguan informal se ctor
workers’ decisions around health insurance. Si milar strategies may be necessary for launc hing a new
health insurance program in a comparable setting, both to bring the program to scale and broaden the risk
pool. Our su rveys and focus group discussions indicated a strong preference for a m ore transparent and
convenient registration process. Time constraints were cited as an important reason for not enrolling in
the insurance , even when it was subsidized. Participants also criti cized slow, i neffective dis tribution of
billing statements. Further analysis might test the potential for automated registration procedures through
PDAs and other rem ote devices, as well as paperles s billing through mechanisms such as SMS messages
on cell phones. Pay ment sy stems the mselves could potentially by pass the MFI or bank if sufficient
technology is integrated into the process. Confusion about the location of payments and billing problems

30
also affected the retention of survey respondents who signed up for insurance.
Fourth, our results suggest that insurance coverage did not encourage over-consumption of health
care servic es. Contrary to what m any governm ents fear when introducing flat-fee hea lth insurance
coverage, those who enrolled in the program did not exhibit a significantly different pattern of health care
utilization than the y did when they were uninsured. While we cannot com pletely rule out the possibility
that the insured increase their consumption of health care conditional on need, particularly given that that
we do not have very precise measures of quality, the change in consumption is certainly not significant
enough to destabilize an insurance program.
Fifth, while using MFIs as delivery channels may b e useful when governm ent programs h ave
limited outreach and infrastructure an d when MFIs vi ew mutual benefit in the associ ation, offering
transactions services through MFIs is not sufficient t o bring workers in the door. Hence, it is im portant
not to u nderestimate the com plexity in volved in wo rking with M FIs. Suspicion about p ossible profit-
oriented motivations of M FIs in Nicaragua damaged the tone of t heir working relationship with INSS.
Strong strategic leadership and commitment are needed within both sectors to ensure that the operational
arrangements are cl ear and incentives are w ell ali gned. Finally, ad ministrative procedures for both
enrollment and premium payments need to be clearly delineated and convenient for users.
Sixth, the theory that the INSS health insuran ce for informal se ctor workers would lessen the
burden on Ministry of Health resources may not have been founded. At baseline, informal sector workers
in our sample were already more likely to use private sector providers than public providers. Enrolling in
INSS health insurance resulted in significant switching out of use of both public and private facilities into
EMP services. Programs seeking to reduce the burden on public sector resources of public health facilities
should consi der that informal sector workers in Nicaragua spend significantly more out of pocket on
health care than the overall population, and may not be among those placing the greatest burden on public
resources. Segmentation of the informal sector may identify workers in the lo wer-income brackets most
likely to use public sector resources and perhaps ab le to pa y smaller pre miums for co mplementary
31
insurance or for basic pre-paid private service packages in convenient locations. For those informal sector
workers on the higher end of the income spectru m, who are already using private health facilities and
pharmacies, insurance progra ms need t o take great car e to differentiate them selves in terms of price,
convenience, and quality in order to ensure retention.
In sum , to ensure retention in an unsubsidized ins urance progra m, benefits packages must be
designed to balance informal workers’ preference for convenience and quality of care with their lim ited
disposable income. Qualitative findings indicate that respondents wanted convenient care that covered
young children and provided insura nce for costly services such as emer gencies and surgery. Quantitative
results show a preference for private providers, particularly among MFI clients. While drug coverage was
an appealing component of the insurance, it adds sign ificantly to its cost. Rather than offering insurance-
based drug coverage, out-of-pocket expenses for phar maceuticals could be reduced through efforts to
promote generic drug usage and pharmacy discounts. Education about the specific coverage and value of
insurance as a risk mitigation tool m ay also help increase the wi llingness of in formal sector workers to
pay for insurance, as th ey m ay not fully understa nd the risk management value of coverage for
catastrophic care.

32
References
Abel-Smith, B. (1992). Health insurance in developing countries: lessons from experience. Health Policy and Planning 7(3): 215-226. Alderman, H. and Paxson, C. (1994). Do the poor insure? A synthesis of the literature on risk sharing institutions in developing countries. In International Economic Association Moscow Conference Vol. 4. Barros, Rodrigo. (2008). “Wealthier But Not Much Healthier: Effects of a Health Insurance Program for the Poor in Mexico”. Stanford University Working Paper. Behrman, J. and Knowles, J. (1999). The demand for health insurance in Vietnam. Mimeo. Chankova, S., Sulzbach, S. and Diop, F. (2008). Impact of mutual health organizations: evidence from West Africa, Health Policy and Planning, 23(4): 264-276 Churchill, C. (2003). Insurance Work for Microfinance Institutions: A Technical Guide to Developing and Delivering Microinsurance. InFocus Programme for Small Enterprise Development, International Labour Organization, Geneva. Churchill, C., and Cohen, M. (2006). Marketing Microinsurance, in C. Churchill (ed.), Protecting the Poor, A microinsurance compendium, International Labor Organization, Geneva. Dercon, S. (2002). Income risk, coping strategies and safety nets. The World Bank Research Observer 17(2), 141-166. Dercon, S., Kirchberger, M., Gunning, J.W., Platteau, J. (2008). Literature Review on Microinsurance. European Development Research Network. Duflo, E., Banerjee, A., and A. Deaton.(2004). “Wealth, Health, and Health Services in Rural Rajasthan.” American Economic Review Papers and Proceedings 94(2): 326-330. Dow, W. and K. Schmeer. (2003). “Health Insurance and Child Mortality in Costa Rica.” Social Science and Medicine 57(6): 975-986. Fafchamps, M. (1995). Risk sharing, quasi-credit, and the enforcement of informal contracts. Stanford University. Franco, L., Diop, F., Burgert, C., Kelley, A., Makinen, M., Simpara, C. (2008). Effects of mutual health organizations on use of priority health-care services in urban and rural Mali: a case-control study. Bulletin of the World Health Organization 86(11):830-8. Gakidou, E. et. al. (2006). “Assessing the Effect of the 2001-2006 Mexican Health Reform: An Interim Report Card.” The Lancet 368: 1920-1935. Gertler, P., and J. Gruber. (2002). “Insuring Consumption Against Illness," American Economic Review, 92(1), 5176. Gertler, P. and Solon, O. (2002). “Who Benefits From Social Health Insurance? Evidence from the Philippines,” Unpublished Manuscript, University of California, Berkeley and the University of the Philippines.

33
Gine, X. Tonsend, R.M., and Vickery, J. (2007). Patterns of Rainfall Insurance Participation in Rural India, Policy Research Working Paper Series 4408, The World Bank. GTZ, ILO and WHO. (2005). Recommendations for Action. The International Conference on Social Health Insurance in Developing Countries. Geneva: GTZ, ILO, and WHO. Gumber, A. and Kulkarni, V. (2000). Health Insurance for Informal Sector: Case Study of Gujarat. Economic and Political Weekly, 30 Sept 2000. Jowett, M. (2003). Do informal risk sharing networks crowd out public voluntary health insurance? Evidence from Vietnam. Applied Economics 35: 1153-1161. Kremer, M. et. al. (2006). “Contracting for Health: Evidence from Cambodia,” Unpublished Manuscript, Harvard University. Magnoni, B., Natilson, N., Bolaños, G. (2005) Estudio de Factibilidad de la Incorporación del Sector Laboral Independiente en el Seguro Facultativo de Salud del INSS. Original Feasibility Study submitted by the Banking on Health Project to the INSS in September 28, 2005 Matin, I. , Hulme, D., and Rutherford S. (2002). Finance for the Poor: From Microcredit to Microfinancial Services. Journal of Economic Development 14: 273-294. McIntyre, D., Thiede, M., Dahlgren, G., & Whitehead, M. (2006). What are the economic consequences for households of illness and of paying for health care in low- and middle-income country contexts? Soc Sci Med 62(4), 858-865 Miller, Grant, Diana Pinto, and Marcos Vera-Hernández. (2009). “Supply- vs. Demand-Side Rationing in Developing Country Health Insurance: Evidence from Colombia’s ‘Régimen Subsidiado’”. Working Paper. Morduch, J. (1999). Between the State and the Market: Can Informal Insurance Patch the Safety Net? World Bank Res. Obs., August 1999; 14: 187 - 207. Morduch, J., & Sharma, M. (2002). Strengthening Public Safety Nets from the Bottom Up. Washington, DC: The World Bank. Narayan, D., Chambers, R., Shah, M., & Petesch, P. (2000). Voices of the poor: crying out for change. New York: Oxford University Press. Panopoulus, G. and C. E. Vélez. (2001). "Subsidized Health Insurance, Proxy Means Testing, and the Demand for Health Care among the Poor in Colombia." In Colombia Poverty Report, vol. 2. Washington: World Bank. Pauly, M., Blavin, F., and Meghan, S. (2008). “Is There a Market for Voluntary Health Insurance in Developing Countries?” NBER Working Paper #14095, Cambridge, MA. Pauly, M., Zweifel, P., Scheffler, R., Preker, A., and M. Bassett. (2006). “Private Health Insurance in Developing Countries,” Health Affairs 25(2): 369-379.

34
Preker, A.S., Carrin, G., Dror, D.M., Jakab, M., Hsaio, W. and Arhin, D. (2002). Effectiveness of Community Health Financing in Meeting the Cost of Illness. Bulletin of the World Health Organization 80(2): 143-150. Russell, S. (2004). The economic burden of illness for households in developing countries: a review of studies focusing on malaria, tuberculosis, and human immunodeficiency virus/acquired immunodeficiency syndrome. Am J Trop Med Hyg, 71(Suppl. 2), 147-155. Smith, K. and Sulzbach, S. (2008). Community-based health insurance and access to maternal health services: evidence from three West African countries. Soc Sci Med 66(12):2460-73. Thornton, R., Gonzales Moncada, M., and Islam, M. (2007). Randomized Evaluation of a Program Extending Social Security Health Insurance to the Informal Sector via MFIs in Nicaragua, Baseline Report. Bethesda, MD: Private Sector Partnerships-One Project (Abt Associates Inc.) and Global Development Network.
Wagstaff, A. 2007. “Health Insurance for the Poor: Initial Impacts of Vietnam’s Health Care Fund for the Poor,” Policy Research Paper Series Working Paper # 4134, The World Bank.
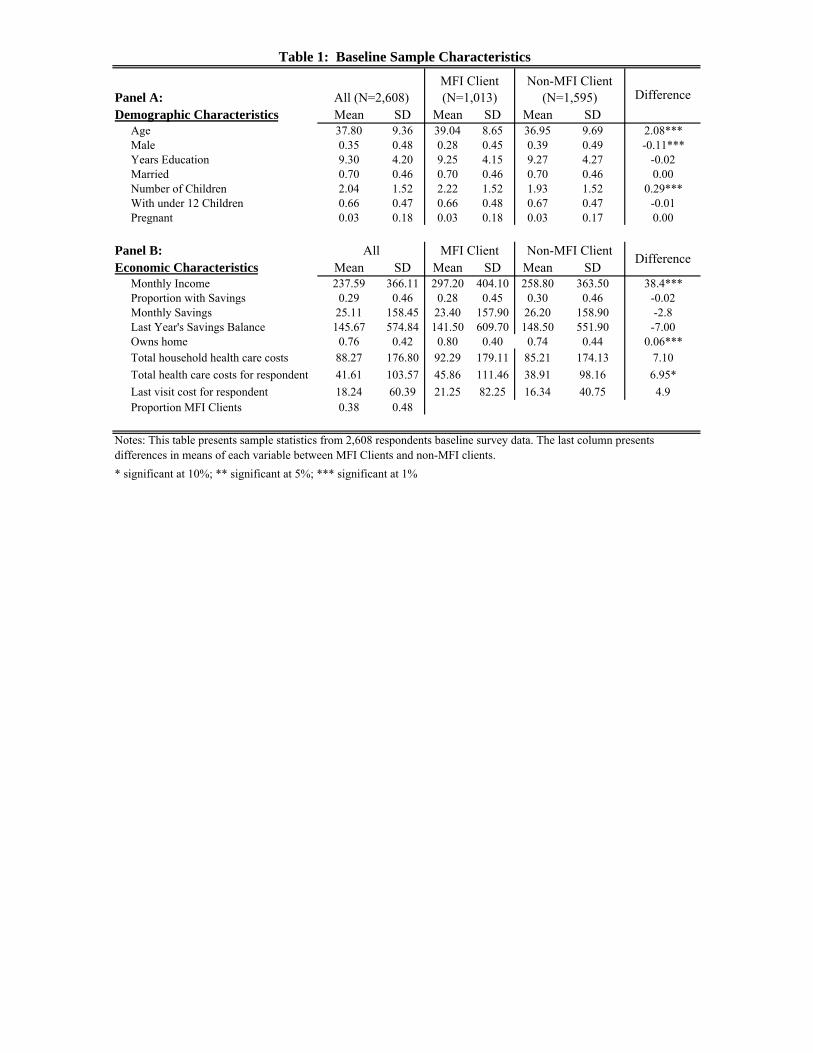
Panel A: Demographic Characteristics Mean SD Mean SD Mean SD
Age 37.80 9.36 39.04 8.65 36.95 9.69 2.08***Male 0.35 0.48 0.28 0.45 0.39 0.49 -0.11***Years Education 9.30 4.20 9.25 4.15 9.27 4.27 -0.02Married 0.70 0.46 0.70 0.46 0.70 0.46 0.00Number of Children 2.04 1.52 2.22 1.52 1.93 1.52 0.29***With under 12 Children 0.66 0.47 0.66 0.48 0.67 0.47 -0.01Pregnant 0.03 0.18 0.03 0.18 0.03 0.17 0.00
Panel B:Economic Characteristics Mean SD Mean SD Mean SD
Monthly Income 237.59 366.11 297.20 404.10 258.80 363.50 38.4***Proportion with Savings 0.29 0.46 0.28 0.45 0.30 0.46 -0.02Monthly Savings 25.11 158.45 23.40 157.90 26.20 158.90 -2.8Last Year's Savings Balance 145.67 574.84 141.50 609.70 148.50 551.90 -7.00Owns home 0.76 0.42 0.80 0.40 0.74 0.44 0.06***Total household health care costs 88.27 176.80 92.29 179.11 85.21 174.13 7.10Total health care costs for respondent 41.61 103.57 45.86 111.46 38.91 98.16 6.95*Last visit cost for respondent 18.24 60.39 21.25 82.25 16.34 40.75 4.9Proportion MFI Clients 0.38 0.48
* significant at 10%; ** significant at 5%; *** significant at 1%
Notes: This table presents sample statistics from 2,608 respondents baseline survey data. The last column presents differences in means of each variable between MFI Clients and non-MFI clients.
Table 1: Baseline Sample Characteristics
Difference
All MFI Client Non-MFI Client Difference
MFI Client (N=1,013)
Non-MFI Client (N=1,595)All (N=2,608)

Difference
Panel A: Health CharacteristicsEver sick in 2007 0.80 0.80 0.80 0.01Times sick in 2007 2.57 2.59 2.55 0.08Days waited to see doctor 4.32 4.75 4.04 0.70
Smokes 0.15 0.14 0.16 -0.03*Diabetes 0.06 0.07 0.05 0.02**Hypertension 0.19 0.21 0.17 0.03**Heart Problems 0.06 0.06 0.05 0.01Respiratory Problems 0.14 0.13 0.14 -0.01Physical Limitations 0.01 0.01 0.01 0.00Sight/Hearing Limitations 0.25 0.27 0.24 0.03Stress 0.15 0.17 0.14 0.03**Kidney Problems 0.25 0.27 0.24 0.02Cancer 0.01 0.01 0.01 0.00Headaches 0.40 0.40 0.40 0.01Skin Problems 0.08 0.08 0.08 0.00Allergies 0.15 0.14 0.15 0.00
Flu 0.60 0.60 0.60 0.00Fever 0.32 0.31 0.33 -0.03Vomiting 0.08 0.08 0.09 -0.02Diarrhea 0.10 0.10 0.09 0.00Cough 0.19 0.18 0.19 -0.02Chest pains 0.15 0.14 0.15 -0.01Back pains 0.26 0.28 0.26 0.02Dizziness 0.17 0.15 0.18 -0.03**
Panel B: Last illnessAllergies or Respiratory Illness 0.49 0.46 0.50 -0.04Renal infection or diabetes 0.14 0.16 0.13 0.03Circulatory problems 0.07 0.08 0.07 0.01Diarrhea or Digestive problems 0.05 0.05 0.05 0.00Arthritis 0.04 0.05 0.04 0.01Gynocology visit 0.03 0.03 0.03 0.00Dengue or Malaria 0.02 0.01 0.02 -0.01Skin infection 0.01 0.01 0.02 0.00Other 0.14 0.14 0.14 0.00
* significant at 10%; ** significant at 5%; *** significant at 1%
Notes: This table presents sample statistics from 2,608 respondents baseline survey data. The last column presents differences in means of each variable between MFI Clients and non-MFI clients.
Table 2: Baseline Health Characteristics
All (N=2,608)
MFI Client (N=1,013)
Non-MFI Client
(N=1,595)Mean

Panel A: All (N=2,608) Mean Std. Dev. Mean Std. Dev. Mean Std. Dev. MedianPharmacy 0.72 0.45 3.21 4.15 42.66 91.22 16.04Private doctor 0.28 0.45 2.18 2.64 0.91 2.36 0.34Laboratory 0.26 0.44 2.09 2.78 25.67 61.93 13.40Social Security Health Clinic (EMP) 0.01 0.08 3.88 5.45 14.88 47.25 28.90Private clinic/hospital 0.14 0.35 2.31 2.17 24.04 73.63 7.50Public (MINSA) health center 0.16 0.36 2.80 3.10 0.26 2.00 2.40Public (MINSA) hospital 0.09 0.28 2.79 5.20 2.33 16.22 12.00
Panel B: MFI Clients (N=1,013) Mean Std. Dev. Mean Std. Dev. Mean Std. Dev. MedianPharmacy 0.73 0.45 3.47 4.78 45.19 89.49 16.04Private doctor 0.32 0.47 2.38 3.52 0.98 3.05 0.34Laboratory 0.26 0.44 2.06 1.89 32.03 85.81 13.37Social Security Health Clinic (EMP) 0.01 0.10 3.80 6.11 24.33 60.98 28.88Private clinic/hospital 0.15 0.36 2.57 2.52 26.11 84.59 7.49Public (MINSA) health center 0.14 0.35 2.58 2.81 0.34 2.38 2.41Public (MINSA) hospital 0.09 0.28 2.45 2.45 3.32 19.24 12.03
Panel C: Non-MFI Clients (N=1,595) Mean Std. Dev. Mean Std. Dev. Mean Std. Dev. MedianPharmacy 0.72 0.45 3.03 3.69 41.05 92.31 16.04Private doctor 0.26 0.44 2.03 1.68 0.85 1.65 0.34Laboratory 0.27 0.44 2.10 3.19 21.84 41.02 13.37Social Security Health Clinic (EMP) 0.00 0.07 4.00 4.83 1.38 3.64 28.89Private clinic/hospital 0.14 0.35 2.13 1.88 22.61 65.14 7.49Public (MINSA) health center 0.17 0.37 2.92 3.24 0.21 1.76 2.41Public (MINSA) hospital 0.09 0.28 3.00 6.35 1.70 14.01 12.03
Table 3: Health Facilities Visited in the Past Year at Baseline
Note: This table presents sample statistics from 2,608 respondents baseline survey data. Proportion of the respondents who visited each provider in the past year. Number of respondent total visits and amount the respondent spent includes only those who actually went to that facility. Amount spent is presented in dollars.
Visited Number of Visits
Visited Number of Visits
Visited Number of Visits
Expenditure
Expenditure
Expenditure

MFI Client Non-MFI Client(1) (2) (3) (4)
Information only -0.050** -0.062** -0.054 -0.094**[0.023] [0.027] [0.040] [0.040]
6 month subsidy-INSS 0.332*** 0.331*** 0.380*** 0.273***[0.028] [0.032] [0.050] [0.044]
6 months subsidy-MFI 0.281*** 0.273*** 0.308*** 0.222***[0.028] [0.032] [0.048] [0.046]
Male -0.021 -0.023 -0.003 -0.032[0.015] [0.017] [0.030] [0.021]
Education 0.002 0.002 0.000 0.003[0.002] [0.002] [0.003] [0.003]
Married 0.013 0.023 -0.003 0.039*[0.016] [0.018] [0.029] [0.023]
MFI client 0.033** 0.031* 0.000 0.000[0.015] [0.016] [0.000] [0.000]
Number of children -0.015*** -0.012** -0.031*** 0.001[0.005] [0.006] [0.010] [0.008]
Has children under 12 0.030* 0.034* 0.110*** -0.017[0.017] [0.019] [0.030] [0.024]
Log income 0.012* 0.014 0.012*[0.006] [0.012] [0.007]
Has any savings 0.007 -0.002 0.005[0.017] [0.028] [0.022]
Smokes 0.012 -0.028 0.036[0.021] [0.032] [0.028]
Any chronic disease 0.043** 0.033 0.052**[0.017] [0.027] [0.023]
Ever sick 0.004 0.004 -0.025[0.059] [0.118] [0.069]
Log costs of healthcare -0.001 -0.01 0.005[0.004] [0.006] [0.004]
Number of visits to provider 0.000 0.002 -0.001[0.001] [0.002] [0.002]
Any visit to provider 0.026 0.143 -0.02[0.067] [0.129] [0.080]
Constant 0.023 -0.122 -0.492* 0.029[0.116] [0.136] [0.254] [0.165]
Observations 2608 2231 872 1359R-squared 0.22 0.23 0.3 0.21
Table 4: Determinants of Insurance EnrollmentAll
Notes: Standard errors in brackets. This table presents OLS regressions on signing up for health insurance. Each column also includes market fixed effect (location of work for the respondent) and round fixed effects as well as controls for age and age squared. "Any chronic disease includes diabetes, hypertension, cardiac problems, physical disability, psychological problems, kidney problems, and cancer. * significant at 10%; ** significant at 5%; *** significant at 1%
Dependent variable: Signed up for Insurance (0/1)

Panel A: All (N=2608) Coeff. Std. Err. Coeff. Std. Err. Coeff. Std. Err.Pharmacy -0.033 [0.043] 0.416 [0.443] -0.775* [0.465]Private doctor 0.017 [0.038] 0.031 [0.121] 0.254 [0.373]Laboratory -0.078 [0.054] -0.143 [0.208] -1.655*** [0.513]EMP 0.429*** [0.027] 1.549*** [0.144]Private clinic/hospital -0.090* [0.050] -0.481*** [0.181] -0.847* [0.494]Public (MINSA) health center -0.059 [0.047] -0.408* [0.246] 0.001 [0.047]Public (MINSA) hospital -0.119*** [0.040] -0.173 [0.152] -0.039 [0.033]All/Any -0.004 [0.034] 0.892 [0.746] -0.703 [0.454]
Panel B: MFI Clients (N=1,013) Coeff. Std. Err. Coeff. Std. Err. Coeff. Std. Err.Pharmacy -0.033 [0.063] 0.581 [0.727] -0.886 [0.689]Private doctor 0.012 [0.058] -0.022 [0.170] 0.018 [0.565]Laboratory -0.131 [0.081] -0.15 [0.380] -1.613** [0.770]EMP 0.440*** [0.040] 1.787*** [0.240]Private clinic/hospital -0.074 [0.074] -0.643** [0.268] -0.791 [0.727]Public (MINSA) health center -0.054 [0.069] -0.421 [0.297] 0.049 [0.049]Public (MINSA) hospital -0.151** [0.061] -0.244 [0.255] -0.076 [0.054]All/Any -0.001 [0.046] 1.092 [1.227] -0.914 [0.648]
Panel C: Non-MFI Clients (N=1,595) Coeff. Std. Err. Coeff. Std. Err. Coeff. Std. Err.Pharmacy -0.026 [0.059] 0.353 [0.559] -0.6 [0.632]Private doctor 0.014 [0.051] 0.045 [0.166] 0.349 [0.498]Laboratory -0.032 [0.072] -0.13 [0.226] -1.494** [0.691]EMP 0.422*** [0.037] 1.364*** [0.175]Private clinic/hospital -0.106 [0.067] -0.374 [0.249] -0.915 [0.673]Public (MINSA) health center -0.07 [0.064] -0.468 [0.393] -0.032 [0.072]Public (MINSA) hospital -0.082 [0.055] -0.101 [0.186] -0.012 [0.044]All/Any -0.002 [0.048] 0.721 [0.946] -0.499 [0.631]
* significant at 10%; ** significant at 5%; *** significant at 1%
Number of Visits Ln(Amount spent)
Table 5: Effect of Having Insurance on Health Care Utilization and Expenditures
Note: This table presented the impact of having health insurance on having visted each health provider, the number of visits to that health provider (unconditional on any visit) and the log expenditures at that provider (unconditional on any visit) at the follow-up survey. Having insurance is instrumented with being offered a 6 month subsidy to affiliate at the INSS or at a MFI and is equivalent to the specifications in table 5; controls for the baseline visits or expenditures are also included. Each coefficient is from a separate regression and standard errors are in brackets.
Visited Number of Visits Ln(Amount spent)
Visited
Visited Number of Visits Ln(Amount spent)
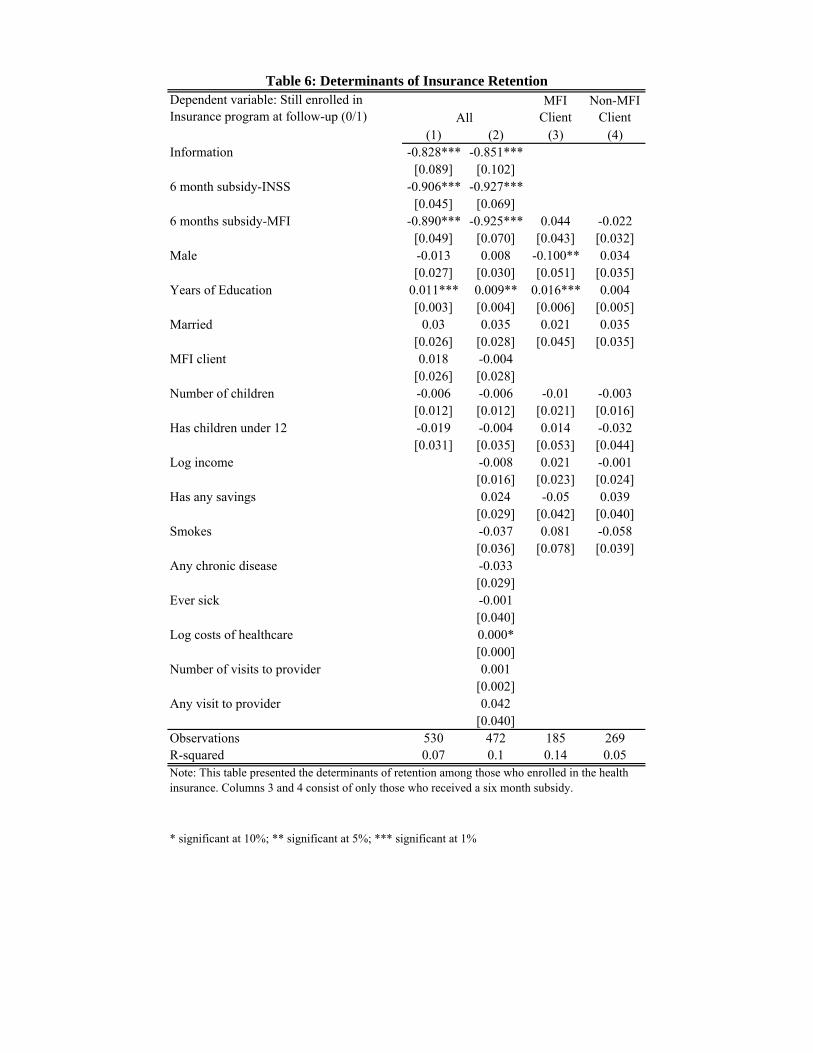
Dependent variable: Still enrolled in Insurance program at follow-up (0/1)
MFI Client
Non-MFI Client
(1) (2) (3) (4)Information -0.828*** -0.851***
[0.089] [0.102]6 month subsidy-INSS -0.906*** -0.927***
[0.045] [0.069]6 months subsidy-MFI -0.890*** -0.925*** 0.044 -0.022
[0.049] [0.070] [0.043] [0.032]Male -0.013 0.008 -0.100** 0.034
[0.027] [0.030] [0.051] [0.035]Years of Education 0.011*** 0.009** 0.016*** 0.004
[0.003] [0.004] [0.006] [0.005]Married 0.03 0.035 0.021 0.035
[0.026] [0.028] [0.045] [0.035]MFI client 0.018 -0.004
[0.026] [0.028]Number of children -0.006 -0.006 -0.01 -0.003
[0.012] [0.012] [0.021] [0.016]Has children under 12 -0.019 -0.004 0.014 -0.032
[0.031] [0.035] [0.053] [0.044]Log income -0.008 0.021 -0.001
[0.016] [0.023] [0.024]Has any savings 0.024 -0.05 0.039
[0.029] [0.042] [0.040]Smokes -0.037 0.081 -0.058
[0.036] [0.078] [0.039]Any chronic disease -0.033
[0.029]Ever sick -0.001
[0.040]Log costs of healthcare 0.000*
[0.000]Number of visits to provider 0.001
[0.002]Any visit to provider 0.042
[0.040]Observations 530 472 185 269R-squared 0.07 0.1 0.14 0.05
* significant at 10%; ** significant at 5%; *** significant at 1%
All
Table 6: Determinants of Insurance Retention
Note: This table presented the determinants of retention among those who enrolled in the health insurance. Columns 3 and 4 consist of only those who received a six month subsidy.

2007 JanuaryGovernment Provision of Health Insurance to Informal Sector Workers
March/April Round One Baseline SurveysJune/July Round Two Baseline SurveysJuly Indepth InterviewsAugust - December Collection of Insurance Affiliation DataSeptember Indepth InterviewsOctober No renewal of MFI/INSS Contract
2008 April - June Follow-up SurveysSeptember/October Focus Group Discussions
Appendix A: Timeline

Panel A: Completion rates of baseline survey Number PercentRound 1 Away 139 7%
Refused 114 6%Not Eligible 123 7%Other 86 5%Completed 482 51%Total 944
Round 2 Away 1073 24%Refused 310 7%Not Eligible 707 16%Other 54 1%Completed 2386 53%Total 4530
Panel B: Completion rates of the follow-up survey Number PercentMoved/Temporarily away 26 1%Hospitalized 8 0.3%Deceased, Refused, Other 163 6%Completed 2608 93%Total Approached 2805
Appendix B: Sample and Random Assignment
Notes: Panel A includes all of those who were in Oriental Market, Huembes, and Ivan Montenegro who were eligible for the follow-up survey. Out of the 2868 who were interviewed at baseline, 2805 were approached at the follow-up.