socialist people’s libyan arab jamahiriya a public ... · socialist people’s libyan arab...
TRANSCRIPT

Report No. : 45019-LY
Socialist People’s Libyan Arab Jamahiriya A Public Expenditure Review
(In Three Volumes) Volume II: Main Report September 30, 2009 Social and Economic Development Group Middle East and North Africa Region
Document of the World Bank
Pub
lic D
iscl
osur
e A
utho
rized
Pub
lic D
iscl
osur
e A
utho
rized
Pub
lic D
iscl
osur
e A
utho
rized
Pub
lic D
iscl
osur
e A
utho
rized
CURRENCY EQUIVALENTS(As of September 30, 2009)
Local Currency Unit = Libyan Dinar Exchange Rate (1.27 LD per USD)
FISCAL YEAR 2009July 1-June 30
WEIGHT AND MEASURES
Metric System
ACRONYMS AND ABBREVIATIONS
ABC Activity based costing AMR Automatic Meter Reading BCM Billion cubic meters BPC Basic Public Congresses Bpd Barrels per day CAPEX Capital expenditures CBL Central Bank of Libya CCGT Combined Cycle Gas Turbine CERA Cambridge Energy Research Associates CFL Compact fluorescent lamp CMM Collection management and metering CPI Consumer price index DBO Design-build-operate DPAT Territorial divisions in charge of
planned investments DSM Demand-side management ECA Energy conservation agreements EPA Effective project approval FAO UN Food and Agriculture
Organization GBHCP General Body for Health Care Planning GCHU General Corporation for Housing
and Utilities GCP General Counsel for Planning GDP Gross domestic product GEA General Environment Authority GECOL General Electricity Company of Libya GER Gross enrollment rate / gross
enrollment ratio GFS Government Financial Statistics GMMR Great Man Made River GMMRA Great Man Made River Authority GNI Gross national income GoL Government of Libya GPCA General People Committee of
Agriculture GPC General People’s Committee GPCEWG General People Committee for
Electricity, Water, and Gas GPCGE General Peoples’ Committee for General
Education GPCF General People’s Committee for Finance
GPCHE General People’s Committee for Health and Environment
GPCHE General Peoples’ Committee for Higher Education
GPCMP General People’s Council for Manpower GPCP General Peoples’ Committee for Planning GPCPF General Peoples’ Committee for
Planning and Finance GPCT General People’s Committee for
Transport (Ministry of Transport) GSC General service company GWA General Water Authority GWh Gigawatt Hour HALE Healthy life expectancy HC Hydrocarbon HDI Human development index HFO Heavy Fuel Oil HIB Housing and Infrastructure Board HUC Housing and Utility Corporation HIV Human immunodeficiency virus HUGC Housing and Utilities General Corporation IBT Increasing block tariff IEA International Association for the
Evaluation of Educational Achievement IMF International Monetary Fund IMR Infant mortality rate IPP Independent power projects IT Information technology Km Kilometer Km2 Square kilometer KV Kilovolt kWh Kilowatt-hour l/c/d Liters consumed daily LD Libyan dinar LFO Light Fuel Oil L/km Liters per kilometer LRAIC Long run average incremental cost LRMC Long-run marginal cost M2 Square meters Mbpd Million barrels per day MCM Million cubic meters MENA Middle East and North Africa
MIC Middle-income country MLD Millions of Libyan Dinars MMBTU Million British Thermal Units MTEF Medium-term expenditure framework MW Megawatts MWEG Ministry of Electricity, Water and Gas NCP National Counsel for Planning NCEP National Centre for Education Planning NDPs National Development Plans NHGDP Non-hydrocarbon gross domestic
product NHPB Non-hydrocarbon primary fiscal balance NOC National Oil Company NPC National Planning Council NPV Net present value NWC National Water Company NWWC National Water and Wastewater
Company OECD Organization for Economic Co-
operation and Development O&M Operations and maintenance OPEX Operational expenditures ORF Oil Reserve Fund Pb Per barrel PBC Performance based contracting PCSC Programme Complémentaire de
Soutien à la Croissance PER Public expenditure review PHC Primary health care PIMS Public investment management system PIP Public investment plan PISA Program for International
Management in Higher Education PMO General Peoples Committee or
Prime Minister’s Office PPA Power purchase agreements PPA Preliminary project approval
PPPs Public-private partnerships PSP Private sector participation RBA Roads and Bridge Authority RR Required revenue RUC Road user charges SDR Special Drawing Rights SEC Secondary Education Certificate Shaabiats Municipalities SMEs Small and medium enterprises SRMCs Short-run marginal costs TCF Trillion cubic feet TDS Total dissolved solids TIMSS Trends in International Mathematics
and Science Study TOU Time-of-Use (tariff) TVET Technical and vocational education
and training U5MR Under-5 mortality rate UfW Unaccounted for water UN United Nations UNAIDS United Nations Joint Programme on
HIV/AIDS UNDP United Nations Development Programme UNESCO United Nations Educational,
Scientific and Cultural Organization UNICEF United Nations Children’s Fund Vpd Vehicles per day WDI World Development Indicators WEG Water, electricity, and gas WHO World Health Organization WHOSIS World Health Organization
Statistical Information System WSS Water supply and sanitation WSSP Water Study and Strategy Proposal–2025 WTO World Trade Organization WWW Water and waste water
Vice President: Shamshad Akhtar Country Director: Mats Karlsson Sector Director: Ritva S. Reinikka Sector Manager: Farrukh Iqbal Lead Economist and Task Team Leader: José R. López-Cálix


SOCIALIST PEOPLE’S LIBYAN ARAB JAMAHIRIYA PUBLIC EXPENDITURE REVIEW
Table of Contents
CHAPTER 1. INTRODUCTION ................................................................................................... 1 I. The Recent Economic Cycles of Libya...................................................................................1 II. The Country’s Social Achievements ......................................................................................4 III. Why a Public Expenditure Review?.......................................................................................4 IV. The Unique Institutional Features Surrounding the Accountability of Public Investment
Management in Libya..............................................................................................................5 V. The Scope and Content of the Public Expenditure Review .................................................8 VI. The Recent Performance of Public Investment.....................................................................9
CHAPTER 2. OVERALL FISCAL DEVELOPMENTS AND SUSTAINABILITY............................... 18 I. Macroeconomic Background................................................................................................18 II. Fiscal Trends From 1990 Through 2007..............................................................................20 III. Fiscal Sustainability Analysis ...............................................................................................21 IV. Dealing with Methodological Limitations............................................................................28 V. Policy Recommendations ......................................................................................................29
CHAPTER 3: THE CONTRIBUTION OF CIVIL SERVICE REFORM TO FISCAL SUSTAINABILITY31 I. Introduction............................................................................................................................31 II. The Size the Libyan Public Administration and its Macroeconomic Implications ........32 III. Compensation Policies and their Implications for the Wage Bill......................................35 IV. The Civil Service Reform (2006-present) ............................................................................36 V. Pay Reform.............................................................................................................................41 VI. Handling of the Retrenched Employees...............................................................................44 VII. Policy Recommendations ......................................................................................................46
CHAPTER 4: MODERNIZING THE PUBLIC INVESTMENT MANAGEMENT SYSTEM IN LIBYA 49 I. Public Investment Trends .....................................................................................................49 II. The Link between Public Investment and Growth.............................................................53 III. Assessing the Budget Cycle of Public Investment...............................................................54 IV. Policy Recommendations ......................................................................................................63 V. The Challenge of Budget Unification...................................................................................70
CHAPTER 5: BALANCING EFFICIENCY AND QUALITY OF EDUCATION IN LIBYA ................. 74 I. Introduction............................................................................................................................74 II. The Performance of the Education Sector ..........................................................................75 III. The Institutional Framework and its Accountability .........................................................80 IV. Overall Public Expenditure Patterns...................................................................................81 V. Searching for Quality: The Efficiency of the Education Sector ........................................87 VI. Policy Recommendations ......................................................................................................95
CHAPTER 6: IMPROVING HEALTH SERVICES FOR ALL IN LIBYA....................................... 102 I. Introduction..........................................................................................................................102 II. The Performance of the Health Sector ..............................................................................103 III. The Institutional Framework and its Accountability .......................................................106

IV. Overall Public Expenditure Patterns.................................................................................111 V. Searching for Quality: The Efficiency of the Health Sector ............................................117 VI. Policy Recommendations ....................................................................................................118
CHAPTER 7. INCREASING THE EFFICIENCY OF THE POWER SECTOR IN LIBYA ................. 123 I. Introduction..........................................................................................................................123 II. The Performance of the Power Sector ...............................................................................127 III. The Institutional Framework and Its Accountability.......................................................131 IV. Overall Public Expenditure Patterns.................................................................................136 VI. Searching for Quality: The Efficiency of the Power Sector.............................................142 VII. Policy Recommendations ....................................................................................................146
CHAPTER 8. REBALANCING ROAD MAINTENANCE AND NETWORK DEVELOPMENT........ 155 I. Introduction..........................................................................................................................155 II. The Performance of the Road Sector.................................................................................156 III. The Institutional Framework and Its Accountability.......................................................158 IV. Overall Public Expenditure Patterns.................................................................................163 V. Searching for Quality: The Efficiency of the Roads Sector .............................................168 VI. Policy Recommendations ....................................................................................................170
CHAPTER 9: MAKING WATER USE EFFICIENT AND SUSTAINABLE ................................... 173 I. Introduction..........................................................................................................................173 II. The Performance of the Water Sector ...............................................................................173 III. The Institutional Framework and its Accountability .......................................................180 IV. Overall Public Expenditure Patterns.................................................................................182 V. Searching for Quality: The Efficiency of the Water Sector.............................................187 VI. Policy Recommendations ....................................................................................................191
CHAPTER 10. SETTING PRIORITIES IN THE 2008–12 PUBLIC INVESTMENT PLAN: THE SHIFT
OF PUBLIC INVESTMENT TOWARD PRODUCTIVE ACTIVITIES........................ 195 I. Introduction..........................................................................................................................195 II. The Status of the Pipeline of Public Projects at the End of 2007 ....................................197 III. The Move toward Productive Activities: Key Features of the 2008–12 PIP ..................198 IV. Main Factors Strengthening the Technical Efficiency of Public Investments ...............203 V. Guidelines for the Intrasectoral Selection of Public Projects ..........................................206 VI. Guidelines for Intersectoral Prioritization of Public Projects .........................................217
REFERENCES......................................................................................................................... 223

1
Chapter 1. Introduction
I. The Recent Economic Cycles of Libya 1.1 In a historic context, the present macroeconomic stance of the Socialist People’s Libyan Arab Jamahiriya is solid and remarkable. The recent economic cycles have mainly been determined by fluctuations in oil prices and, somehow, by political events.1 Since 1990, three major periods can be distinguished: 1990–98, 1999–2005, and 2005 onward (Figure 1.1). • During the 1990–98 stagflation period, low and steady oil prices averaged below US$20/barrel and
had a significant impact on the economy. The country suffered the initial impact of the embargo and faced two severe recessions, one in 1990 and another in 1995, when the rate of economic growth reached -20.2 percent and -12.5 percent (-18.6 percent for non-hydrocarbon GDP), respectively. Inflation was high—in the double digits—and was clearly affected by persistent fiscal imbalances, especially during 1992–94. Inflation only decreased by the end of this period, once fiscal balances turned into a surplus. After 1995, both the fiscal balance and capital expenditure trends were closely correlated with the price of oil, which is typical for an oil-dependent economy.
• During the 1999–2005 decentralization period, the economy recovered and started to accelerate. This was boosted by the end of the embargo in 2003, and by the initial stage of the oil windfall: oil prices hit US$25/barrel in 2003. The year of the end of the embargo, economic growth reached double digits, mostly reflecting a catch-up effect. Inflation rates were negative, on average, which is consistent with successive fiscal surpluses (except for 2001) in close correlation with oil price fluctuations. The unification of the Libyan dinar (between February 1999 and January 2002) also contributed to the deflation process (especially through the ensuing reduction in exchange rate spreads). In parallel, a short-lived period of political decentralization took place, which led to an increased investment by the Shaabiats: capital expenditure ratios to GDP reached successive double digits since 2002, with a parenthesis in 2003, thus becoming markedly procyclical and, indirectly, a key determinant of growth.
• During the 2006–08 recentralization period, the economy was clearly favored by the deepening of the oil windfall. Strong economic performance accompanied the process of political recentralization. High and successive GDP growth rates reached 6 to 7 percent. Non-hydrocarbon GDP rates (for simplicity referred as “non-oil” GDP rates) also increased, but remained below the rates obtained by overall GDP. Significant fiscal surpluses (above 25 percent of GDP) were obtained despite an always expansive public investment reaching average rates above 16 percent of GDP. A booming investment, however, may have had a price: high inflation. Indeed, despite inflation rates were mainly determined by import prices, an accelerated pace in the implementation of the PIP and its associated rising prices in non-tradables (mostly services) should have also put some degree of pressure on inflation, which reached double digits by early-2008.2
1 It can be argued that the relationship between political events and GDP could be spurious (i.e. superficially like, but genuinely unlike)., but to prove it in econometric
terms would be challenging as, contrary to oil prices, it is very hard to find a single quantitative proxy for political events. In any case, the significant potencial role of the political
cycle and its impact on public expenditure (and growth) patterns are well supported by the economic literature (see Alesina, Roubini and Cohen, 1997). 2 A macroeconomic model developed by the Authorities indicates that high public investment had no perceived effect (especially through services) on prices, at least
until 2007 (see Merza 2008).

2

3
Figure 1.1. Libya: Oil Price, Growth, Public Investment, and the Fiscal Balance
-20
-10
0
10
20
30
40
Pe
rce
nt
/ P
erc
en
t o
f G
DP
0
20
40
60
80
100
120
US
$/b
arr
el, L
ibya
Oil P
rice
GDPGrowth, LHS -20.2 14.5 -3.6 -3.5 2.9 -12.7 3.1 -2.4 0.0 0.4 3.7 5.8 -0.4 12.9 6.0 9.9 5.9 6.8 7.1
Non-oil GDPGrowth 21.7 -6.1 -7.4 4.2 -18.6 0.5 -4.2 -1.2 -1.0 4.5 3.3 -6.8 20.0 5.5 7.2 4.3 3.9 3.8
Inflation, End of Period 10.8 11.7 9.5 7.5 10.7 8.3 0.9 3.3 3.8 1.7 -6.6 -10.3 -7.3 -1.3 -3.5 3.0 7.2 8.1 8.0
Fiscal Balance 1.3 8.4 -0.1 -6.0 -2.8 3.9 11.7 -2.2 -2.4 5.9 13.5 -0.7 10.0 9.5 13.9 30.9 35.5 26.2 35.0
Capital Expenditure 6.6 5.3 6.4 8.8 7.3 6.3 8.0 7.8 5.6 5.8 9.2 8.8 12.0 8.3 16.2 18.2 16.2 21.0 18.0
LibyaOil Price, RHS 22.0 18.5 18.2 16.1 15.3 16.5 19.5 18.4 12.5 17.2 27.0 23.3 24.4 28.2 36.9 51.9 62.5 69.1 108.9
90 91 92 93 94 95 96 97 98 99 00 01 02 03 04 05 06 07 p/ 08e/
Embargo Ends
Decentralization Period
Oil Price Hike
Oil PriceSlumps
Deep Recessions
Source: IMF and Bank Staff’s Estimates. LHS =Left Hand Side; RHS = Right Hand Side
4
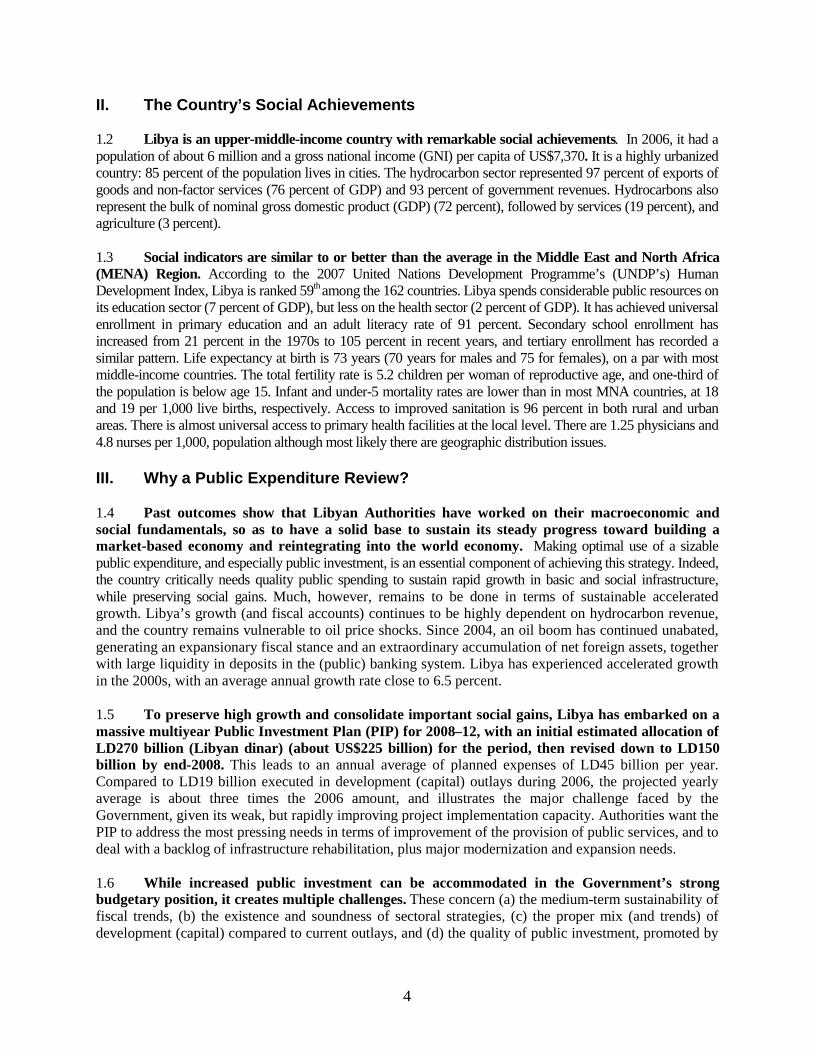
II. The Country’s Social Achievements 1.2 Libya is an upper-middle-income country with remarkable social achievements. In 2006, it had a population of about 6 million and a gross national income (GNI) per capita of US$7,370. It is a highly urbanized country: 85 percent of the population lives in cities. The hydrocarbon sector represented 97 percent of exports of goods and non-factor services (76 percent of GDP) and 93 percent of government revenues. Hydrocarbons also represent the bulk of nominal gross domestic product (GDP) (72 percent), followed by services (19 percent), and agriculture (3 percent). 1.3 Social indicators are similar to or better than the average in the Middle East and North Africa (MENA) Region. According to the 2007 United Nations Development Programme’s (UNDP’s) Human Development Index, Libya is ranked 59th among the 162 countries. Libya spends considerable public resources on its education sector (7 percent of GDP), but less on the health sector (2 percent of GDP). It has achieved universal enrollment in primary education and an adult literacy rate of 91 percent. Secondary school enrollment has increased from 21 percent in the 1970s to 105 percent in recent years, and tertiary enrollment has recorded a similar pattern. Life expectancy at birth is 73 years (70 years for males and 75 for females), on a par with most middle-income countries. The total fertility rate is 5.2 children per woman of reproductive age, and one-third of the population is below age 15. Infant and under-5 mortality rates are lower than in most MNA countries, at 18 and 19 per 1,000 live births, respectively. Access to improved sanitation is 96 percent in both rural and urban areas. There is almost universal access to primary health facilities at the local level. There are 1.25 physicians and 4.8 nurses per 1,000, population although most likely there are geographic distribution issues. III. Why a Public Expenditure Review? 1.4 Past outcomes show that Libyan Authorities have worked on their macroeconomic and social fundamentals, so as to have a solid base to sustain its steady progress toward building a market-based economy and reintegrating into the world economy. Making optimal use of a sizable public expenditure, and especially public investment, is an essential component of achieving this strategy. Indeed, the country critically needs quality public spending to sustain rapid growth in basic and social infrastructure, while preserving social gains. Much, however, remains to be done in terms of sustainable accelerated growth. Libya’s growth (and fiscal accounts) continues to be highly dependent on hydrocarbon revenue, and the country remains vulnerable to oil price shocks. Since 2004, an oil boom has continued unabated, generating an expansionary fiscal stance and an extraordinary accumulation of net foreign assets, together with large liquidity in deposits in the (public) banking system. Libya has experienced accelerated growth in the 2000s, with an average annual growth rate close to 6.5 percent. 1.5 To preserve high growth and consolidate important social gains, Libya has embarked on a massive multiyear Public Investment Plan (PIP) for 2008–12, with an initial estimated allocation of LD270 billion (Libyan dinar) (about US$225 billion) for the period, then revised down to LD150 billion by end-2008. This leads to an annual average of planned expenses of LD45 billion per year. Compared to LD19 billion executed in development (capital) outlays during 2006, the projected yearly average is about three times the 2006 amount, and illustrates the major challenge faced by the Government, given its weak, but rapidly improving project implementation capacity. Authorities want the PIP to address the most pressing needs in terms of improvement of the provision of public services, and to deal with a backlog of infrastructure rehabilitation, plus major modernization and expansion needs. 1.6 While increased public investment can be accommodated in the Government’s strong budgetary position, it creates multiple challenges. These concern (a) the medium-term sustainability of fiscal trends, (b) the existence and soundness of sectoral strategies, (c) the proper mix (and trends) of development (capital) compared to current outlays, and (d) the quality of public investment, promoted by

5
the use of standards on project management—design, execution, monitoring and evaluation. An adequate response to those challenges is needed to ensure that the PIP 2008-12 investments are supporting faster growth and development, instead of greater opportunities for waste and corruption. 1.7 The PIP 2008-12 also raises important issues concerning the accountability of institutions in the unique context of Libya. The performance of the public investment system is continuously affected by the changing and perceived overlapping of responsibilities among different governmental agencies, the low level of coordination inside the government, the limited capacity of civil servants to control and execute public spending, and the adverse environment to stimulate private participation in the financing and execution of public investment. The rest of this chapter introduces key details about the unique institutional features of the Libyan state, the stylized facts about the most recent execution of the development budget in 2007, and the scope and content of the public expenditure review (PER). These details will familiarize the reader with the main topics of this report. IV. The Unique Institutional Features Surrounding the Accountability of Public Investment Management in Libya 1.8 To realistically assess the accountability of Libyan public investment management, it is necessary to understand its unique institutional characteristics. Libya does not follow international standards on public expenditure management (see IMF 2006) and, as this report shows, the same conclusion applies to public investment, despite very important progress achieved since 2006. Hence, the major challenge that this report addresses is how to gradually introduce those budgeting standards in Libya, given its unique institutional environment. The task requires taking into consideration key features of its political economy. There are at least six institutional factors that frame the accountability of public investment management.
1.9 First, Libya’s institutional policymaking reflects the principle that citizens should participate in government, from the grass roots to the highest levels. After the 1969 revolution, the country embarked on a number of attempts to develop a unique concept of local governance. Several stages have followed. Initially, after the revolution, the country was divided into 10 governorates, which were subdivided into provinces and departments. Then, governorates were abolished in 1975 and replaced by 26 municipalities, branches, and localities, and 340 popular conferences. This was not long-lived. In 1977, the “declaration of people’s power” established local authorities as the basis for the political system. The authority was delegated to the General and Local People’s Conferences, and General and Local People’s Committees in the localities. Consequently, the 26 municipalities were abolished in 1998 and replaced by 31 Shaabiats administrative regions (the singular is Shaabia) and 415 popular conferences. The number of Shaabiats was subsequently reduced to 22. In an important precedent for current events, transition toward full decentralization led to the demise of most ministries, including Communication and Transport, Energy, Agriculture, Health and Social Security, Housing and Utilities, and Education). Barely five ministries with national responsibilities survived, including External Relations and Cooperation, Justice and General Security, Finance and Trade, Tourism, and a lately introduced social sectors “directorate.”
1.10 Second, since 2006, there has been an ongoing recentralization of the state. Libya is now in a process of political (and fiscal) recentralization. This process reverts the aborted experience of delegation of expenditure responsibility (decentralization) to the Shaabiats carried on during 1999–2005. This is a major institutional change. During decentralization, most of the functional and operational development budget decisions were transferred from a streamlined Central Government to the Shaabiats. There are few written assessments of the decentralization period, but broad and deep consensus prevails among officials

6
that decentralization severely damaged the economy and, more important, weakened the country’s governance.3 During 1999–2005, fiscal management failures were multiple: (a) the number of public servants more than doubled from half a million to over a million, and growth took place especially at the local level, leading to numerous “ghost”(absent from duty) workers; (b) the number of projects exploded at the local level, leading development (capital) expenditure to increase from 5.8 percent of GDP to 18.2 percent of GDP; (c) data collection on budget execution by the Shaabiats was completely abandoned, leading to a complete lack of monitoring, transparency, and accountability mechanisms, and a severe deterioration of key national accounts; and (d) in part as a popular response to perceived budgetary disarray, tax revenue dramatically shrank from 15.1 percent of GDP to 2.6 percent of GDP. According to officials, a weakened Central Government coupled with unaccountable decentralized institutions led perceived corruption to spread. A high authority interviewed was perhaps not exaggerating when he affirmed that “badly implemented decentralization was demolishing the country.” 1.11 Third, put it in perspective, institutional reorganization has become an endless and erratic process. The current period of recentralization is part of a sequence of continuous reorganization of the state that has characterized Libya over more than three decades. Ensuing changes have left a fragile and fragmented institutional environment, leading to blurring roles and unstable governance. This phenomenon has particularly hit all ministries associated to the sectors assessed under this Public Expenditure Review. All of them disappeared during the early years of decentralization, only to be recently re-created: Planning in 2003; Higher Education in 2004; General Education, Agriculture, Water, Gas and Transportation in 2006; and Electricity (power) in 2007.4 As a result, there is confusion of institutional roles at the central level, the policy development functions of central institutions are not clear, and some institutional bodies have legislative (through ad hoc decrees) and executive powers (Smith 2006). Consequently, since 2006, despite efforts to redefine the role of ministries in more detail, many institutional overlaps prevail at the central level. A well-known example is the multiple number of institutions in charge of water policy, but this case is far from being unique. 1.12 Fourth, until very recently, the public investment system has worked with a myopic approach relying on poor information. Continuous institutional reorganization, with its ensuing gap in the collection of reliable data, has made it very difficult for Libyan policymakers to make well-informed strategic decisions. Until 2008, on budgetary issues, officials from the Ministries of Planning, Finance, and other sectors had prepared their development budgets in a context of severe information and analytical gaps, featuring a generalized shortage of reliable hard data and time series, scarce institutional memory, and inexperienced and only recently hired staff. Until then, the predominant focus was on day-to-day decisions in a “myopic approach” to policymaking. Most recent quick progress in strengthening the institutional framework, in improving the reliability and timeliness of information and in enforcing budget norms have led all ministries and public entities to approach the less steep side of the learning curve, followed by gradually major improvements in budget execution (see below). Planning and finance officials have become familiar with their counterparts in sectoral ministries, who are gotten used to new budgeting procedures, thus contributing to raise staff productivity. 1.13 Fifth, the current public expenditure institutional framework is also unsatisfactory in a number of procedural aspects. A detailed analysis of the public investment management system is presented in chapter 3. Just to mention a few ones worth mentioning: (a) dual budgeting and its ensuing lack of a clear relationship with the budget process for current expenditure; (b) partial, but promising medium-term expenditure programming; (c) the absence of a performance-based approach to budgeting;
3 The UNDP (2002) and Smith (2006) are the only mid-course existing reports, but they do not provide an assessment. 4 The functions of some ministries were preserved under another institution or under the protection of a higher authority, i.e. the planning function was preserved under the
Planning Council.

7
(d) multiple weaknesses in the procedures for reporting on the budget; (e) and limited budget preparation and execution skills at the sectoral and Shaabia levels of government. 1.14 Sixth, the nascent respect for public investment procedures is working to remedy the previously generalized lack of transparency and accountability. As an example, until very recently there was a generalized lack of feasibility studies in public projects. This was inherited from the 1999-2005 decentralization period. With few exceptions, no single project (of which there are more than 23,000) implemented by Shaabiats during such period, or by the Central Government, was supported by a feasibility study. Indeed, the practice of having projects approved with barely the submission of a simple “sheet of paper” describing generalities of the project, was widespread. Only since late 2006, has the re-created Ministry of Planning introduced highly valuable initial forms with which to prepare project requests. Similarly, the use of modern information technology (IT) in an integrated financial management system was introduced in 2007. Basic reporting on project execution was reestablished in 2007, but compliance is partial and considerable room for improvement exists. In a context of multiple bank accounts (up to 4,000 according to IMF 2006) and predominantly paper-based transactions, reporting on expenditure execution can only be inaccurate and delivered with delays. Thus, the ensuing gaps of transparency and accountability in budget execution remain important. In addition, the reestablishment of the General Peoples’ Committee for Planning (GPCP) as central player in public investment has left the role of local planning councils unclear (Smith 2006). 1.15 On another example of such unpredictable institutional changes, on March 2, 2008, Colonel Muammar Gaddafi announced another sweeping major government reform. Gaddafi charged that the Cabinet has failed to manage the hydrocarbon windfall well and that major public works projects have been falling seriously behind schedule. Consequently, he indicated that all ministers will be phased out at the end of 2008, as part of a major reform of the state; in the meantime, however, the announcement was accompanied by an important Cabinet reshuffle.5 Full details of the government reform have not been completed yet, as in March 2009, a Congress of the Libyan General People’s Committees postponed the reform to a later date. But according to initial media leaks, only five ministries—Defense, Security, External Affairs, Finance, and Planning—would have continued after the transition period. Other “surviving ministries” would have been downgraded under the global direction of a prime minister, who would be held accountable to local congresses and national commissions. Five commissions are currently at work—(a) budget (finance and planning), (b) governance (new institutional organization of the government), (c) wealth distribution (in charge of the oil fund management and increased cash transfer programs), (d) economic laws (design of a new private sector environment, including increased privatization), and (e) legal environment (judicial reform and other laws). In the March 2009 Congress, however, an important change took place: the ministries of Finance and Planning were merged, a recommendation of this report that is examined in full detail below (see Chapter 4). 1.16 In parallel, Gaddafi also announced a Wealth Redistribution Program. This initiative would disburse cash transfers to half a million households. Whereas the initially announced amount was LD25 billion to LD30 billion (US$20 billion to US$25 billion), enabling every Libyan family to receive, on average, a significant sum (initially US$4,000 per month per family), the overall sum was subsequently decreased. However, the 2008 budget approved only LD4.6 billion (US$3.6 billion). Last March 2009, clear key details of the program were also suspended until further notice and contingent on the eventual fiscal space that eventually higher future oil prices than current ones might open.
5 Baghdadi Mahmudi was newly appointed prime minister. He was a deputy prime minister in the previous Cabinet. Mohammed Ali al-Huwaiz, the former finance minister and
the new deputy prime minister, adds further reformist credentials to the new cabinet. Ahmed Munaisi Abdel-Hamid, the former governor of the Central Bank of Libya, replaced al-
Huwaiz as the new finance minister. The economy and trade portfolio was taken over by Tayeb Safi Tayeb. The reshuffling also transformed the energy ministry into a new
Ministry for Industry, Electricity, and Mineral Resources. The planning minister was also replaced.

8
1.17 In the meantime, the economic diversification reform program continues, though with renewed priorities. For instance, the prime minister has emphasized banking sector reform, including opening of the sector to private and foreign banks, and access to the World Trade Organization (WTO). The Government has also reaffirmed its intention to continue its efforts to make Libya more attractive to foreign direct investment. Gaddafi has also highlighted the government’s intention to focus on the needs of low-income populations, while improving long overdue infrastructure gaps. All these processes, however, are still likely to move at a gradual pace, given a cumbersome bureaucracy and rather “rocky” decision making accompanying the ongoing state restructuring. 1.18 In any case, the PIP 2008–12 offers Libya a golden opportunity to support sustained expansion of economic growth, boost employment, and foster social development, while managing its abundant oil resources well. Sound financial management of its public investment is essential. It requires the gradual introduction of standards in public investment management. These standards would be highly valuable tools to the success of the 2008–12 PIP.
V. The Scope and Content of the Public Expenditure Review 1.19 In a bid to strengthen its technical capacity to manage the public investment program, the Government of Libya has requested the assistance of the World Bank in carrying out a Public Expenditure Review (PER). The present PER—the first ever produced in Libya—is an external review of the country’s fiscal policies and expenditure programs. 1.20 The PER focuses on the assessment of public investment management. Public expenditure management in oil-producing economies consists of three pillars (Figure 1.8). A first pillar deals with the collection and saving of oil revenues. This pillar leads to one stream of a large literature exploring both fiscal sustainability, and the pros and cons of an alternative model of oil stabilization funds. A second pillar deals with the management of oil resources through development(also called capital or investment) expenditures—and their link to current expenditure. This pillar leads to a second stream of a large literature assessing public investment budgeting and standards, and the multiple effects of sizable public investment programs—financed by the oil windfall. The third pillar deals with the management of oil resources to finance social programs—basically through current transfer expenditures. This is the case of programs like the one on Wealth Redistribution recently proposed by Colonel Gaddafi. Hence, per the Authorities’ request, this PER mainly deals with the second pillar, even though a few sections deal indirectly with topics referred to in the other pillars. 1.21 More in detail, the PER underscores the importance of modernizing the public investment system, thus improving the efficiency of public expenditure and obtaining value for money for the Libyan people. It provides a unique opportunity to propose a new framework for planning and efficiently executing public investment projects under the PIP 2008-12. In the context of a sound macroeconomic and budgetary environment, a sustainable and more effective and efficient public expenditure is the sine qua non condition to improved provision of public services to the population and increased private sector participation. The three PER goals are to (i) support the preparation of key components of a medium-term
W R
S E M
D E M
G F
M
O R O R
Figure 1.2. The Three Pillars of Fiscal Management in an Oi l-dependent Economy

9
expenditure framework, drawing lessons from past budgetary management performance in order to avoid implementation problems during 2008–12 and from fiscal sustainability analysis; (ii) deepen the Government’s strategic approach in the adoption of specific sectoral investment decisions; and (iii) introduce high technical standards in public investment management, while improving the effectiveness of investments in the five important sectors selected. In parallel, the PER provides guidance to country officials in conducting preparation and self-evaluation of public expenditures, and in identifying needs for possible technical assistance in selected areas. 1.22 The PER consists of three volumes. Volume I was the synthesis. This Volume II is the main text and is divided into two parts. The first part presents a detailed description of fiscal trends and a fiscal sustainable analysis of public expenditure in the medium term, a review of the civil service reform and a comprehensive diagnostic of the public investment management system. The second part presents comprehensive sectoral analyses. Per the Authorities’ request, the PER adopts a very selective approach, and is focused on five sectors: Education, Health, Power (Electricity), Roads, and Water. All sectoral chapters review the sector’s performance, the institutional framework—including the existence or no of sectoral strategies and their internal consistency—the sector expenditure trends, and, the quality of sectoral public expenditure (investment). Each chapter also provides a matrix of detailed recommendations for line ministries and budget officials. Given severe data shortcomings in terms of quality and availability, the period of analysis mainly refers to the most recent years. Finally, chapter 10 examines in detail the content of the 2008-12 PIP, and the intra- and inter-sectoral criteria trade-offs that should guide project selection in the future. For its part, Volume III includes several annexes on special technical topics, an extensive Statistical Appendix—probably the first of its kind for Libya—and a list of references used in the study—both foreign and Libyan. The Statistical Appendix and Libyan references are evidence of the openness and transparency with which Libyan Authorities have collaborated during the preparation of this report. Having said this, and considering that concrete details of the revised composition and amounts of the multiyear program are now available,6 it is useful to have a first look at the recent performance of the development budget, as it is done in the next section. VI. The Recent Performance of Public Investment
1.23 The size and performance of public investment in Libya have been steadily improving during recent years. Perhaps the best way to familiarize the reader with the main focus of this report—public expenditure with a focus on the development budget—is to examine the most recent stylized facts of the development (capital) budget execution in 2007. Indeed, whereas chapter 2 explores the overall fiscal patterns in detail, this section deals directly with the most salient features of public investment until end-2007. This is made possible by the recent completion and release of an official report on the execution of the 2007 development budget, last November 2008. 1.24 Libya’s recent efforts in devoting sizable resources to fill the infrastructure gap inherited from the embargo have been remarkable and unprecedented.7 The development budget is booming. Supported by the oil windfall, the Central Government invested more than LD41 billion (US$32 billion) over the 2003-07 period (of which
6 Authorities approved an initial 2008-12 PIP in October 2007, and then completed a full and definite draft last November 2008, during the preparation of the 2009 budget, which
is assessed below (see Chapter 10). 7 Unless indicated otherwise, this section is based upon GPCP (2007).
Figure 1.3: Capital Expenditure
(In US$ per inhabitant)
0
500
1.000
1.500
2.000
2.500
1999 2001 2003 2005 2007
Trend line
Source: The General People’s Committee for Planning.

10
4/5th over the last three years). On a per capita basis, capital expenditure increased US$1,859 per Libyan between 2003 and 2007, thus multiplying 6 times during such period. Indeed, capital expenditures rose sharply to US$2,209 in 2007, from US$350 in 2003 (and US$329 in 1999) (Figure 1.3).8 Thus, a massive amount of resources became available for investing in projects (so-called contracts in Libya—see below chapter 4), leading to an expansive fiscal stance. 1.25 However, not all sectors benefitted from increased budget allocations equally. Overall, the big winners of such an increase were housing and urban development, as well as basic infrastructure, which together represented about half of total investment for 2007 (30 percent and 20 percent respectively) (Table 1.1); whereas social spending represented 10 percent. On per capita terms, and during 2003-07, social spending also resulted in an increase of only US$132 per inhabitant, whereas capital expenditure in basic infrastructure and in housing and urban development projects increased US$316 and US$638 per inhabitant respectively.
Table 1.1: Actual Capital Expenditure, 1999 and 2003-2007
1999 2003 2004 2005 2006 2007 (In million of LD, unless otherwise indicated)
Total 794 2,530 3,581 9,597 8,924 16,939 Social spending 1/ 191 633 809 1,017 1,018 1,689 Of which: Education 2/ 121 307 560 838 742 1,229
Health 69 326 249 179 274 454 Basic infrastructure (w/o Housing) 187 … 729 2,965 1,524 3,172 Of which: Power 93 … 541 1,496 1,000 1,874
Communications and Transport 94 98 188 469 524 1,298 Housing and urban development 130 195 340 343 2,733 5,103 Others 3/ 286 1,604 1,702 6,272 3,648 6,975 Population (Million of inhabitants) 5,203 5,629 5,740 5,854 5,970 6,089 Average exchange rate (LD/USD) 0.464 1.284 1.305 1.308 1.314 1.259
(In million of US$) Total 1,712 1,971 2,744 7,335 6,791 13,451 Social expenditure 1/ 2/ 411 493 620 777 773 1,341 Of which: Education 1/ 262 239 429 640 565 975
Health 149 254 191 137 208 361 Basic infrastructure (w/o Housing) 403 … 559 1,501 1,160 2,519 Of which: Power 200 … 415 1,143 761 1,488
Communications and Transport 203 76 144 358 399 1,031 Housing and urban development 281 152 260 262 2,081 4,052 Others 3/ 617 1,249 1,304 4,794 2,777 5,539
(In US$ per inhabitant) Total 329 350 478 1,253 1,138 2,209 Social spending 1/ 2/ 79 88 108 133 130 220 Of which: Education 1/ 50 43 75 109 95 160
Health 29 45 33 23 35 59 Basic infrastructure (w/o Housing) 77 … 97 256 195 413 Of which: Power 38 … 72 195 128 244
Communications and Transport 39 13 25 61 67 169 Housing and urban development 54 27 45 45 348 665 Others 3/ 118 222 227 819 465 910
Source: The General People’s Committee for Planning. 1/ Include general education, higher education, and vocational and technical training. 2/ Include health and environment, and social affairs. 3/ Include agriculture, finance and building of administrative centers, among others.
8 This amount is non negligible: just for reference purposes, the Libyan minimum wage is LD250 (around US$210)

11
Table 1.2: Capital Expenditures (In percent of GDP)
1999 2003 2004 2005 2006 2007 Total 4.8 7.5 8.2 16.1 12.1 21.0
Social spending 1/ 2/ 1.1 1.9 1.9 1.7 1.4 1.9
Of which: Education 1/ 0.7 0.9 1.3 1.4 1.0 1.4
Health 0.4 1.0 0.6 0.3 0.4 0.5 Basic infrastructure (w/o Housing) 1.1 … 1.7 3.3 2.1 3.6 Of which: Power 0.6 … 1.2 2.5 1.4 2.1
Communications and Transport 0.6 0.3 0.4 0.8 0.7 1.5 Housing and urban development 0.8 0.6 0.8 0.6 3.8 5.8 Others 3/ 1.7 4.7 3.9 10.5 5.0 7.9
Source: The General People’s Committees for Finance and Planning. 1/ Includes general education, higher education, and vocational and technical training. 2/ Includes health and environment, and social affairs. 3/ Includes agriculture, finance and building of administrative centers, among others.
• Among social spending, the most salient feature was the rapid upsurge in education
investments per inhabitant to US$160 from US$43. In the health sector, however, such increase was rather modest (US$59 from US$45).
• Investment on basic infrastructuremultiplied more than four times during this period, to US$413 in 2007 from US$97 in 2004. Two-thirds of such increase corresponded to power—an increase three times the per capita level of 2004—and the rest to communications and roads transportation, whose investment multiplied almost seven times during such period.
• Building of new housing facilities led to an impressive upturn of almost 25 times over the past five years, to US$665 from US$27 per inhabitant.
• Measured in real 2003 terms, rising capital outlays followed a volatile pattern. On aggregate (per capita) terms, it fell –32 percent and 10.1 percent in years 2003 and 2006, while it grew by 37.4 percent, 155 percent and 79 percent in 2004, 2005 and 2007, respectively. A similar volatile behavior was followed by all sectors, except for health investments, which plummeted for three successive years and then mildly recovered in the last two years.9
1.26 In short, total public investments rose tripled to 21 percent of GDP in 2007, from 7.5 percent of GDP in 2003 (and more than four times 4.8 percent of GDP in 1999). While the overall increase was significant, investment in social spending remained unchanged at 1.9 percent of GDP. Not only education outlays grew modestly to 1.4 percent of GDP from 0.9 percent of GDP, but health investments halved to 0.5 percent of GDP from 1.0 percent of GDP. Again, the big winners were, in the order, housing and urban development, and basic infrastructure (especially power) (Table 1.2). 1.27 Regarding performance, the execution of the development budget also improved considerably between 2004 and 2007. In 2007, the actual/budgeted ratio rose to 92 percent, well above the 74 percent of 2004 (Table 1.3). This is the highest rate of execution achieved in more than 25 years (GPCM 2007). In doing so, Libya reached a level of public investment execution that is reasonably high by international standards. Indeed, according to the Public Expenditure and Financial Accountability (PEFA) international benchmarks, a level of execution between 5 and 10 percent deserves a “B” grade.10
9 Estimates are available from the author upon request. 10 An important caveat applies here. Actual expenditure in Libyan fiscal accounts correspond to authorized expenditure, i.e. resources available to executing projects, not to committed expenses (in accounting terms).

12
Table 1.3: Budgeted and Actual Capital Expenditures, Total, 2004-2007
Year
Budgeted Million of LD
Actual Million of LD
Actual to budget ratio
Budgeted % of GDP
Actual % of GDP
Unspent % of GDP
2004 4,839 3,581 74.0 11.1 8.2 -2.9 2005 11,105 9,597 86.4 18.7 16.1 -2.6 2006 11,356 8,924 78.6 15.7 12.3 -3.4 2007 18,507 16,939 91.5 21.0 19.2 -1.8
Sources: The General People’s Committees for Finance and Planning. 1.28 But not all sectors improved their performance in equal terms. At the sectoral level, the best performing sectors were: electricity (power), gas and water sector occupied the first position (120 percent), followed by higher education and housing (above 90 percent). In contrast, health and communication and transport occupied the last positions (below 75 percent). (Table 1.4).
Table 1.4: Budgeted and Actual Capital Expenditures per Sector, 2007 Sector
Budgeted Million of LD
Actual Million of LD
Actual to budget ratio
Budgeted % of GDP
Actual % of GDP
Total selected sectors 10,801 9,959 92.2 12.3 11.3 Education 1,339 1,229 91.8 1.5 1.4
General Education 428 355 82.9 0.5 0.4 Higher Education 685 682 99.5 0.8 0.8 Technical and Vocational Training 226 192 85.2 0.3 0.2
Health and Environmental Care 635 455 71.5 0.7 0.5 Electricity, Gas and Water 1,560 1,874 120.2 1.8 2.1 Communications and Transport 1,736 1,298 74.8 2.0 1.5 Housing and Public Utilities 5,531 5,103 92.3 6.3 5.8
Others 7,705 6,980 90.6 8.7 7.9 Of which: General Security 324 294 90.8 0.4 0.3
Financial Sector 1,495 1,193 79.8 1.7 1.4 Oil Extraction 2,803 2,803 100.0 3.2 3.2 Agriculture, Livestock and Fishing 333 313 94.2 0.4 0.4 GMR Authority 900 900 100.0 1.0 1.0 General Committee for Defense 812 812 100.0 0.9 0.9
Total 18,507 16,939 91.5 21.0 19.2
Source: The General People’s Committee for Planning. 1.29 In the meantime, the quality of the overall composition of the pipeline has also improved.Divided in four categories—(a) finished (or completed), (b) ongoing (or underway), (c) stopped (or dropped) and (d) contracted, but non-started, the situation was as follows (see Table 1.5):
• Ongoing projects neared almost half of the total number of projects contracted for all sectors. At one extreme, Electricity, Gas and Water appeared with a sizable exceptional high amount of projects underway (84 percent of their total number of sectoral projects). At the other extreme, Higher Education had the lowest percentage of ongoing projects (41 percent).
• On finished projects, about one third reported as fully completed (against 31 percent in 2006). At one extreme, again (against 38 percent in 2006—see Table A.2.11 in Volume III), Electricity, Gas and Water appeared with a sizable exceptional low amount of past projects completed in 2007 (2 percent of their total number of sectoral projects); whereas at the other extreme Health and Environment and Higher Education projects completed the highest percentage of their number of sectoral projects, with 56.8 percent and 51.4 percent respectively.

13
• Dropped projectsrepresent about 12 percent of the total number of projects (against 17 percent in 2006). The two sectors with the highest sectoral percentage of the number of projects stopped are Housing, Technical and Vocational Training, and General Education. Together, these three sectors represented 97 percent of the total number of projects dropped.
• Finally, committed, but non-started projectsrepresented about 10 percent of the total number of projects (against 14 percent in 2006). At one extreme, General Education, Electricity, Gas and Water, and Housing showed the highest percentage of projects in such situation. Together these three sectors represented 82 percent of the total number of projects ready to start. At the other extreme, Health and Communication, Transportation and telecommunications showed very small percentages of their number of projects non-started.
Table 1.5: Status of Projects per Sector, 2007 Sector
Finished Underway Stopped Not started
Total
(Number of projects) Education 2,087 2,595 495 736 5,913 General education 1,375 1,926 420 667 4,388 Higher education 481 383 9 62 935 Technical and vocational training 231 286 66 7 590
Health and Environment 412 313 0 0 725 Electricity, Gas and Water 3 115 0 19 137 Communications, Transportation and Telecommunications 230 240 20 3 493 Housing and Public Utilities 1,365 3,433 1,602 646 7,046 Total 5,448 7,951 2,193 1,635 17,227
(% of sectoral total) Education 35.3 43.9 8.4 12.4 100.0 General education 31.3 43.9 9.6 15.2 100.0 Higher education 51.4 41.0 1.0 6.6 100.0 Technical and vocational training 39.2 48.5 11.2 1.2 100.0
Health and Environment 56.8 43.2 0.0 0.0 100.0 Electricity, Gas and Water 2.2 83.9 0.0 13.9 100.0 Communications, Transportation and Telecommunications 46.7 48.7 4.1 0.6 100.0 Housing and Public Utilities 19.4 48.7 22.7 9.2 100.0 Total 31.6 46.2 12.7 9.5 100.0
(% of total) Education 38.3 32.6 22.6 45.0 34.3 General education 25.2 24.2 19.2 40.8 25.5 Higher education 8.8 4.8 0.4 3.8 5.4 Technical and vocational training 4.2 3.6 3.0 0.4 3.4
Health and Environment 7.6 3.9 0.0 0.0 4.2 Electricity, Gas and Water 0.1 1.4 0.0 1.2 0.8 Communications, Transportation and Telecommunications 4.2 3.0 0.9 0.2 2.9 Housing and Public Utilities 25.1 43.2 73.1 39.5 40.9 Total 100.0 100.0 100.0 100.0 100.0
Source: The General People’s Committee for Planning. 1.30 And at the decentralized level of execution, the performance of project execution per Shaabia—measured by the number of finished projects—improved overall with respect to the accumulated values of the 1999-2006 period, but with a great dispersion in 2007 (Figure 1.4). Those Shaabiat with the highest completion ratios—above the national threshold (of 31.6%)—represent about one third of all districts, and most of them implemented a number of projects below the national median (of 718 projects). Such evidence clearly suggests that Shaabiat managing a small number of projects have more probabilities to complete them.

14
Figure 1.4: Distribution of Finished Projects per Shaabia, 2007
1.31 On average, project completion by Shaabiats remained constant at 32 percent between 2007 and the period 1999-2006.Below, there is a more detailed analysis per sector follows, which gives a more sanguine picture, especially for the sectors covered by this study (see Table 1.6). 1.32 And the quality of the decentralized pipeline also improved among sectors. On General Education, the evidence suggests that the quality of the composition of investment projects—measured by the percentage of completion—decreased from 68 percent to 31 percent (Figure 1.5). However, this was partly offset by a rising number of projects underway, which increased from 12 to 44 percent. Not started committed projects also doubled to 15 percent, which suggests that the sector keeps new projects on hold.
Figure 1.5: Change in Project Status in the General Education Sector for Shabiaat
General Education projects (1999-2006)
Finished projects
(67.98%)
Underway projects (12.01%)
Stopped projects
(12.92%)
Not started projects (7.09%)
Source: The General People’s Committee for Planning and Annex A in Volume III.
0
500
1000
1500
2000
2500
0,0 10,0 20,0 30,0 40,0 50,0 60,0
ALR
Others
TRI
SAB
GHA
ALK
JAB
WAH
JAF
BATMER
NALBEN
Liby
a=
31.6
ALW
WAS
ALM
ALZALN
SIR
ALJ
ALG
AJD
DAR
% of total projects
To
taln
um
be
ro
fpro
ject
s
MUS
Source: The General People’s Committee for Planning
Finished31%
Stopped10%
Not started15%
Underway44%
2007
15
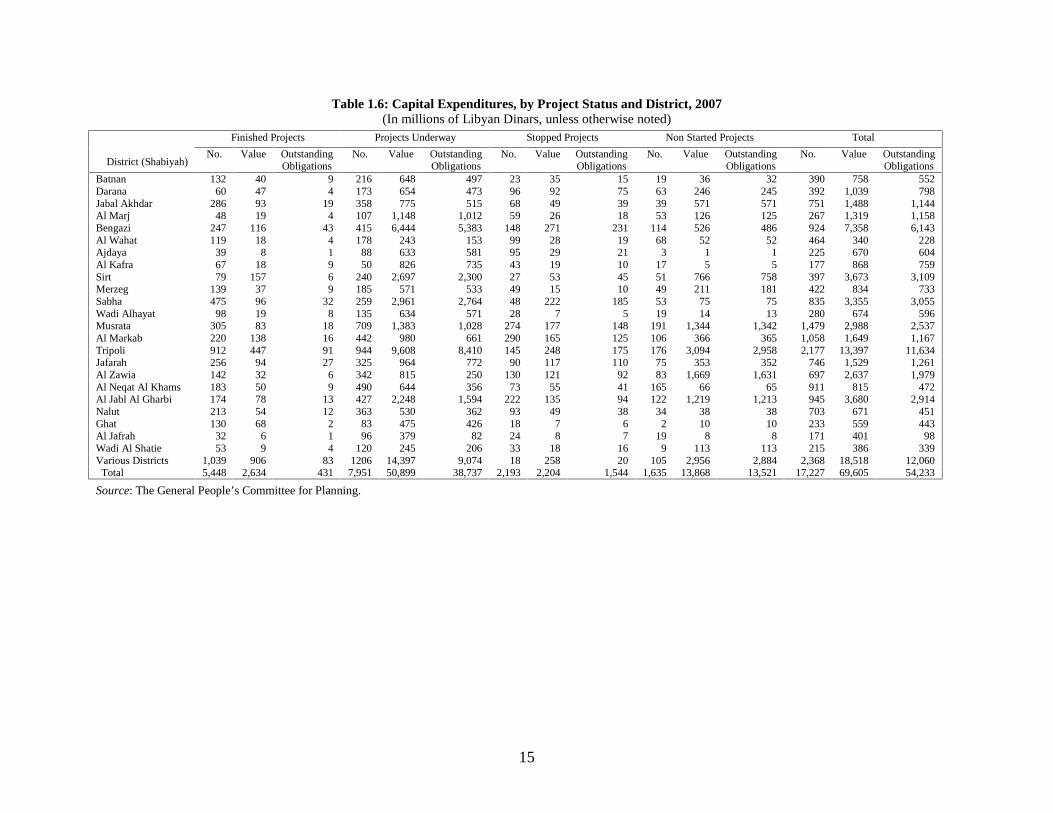
Table 1.6: Capital Expenditures, by Project Status and District, 2007(In millionsof Libyan Dinars, unlessotherwise noted)
Finished Projects Projects Underway Stopped Projects Non Started Projects Total
District (Shabiyah)No. Value Outstanding
ObligationsNo. Value Outstanding
ObligationsNo. Value Outstanding
ObligationsNo. Value Outstanding
ObligationsNo. Value Outstanding
ObligationsBatnan 132 40 9 216 648 497 23 35 15 19 36 32 390 758 552Darana 60 47 4 173 654 473 96 92 75 63 246 245 392 1,039 798Jabal Akhdar 286 93 19 358 775 515 68 49 39 39 571 571 751 1,488 1,144Al Marj 48 19 4 107 1,148 1,012 59 26 18 53 126 125 267 1,319 1,158Bengazi 247 116 43 415 6,444 5,383 148 271 231 114 526 486 924 7,358 6,143Al Wahat 119 18 4 178 243 153 99 28 19 68 52 52 464 340 228Ajdaya 39 8 1 88 633 581 95 29 21 3 1 1 225 670 604Al Kafra 67 18 9 50 826 735 43 19 10 17 5 5 177 868 759Sirt 79 157 6 240 2,697 2,300 27 53 45 51 766 758 397 3,673 3,109Merzeg 139 37 9 185 571 533 49 15 10 49 211 181 422 834 733Sabha 475 96 32 259 2,961 2,764 48 222 185 53 75 75 835 3,355 3,055Wadi Alhayat 98 19 8 135 634 571 28 7 5 19 14 13 280 674 596Musrata 305 83 18 709 1,383 1,028 274 177 148 191 1,344 1,342 1,479 2,988 2,537Al Markab 220 138 16 442 980 661 290 165 125 106 366 365 1,058 1,649 1,167Tripoli 912 447 91 944 9,608 8,410 145 248 175 176 3,094 2,958 2,177 13,397 11,634Jafarah 256 94 27 325 964 772 90 117 110 75 353 352 746 1,529 1,261Al Zawia 142 32 6 342 815 250 130 121 92 83 1,669 1,631 697 2,637 1,979Al Neqat Al Khams 183 50 9 490 644 356 73 55 41 165 66 65 911 815 472Al Jabl Al Gharbi 174 78 13 427 2,248 1,594 222 135 94 122 1,219 1,213 945 3,680 2,914Nalut 213 54 12 363 530 362 93 49 38 34 38 38 703 671 451Ghat 130 68 2 83 475 426 18 7 6 2 10 10 233 559 443Al Jafrah 32 6 1 96 379 82 24 8 7 19 8 8 171 401 98Wadi Al Shatie 53 9 4 120 245 206 33 18 16 9 113 113 215 386 339Various Districts 1,039 906 83 1206 14,397 9,074 18 258 20 105 2,956 2,884 2,368 18,518 12,060Total 5,448 2,634 431 7,951 50,899 38,737 2,193 2,204 1,544 1,635 13,868 13,521 17,227 69,605 54,233
Source: The General People’s Committee for Planning.

16
1.33 On Higher Education, despite the project completion ratio lowered from 70 to 51 percent, it remained high. In addition, the percentage of ongoing projects almost tripled from 16 to 41 percent. Finally, the percentage of dropped projects is nil, which would reflect a solid preparation (Figure 1.6).
Figure 1.6: Change of Project Status in the Higher Education Sector
Higher Education Projects (1999-2006)
Finished contracts (69.78%)
Underway contracts (15.93%)
Stopped contracts (4.95%)
Not-started contracts (9.34%)
Source: The General People’s Committee for Planning and Annex A in Volume III.
1.34 On Health and the Environment, the pattern is quite similar to Higher Education: a mildly lower percentage of projects completed, combined with the rapid increase of new ongoing projects. The ratio of underway projects increased to 41 percent in 2007, from an average of 17 percent in the period 1999-2006. The viability of health projects submitted also improved considerably as indicated by the share of stopped projects, which reached only 1 percent in 2007 (Figure 1.7).
Figure 1.7: Change of Project Status in the Health and Environment Sector
Health and environment projects (1999-2006)
Not started projects (8.80%)
Stopped projects (9.26%)
Underway projects (17.20%)
Finished projects
(64.74%)
Source: The General People’s Committee for Planning and Annex A in Volume III.
1.35 On Electricity, Gas and Water, the demand for new investment projects was highest among sectors: the share of ongoing projects surged to 84 percent from an average 19 percent during 1999-2006. There is no doubt about the large budget devoted to expanding and improving the power and water infrastructure. In the same vein, the number of dropped projects became nil, which is a positive development (Figure 1.8).
Finished
51%Under
way
41%
Not
started7%
Stopped
1%
2007
Finished51%
Stopped1%
Not started
7%
Underway41% 2007

17
Figure 1.8: Change of Project Status in the Electricity, Gas and Water Sector
Electricity projects (1999-2006)
Not started projects (4.76%)
Stopped projects
(23.81%)
Underway projects (19.05%)
Finished projects
(52.38%)
Source: The General People’s Committee for Planning and Annex A in Volume III.
1.36 On Transport and Communications, project implementation improved considerably between both dates, with parallel increases in the number of completed and ongoing projects, which suggests a rising number of projects growing in recent years. The number of stopped projects has also fell sharply to only 4 percent in 2007 (Figure 1.9).
Figure 1.9: Change of Project Status in the Transport and Communications Sector
Communication and transportation projects (1999-2006)
Not started projects
(13.93%)Stopped projects
(18.36%)
Underway projects (22.30%)
Finished projects
(45.41%)
Source: The General People’s Committee for Planning and Annex A in Volume III.
Underway48%
Not started
1%
Stopped4%
Finished47%
2007
Finished2%
Stopped0%
Not started
14%
Underway84%
2007

Chapter 2. Overall Fiscal Developments and Sustainability This chapter provides a macroeconomic background, identifies the fiscal trends and challenges, and assesses fiscal sustainability for Libya. The chapter is to a large extent based on public expenditure plans that were formulated in early 2009, a time witnessing unparalleled global financial crisis where oil prices have declined sharply from historically high levels. In 2008, record oil prices contributed to maintaining a substantially strong fiscal position. Current oil prices of $60-70 per barrel and an expected increase in oil output would still result in a surplus, albeit declining and possibly turning into a deficit as prices approach $40, in 2009 and over the medium term. Nevertheless, these plans are not consistent with sustaining a stable real per capita expenditure out of hydrocarbon wealth at oil prices below $60 per barrel. It would, therefore, be essential that any plans to increase spending, e.g. disbursements under the Wealth Distribution Program (WDP), be limited and considered within the overall sustainable expenditure envelop as defined in this chapter, in order to maintain macroeconomic stability and intergenerational equity. Deviations from the sustainable expenditure benchmarks could in fact be desirable. However, deviations should be temporary, well-justified by economic reasons, and guided by the objective of maintaining overall macroeconomic stability. In addition to maintaining sustainable levels of public expenditure, emphasis should be placed on ensuring its high quality.
I. Macroeconomic Background 2.1 Libya’s economy is dominated by the hydrocarbon sector. Libya holds the largest oil reserves in Africa, with total proven oil reserves of 43.7 billion barrels at end-2007.11 In addition, Libya has vast natural gas reserves estimated at 52.8 trillion cubic feet (Tcf), and with new discoveries, reserves will probably reach 70 Tcf to 100 Tcf.12 Overall, the sector accounts for more than 70 percent of gross domestic product (GDP), about 97 percent of foreign exchange earnings, and 90 percent of government revenue.
2.2 The economy strengthened since 2001 (Table 2.1). High international oil prices since 2004 and until recently, and a stronger performance in the non-hydrocarbon sector since the lifting of the embargo, have led to robust economic growth with real GDP growing at more than 6 percent on average.
11 National Oil Company estimates. 12 This is equivalent to 9 billion barrels of oil. With 2008 oil production (1.81 million barrels per day and natural gas production of about 1.06 Tcf per year, and assuming no new discoveries, Libya’s oil and natural gas reserves would last for about 65 years and 50 years, respectively.
Table 2.1. Libya: Real GDP Growth (in percent, period averages)
1991-95 1996-2000 2001-05 2006 2007 2008
Real GDP -0.5 1.0 6.8 5.9 6.0 3Non-hydrocarbons 1.6 3.0 8.5 7.9 9.9 8Hydrocarbons -1.2 -0.3 5.8 4.3 2.8 0
Per capita GDP in ’000 dollars 7.0 6.9 5.7 9.5 11.814.5CPI inflation (average) 9.5 2.2 -3.4 1.4 6.2 10.4Oil export price (US$/barrel) 1/ 16.9 18.9 32.9 62.5 69.3 96.7
Source: Libyan authorities; and Fund staff estimates.
1/ Libya’s oil export price is approximately three percent below the WEO international petroleum price.

19
2.3 The external current account surplus increased substantially in recent years due to high oil exports. With growing export revenues and falling imports—mainly due to the constraining effect of the sanctions—Libya’s current account surplus increased during the 1990s (Table 2.2). Buoyant oil revenue has led to large surpluses in the external current account, which reached 41 percent of GDP in 2008. The rise in oil receipts more than offset the increase in imports, resulting in a further build up of the net foreign assets of the Central Bank of Libya (CBL) and the Libyan Investment Authority (LIA) to about $136.1 billion in 2008 (the equivalent of about 24 months of imports).
2.4 Libya’s fiscal surplus at about 25 percent of GDP in 2008. Revenue increased to 64 percent of GDP due to higher oil prices. At the same time, overall expenditure increased by 45 percent, reflecting a rapid increase in virtually all expenditure items, albeit at a slower rate than was envisioned in the budget. Current expenditures increased by about 40 percent, largely on account of spending under the WDP, which was limited to LD 3.3 billion (about 3.3 percent of GDP), compared to LD 4.6 billion approved in the budget. Capital expenditures increased by about 47 percent, reflecting spending necessary to upgrade the infrastructure.
2.5 The rapid growth in public expenditures contributed to inflationary pressures, along with higher import costs of food products. The annual consumer price index (CPI) accelerated from 1.4 percent in 2006 to 6.2 percent in 2007 (Table 2.1). Although this was largely driven by higher imported food prices, prices of nontradables also increased (for example, dwellings and transportation).13 This indicated that the rise in domestic demand mostly from increased public expenditures and the rapid growth of credit extended by specialized banks are also playing a role. In 2008, inflation accelerated further, averaging about 10 percent.
13 Libya imports more than 75 percent of its food items.
Table 2.2. Libya: Balance of Payments and Reserves (In billions of dollars, unless otherwise indicated. Period averages)
1991-95 1996-2000 2001-05 2006 2007 2008
Exports, f.o.b. 9.6 12.0 17.4 39.2 47.0 62.0Of which: Hydrocarbons 8.7 11.5 16.9 38.2 45.8 60.7
Imports, f.o.b. 7.2 5.6 7.9 13.1 17.7 21.7Current account balance 1.3 5.4 6.9 25.2 29.1 36.6
(As a percent of GDP) 4.0 14.8 19.1 44.6 40.7 40.7Overall Balance (deficit -) 0.5 1.9 5.3 19.8 20.2 16.8
(As a percent of GDP) 1.6 4.9 14.7 35.1 28.2 18.7
Gross Official reserves1/ 1.2 7.4 22.6 74.8 98.3 136.1
Source: Libyan authorities; and Fund staff estimates. 1/ From 2006 represents total foreign assets (net foreign assets + Libyan Investment Authority
Table 2.3. Libya: Central Government Finances (In percent of GDP, period averages)
1991-95 1996-2000 2001-05 2006 2007 2008
Revenue 29.6 36.8 50.0 62.4 60.8 6Hydrocarbon 16.1 22.6 41.9 57.5 54.5 5Non-hydrocarbon 13.5 14.1 8.0 4.9 6.3
Of which: Tax 7.4 9.7 4.5 2.5 2.9Expenditure and net lending 28.9 31.5 37.6 31.0 35.33
Current 22.1 24.2 24.6 13.4 14.1 1Of which: wages 12.3 13.2 8.8 6.6 10.1 1
Capital 6.8 7.3 13.0 17.6 21.1 2Overall position (deficit -) 0.7 5.3 12.4 31.4 25.5 2Non-hydrocarbon deficit -15.4 -17.3 -29.5 -26.2 -29.0-32.7

20
2.6 Libya continues to face other economic challenges. Despite recent reform efforts, the economy remains highly dependent on oil and dominated by the public sector. There is a need to redouble the efforts to put in place an environment that is conducive to allowing the private sector to take a leading role in diversifying the economy and creating productive job opportunities for the rapidly growing labor force. To this end, there is a large scope for streamlining and modernizing the regulatory environment. It is also important to further advance financial sector reforms, building on the substantial progress achieved in recent years.
II. Fiscal Trends From 1990 Through 2007 2.7 The overall fiscal surplus reached a peak of 31 percent of GDP in 2006 due to the increase in oil prices. It then started to decline as result of the very rapid increase in capital expenditures (Table 2.3). On average, oil revenue continued to increase due to both higher prices and increased oil production. Tax revenue grew by 41 and 40 percent in 2007 and 2008, respectively, due to the ongoing reform of the tax and customs administration. Nonetheless, it declined in relation to GDP due to the sharp increase in hydrocarbon GDP in nominal terms (Figure 2.1). Overall expenditures grew by 37 percent in 2007 compared to 2006, reflecting rapid growth in both current (28 percent) and capital (45 percent) outlays. The same trend continued in 2008 where expenditures increased by 45 percent with current and capital expenditure growing at 42 percent and 47 percent, respectively. The level of public expenditure in recent years was sustainable under the high oil prices prevailing until end-2008. As the next section illustrates they became unsustainable as oil prices declined. Even when these high levels were sustainable, questions were raised about the challenge to maintain the quality of public expenditure in view of its very rapid growth rate. This challenge would be substantial for the administrative capacity of any country, whether it is developing or developed.
2.8 While the overall fiscal surplus remained substantial, the non-hydrocarbon deficit increased. This is due to the rapid growth in overall expenditures and the growing importance of oil revenue to the budget. The share of hydrocarbon revenue in the budget has been increasing over time, especially in the past two years when its share of total revenue increased from an average of 53 percent during 1990–95 to 83 percent during 2001–05, and to 90 percent in 2007 and 2008 (Table 2.4 and Figure 2.2).
2.9 The composition of government spending is shifting towards more capital expenditures. While it remained stable at around 23 percent of total expenditures throughout the 1990s, capital expenditures almost tripled, reaching around 60 percent of total expenditures by 2007 and 2008 (Table 2.4 and Figure 2.2). This largely reflected the priority the authorities placed
Table 2.4. Libya: Hydrocarbon Revenue, Current and Capital Expenditures1/
(In percent of budget, period averages)
1991-95 1996-2000 2001-05 2006 2007 2008
Hydrocarbon revenue 53.1 60.7 82.6 92.2 89.7 89.7Tax revenue 25.5 26.9 10.1 4.0 4.8 4.8Current Expenditure 76.5 76.6 64.7 43.2 40.1 39.2
Of which: wages 42.6 42.0 23.5 21.3 23.7 17.3Capital Expenditure 23.5 23.4 35.3 56.8 59.9 60.8Sources: Libyan Authorities; and Fund staff estimates.1/ Revenue is expressed as a percent of total revenue and expenditure as a percent ot total expenditure

21
on upgrading the infrastructure. In 2009, overall public expenditure is expected to show a small decline despite the projected decline in oil revenue by almost 40 percent. Current expenditure is
envisaged to increase by about 25 percent, mostly on account of transfers related to the Economic and Social Development Fund (ESDF) and a 16 percent projected increase in the wage bill. Capital expenditure is expected to decline by 20 percent, consistent with the authorities’ policy to rationalize public investment. This a positive development in view of the very rapid increase in recent years and the country’s implementation capacity as mentioned above. It is, however, important to focus on improving the quality of expenditure.
III. Fiscal Sustainability Analysis
2.10 The main indicator usually used for assessing the fiscal sustainability in hydrocarbon-producing countries is the non-hydrocarbon primary fiscal balance (NHPB) relative to the non-hydrocarbon GDP (NHGDP).14 During high oil prices, governments may decide to spend the revenue windfall and still end up with an apparently improving fiscal position. This could be the case, when the analysis is inappropriately focused on the overall fiscal position, even when expenditures reach unsustainable levels. The NHPB is therefore a better indicator for assessing the fiscal stance in such cases. For Libya, the NHBP shows a steadily increasing deficit relative to the nonhydrocarbon GDP since 1990. The nonhydrocarbon deficit widened from an average of about 16 percent of GDP in 1990-95 to almost 33 percent in 2008. This constituted a substantial widening of the non-oil deficit (Table 2.3). In addition to the obvious concerns this situations raises about the quality of expenditure and the implications for inflation, concerns regarding long term fiscal sustainability have become pressing in view of the recent decline in oil prices.
14 The NHPB is the overall balance excluding oil and interest-related earnings or payments.
Figure 2.1. Libya: Composition of Budgetary Revenue
(In percent of GDP, period averages)
0
10
20
30
40
50
60
70
1991-95 1996-2000 2001-05 2006 2007 2008
Hydrocarbon revenueNon-hydrocarbonTax revenueRevenue
Source: Libyan authorities; and Fund staff estimates.
Figure 2.2. Libya: Hydrocarbon Revenue, Current and Capital Expenditures (In percent of total, period averages)
0
10
20
30
40
50
60
70
80
90
100
1991-95 1996-2000 2001-05 2006 2007 2008
CurrentCapitalHydrocarbon Revenue
Source: Libyan authorities; and Fund staff estimates.

22
2.11 High oil prices represent both an opportunity and a challenge for Libya, like other oil-producing countries. With the surge in oil revenues, the fiscal position improves and governments can increase their spending to satisfy current economic needs and invest in economic development. However, hydrocarbon resources are nonrenewable. In the long term, policymakers have to consider the exhaustibility of these resources, the uncertainty of their future value, and in turn the implication for intergenerational equity and fiscal sustainability. The exhaustibility of resources also raises the importance of the quality of expenditure, as this expenditure in this case should be considered a transformation of wealth from a mineral form to other forms that need to be of high quality.
2.12 Fiscal policy needs to manage the transition to a situation where natural resources will eventually be depleted. Governments should therefore save a portion of hydrocarbon revenue to be able to sustain spending levels in the future. One approach for achieving long-term fiscal sustainability is for governments to base their spending not on current hydrocarbon revenue but on permanent income from hydrocarbon wealth. This is usually defined as the net present value of the stream of revenue from oil and from the investment of the country’s net financial assets (Barnett and Ossowski 2003).15 Meeting intergenerational equity would require saving and investing part of that revenue with the objective of preserving a constant real per capita revenue from oil and financial wealth.
Definition
2.13 Fiscal policy is, therefore, sustainable if the nonhydrocarbon primary deficit (NHPD) is smaller or equal to permanent income out of oil and financial net wealth (Barnett and Ossowski, 2002). Box 2.1 describes in more detail the methodology to assess sustainability using the permanent income approach. As highlighted earlier, this type of analysis focuses on quantifying the sustainable expenditure benchmarks. It has to be complemented with other analyses of the quality and adequate sequencing of the various types of expenditures. It is also important to carefully assess the appropriateness of any temporary and limited deviations from these benchmarks for macroeconomic stabilization purposes.
Assumptions
2.14 The following outlines the main assumptions regarding the key variables that are used in the analysis. These variables include the size of hydrocarbon reserves, future oil prices, the discount rate, the hydrocarbon production profile, the government’s share in oil exports, population growth, and the growth rate of non-hydrocarbon GDP. Given the current oil production rates and assuming no new discoveries of oil reserves, Libya would exhaust its oil reserves by around 2070.
• Hydrocarbon reserves: At end-2007, Libya’s proven oil reserves were about 43.7 billion barrels (Figure 2.3), and natural gas reserves were estimated at 52.8 Tcf (Figure 2.4), which is equivalent to around 9 billion barrels.
15 Government wealth constitutes the sum of hydrocarbon wealth, financial assets net of government debt, and non-financial wealth. The latter is not included in the analysis because government non financial wealth (e.g. physical capital) is generally difficult to valuate. For this reason the general practice in fiscal sustainability analysis exercises has been that this type of assets is not included.

23
• Hydrocarbon prices: Given the recent decline in oil prices from historically high levels, six price scenarios reflecting a wide range of oil prices were used in the analysis.16 These are $30, $40, $50, $60, $80, and $100 per barrel. Natural gas prices are assumed to move in line with oil prices.17
• Production profiles: Oil production profile follows the National Oil Company’s (NOC) target for raising production from 1.7 mbpd to 2.4 mbpd by 2013 (Figure 2.5). Then production declines annually on the assumption of no new oil reserve discoveries. Natural gas production is assumed to expand rapidly until 2020, then stabilizes, and gradually declines until reserves are depleted by 2070. However, as production expands, the level of reserves continues to increase up to 75 Tcf by 2020 (Figure 2.4), reflecting Libya’s future prospects for increases in natural gas reserves.
• Other assumptions: The analysis assumes a discount rate of 5 percent and an average population growth rate of 1.75 percent for 2006–70. The government’s share of hydrocarbon exports is assumed to moderately decline, from its current high level of almost 90 percent, to 85, over the medium term. Non-hydrocarbon GDP real growth follows the medium term outlook (see Table in Box 2.2) then it is assumed to grow at 5.0 percent throughout the analysis time horizon (to 2070). Assumptions underlying Libya’s expenditure plans that were formulated in early 2009 are described in Box 2.2.18
16 The presentation of these price scenarios focus on only four of them-$40, $60, $80, and $100. 17 Historical data show a lower natural gas price, compared to oil prices per British thermal unit (Btu), and the relationship is relatively stable. 18 The revised nominal GDP figures at market prices are for 2007-09 as follows: 87,594, 113,963 and 78,156; for the hydrocarbon sector they are 68,910, 91,467 and 52,880; and for the Non-hydrocarbon sector they are 18,684, 22,496 and 25,276 (all in million of Libyan dinars). The original nominal GDP figures are in Volume III, Table A.1.1.
Figure 2.4 Libya: Natural Gas Reserves and Prices, 2006–70
0
10,000
20,000
30,000
40,000
50,000
60,000
70,000
80,000
2006
2010
2014
2018
2022
2026
2030
2034
2038
2042
2046
2050
2054
2058
2062
2066
2070
120
160
200
240
280
320
360
400
Natural Gas Reserves (left axis) (trillion cubic feet)
Natural Gas Price Projection (right axis)US$ per tillion cubic feet)
Source: Staff estimates.
Figure 2.3 Libya: Oil Reserves and Prices, 2006–70
0
5
10
15
20
25
30
35
40
45
2006
2010
2014
2018
2022
2026
2030
2034
2038
2042
2046
2050
2054
2058
2062
2066
2070
0
20
40
60
80
100
120
Oil Reserves (left axis) (Billion barrels per year)
Oil Price Projection (right axis)US$ per barrel
High
Med
Low
Source: Staff estimates.
Figure 2.5. Libya: Oil and Natural Gas Production Profile, 2006–70
0
1
2
3
2006
2012
2018
2024
2030
2036
2042
2048
2054
2060
2066
0
10
20
30
40
50
60
70
80
Oil production (left axis)(million barrels per day)
Natural gas production (right axis)(billion cm/year)
Source: Staff estimates.

24
Box 2.1. Methodology to Estimate Fiscal Sustainability
Abstracting from non-financial wealth, government wealth can be written as the sum ofhydrocarbon
wealtht
H , and net financial wealth t
F :
t t tW H F= + . (1)
Hydrocarbon wealth t
H is defined as the present discounted value of the projected stream of future
government hydrocarbon revenue up to period T—when reserves are exhausted:
1 (1 )
Tt n
nn t
t
rH
i+
=
=+∑ , (2)
where tr is real hydrocarbon revenue in period t and i is the real interest rate. It follows that maintaining
government wealth unchanged over time requires spending in each period to equal the implicit return on government wealth. That is:
1 1 1( ) ( ) ( ) 0t t tt t tW W F F H H− − −− = − − − = . (3)
Using equation (2), an expression for hydrocarbon revenue can be written as the sum of the decline in hydrocarbon wealth between periods t and t-1 and the implied return on hydrocarbon wealth in period t-1:
11( )t t tt tr H H i H −−= − + . (4)
The required savings ts out of hydrocarbon revenue can be derived from the targeted stock of financial
wealth in period t compared to the stock of financial wealth in period t-1:
11
tt
t
t
Fs F
i−= −
+. (5)
Rearranging equations (4) and (5) and substituting in (3) gives an expression for government spending financed by permanent income from hydrocarbon wealth:
1 11 1( ) ( )t t tt t t t t tr s i H F s i W s− −− −− = + + = + . (6)
Given the above, the government intertemporal budget constraint can be written as:
1 1( )t t tt t tz i W s e W W− −+ + − = − , (7)
where tz , the non-hydrocarbon revenue, plus net interest income from hydrocarbon wealth less government
primary expenditure te is equal to the change in government wealth. To prevent government wealth from
declining, the nonhydrocarbon primary balance (NHPB) t tz e− must be equal to or greater than government
spending financed by hydrocarbon permanent income 1( )tti W s− + . That is equation (7) can be rewritten as:
1
1
1
( )
( )
( )
t t t t
t t t t
t t t t
t t
t
t
NHPB z e i W s
or e z i W s
or e i W s z
−
−
−
= − +
+
+ +
³ −− ≤
≤(8)
This gives the “sustainable” level of spending that maintains real government wealth. However, equation (8) does not account for population growth, implying a decline in real government wealth per capita. To keep real government wealth per capita constant, equation (8) could be rewritten so that the sustainable NHPB is equal to or greater than the return on total wealth adjusted for population growth rate
tn :
1
1
( )
( )
t t t t t
t t t t t
t t
t
NHPB z e i n W i s
or e i n W i s z
−
−
= − − − −
− +
³≤ +
(9)
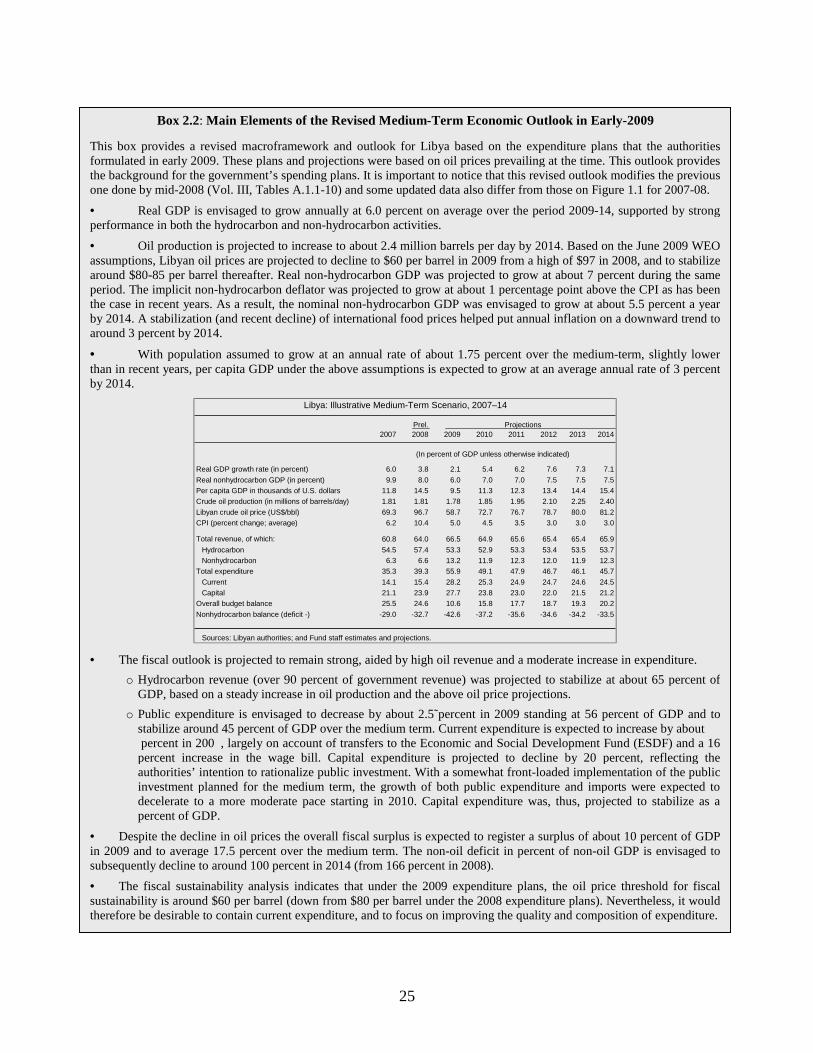
25
Box 2.2: Main Elements of the Revised Medium-Term Economic Outlook in Early-2009
This box provides a revised macroframework and outlook for Libya based on the expenditure plans that the authorities formulated in early 2009. These plans and projections were based on oil prices prevailing at the time. This outlook provides the background for the government’s spending plans. It is important to notice that this revised outlook modifies the previous one done by mid-2008 (Vol. III, Tables A.1.1-10) and some updated data also differ from those on Figure 1.1 for 2007-08. • Real GDP is envisaged to grow annually at 6.0 percent on average over the period 2009-14, supported by strong performance in both the hydrocarbon and non-hydrocarbon activities.
• Oil production is projected to increase to about 2.4 million barrels per day by 2014. Based on the June 2009 WEO assumptions, Libyan oil prices are projected to decline to $60 per barrel in 2009 from a high of $97 in 2008, and to stabilize around $80-85 per barrel thereafter. Real non-hydrocarbon GDP was projected to grow at about 7 percent during the same period. The implicit non-hydrocarbon deflator was projected to grow at about 1 percentage point above the CPI as has been the case in recent years. As a result, the nominal non-hydrocarbon GDP was envisaged to grow at about 5.5 percent a year by 2014. A stabilization (and recent decline) of international food prices helped put annual inflation on a downward trend to around 3 percent by 2014.
• With population assumed to grow at an annual rate of about 1.75 percent over the medium-term, slightly lower than in recent years, per capita GDP under the above assumptions is expected to grow at an average annual rate of 3 percent by 2014.
Prel.2007 2008 2009 2010 2011 2012 2013 2014
Real GDP growth rate (in percent) 6.0 3.8 2.1 5.4 6.2 7.6 7.3 7.1
Real nonhydrocarbon GDP (in percent) 9.9 8.0 6.0 7.0 7.0 7.5 7.5 7.5Per capita GDP in thousands of U.S. dollars 11.8 14.5 9.5 11.3 12.3 13.4 14.4 15.4Crude oil production (in millions of barrels/day) 1.81 1.81 1.78 1.85 1.95 2.10 2.25 2.40
Libyan crude oil price (US$/bbl) 69.3 96.7 58.7 72.7 76.7 78.7 80.0 81.2CPI (percent change; average) 6.2 10.4 5.0 4.5 3.5 3.0 3.0 3.0
Total revenue, of which: 60.8 64.0 66.5 64.9 65.6 65.4 65.4 65.9
Hydrocarbon 54.5 57.4 53.3 52.9 53.3 53.4 53.5 53.7Nonhydrocarbon 6.3 6.6 13.2 11.9 12.3 12.0 11.9 12.3
Total expenditure 35.3 39.3 55.9 49.1 47.9 46.7 46.1 45.7
Current 14.1 15.4 28.2 25.3 24.9 24.7 24.6 24.5Capital 21.1 23.9 27.7 23.8 23.0 22.0 21.5 21.2
Overall budget balance 25.5 24.6 10.6 15.8 17.7 18.7 19.3 20.2
Nonhydrocarbon balance (deficit -) -29.0 -32.7 -42.6 -37.2 -35.6 -34.6 -34.2 -33.5
Sources: Libyan authorities; and Fund staff estimates and projections.
Libya: Illustrative Medium-Term Scenario, 2007–14
(In percent of GDP unless otherwise indicated)
Projections
• The fiscal outlook is projected to remain strong, aided by high oil revenue and a moderate increase in expenditure.
o Hydrocarbon revenue (over 90 percent of government revenue) was projected to stabilize at about 65 percent of GDP, based on a steady increase in oil production and the above oil price projections.
o Public expenditure is envisaged to decrease by about 2.5˜percent in 2009 standing at 56 percent of GDP and to stabilize around 45 percent of GDP over the medium term. Current expenditure is expected to increase by about �percent in 200� , largely on account of transfers to the Economic and Social Development Fund(ESDF) and a 16 percent increase in the wage bill. Capital expenditure is projected to decline by 20 percent, reflecting the authorities’ intention to rationalize public investment. With a somewhat front-loaded implementation of the public investment planned for the medium term, the growth of both public expenditure and imports were expected to decelerate to a more moderate pace starting in 2010. Capital expenditure was, thus, projected to stabilize as a percent of GDP.
• Despite the decline in oil prices the overall fiscal surplus is expected to register a surplus of about 10 percent of GDP in 2009 and to average 17.5 percent over the medium term. The non-oil deficit in percent of non-oil GDP is envisaged to subsequently decline to around 100 percent in 2014 (from 166 percent in 2008).
• The fiscal sustainability analysis indicates that under the 2009 expenditure plans, the oil price threshold for fiscal sustainability is around $60 per barrel (down from $80 per barrel under the 2008 expenditure plans). Nevertheless, it would therefore be desirable to contain current expenditure, and to focus on improving the quality and composition of expenditure.
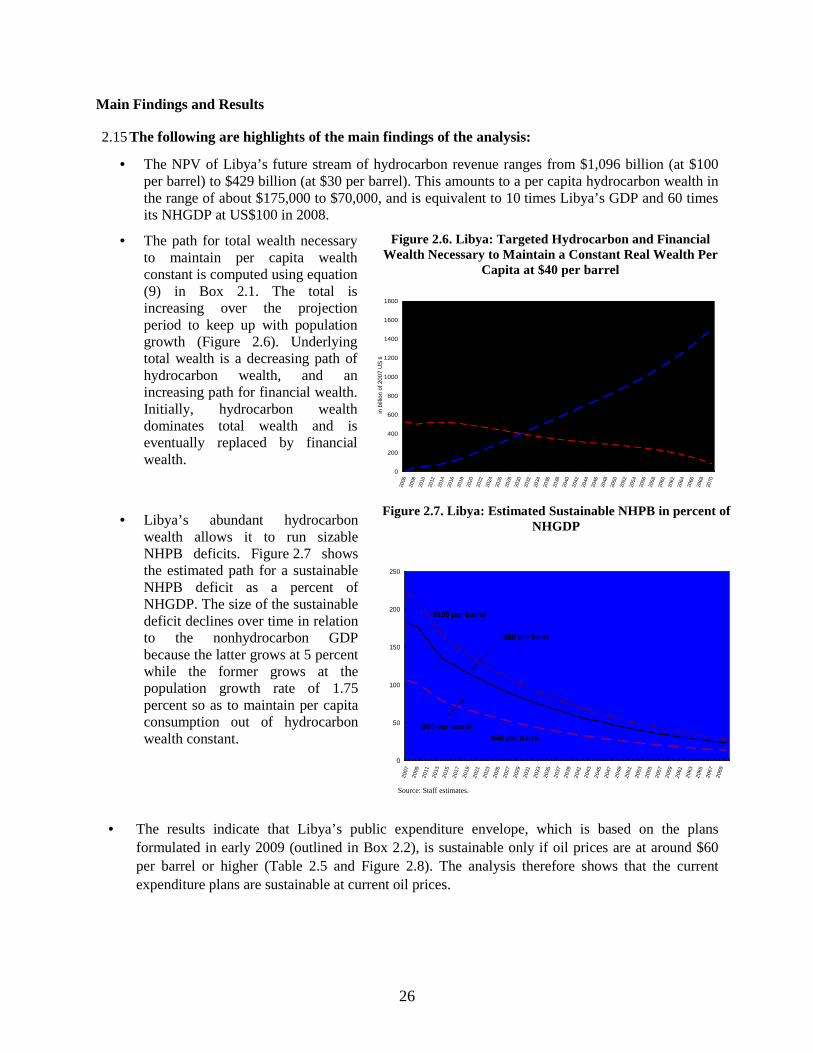
26
Main Findings and Results
2.15 The following are highlights of the main findings of the analysis:
• The NPV of Libya’s future stream of hydrocarbon revenue ranges from $1,096 billion (at $100 per barrel) to $429 billion (at $30 per barrel). This amounts to a per capita hydrocarbon wealth in the range of about $175,000 to $70,000, and is equivalent to 10 times Libya’s GDP and 60 times its NHGDP at US$100 in 2008.
• The path for total wealth necessary to maintain per capita wealth constant is computed using equation (9) in Box 2.1. The total is increasing over the projection period to keep up with population growth (Figure 2.6). Underlying total wealth is a decreasing path of hydrocarbon wealth, and an increasing path for financial wealth. Initially, hydrocarbon wealth dominates total wealth and is eventually replaced by financial wealth.
• Libya’s abundant hydrocarbon wealth allows it to run sizable NHPB deficits. Figure 2.7 shows the estimated path for a sustainable NHPB deficit as a percent of NHGDP. The size of the sustainable deficit declines over time in relation to the nonhydrocarbon GDP because the latter grows at 5 percent while the former grows at the population growth rate of 1.75 percent so as to maintain per capita consumption out of hydrocarbon wealth constant.
• The results indicate that Libya’s public expenditure envelope, which is based on the plans formulated in early 2009 (outlined in Box 2.2), is sustainable only if oil prices are at around $60 per barrel or higher (Table 2.5 and Figure 2.8). The analysis therefore shows that the current expenditure plans are sustainable at current oil prices.
Figure 2.6. Libya: Targeted Hydrocarbon and Financial Wealth Necessary to Maintain a Constant Real Wealth Per
Capita at $40 per barrel
0
200
400
600
800
1000
1200
1400
1600
1800
2006
2008
2010
2012
2014
2016
2018
2020
2022
2024
2026
2028
2030
2032
2034
2036
2038
2040
2042
2044
2046
2048
2050
2052
2054
2056
2058
2060
2062
2064
2066
2068
2070
inbi
llion
of20
07U
S$
Total wealth
Hydrocarbon Wealth
Financial wealth
$50 pb
Figure 2.7. Libya: Estimated Sustainable NHPB in percent of NHGDP
0
50
100
150
200
250
2007
2009
2011
2013
2015
2017
2019
2021
2023
2025
2027
2029
2031
2033
2035
2037
2039
2041
2043
2045
2047
2049
2051
2053
2055
2057
2059
2061
2063
2065
2067
2069
Source: Staff estimates.
$100 per barrel
$60 per barrel
$80 per barrel
$40 per barrel
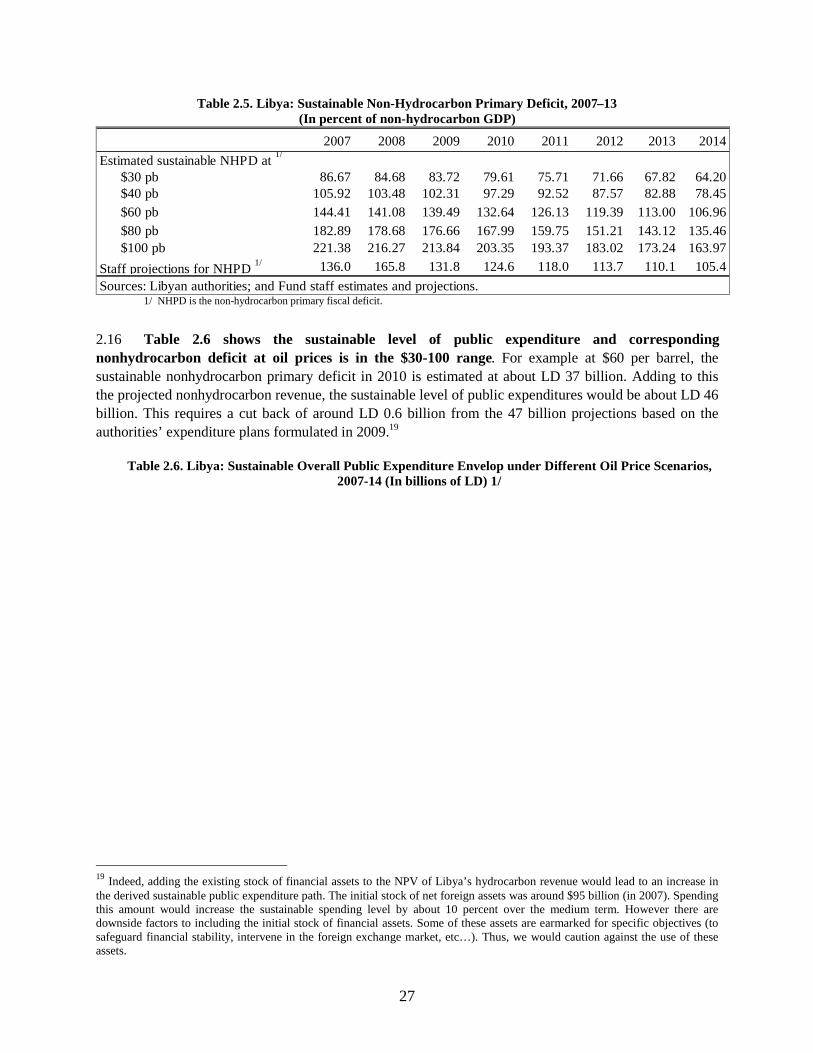
27
Table 2.5. Libya: Sustainable Non-Hydrocarbon Primary Deficit, 2007–13 (In percent of non-hydrocarbon GDP)
2007 2008 2009 2010 2011 2012 2013 2014
Estimated sustainable NHPD at 1/
$30 pb 86.67 84.68 83.72 79.61 75.71 71.66 67.82 64.20$40 pb 105.92 103.48 102.31 97.29 92.52 87.57 82.88 78.45$60 pb 144.41 141.08 139.49 132.64 126.13 119.39 113.00 106.96$80 pb 182.89 178.68 176.66 167.99 159.75 151.21 143.12 135.46$100 pb 221.38 216.27 213.84 203.35 193.37 183.02 173.24 163.97
Staff projections for NHPD 1/ 136.0 165.8 131.8 124.6 118.0 113.7 110.1 105.4
Sources: Libyan authorities; and Fund staff estimates and projections.1/ NHPD is the non-hydrocarbon primary fiscal deficit.
2.16 Table 2.6 shows the sustainable level of public expenditure and corresponding nonhydrocarbon deficit at oil prices is in the $30-100 range. For example at $60 per barrel, the sustainable nonhydrocarbon primary deficit in 2010 is estimated at about LD 37 billion. Adding to this the projected nonhydrocarbon revenue, the sustainable level of public expenditures would be about LD 46 billion. This requires a cut back of around LD 0.6 billion from the 47 billion projections based on the authorities’ expenditure plans formulated in 2009.19
Table 2.6. Libya: Sustainable Overall Public Expenditure Envelop under Different Oil Price Scenarios, 2007-14 (In billions of LD) 1/
19 Indeed, adding the existing stock of financial assets to the NPV of Libya’s hydrocarbon revenue would lead to an increase in the derived sustainable public expenditure path. The initial stock of net foreign assets was around $95 billion (in 2007). Spending this amount would increase the sustainable spending level by about 10 percent over the medium term. However there are downside factors to including the initial stock of financial assets. Some of these assets are earmarked for specific objectives (to safeguard financial stability, intervene in the foreign exchange market, etc…). Thus, we would caution against the use of these assets.

28
2007 2008 2009 2010 2011 2012 2013 2014
Estimated sustainable nonhydrocarbon primary deficit (Real)
Low ($40 pb) 20.6 20.9 21.3 21.7 22.1 22.4 22.8 23.2Per-capita (in ’000 US dollars) 3.4 3.4 3.4 3.4 3.4 3.4 3.4 3.4
Estimated sustainable nonhydrocarbon primary deficit (Nominal)Low ($40 pb) 20.6 23.3 25.1 27.0 28.7 30.3 32.1 34.0Medium ($60 pb) 2/ 28.0 31.7 34.2 36.7 39.1 41.3 43.7 46.3
High ($80 pb) 35.4 40.2 43.4 46.5 49.5 52.4 55.4 58.6High ($100 pb) 42.9 48.7 52.5 56.3 59.9 63.4 67.1 71.0
Derived sustainable public expenditureLow ($40 pb) 24.6 28.8 33.9 36.6 39.1 41.7 44.4 47.4Medium ($60 pb) 2/ 32.0 37.2 43.1 46.3 49.5 52.7 56.1 59.7High ($80 pb) 39.5 45.7 52.2 56.1 59.9 63.7 67.7 72.1High ($100 pb) 46.9 54.2 61.3 65.9 70.3 74.7 79.4 84.4
Nonhydrocarbon primary revenue 4.0 5.5 8.8 9.6 10.4 11.3 12.3 13.4Public expenditures 30.9 44.8 43.7 47.0 50.6 54.7 59.2 64.2
Needed adjustment in public expenditureLow($40 pb) 6.3 16.0 9.7 10.4 11.6 13.0 14.7 16.8Medium ($60 pb) 2/ -1.1 7.6 0.6 0.6 1.1 2.0 3.1 4.5High ($80 pb) -8.6 -0.9 -8.5 -9.2 -9.3 -9.0 -8.6 -7.9High ($100 pb) -46.9 -54.2 -61.3 -65.9 -70.3 -74.7 -79.4 -84.4
Sources: Libyan authorities; and Fund staff estimates and projections.1/ Using 2008 period average exchange rate.2/ Libya’s average crude oil export price over the past five years is about $63 per barrel
Figure 2.8. Libya: Price Sensitivity Analysis Figure 2.9. Libya: Interest Rate Sensitivity Analysis
40
90
140
190
240
2007 2008 2009 2010 2011 2012 2013 2014
Libya: Nonhydrocarbon Primary Deficit (NHPD) Projections In percent of Nonhydrocarbon GDP (NHGDP) at different price levels
Source: Staff estimates.
US $60 pb
Staff Projections for Nonhydrocarbon Primary Deficit (NHPD)in percent of NHGDP
(Shaded area)US $80 pb
US $100
US $40 pb
40
90
140
190
240
2007 2008 2009 2010 2011 2012 2013 2014
Source: Staff estimates
i=6
At $60 per barrel
i=5
i=4
Staff Projections for Nonhydrocarbon Primary Deficit (NHPD)in percent of NHGDP
(Shaded area)
Libya: Nonhydrocarbon Primary Deficit (NHPD) Projections In percent of Nonhydrocarbon GDP (NHGDP) for different discount rates at US$80
IV. Dealing with Methodological Limitations 2.17 Because of the uncertainty associated with oil prices and other assumptions used in this analysis, the results should be interpreted with caution and updated periodically. The FSA provides benchmarks on sustainable public spending on the basis of specific assumptions on a set of variables (oil prices, interest rates, oil production profile, etc...). Since prices of nonrenewable resources such as oil may not have an average price that is constant over time, it makes difficult to distinguish between transitory and permanent income. As a result the analysis follows a price-setting assumption for five different oil price scenarios that are constant over the analysis time horizon for a clearer understanding of the driving

29
forces underlying the analysis.20 These prices generate sustainable envelopes that encompass a wide possible range of simulated fluctuations in oil prices. Comparing these envelopes with actual or planned expenditures determines the sustainable oil price that is consistent with these expenditures.21
2.18 In addition to their sensitivity to oil prices, the results are also sensitive to changes in the assumption regarding the interest rate accrued on financial wealth. For example, at $60 price per barrel, a one percentage point decline in the assumed interest rate would significantly reduce the sustainable benchmark (Figure 2.9).
2.19 There are clear benefits from having in place stabilization/saving fund such as the LIA. The FSA sustainable benchmarks are a function of oil prices. The higher the prices the higher the sustainable spending envelope. The FSA does not deal with cyclicality issues because these are short term considerations that are beyond the scope of the FSA. They are better dealt with in the overall fiscal policy formulation, which affects the actual expenditure level and, consequently, its deviation from the FSA benchmark. Fiscal sustainability simply requires that part of oil wealth be saved (in a stabilization fund or elsewhere) to ensure intergenerational equity (e.g., constant wealth per capita).
V. Policy Recommendations
2.20 Based on this approach, at current oil prices of $60-80 per barrel, Libya’s expenditure plans, as done by the General People’s Committee for Planning and Finance (GPCPF), are sustainable. The results show that public expenditure plans remain sustainable even if oil prices decline to $60 per barrel over the medium-term. Expenditure in 2009 show a small decline compared to 2008. This is a clear break with the very large increases in past years and is consistent with Libya’s policy to rationalize public investment. Had the earlier plans formulated in early 2008 remained in effect, an oil price around $80 per barrel would have been necessary to ensure sustainability. At $60 per barrel, the sustainable public expenditure envelope is about LD 43 billion in 2009. This is similar to the present expenditure level for 2009. The key policy recommendations arising from these findings are:
• Existing public expenditure plans are sustainable with current oil prices. The recent reverse in public expenditure growth is a welcome step. However, in cutting back public expenditure, focus should be on completing key projects that are already under way. Current expenditures, including wages, need to be contained.
• Any disbursements plans under the WDP should be within the overall sustainable expenditure envelope. If the WDP goes forward, such disbursements should be limited and aimed whenever possible at replacing existing transfers and explicit subsidies in the context of a comprehensive reform program that enhances targeting and efficiency, with a net positive effect on the budget.
• In considering public expenditure plans within the overall sustainable envelope, provisions should be made for the relatively large contingent fiscal liabilities such as the non-performing loans of state-owned commercial and specialized banks.
20 It follows by construction that the calculated sustainable upper limit is smooth and does not fluctuate. The upper limit only shifts up with an assumed higher price. 21 Thus, higher expenditure under an expansionary and countercyclical fiscal policy would be sustainable with a higher oil price—where sustainability under the permanent income approach looks at the inter-temporal smoothing of public spending with a view to maintain intergenerational equity. The analysis stresses that deviations are desirable and financing higher spending beyond the sustainable upper limit can be financed, if needed, from the oil fund or other sources, like bonds issued. In this way, such deviations from the sustainable benchmark do not entail that Libya faces a liquidity constraint.
30
• Within the estimated sustainable public expenditure benchmarks, emphasis should be placed on the quality of expenditure in order to ensure that mineral wealth is transformed into high quality assets.
• The estimated overall expenditure envelope should be reviewed periodically as key variables change, particularly the price of oil. This chapter provides the sustainable expenditure levels at different oil price scenarios. The analysis is, however, also sensitive to other variables. The results should, therefore, be interpreted with caution.
• Public savings remaining after meeting the sustainable expenditure benchmarks should be wisely invested abroad by the Libyan Investment Authority on conservative investments following commercial objectives. This usually helps prevent a suboptimal domestic investment of these resources due to political pressure. It would also help avoid complicating the macroeconomic management of the domestic economy. However, this does not totally exclude the use of such resources to finance domestic projects in exceptional cases or for short term counter-cyclical stabilization purposes.
• Deviations from these benchmarks could in fact be desirable. However, should be limited, temporary, and well-justified by economic conditions. In addition to sustainability considerations, the fiscal stance also needs to be guided by the objective of maintaining overall macroeconomic stability and social development goals. If oil prices decline below $60 per barrel, the authorities would need to revisit their public expenditure plans, taking into consideration all of the above objectives and not only the long-term sustainability indicative benchmarks. Given the exchange rate peg, fiscal policy remains the main tool for ensuring price stability. The fiscal stance would, therefore, need to be assessed periodically, including in the context of annual Article IV consultations with the IMF, taking into consideration the overall economic conditions facing Libya.

31
Chapter 3: The Contribution of Civil Service reform to Fiscal Sustainability A productive and adequately remunerated civil service is the complementary link to sound public service provision. In the early to mid-2000s, during the decentralization period, Libyan authorities simultaneously supported two public sector reforms that effectively compete and work against each other. In theory, they launched a progressive effort to streamline, improve, and enhance the productivity of the Libyan Public Administration (LPA). Yet, in practice, they dramatically scaled up employment in LPA to help absorb country’s overly abundant supply of underemployed labor. The latter decision was linked to the overarching philosophy of decentralization in which shaabiats (regions) progressively assumed primary administrative and political responsibilities for their populations, including human resource management (HRM) in most of the sectors. Concomitantly, opportunities for social-based job patronage greatly expanded; and as a direct result, the LPA workforce almost tripled from 2000 to 2006—from around 400,000 to almost 1.2 million workers. Overstaffing encouraged moonlighting and absenteeism from work, in turn leading to inefficiency, lost productivity, and further deterioration in the quality of public services. To make matters worse, basic wages were frozen between 1981 and 2007, and became heavily eroded by inflation, informally justifying extra promotions and salary bonuses that are entirely delinked from performance. The fiscal cost of Libya’s wage bill has risen to among the highest in the world and represents a heavy budgetary burden. Early efforts to reform the system with “soft measures” such as voluntary downsizing and redeployment of personnel had little impact on the overall situation. Under recentralization, the Libyan authorities in 2006 sought to recapture control of HRM and aggressively launched a far-reaching civil service reform, including sizable involuntary retrenchment and wage reforms. Their objective is not only to support a lower payroll cost, but to reduce LPA staff by two thirds in the medium term while improving remuneration for the best employees who are retained. The results of the first phase of the reform (2006-07) have been successful, with more than a third of LPA personnel excluded from the establishment or fired and partial wage-reform implemented. The second phase reform (ongoing) should complete the retrenchment program.
I. Introduction 3.1. In the early 2000, Libya led a process of deepening decentralization.22 In particular, important policy changes in March 2000 awarded increased political and management power to local administrations. Twelve general people’s Committees were abolished, and their responsibilities were shifted to regional shaabiats.23 The shaabiats became legal entities with political authority, administrative and planning responsibilities, and considerable financial independence. Decentralization was further accelerated in most sectors by shifting human resources (HRM) management to the shaabiats, including in employment-intensive sectors such as education, health, agriculture, roads, water, and electricity services. The shaabiats thus became major actors in the implementation of HRM policies, including the level of pay and compensation for civil servants who they hired.
22 Libya deepened its decentralization program by substituting shaabiats for municipalities in 1998. Twenty-six shaabiats were put in place, and five more were created subsequently, for a total
of 31 shaabiats and 415 Basic Popular Congresses. 23 Secretariats for foreign affairs, justice, public security, and finance remained under the authority of a central General People’s Committee. The abolished secretariats were: industry and
mines, communications and transports, energy, agriculture, livestock resources, sea resources, health and social security, dwelling and facilities, youth and sports, education and training,
planning, and economy and commerce.

32
II. The Size the Libyan Public Administration 24 and its Macroeconomic Implications 3.2. Excessive overstaffing resulted from weak governance in the aftermath of regional decentralization. Not only did most shaabiats’ managers not have the managerial and technical preparation for an adequate human resource management, but also they were highly subject to social pressure. Although unemployment is officially estimated at low levels (less than 10 percent), underemployment are relatively high (officially 17 percent). Underemployment stems from the sizeable recruitments by the public sector as a solution to absorb the rising jobless, mainly among young graduates. In the absence of a dynamic private sector, the state had long served as the employer of last resort for the growing population, especially for young adults coming out of schools and universities. Social patronage networks and their corollary of petty corruption further encouraged excessive recruitment. Source: World Bank staff estimates.
3.3. Under these circumstances, the size of the LPA grew rapidly. General government employment increased more rapidly in Libya than for any of the 74 comparator countries25 for which data are available (other than Timor-Leste)—an average growth of almost 18 percent annually during 2000–05 (Figure 3.1). The public administration workforce more than doubled over this period, from about 403,000 civil servants in 2000 to almost 920,000 in 2005. The LPA workforce soared again in 2006 to reach near 1.2 million workers. 3.4. The LPA became hugely overstaffed. By 2005, more than half of employed Libyans (60 percent) were working in the LPA. With respect to total population, the rate of public employment in Libya soared to among the highest in the world26 (almost 18 percent). (Figure 3.2).
24 Public administration is defined here as the total of all civil servants. This includes public education, health and security personnel, working at the central and regional public institutions. 25 Where employment data are not available for the reference period (2000–05), data for closer periods have been used. 26 For example, public administrations in LAC and ECA accounted for less than 7 percent of national population and less than 18 percent of total employment over 2000–05.
- 5 0 5 10 15 20
T imor- LesteL ibya
UkraineS aint Helena
CubaCosta Rica
T rinidad and T obagoGabon
EthiopiaBrazil
GeorgiaDominican Republic
S painLuxembourg
IrelandUgandaS enegalMoldova
CyprusHungaryGreece
Macau, ChinaPortugal
BotswanaMauritiusS lovakia
United K ingdomS witzerland
S loveniaCanadaPanama
CongoGuatemala
S erbiaUruguay
FranceS ri L anka
FinlandL atvia
NetherlandsEs toniaRuss ia
S ingaporeMacedonia
S wedenCzech Republic
NorwayS yria
L ithuaniaArmenia
MaltaKyrgyzstan
New ZealandBelarus
ItalyDenmark
American S amoaMexicoAlbania
S an MarinoBolivia
MoroccoGermanyBulgaria
JordanBrunei Darussalam
ZimbabweCroatia
Hong Kong, ChinaPoland
IndonesiaPhilippinesAzerbaijan
S outh Africa
Figure 3.1: Growth of General Government Employment, by Country, Annual Average 2000–05

33
Source: World Bank staff estimates.
3.5. Public employment policies exert a strong effect on macroeconomic balances. An out-of-control wage bill undermines capacity for fiscal discipline. This can best be measured as payroll as a proportion of nonhydrocarbon (NHC) tax revenues. While the payroll-revenues ratio was close to 80 percent in 2000 (already high), it stood at 151 percent in 2005. 3.6. Inefficient employment policies hinder private sector development. The size and skill mix of the resulting hires rarely meet the needs of efficient governance (Libya Human Development Report, 2002), which has the knock-on effect of impairing private sector capacity to provide quality services. 3.7. The disproportionate wage bill relative to tax revenues and total expenditures also creates distortions. It creates an imbalance between the number of managers and workers, as well as imbalance between professionals, skilled, and unskilled workers (Libya Human Development Report, 2002). Overstaffing and inappropriate skills mix led to widespread absenteeism and the use of government time to conduct nonofficial business and moonlighting during office hours. 3.8. Overemployment and redundancies particularly plagued the education sector. Available data for 2006-07 show an average of 3.2 pupils per teacher in Libya’s primary schools, a ratio far below that of any country in the world, including the developed ones (Figure 3.3). Indeed, the average pupil-teacher ratio in low and middle-income countries was 31 in 2005, with the lowest ratio in Cuba (10) and the highest in the Republic of Congo and Afghanistan (83). In OECD countries, the average ratio stood at 16, with variations from 11 in Greece to 28 in Mexico. In MENA region, the ratio was 22, with the lowest in Qatar (11) and the highest (27) in Morocco (World Development Indicators, 2006–07). The Libyan magazine Attaalim (Education) May 2008 reported one case (reported as nonexceptional) in which a school with 180 pupils employed 600 teachers. 3.9. Systematic overemployment translated to unreasonably light workloads for teachers, as well as an overstocked pool of reserve teachers. On average, primary teachers taught fewer than 10 course sessions per week (this compares to the average of 18-24 class-sessions per week in most countries). Teachers without classes to teach were assigned to the reserve pool, rather than terminated or redeployed. The reserve pool accounts for about 20 percent of all teachers on average. As shown in Figure 3.4, there are large disparities among shaabiats—from zero percent in Mrada to 26 percent in Al-Kufrah. Al-Kufrah (with only 2,600 teachers) had the highest ratio of reserve pool (26 percent).
Figure 3.2: The Public Administration in Libya is Overstaffed, MENA Comparators (percent of total population and percent of total employment)
0
3
6
9
12
15
18
21
LAC ECA Morocco Jordan Libya
Public Administration as a Share of total Population
žžž žž
LAC ECA M J L
Public Administration as a Share of total Employment
žžž žž

34
Figure 3.3: Pupil–Teacher Ratios for 167 Countries (2005 data in most cases)
Pupil-Teacher Ratio, 2005
0 10 20 30 40 50 60 70 80 90
AfghanistanCentral African Republic
Sierra LeoneMalaw i
Rw andaMali
CambodiaBangladesh
UgandaCameroon
Burkina FasoSenegal
Guinea-BissauCôte d'Ivoire
LesothoIndia
KenyaPakistan
NigeriaSouth AfricaGambia, The
DjiboutiCongo, Democratic Republic of the
TogoNamibiaGhana
Equatorial GuineaGuatemala
BurmaTurkey
Korea, SouthMexico
GuyanaSudan
ChileSingapore
Cape VerdeAlgeriaSamoa
KyrgyzstanPanama
Saint LuciaOman
EcuadorBelize
MauritiusEgypt
VietnamCosta Rica
ArmeniaUruguay
TunisiaTonga
MaldivesMacedonia, Republic of
Netherlands AntillesSolomon Islands
JapanAntigua and Barbuda
VenezuelaSurinameDominica
United KingdomSaint Vincent and the Grenadines
AustraliaGrenada
Saint Kitts and NevisTrinidad and Tobago
RomaniaArgentina
American SamoaMarshall Islands
RussiaNew Zealand
BelarusPalau
United Arab EmiratesSlovenia
CroatiaLebanonGermany
EstoniaMonaco
AzerbaijanLatvia
PolandKuw ait
PortugalAndorra
QatarIceland
HungaryBrunei
DenmarkBermuda
Libya
Source: World Development Indicators Source: GPCMP.

35
III. Compensation Policies and their Implications for the Wage Bill
3.10. Before the reform of the wage system in 2007, nonwage allowances accounted for a significant share of total compensation for civil servants in Libya. Total compensation includes the base salary associated with the grade and echelon, and allowances on top of that. Allowances are discretionary; most are annual. Some are theoretically related to productivity. Allowances can cover housing, clothes, family, and other areas. While the housing allowance alone represented only 8 to 13 percent of the gross salary for the upper 11-14 grades, it represented 16 to 29 percent for the lower 1 to 5 pay grades. 3.11. The system of allowances has compressed the basic pay system, leading to imbalanced and inefficient skills mix. Wage compression27 appears consistent with the increasing supply of educated and professional workers. Acute wage compression reduces incentives to attract and retain qualified civil servants, especially physicians, professors, engineers, and top managers.
Source: World Bank staff estimates.
27 Wage compression is defined as the narrowness of the range between the lowest and the highest salaries.
0
20
40
60
80
100
120
1981
1982
1983
1984
1985
1986
1987
1988
1989
1990
1991
1992
1993
1994
1995
1996
1997
1998
1999
2000
2001
2002
2003
2004
2005
Real w ages Real GDP per capita
Figure 3.5: Decline of Real Wages and GDP per Capita, 1981–2005 (1981=100)
0
10,000
20,000
30,000
40,000
50,000
60,000
Al-Ku
frah
Al-Jif
arah
Sabra
tahan
dSurm
anTri
poli
Az-Z
awiya
hDa
rnah
Bani
walid
An-N
uqat
Alkh
ams
Wad
iAsh
-Sha
tiAjd
abia
Bang
hazi
Ghary
anYa
franw
aJad
uTa
juraa
ndNa
wahi
Al-Ja
balA
l-Akh
dar
Al-M
arj Sirt
Al-Bu
tnan
Tarhu
nah&
Msalt
ataNa
lutAl
-Hiza
mAl-
Akhd
arAl-
Jufra
hMi
sratah
Al-Ma
rqab
Al-Q
ubba
hSa
bha
Wadi
Akha
yat
Ghad
amis
Marzu
qAl-
Waha
hGh
atMi
zdah
Al-Q
atrun
Jagb
obMr
ada
0
5
10
15
20
25
30
T otal teachers Reserve pool share, in % (right axis )
Figure 3.4: Number of Primary and Secondary Teachers and the Size of Reserve Pools, by Shaabiyat
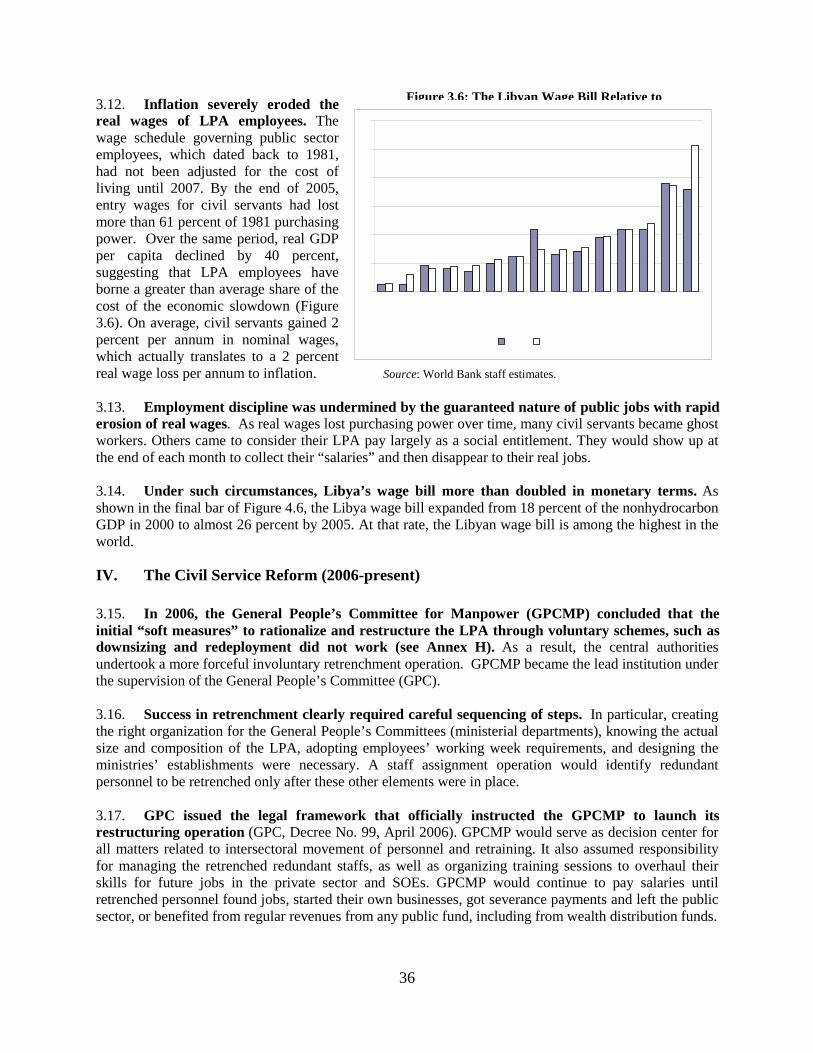
36
3.12. Inflation severely eroded the real wages of LPA employees. The wage schedule governing public sector employees, which dated back to 1981, had not been adjusted for the cost of living until 2007. By the end of 2005, entry wages for civil servants had lost more than 61 percent of 1981 purchasing power. Over the same period, real GDP per capita declined by 40 percent, suggesting that LPA employees have borne a greater than average share of the cost of the economic slowdown (Figure 3.6). On average, civil servants gained 2 percent per annum in nominal wages, which actually translates to a 2 percent real wage loss per annum to inflation. Source: World Bank staff estimates.
3.13. Employment discipline was undermined by the guaranteed nature of public jobs with rapid erosion of real wages. As real wages lost purchasing power over time, many civil servants became ghost workers. Others came to consider their LPA pay largely as a social entitlement. They would show up at the end of each month to collect their “salaries” and then disappear to their real jobs. 3.14. Under such circumstances, Libya’s wage bill more than doubled in monetary terms. As shown in the final bar of Figure 4.6, the Libya wage bill expanded from 18 percent of the nonhydrocarbon GDP in 2000 to almost 26 percent by 2005. At that rate, the Libyan wage bill is among the highest in the world.
IV. The Civil Service Reform (2006-present) 3.15. In 2006, the General People’s Committee for Manpower (GPCMP) concluded that the initial “soft measures” to rationalize and restructure the LPA through voluntary schemes, such as downsizing and redeployment did not work (see Annex H). As a result, the central authorities undertook a more forceful involuntary retrenchment operation. GPCMP became the lead institution under the supervision of the General People’s Committee (GPC). 3.16. Success in retrenchment clearly required careful sequencing of steps. In particular, creating the right organization for the General People’s Committees (ministerial departments), knowing the actual size and composition of the LPA, adopting employees’ working week requirements, and designing the ministries’ establishments were necessary. A staff assignment operation would identify redundant personnel to be retrenched only after these other elements were in place. 3.17. GPC issued the legal framework that officially instructed the GPCMP to launch its restructuring operation (GPC, Decree No. 99, April 2006). GPCMP would serve as decision center for all matters related to intersectoral movement of personnel and retraining. It also assumed responsibility for managing the retrenched redundant staffs, as well as organizing training sessions to overhaul their skills for future jobs in the private sector and SOEs. GPCMP would continue to pay salaries until retrenched personnel found jobs, started their own businesses, got severance payments and left the public sector, or benefited from regular revenues from any public fund, including from wealth distribution funds.
0
5
10
15
20
25
30
Kaz
akhst
an
Geo
rgia
Ven
ezuel
a
Pola
nd
Lat
via
EC
A
LA
C
Lib
ya
Egyp
t
Alg
eria
Iran
ME
NA
Moro
cco
Jord
an
Lib
ya
wrt
NH
CG
DP
2000 2005
Figure 3.6: The Libyan Wage Bill Relative to

37
3.18. The reform aimed to cut the LPA workforce in half through involuntary downsizing. Downsizing of this scale was not only ambitious but also virtually unprecedented, in Libya or elsewhere in the world. Given the huge size of civil service in the labor force—60 percent of the 2005 total employment—slashing half of personnel presents a formidable challenge with significant social and political implications. The authorities planned to carry out the operation in two phases—to reduce the LPA workforce from 930,000 to 600,000 employees during the first phase (launched in 2007) and further reduce the LPA in the second phase to the targeted number, 467,000 workers (from 2009 onwards). 28
3.19. The success of involuntary retrenchment of this size has to be ensured through a tailored retrenchment scheme including generous severance packages to dilute anticipated resistance. Furthermore, abruptly laying off hundreds of thousands civil servants, poorly skilled, in a context of embryonic and sluggish private markets would undoubtedly lead to social pressures and unrests, and thus would pose a serious risk to the success of the reform. Consequently, the devised retrenchment scheme was implemented in three steps. First, the GPCMP isolated the redundant personnel from the rest of the civil servants who were selected to be part of the establishment. Second, the GPCMP continued to pay salaries of the retrenched provided they attend training programs on a regular basis to enhance their skills and improve their chances to integrate the labor markets as salaried workers or entrepreneurs. However, the salaries of the retrenched did not benefit from salary revalorizations that benefited the civil servants kept in the LPA. Third, it urged most of the retrenched to leave definitely the training centers and thus the LPA, through various and tailored severance packages (see below for details). Given the political economy settings of Libya, most of these packages were generous by international standards, (Table 3.1). 3.20. Given the political economy factors that led to LPA overstaffing in the first place, a downsizing operation of this scale would necessarily demand absolute political support. It also required excellent coordination among design and implementation bodies, full information, and reliable data. In what regards the latter, originally no database of civil servants was available at the central administration at the time of the decision. Thus, the GPC decided to create a centrally managed database located in GPCMP for the entire civil service (through Decree 93 of April 2006). The central database would be developed as an HRM tool. 3.21. To conduct its civil service census, GPCMP set up working groups and commissions totaling more than a thousand staff.29 It accomplished this herculean task in surprisingly little time. With the tool at hand, authorities have been able to assess the size of the LPA and its composition by sector, gender, age, education, grade, echelon, job category, seniority, and location. The database revealed innumerable cases of illegal hiring and violations of regulations (134,664 were illegally hired)—for example, questionable hiring of civil servants who were legally too young to work. Many of these “veteran workers” turned out to still be minors even after many years LPA “employment.” In other cases, older persons well beyond the mandatory retirement age were found to still be on the employment rolls, if not actually working. Many cases of doubledipping surfaced—two jobs in the same sector but in two different shaabiats, two jobs in different sectors in the same shaabiat, or one paid job in the LPA and another in an SOE. A great many civil servants were found to be moonlighting with second or even third full-time jobs in private firms. Others had accepted the generous subsided loans for business startups, but had continued to maintain their status as civil servants.
28 The exact number of the LPA has been determined at almost 1.2 million by the GPCM after it conducted a civil service census in 2006.. 29 GPCMP set up a central committee, 17 subcommittees, and 74 working groups—a total of 1,050 people.

38
Table 3.1: Comparison of Libya’s Retrenchment Program with those of Morocco, Hong Kong, and BrazilItems Libya Morocco Hong Kong Brazil (Federal state)
Date of program/enrollment period
2006/on-going 2005/January 1st through June30 2003/January 1st through June30 1996/ November 21 throughDecember 18, 1996
Nature of the program Involuntary Voluntary Voluntary VoluntaryTarget population Not targeted
All civil servants of thecentral and local administrations,regardless of gradeor seniority
Not targetedAll civil servants of thecentral government,regardless of gradeor seniority. Civilservants taking regularly scheduledretirements in 2005 arenot eligible
TargetedCivil servants in somegrades (229),except: contractorsand thoseundermonth-to-month contracts; or already intheprocess of taking an early retirement;or fewer than fiveyears left until normalretirement
TargetedCivil servantswith less than asecondary school education
Severance premiums orpackage
Retrenched civil servantscontinued to benefit from theirsalaries from theWealth Distribution Fund (WDF).Salary payments from theWDF would stop for thosefinding jobs in theprivatesector, SOEs, or startingbusinesses. TheFund finances those ready to start-up abusiness through concessional loans (loans would benefitfrom a 5-year graceperiod and adiscount of 20 percent ofthe total valueof thecapital and interests). Businesses inindustry, agriculture, health, education, consultingservices, environment, and import-export would receivea5-year exoneration of customsduties, revenue taxes, andproduction taxes. Others receiveexonerations fromcustoms duties for 5 years and benefit from training.
1 ½ month's salary for each year of service
A ceiling of 36 months applies to levels 6and above
The premium may not exceed 50% of thecumulative salary that the civil servant wouldhave received if he had not opted for avoluntary departure
The premium is tax-exempt.
One month of salary for every 2 full yearsof service
No pro rata payment for periods ofservice less than 2 years
A ceiling of 14 months of salary applies
The departure premium (including theportion of the pension converted into alump-sum premium) may not exceed 14times one-half of the annual pension thatthe beneficiary would have received uponreaching normal retirement age.
The premium is calculated as:
1 month of gross salary for everyyear of service up to 14 years
1 ½ months of salary for years ofservice between 14 and 24 years
1.8 months of salary for years ofservice after 24 years
In addition: 25% of the premium ifthe candidate applies beforeDecember 5; 5% between December6 and December 10. The premium istax-exempt
Pension In case a beneficiary opts for early retirement, prevailingregulations apply. Otherwise, beneficiaries would receivetheir pensions when the regulatory age is reached,provided they accumulate the mandatory minimum yearof service.
If minimum conditions for receiving apension are met (15 years for women and 21years for men), two rates apply: 2% of grosssalary per year of service up to the normalretirement age; 2.5% of gross salary for eachyear of service beyond the normal retirement.Pension payouts begin immediately uponretirement. Civil servants not meeting theminimum service requirements may recovertheir contributions to the retirement fund.
If the minimum condition of service (10years) is met for receipt of the pension:1.8% of gross salary for each year ofservice. Pension payouts beginimmediately upon the voluntaryretirement. Option of converting pensionpayments into a lump sum payableimmediately, for at most one-half of theannual pension. The lump sum is 14 timesthe annual amount of converted pension.
According to prevailing regulations
Number of candidates 50,561 (10% of civil servants) 30,000 (5.5% of federal civil serv.)Beneficiaries/retrenched By end 2007, 422,729 civil servants were kept out of the
establishment: 288,065 in the training centers and134,664 were fired as they were illegally hired.
38,600 (7.6% of civil servants) 5,300 (3% of civil servants) 9 499 (< 2% of federal civilservants)
Amount of departurepremiums
Various severance packages, but most translate into apackage representing the sum of the remaining salariesuntil the date of retirement, provided in one installment oreach month until the regulatory retirement age.
MAD 11.8 billion= USD 1.3 billion. (2.3%of GDP)
HK$ 6 billion= USD 0.769 billion. (0.5%of GDP)
R$ 183 million(low amount relative to GDP)
Salary savings underthe program (% GDP)
LD 730 million/year=US$ 588 million/year or 0.92percent of GDP/ year. (based on prevailing wage rates)
MAD 4.5 billion/year or 1% of GDP/year HK$ 2,4 billion= USD 0.308 billion /yearor 0.19% of GDP
R$ 111.6 million/year(low amount relative to GDP)
Overall savings underthe program (% GDP)
No significant savings for the State until the retrenchedfind jobs in the private sector or start a business.However, budgetary savings would be around LD onebillion/year=US$ 806 million/year or 1.3 % of GDP/year
0.5 percent of GDP/yearOverall savings take into account net salarysavings realized through the departurepremium
HK$ 2.2 billion = USD 0.282 billion/year(0.16% of GDP)
n.a.

39
3.22. In the second step, LPA department were urged to design their staffing structures. First, the GPCMP organized intensive workshops to train staff and prepare the new structures. To ensure a measure of uniformity, GPCMP created standard forms. The solid organization of the training process helped to speed up and make this process work. With the notable exceptions of education and health, most sectors and shaabiats achieved their organizational design by February 2007. 3.23. GPCMP and GPC provided close and steady follow-up to education. In particular, a standard work burden organization and staffing structure was designed for the education sector. A minimum of class sessions per week were defined, as a mean to measure teachers’ productivity and efficiency. Using this definition, teachers work burden was adjusted to match generally accepted international standards. Initially, standards were set for primary teachers.30 Then, the workload for secondary teachers was set at 16 sessions per week. All these indicators were based on a ratio of 30 pupils per classroom. This defined a reserve pool of teachers equivalent to 20 percent of total number of full-time teachers.31
3.24. The third step concerned staff selection as part of the staffing structures. This was the hardest yet most important part of the process because it ultimately separates those who stay from those who leave. The authorities organized three meetings at the level of Secretary Generals to review the selection and designation of staff in the centrally or regionally managed sectoral staffing structures. At the local level, sectoral commissions in shaabiats were set up to carry out the selection and assignment operations. Excepting the education sector, all sectors submitted their filled structures by April 2007. Overall, most departments were able to select and assign civil servants to their adopted establishments in less than two months. Notwithstanding shortcomings in some sectors and obvious mis-assignments, the overall success of this operation was a remarkable achievement. 3.25. In the special case of education, swift implementation of the selection and assignment process was stymied by overstaffing, lack of reliable data, and social patronage. In addition, the impending opening of the 2006–07 school year required caution to avoid the risk of disruption of education services. The GPC of General Education (GPCGE) first addressed the (relatively easy) establishment of administrative functions, both at the central level and in the shaabiats. It then launched the hard assignment operation of teachers based on the establishment set forth by the GPC (Annex I). As an incentive for active and efficient involvement over the implementation period (and to ensure good school management in the future), GPC awarded special bonuses to the directors and the deputy directors (Decree No. 4, July 2007). Standards were set for directors too—that they and their deputies must possess a relevant university diploma with at least 17 years of experience in teaching, or an education diploma with at least 20 years experience in teaching. 3.26. An iterative cooperative process was used in the health sector. Initially the GPC of Health (GPCH) prepared the establishment for its administrative departments and health units, using the proposed and adopted standard indicators. The submitted staff assignment at this stage did not come out with any redundant employees. Upon examination by the GPCMP, however, questions were raised on the consistency of the GPCH exercise. Major differences were apparent in the applied functional indicators between university and general hospitals, mainly for support jobs. The number of support jobs also appeared to be inconsistent and high relative to the existing bed capacity in the health units. A coordinated effort was needed to complete the retrenchment process (Annex I). 3.27. To ensure fair and equitable selection and assignment operation, GPC developed legal procedures for challenging selection committee decisions (GPC Decree No. 250, April 2007). As
30 The first at 24 sessions per week for classroom teachers, and the second at 18 sessions per week for course teachers. Subsequently, the two indicators were unified at one workload indicator
of 18 sessions per week for all primary teachers (Decree No. 123, July 2005). 31 The reserve pool ratio is by all measures very high. A second related decree reduced this ratio to 5 percent in 2006, which is comparable to the international standard.

40
expected, some retrenched personnel disagreed with the selection and assignment results. They protested that many decisions were motivated by non-objective criteria. The GPC responded by creating complaints bodies at regional and central levels to investigate in each shaabiat. 3.28. The first phase of the retrenchment resulted in nearly 423,000 civil servants being laid off or fired (Table 1, Column 4). In other words, the total LPA workforce of 1.2 million (Column 1) was reduced by more than a third, mostly from the sectors of Education, Manpower, GPC, Health, and Agriculture. Functional restructuring of committees expectedly encountered significant resistance, especially in the large departments. Arguably, the retained workforce of about 760,000 (Column 3) may still be relatively high as a percentage of total population (12.7 percent) or total employment (46.5 percent). Nevertheless, the overall reductions achieved during this first phase signal a strong shift in the reform direction. Table 4.2 takes a closer look at the reductions sector by sector. 3.29. The General education sector, GPC, Manpower, Health, and Agriculture contributed most to the reductions in absolute terms. General education needs further streamlining in order to meet international standards for teachers’ workloads. Even after the first phase, the education sector workload still averages less than six pupils per teacher. Higher education (Table 3.1, first row) appears to have “benefited” from the reform with 1,300 positions more in its new establishment, although not fully stafed yet (Column 5). This reflects past practice of hiring foreigners. Indeed, the latter are not technically part of the LPA and vacancies have been transferred to Libyans, the number of establishments adopted (48,450) have increased relative to the size of the workforce (47,280). Staff positions adopted in agriculture (Row 12) correspond to about 0.5 percent of the population, or 3.3 percent of total LPA workforce. This may still be excessive in light of Libya’s relatively modest agricultural resource base. In Morocco, for example (a neighboring country far better endowed with agricultural resources than Libya), the Ministry of Agriculture employs only about 0.03 percent of the population, or 1.5 percent of the total civil service—in other words, only about a thirteenth as many public employees in agriculture in relative terms. GPC of Manpower (Row 9) laid off more than 37,000 (Column 4) of its 77,405 employees (Column 1). The significant layoffs in Manpower were partly made possible because some GPCMP responsibilities are redundant with those of other administrations (such as the General Information Authority, which conducts employment surveys), as well by significant overstaffing in the training centers that it manages. 3.30. Downsizing results vary by sector. As shown in Figure 3.7, most sectors retrenched more than 40 percent of their workforce; however, several important departments fell off the LPA targets. This is especially the case for higher education, which actually ended up with more positions in its establishment, although it laid off 554 staffs. Justice retrenched only 6.8 percent of its initial workforce. Health laid off only 17 percent of its staff, while General education was reduced by 31 percent and finance by 34 percent. Most of the remaining sectors were more rigorous in their selection process and their efforts paid off. In particular, Agriculture and Manpower shrunk their workforce by 43 and 48 percent. Given their
Figure 3.7:. Retrenched-Workforce Rates by Sector (in percent)
0.0
0.0
0.0
0.0
0.9
1.2
6.8
17.4
31.4
34.0
42.7
44.7
47.3
48.0
49.9
50.1
51.6
62.4
79.4
0 10 20 30 40 50 60 70 80 90 100
P ublic S ecurity
F oreign Affairs &International Cooperation
General People’s Congres s
E lectricity
S ocial Affairs
Higher E ducation
Jus tice
Health & E nvironment
E ducation
F inance
Agriculture & L ives tock &Water Res ources
T rans ports & Communications
Culture & Information
Manpower
Y outh & S ports
GP C & l inked departments
E conomy, Commerce,& Inves tments
P lanning
Indus try & Mines
Source: GPCMP
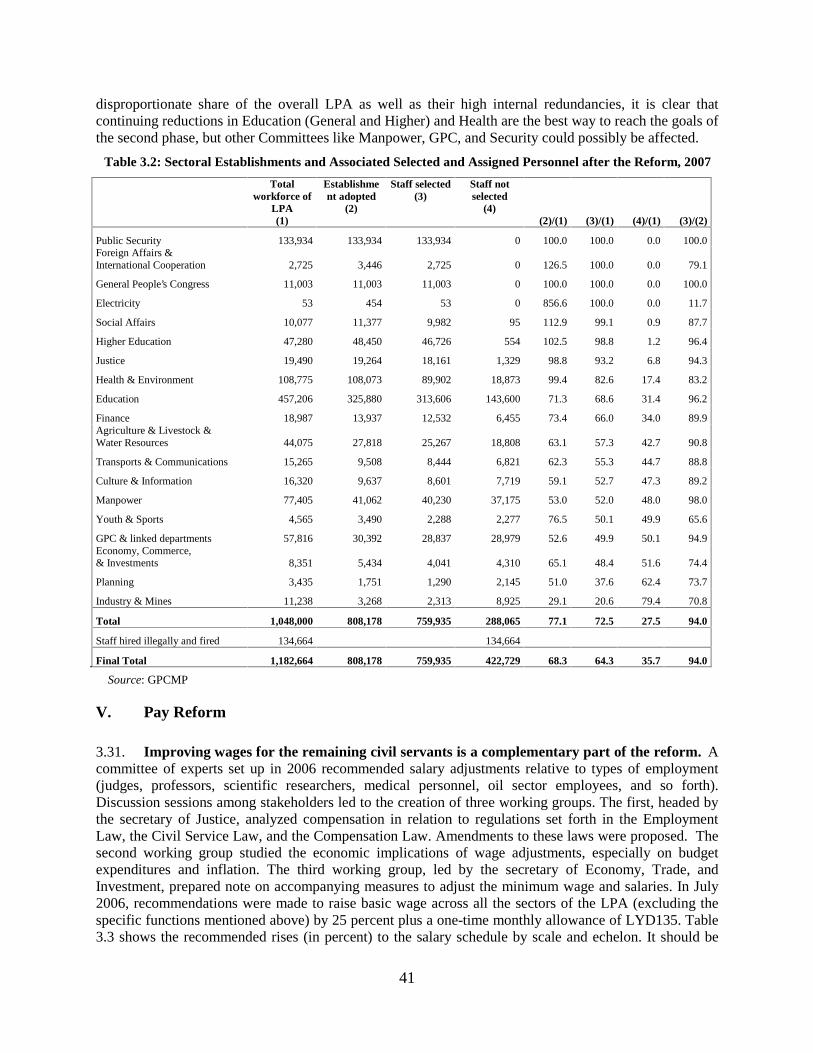
41
disproportionate share of the overall LPA as well as their high internal redundancies, it is clear that continuing reductions in Education (General and Higher) and Health are the best way to reach the goals of the second phase, but other Committees like Manpower, GPC, and Security could possibly be affected.
Table 3.2: Sectoral Establishments and Associated Selected and Assigned Personnel after the Reform, 2007
Total workforce of
LPA (1)
Establishment adopted
(2)
Staff selected(3)
Staff not selected
(4) (2)/(1) (3)/(1) (4)/(1) (3)/(2)
Public Security 133,934 133,934 133,934 0 100.0 100.0 0.0 100.0Foreign Affairs & International Cooperation 2,725 3,446 2,725 0 126.5 100.0 0.0 79.1
General People’s Congress 11,003 11,003 11,003 0 100.0 100.0 0.0 100.0
Electricity 53 454 53 0 856.6 100.0 0.0 11.7
Social Affairs 10,077 11,377 9,982 95 112.9 99.1 0.9 87.7
Higher Education 47,280 48,450 46,726 554 102.5 98.8 1.2 96.4
Justice 19,490 19,264 18,161 1,329 98.8 93.2 6.8 94.3
Health & Environment 108,775 108,073 89,902 18,873 99.4 82.6 17.4 83.2
Education 457,206 325,880 313,606 143,600 71.3 68.6 31.4 96.2
Finance 18,987 13,937 12,532 6,455 73.4 66.0 34.0 89.9Agriculture & Livestock & Water Resources 44,075 27,818 25,267 18,808 63.1 57.3 42.7 90.8
Transports & Communications 15,265 9,508 8,444 6,821 62.3 55.3 44.7 88.8
Culture & Information 16,320 9,637 8,601 7,719 59.1 52.7 47.3 89.2
Manpower 77,405 41,062 40,230 37,175 53.0 52.0 48.0 98.0
Youth & Sports 4,565 3,490 2,288 2,277 76.5 50.1 49.9 65.6
GPC & linked departments 57,816 30,392 28,837 28,979 52.6 49.9 50.1 94.9Economy, Commerce, & Investments 8,351 5,434 4,041 4,310 65.1 48.4 51.6 74.4
Planning 3,435 1,751 1,290 2,145 51.0 37.6 62.4 73.7
Industry & Mines 11,238 3,268 2,313 8,925 29.1 20.6 79.4 70.8
Total 1,048,000 808,178 759,935 288,065 77.1 72.5 27.5 94.0
Staff hired illegally and fired 134,664 134,664
Final Total 1,182,664 808,178 759,935 422,729 68.3 64.3 35.7 94.0
Source: GPCMP
V. Pay Reform 3.31. Improving wages for the remaining civil servants is a complementary part of the reform. A committee of experts set up in 2006 recommended salary adjustments relative to types of employment (judges, professors, scientific researchers, medical personnel, oil sector employees, and so forth). Discussion sessions among stakeholders led to the creation of three working groups. The first, headed by the secretary of Justice, analyzed compensation in relation to regulations set forth in the Employment Law, the Civil Service Law, and the Compensation Law. Amendments to these laws were proposed. The second working group studied the economic implications of wage adjustments, especially on budget expenditures and inflation. The third working group, led by the secretary of Economy, Trade, and Investment, prepared note on accompanying measures to adjust the minimum wage and salaries. In July 2006, recommendations were made to raise basic wage across all the sectors of the LPA (excluding the specific functions mentioned above) by 25 percent plus a one-time monthly allowance of LYD135. Table 3.3 shows the recommended rises (in percent) to the salary schedule by scale and echelon. It should be

42
noted that departments cannot take advantage of these rises until they have otherwise complied with the civil service reform.
Table 3.3: Monthly Wage Increase by Salary Scale and Echelon, including Allowances, 2006 (in percent)
Echelons 0 1 2 3 4 5 6 7 8 9 10
1 101 99 97 95 95 93 91 89 89 87 852 95 93 93 91 89 87 87 85 84 82 823 90 89 87 85 84 82 81 80 78 77 764 84 82 81 80 78 77 76 75 74 73 725 80 78 77 76 74 73 72 71 69 68 676 71 69 68 68 67 65 64 64 63 62 617 65 64 63 62 61 60 59 59 58 57 568 61 60 59 59 58 57 56 56 55 55 549 56 55 55 54 53 52 52 51 50 50 49
10 52 52 51 50 50 49 49 48 48 47 4711 47 47 46 46 45 45 44 44 44 43 4312 45 45 45 44 44 44 43 43 43 42 4213 43 43 42 42 42 41 41 41 40 40 40
Sala
rySc
ale
14 41 41 41 40 40 40 39 39 39 39 38Source: GPCMP
3.32. Wage revalorization significantly improved the nominal salaries of the civil servants. Gross salaries increased between 38 percent for the highest salary scale to more than 100 percent for the lowest. Overall, the average wage increased from LYD200 per month to almost LYD260 per month, a gain of 28 percent. Nevertheless, wage adjustments only partially recovered the lost purchasing power of the real wages since 1981, especially for those in the lower salary scales (Figure 3.8a). Indeed, the highest salary scale civil servants recuperated only 14 percent of the lost purchasing power, while the lowest salary scale employees regained half of their lost purchasing power.
3.33. However wage revalorization worsened salary composition and compression. The share of allowances in the gross salary increased in the new salary schedule. While allowances represented only between 9.5 and 37.5 percent in the former, they represent 17 to 56 percent under the new salary schedule (Figure 3.8b). At the same time, the salary scale suffered more compression (from 5.9:1 to 3.4:1), which further reduced scope to reward competence and productivity. In short, the salary structure still does not provide sufficient incentive to motivate civil servants to work better and improve their performance.

43
Figure 3.8a: Wage Revalorization and Purchasing Power Loss (% by salary scale at the 5th echelon)
Figure 3.8b: Wage Revalorization as a Share of Allowances in Gross Salaries (% by salary scale at
entry level)
O N
0
10
20
30
40
50
60
1 2 3 4 5 6 7 8 9 10 11 12 13 14
Old salary schedule New salary schedule
Source: GPCMP 3.34. Even though, the compression of the salary scale improved its equity. As shown in Figure 3.9, salary distribution is highly skewed to the right. A large concentration (38 percent of the civil servants) was located in the LYD 150-200 per month salary bracket before the pay reform and in LYD 279-341 per month after the reform. Libya also has a salary structure with low equity distortion. The pay reform further improved this dimension. The ratio of the highest to the lowest salary declined from 4.9 to 3.4, which is low by international standard. Similarly, the Gini coefficient slightly improved from 0.196 to 0.190, still among the lowest in the world (Figure 3.10). Figure3.9: LPA Wage Distribution (LYD per year) Figure 3.10: Equitability of Wage Distribution
žž � fl−žž � fl� žž � fl� žž � fl� žž � fl� žž � fl−žž
B A D P
Source: GPCMP
3.35. Wage adjustment was promoted to reward sectors that achieved their establishment restructuring and staff retrenchments. Salary revalorization was set for June 2007. Rises took effect as departments adopted their establishments and new staff assignments. As of august 2007, 20 departments had qualified for their salary increases. Salary revalorization for education and health followed after staff selection and assignment were subsequently adopted. Almost all the 760,000 staff selected in the establishment benefited from the salary adjustments. Redundant personnel continued to receive their old salaries provided their employers submitted required information to GPCMP and to the National Center for Professional Retraining and Development (NCPRD).

44
VI. Handling of the Retrenched Employees
3.36. The National Center for Professional Retraining and Development (NCPRD) encountered difficulties collecting the administrative and pay files of the retrenched. In principle, all entities at the central and decentralized levels were to transfer administrative files of retrenched employees to NCPRD as soon as their establishments and staff selection were finalized and approved. However, this was hardly the case, as many administrators not only lacked the required HRM skills, they were reluctant to expose illegal past practices in the hiring, payment, and promotion of the personnel, especially in shaabiats.Consequently, most sectors did not seem keen to transfer administrative documents. As a result, NCPRD experienced significant delays in providing salaries to those who had been retrenched. 3.37. The personnel files eventually checked by NCPRD provide a stark snapshot of the kinds of shortcomings that have plagued LPA.
• Documents were not ordered chronologically. Searches were cumbersome and time consuming.
• Dates of hiring decisions (where they appeared at all) were inconsistent with those claimed by employees, due to discrepancies in educational qualifications and diplomas of the personnel. In many other cases, managers provided false information to hire ineligible employees through social patronage or corruption.
• Inconsistent and contradictory information was rife, even for dates of birth and employee names.
• Ages were disguised for many active civil servants who should have been retired.
• Multiple pay statements were used to disguise payments to a single employee.
• Original documents were missing from most files. Those that appeared were often in poor shape if not completely unreadable.
• A large number of hiring decisions and credential documents were missing.
• A large number of recruitments took place in 2007 without proper budgeting under the terms of the 2007 Budget Law.
3.38. And as of end 2007, NCPRD had received less than half the files of retrenched personnel (187,113 of 422,729 files). Two databases were set up—for administrative and financial data on employees. It was evident from the absence of original documents that many (possibly most) documents in these files had been concocted after the decision to go forward with the downsizing operation. 3.39. Civil servants with files that could be processed into the databases received their overdue salaries, which helped to soften resistance to the reform. NCPRD took over the payments for civil servants made redundant. Since April 2007 onward, no less than 174,113 servants with validated information in the financial database have started to receive their salaries. Timely processing for retrenched personnel helped to ease political and social criticism. 3.40. NCPRD was also tasked with retraining redundant civil servants to help them enter the job market. NCPRD is responsible for managing 288,000 employees (38 percent of the civil service). Their profiles are evaluated; and they are then provided with tailored job retraining or helped with startup loans for new businesses. Persons with specialized skills that are in demand can eventually be reassigned to SOEs or other national agencies. These are mainly professionals such as skilled mechanics, civil engineers, agronomists, oil technicians, statisticians, and so forth. As shown in Table 3.4, NCPRD reassigned 3,412 such persons to agencies such as the National Oil Agency, the Housing and Facilities Agency, and the Agency for the Development of Administrative Centers. Overall, NCPRD placed 73,915
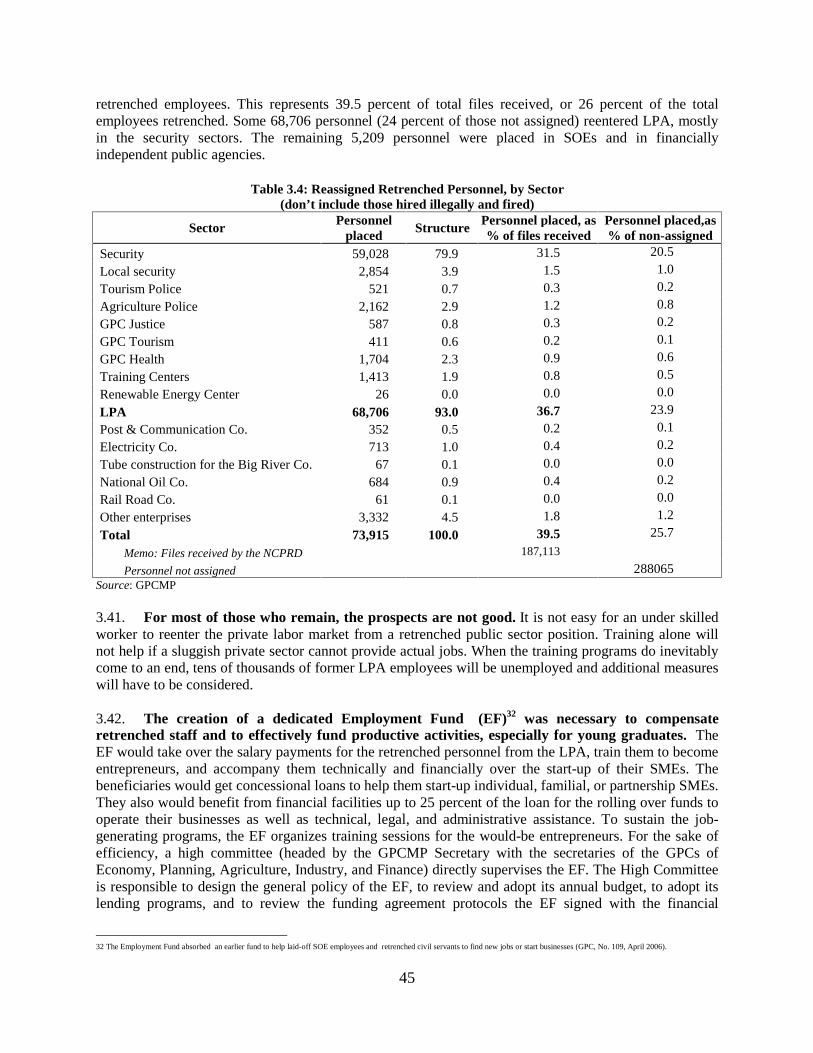
45
retrenched employees. This represents 39.5 percent of total files received, or 26 percent of the total employees retrenched. Some 68,706 personnel (24 percent of those not assigned) reentered LPA, mostly in the security sectors. The remaining 5,209 personnel were placed in SOEs and in financially independent public agencies.
Table 3.4: Reassigned Retrenched Personnel, by Sector (don’t include those hired illegally and fired)
Sector Personnel
placed Structure
Personnel placed, as % of files received
Personnel placed,as % of non-assigned
Security 59,028 79.9 31.5 20.5
Local security 2,854 3.9 1.5 1.0
Tourism Police 521 0.7 0.3 0.2
Agriculture Police 2,162 2.9 1.2 0.8
GPC Justice 587 0.8 0.3 0.2
GPC Tourism 411 0.6 0.2 0.1
GPC Health 1,704 2.3 0.9 0.6
Training Centers 1,413 1.9 0.8 0.5
Renewable Energy Center 26 0.0 0.0 0.0
LPA 68,706 93.0 36.7 23.9
Post & Communication Co. 352 0.5 0.2 0.1
Electricity Co. 713 1.0 0.4 0.2
Tube construction for the Big River Co. 67 0.1 0.0 0.0
National Oil Co. 684 0.9 0.4 0.2
Rail Road Co. 61 0.1 0.0 0.0
Other enterprises 3,332 4.5 1.8 1.2
Total 73,915 100.0 39.5 25.7
Memo: Files received by the NCPRD 187,113
Personnel not assigned 288065 Source: GPCMP 3.41. For most of those who remain, the prospects are not good. It is not easy for an under skilled worker to reenter the private labor market from a retrenched public sector position. Training alone will not help if a sluggish private sector cannot provide actual jobs. When the training programs do inevitably come to an end, tens of thousands of former LPA employees will be unemployed and additional measures will have to be considered. 3.42. The creation of a dedicated Employment Fund (EF)32 was necessary to compensate retrenched staff and to effectively fund productive activities, especially for young graduates. The EF would take over the salary payments for the retrenched personnel from the LPA, train them to become entrepreneurs, and accompany them technically and financially over the start-up of their SMEs. The beneficiaries would get concessional loans to help them start-up individual, familial, or partnership SMEs. They also would benefit from financial facilities up to 25 percent of the loan for the rolling over funds to operate their businesses as well as technical, legal, and administrative assistance. To sustain the job-generating programs, the EF organizes training sessions for the would-be entrepreneurs. For the sake of efficiency, a high committee (headed by the GPCMP Secretary with the secretaries of the GPCs of Economy, Planning, Agriculture, Industry, and Finance) directly supervises the EF. The High Committee is responsible to design the general policy of the EF, to review and adopt its annual budget, to adopt its lending programs, and to review the funding agreement protocols the EF signed with the financial
32 The Employment Fund absorbed an earlier fund to help laid-off SOE employees and retrenched civil servants to find new jobs or start businesses (GPC, No. 109, April 2006).

46
institutions. Another mission of the EF is to manage a new social protection program for the unemployed. Compensation is set at LD60 per month and represents 30 percent of the minimum wage. 3.43. Through the NCPRD and EF, GPCMP has effectively handled the “easy” special cases.These constitute 52,287 civil servants for whom NCPRD has processed files. Many of them benefited from concessional loans with which they were to have left LPA and started their own businesses. The value of the investment portfolio program is equal to the total salary that the laid-off civil servant would have earned up to the time of his or her retirement (up to10 years of salary). The beneficiaries of this program would receive dividends produced by the allotted portfolios but cannot trade the portfolios during the first two years. Thus, 34,915 former civil servants benefited from this program and left the NCPRD’s pay roll. Another difficult case concerned 3,749 older civil servants who were relatively close to retirement. GPCMP offered an early retirement program with a severance package equal to their full salary for the years remaining to normal retirement. This will be paid in one lump sum, and the employer’s contribution will be transferred to the Social Fund. Another special case concerns 623 civil servants with some professional skills willing to start-up their own businesses. These employees benefited from concessional investment loans within the Transfer for Production Program with funding from the EF. The remaining civil servants are benefiting from tailored NCPRD retraining programs and relevant lending programs. This concerns 60,911 civil servants. The aim is tailor training to their backgrounds, skills, and experience, so that they can enter the private sector as wage employees or entrepreneurs. NCPRD set up of trainee groups according to major skills. (see Statistical Appendix, table A4.14). 3.44. The March 2nd, 2008 speech of Muammar Gaddafi mentioned another source to compensate the retrenched personnel. Effective March 2008, all the retrenched would start receiving the equivalent of their salaries from a Wealth Distribution Fund. Such Fund was set up to distribute oil related revenues to the population. The Budget would stop transferring their salaries to the GPCMP, easing the impact of the retrenched severance package on the Budget (GPC, Decree No. 200, March 2008). No data are available to measure the impact of this measure yet.
VII. Policy Recommendations 3.45. The following policy recommendations arise from lessons of past reform. They are summarized in Table 3.5 below. Subsequent Technical Assistance will give top priority to produce as main output an "Action Plan" that serves as a Manual on each individually agreed policy action jointly selected. The proposed policy recommendations address five possible improvements to the second stage:
• Empower politically and legally the supervisory authority in place to manage the second phase of the reform and monitor HRM policies of the LPA Under any circumstance, it is fundamental that GPCMP (or a similar central authority) remains in place. Such a supervisory authority would ensure that the LPA at the central level, but more so at shaabiats levels, continue to implement civil service reform through the second phase and complies with new regulations. The second phase of the reform should seek to retrench progressively between 300,000 and 350,000 personnel over the next few years, to achieve the stated initial objective of the reform. Over the reform process, this body needs to be empowered politically and legally to oversee and clear the HRM policies at both the central level and in the Shaabiat. The setting of a clearance system at the central body would help to insulate HR managers’ decisions from social pressures and interest groups. The central body also needs legal basis that empowers it to cancel any HRM related decisions, of which hirings and promotions, which do not comply with the existing laws and regulations.
47
• Complete and improve the existing HR database of the civil service and its upgrading as a HRM tool. The GPC of Manpower developed a central database of the LPA with relevant information derived from a census it conducted nationwide in the context of the civil service reform. The database helped identifying redundant staff to be retrenched. It is worthwhile to complete and update this database so that it serves as a central tool for the civil service reform, but also as a HRM tool that would allow integrating HRM and wages into the budgetary process to ensure fiscal sustainability of HRM decisions.
• Enforce existing HRM regulations and introduce results-based management Since reforms were launched in 2000, Libya has put a good system in place for designing sectoral establishments and managing recruitments, pay, and promotions in its civil service. Enforcement is now needed at all levels. The first stage should focus on the shaabiats. The second stage should introduce performance-based management, particularly in the field of HRM. The objective is to build a performance-oriented public service in order to improve service delivery to the general population and private sector. The goal is to establish the institutional framework for a performance oriented public service, and promote efficient and effective performance management through (i) facilitating the establishment of a public service commission; (ii) facilitating good governance practices and strengthening the planning, monitoring, and reporting capabilities of all Committees; (iii) establishing the central human resource management information system to provide users with timely, accurate and relevant establishment information; (iv) introducing performance accountability for the Heads of Departments; and (v) supporting the introduction of performance-oriented and merit-based remuneration policies and procedures.
• Design instruments for strategic staffing The current shortages in certain job categories and the recognition of the benefits of retraining and redeploying current employees call for strategic planning of human resources to meet future needs. Use of a Strategic Staffing approach will allow Shaabiats and the central administration to improve staff utilization, address critical human resource issues in an organized and integrated way, and recruit, develop and deploy the talent required to meet future LPA needs.
• Design of a reform proposal of the compensation and incentives system The current pay system still has many serious shortcomings. In particular, it suffers from three weaknesses: the average real wage is relatively low, its structure is highly compressed, and it includes an allowance component that represents an important share of the basic salary. These weaknesses generate many problems. First, low pay leads to corrupt officials. Second, wage compression fails to attract and keep the high skilled civil servants because of the non-competitive wages. Third, allowances tend to be uniform and reflect seniority, and social entitlements, and thus do not reward human capital requirements of the job. All these factors translate into unproductive and poorly qualified public servants. As a result, service delivery is inefficient and its quality does not meet the needs of the population. The objective is to deepen pay reform around the following: Fiscal sustainability of the wage bill; concentration of remuneration in core pay, while limiting salary supplements and allowances; limit seniority based pay and linking promotion to performance; consistency in the competitiveness of total remuneration across posts of the public administration, through public-private remuneration surveys for fixing pay policies, advertise vacancies, and central clearance of pay policies of Shaabiyat.

48
Table 3.5: Civil Service Reform: Matrix of Policy Recommendations
(Acronyms indicating the suggested implementing institutional body)
Objectives Short term recommendations Medium term recommendationsPut in place thenecessaryconditions for continuedmomentum and success of reform.
Empower politically and legally GPCMP to manage thesecondphaseof the reform. (GPC).Giveclear mandate to GPCMP to overseeand clear theHRMpolicies at both thecentral level and in theShaabiat. (GPC).Deviseascheme to retrench between 300,000 and 350,000 personnelover thenext few years. (Institution in chargeof HRM).
Set up aclearancesystem at GPCMP that would help to insulateHRmanagers’ decisions from social pressures and interest groups.(GPC).Award GPCMP a legal basis that empowers it to cancel any HRMrelated decisions, of which hirings and promotions, which do notcomply with the existing laws and regulations (GPC).
Create the tools to support reformand improve HRM of the LPA.
Complete and update the civil service database so that it serves as acentral tool for the civil service reform. (Institution in charge ofHRM).Upgrade the civil service database into a HRM tool. (Institution incharge of HRM).
Integrate HRM and wages into the budgetary process to ensure thefiscal sustainability of HRM decisions. (Institution in charge ofHRM+ GPCPF).
Enforce existing HRM regulationsand introduce results-basedmanagement.
Empower GPCMP to enforce compliance with respect to the existingregulations for designing sectoral establishments, managingrecruitments, pay, and promotions in line ministries. (Institution incharge of HRM).
Establish the institutional framework for a performance orientedpublic service through: (GPC+GPCPF+Institution in charge ofHRM):• establishment of a public service commission;• introduction of sound governance practices and strengthening
the planning, monitoring, and reporting capabilities of allCommittees;
• establishment of a central human resource managementinformation system;
• introduction of performance contracts for the Heads ofDepartments; and
• introduction of performance-oriented and merit-basedremuneration policies and procedures.
Improve staff use, address humanresource issues in integrated way.
Set up a committee to devise a strategic planning of humanresources. (Institution in charge of HRM).
Design instruments for strategic staffing. (Institution in charge ofHRM).
Make the pay system moreattractive and equitable.
Mandate committees to design a reform proposal of thecompensation and incentives system including: wage bill costs;concentration of remuneration in core pay, while limiting salarysupplements and allowances; limited seniority-based pay and linkedpromotion to performance; consistency of remuneration posts acrossthe public administration, supported by public-private remunerationsurveys; advertised vacancies, and creation of a central authority forShaabiat payroll policies. (GPC+Institution in charge of HRM +GPCPF).
Adopt and implement pay reform. (GPCPF+Institution in charge ofHRM).

49
Chapter 4: Modernizing the Public Investment Management System in Libya
Under any scheme redistributing oil wealth for Libyans, sound public investment management is essential for development needs. Whereas the analysis of the 2008-12 Development Program is left to Chapter 10, this chapter proposes the main features of a modern public investment management system (PIMS) for Libya; reviews public investment trends; explores the link between public investment and growth for the country; assesses the internal procedures governing the budget cycle for public projects; recommends the key pillars of a possible new PIMS for Libya; and, motivated by the ongoing restructuring of the state, examines the rationale, pros and cons, and possible alternatives for unifying the budget and supporting the recent decision adopted by authorities of merging the Ministries of Planning and Finance.33
I. Public Investment Trends 4.1 Public expenditure in Libya has traditionally been very high by international standards. At 39 percent of gross domestic product (GDP) on average during 2003–05 (and 35 percent in 2007), consolidated public expenditure was among the highest in the world (Figure 4.1). This level of public spending exceeds levels recorded in economies in transition in East Europe and Central Asia, and in fast-growing Middle East and North Africa (MENA) countries such as Algeria and Tunisia (World Bank 2006). And, as in other oil-producing countries benefiting from the oil windfall since 2005, this ratio keeps increasing: Libya has a budgeted amount of 36.4 percent of GDP in 2008. 4.2 The previous finding is partly explained by the fact that Libya has a sizable and rising budget devoted to public investment.34 This is explained by two facts: the acute deterioration of the capital stock during 1986-2002 due to the embargo; and the early efforts of accelerated reinvestment during the decentralization period. The ratio of public investment (called “development expenditure” in Libyan budgetary terms) to GDP more than tripled, from 5.8 percent of GDP in 1999 to a very high 18.2 percent in 2005. Then, recentralization has not prevented it from increasing, reaching a record-high approved a budgeted amount equivalent to 23.3 percent in 2008. Hence, in less than a decade, this ratio has quadrupled. 4.3 By international standards, the recent public investment ratios are very high, but this finding should also take into account the fact that private investment is marginal and insufficient to cover the country’s needs. In 2007, public investment represented almost three times the average for MENA countries—oil rich and oil poor—and for world oil-exporting countries (Figure 4.2). And in the MENA region, only wartime Algeria, Iraq, and Qatar have double-digit public investment rates ranging
33 While the final version of this document was being prepared, the ministries of Finance and Planning were merged in March 2009. 34 Chapter 4 explains the key role also played by the high share devoted to current spending, mainly the wage bill.
Source: World Bank Staff

50
around 12 to 13 percent of GDP. The case of Algeria is particularly relevant for Libya, because this country is implementing a sizable 2005–09 public investment program—the Programme Complémentaire de Soutien à la Croissance (PCSC)—also aimed at filling significant social and basic infrastructure gaps. But this ratio provides only a partial picture for investment efforts in Libya, as this country also has one of the lowest private/total investment ratios worldwide (at less than 2 percent of GDP); whereas such ratio averaged 13-15 percent of GDP in oil-producing economies during the early-to-mid 2000s. 4.4 Hence, Libya‘s recent public investment ratios are high, even though they might reflect temporary efforts, financed by the oil windfall, to fill the infrastructure gap inherited from the embargo. These ratios also represent an important challenge to the absorptive capacity of the economy and to the implementation (execution) capacity of the government.35 If translated into rising inflationary pressures, they could also be damaging for the Libyan economy. Keeping them contained is critical, because in the coming 2008–12 period, investment expenditures are expected to expand. The design of the 2008–2012 Public Investment Plan (PIP) followed several steps. Originally, LD250 billion (US$208 billion) were proposed as the investment envelope for the five-year plan, from which LD86 billion (approximately US$71 billion) would correspond to the 2008 budget. However, this amount was subsequently reduced to nearly LD150 (US$125 billion) (GPCP 2008). 4.5 A high public investment ratio, however, deserves at least four important caveats that point to much lower actual investment ratio.
• Capital outlays include misclassified current expenditure. According to Libyan officials, dual budgeting leads to budget misclassification of current outlays representing about a third of what is currently classified as capital expenditure. But in the absence of proper and detailed information to make a more accurate estimate such figure should be taken with a grain of salt. Missclassification mainly comes from maintenance contracts included in the public investment pipeline. For example, the monthly financial report to October 2007 of the General People’s Committee for Communications and Transportation indicates that among 102 investment contracts, 31 are for maintenance and represent 33.6 percent of the total allocation (LD12.3 million within a total of LD36.5 million). This case is far from unique; the Office of Roads and Bridges registers an amount equivalent to 28.9 percent of the total allocation worth LD16 million for 19 maintenance contracts out of a total of 85 contracts. Whereas officials concede that some new investment projects might be wrongly labeled as “maintenance” contracts, both examples above indicate an underestimation of actual current
35 This report estimates the “implementation” capacity of the Government, measured by the level of execution of annual budgeted outlays. However, it is important to distinguish
such concept from the “absorption” capacity of the economy, a familar term used by the Government to define the level of public investment that “at the micro level leads to a
lower rates of return and, at the macro level (when replacing the rate of return by the rate of growth of GDP), to accelerating inflation.” Both concepts are of dynamic nature. This
report deals with the first one, for estimating the absorption capacity would require to previously build a proper macroeconomic model of the Libyan economy, which is beyond
the terms of reference of this study. Moreover, the Government has already developed its own model to assess the absorption capacity, a model that it keeps continuously updated
(see Merza, 2008a,b and GPCP 2008a).
Source: World Bank

51
expenditure. Furthermore, maintenance does not cover all the operating expenses wrongly included in the development budget.
• No regular report on actual budget execution is produced by the Executing Units. Resources registered as “executed” in the Libyan fiscal accounts represent those recorded as actual budget appropriations sent to the Executing Units. In other words, the figures represent the amounts transferred from a development account at the Central Bank of Libya to the accounts of the recipient units. No one knows whether or not these amounts are actually spent over the year, because these units do not report accurate data on their actual use.
• In relation to the above, Libya has a limited implementation capacity that largely varies among sectors, but reached an average 80 to 85 percent in 2006 (see para. 7).
• Carryover of public investment outlays is allowed in the Libyan budget, which blurs their accurate recording. Thus, every year, significant portions of nonexecuted budget allocations in capital outlays are brought forward to the next fiscal year.
Sectoral Composition of Public Investment 4.6 The sectoral composition of development expenditures has changed in important ways in the present decade. In the mid-to-late 1990s (1994–2000), the five best-endowed sectors were: (a) housing and equipment (14 percent), (b) education and research (12.2 percent), (c) administrative areas growth (12 percent), (d) electricity (10.6 percent), and (e) hydrocarbons (9.8 percent) (see Statistical Appendix in Volume III). But by 2005, the four most important sectors had become: (a) hydrocarbons and the Great Man Made River (GMMR) Project; (b) electricity; (c) housing, and water & sanitation; and (d) external commitments. Thus, despite housing, education (all grouped), and hydrocarbons remaining as national priorities, electricity and water produced by the GMMR have surged as new top priority sectors in the development program (Figure 4.3).36
Figure 4.3: Sectoral Ranking in the Development Budget, 2005
P etroleum and B ig Artificial R iver
30.0%
National Company of E lectricity
13.5%P rograms (Water and S anitation; Hous ing;
R oads )9.3%
F inance7.0%Domes tic and
External Commitments
Liquidation5.1%
Hous ing, B uildings and Environment
4.6%
Agriculture, Lives tock and F is hing
3.8%
Health and S ocial S ecurity
3.7%
P rimary and s econdary Education
3.6%
Higher Education3.0%
Communications and T rans ports
3.0%
Other s ectors13.4%
Source: General People’s Committee for Planning and consultant computations. See Statistical Appendix in Volume III.
Investment Execution
36 Unfortunately, the lack of unique definition of grouped data between the 1990s and the 2000s, and their high level of aggregation, prevents a clear idea of the evolution of the
internal structure of certain categories of public investment, like the one containing housing, water, and sanitation.
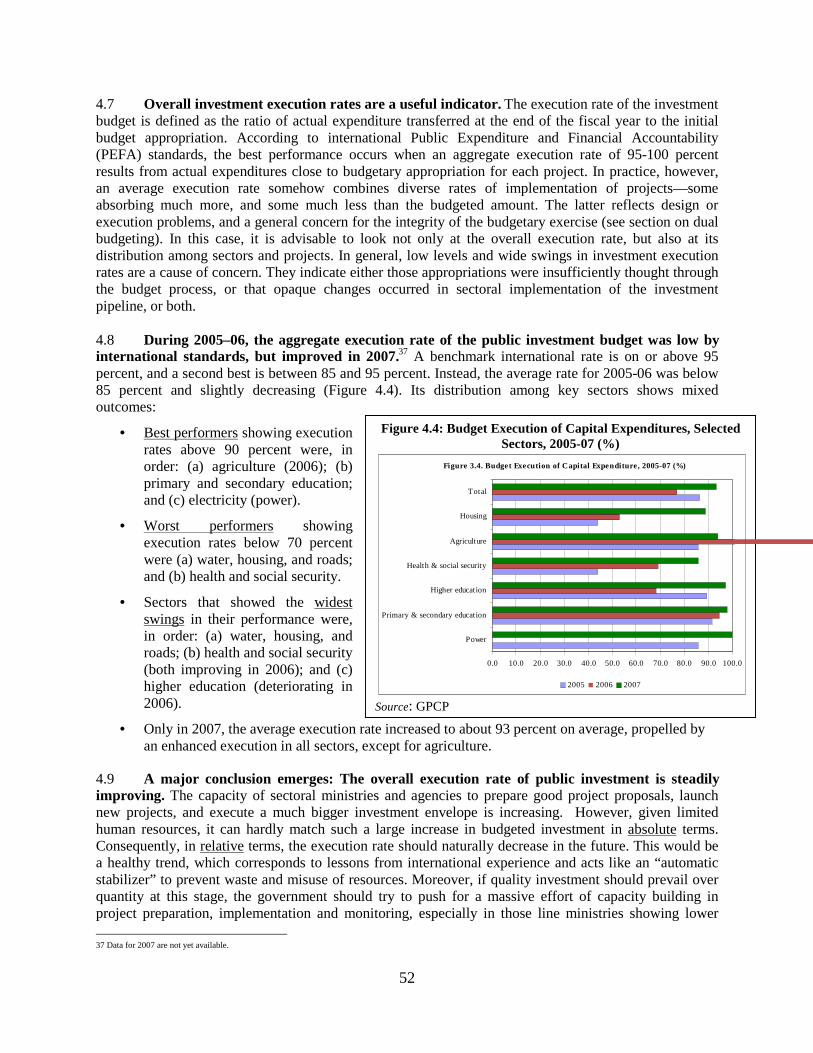
52
4.7 Overall investment execution rates are a useful indicator. The execution rate of the investment budget is defined as the ratio of actual expenditure transferred at the end of the fiscal year to the initial budget appropriation. According to international Public Expenditure and Financial Accountability (PEFA) standards, the best performance occurs when an aggregate execution rate of 95-100 percent results from actual expenditures close to budgetary appropriation for each project. In practice, however, an average execution rate somehow combines diverse rates of implementation of projects—some absorbing much more, and some much less than the budgeted amount. The latter reflects design or execution problems, and a general concern for the integrity of the budgetary exercise (see section on dual budgeting). In this case, it is advisable to look not only at the overall execution rate, but also at its distribution among sectors and projects. In general, low levels and wide swings in investment execution rates are a cause of concern. They indicate either those appropriations were insufficiently thought through the budget process, or that opaque changes occurred in sectoral implementation of the investment pipeline, or both. 4.8 During 2005–06, the aggregate execution rate of the public investment budget was low by international standards, but improved in 2007.37 A benchmark international rate is on or above 95 percent, and a second best is between 85 and 95 percent. Instead, the average rate for 2005-06 was below 85 percent and slightly decreasing (Figure 4.4). Its distribution among key sectors shows mixed outcomes:
• Best performersshowing execution rates above 90 percent were, in order: (a) agriculture (2006); (b) primary and secondary education; and (c) electricity (power).
• Worst performers showing execution rates below 70 percent were (a) water, housing, and roads; and (b) health and social security.
• Sectors that showed the widest swings in their performance were, in order: (a) water, housing, and roads; (b) health and social security (both improving in 2006); and (c) higher education (deteriorating in 2006).
• Only in 2007, the average execution rate increased to about 93 percent on average, propelled by an enhanced execution in all sectors, except for agriculture.
4.9 A major conclusion emerges: The overall execution rate of public investment is steadily improving. The capacity of sectoral ministries and agencies to prepare good project proposals, launch new projects, and execute a much bigger investment envelope is increasing. However, given limited human resources, it can hardly match such a large increase in budgeted investment in absoluteterms. Consequently, in relativeterms, the execution rate should naturally decrease in the future. This would be a healthy trend, which corresponds to lessons from international experience and acts like an “automatic stabilizer” to prevent waste and misuse of resources. Moreover, if quality investment should prevail over quantity at this stage, the government should try to push for a massive effort of capacity building in project preparation, implementation and monitoring, especially in those line ministries showing lower
37 Data for 2007 are not yet available.
Figure 4.4: Budget Execution of Capital Expenditures, Selected Sectors, 2005-07 (%)
0.0 10.0 20.0 30.0 40.0 50.0 60.0 70.0 80.0 90.0 100.0
Power
Primary & secondary education
Higher education
Health & social security
Agriculture
Housing
Total
2005 2006 2007
Figure 3.4. Budget Execution of Capital Expenditure, 2005-07 (%)
Source: GPCP
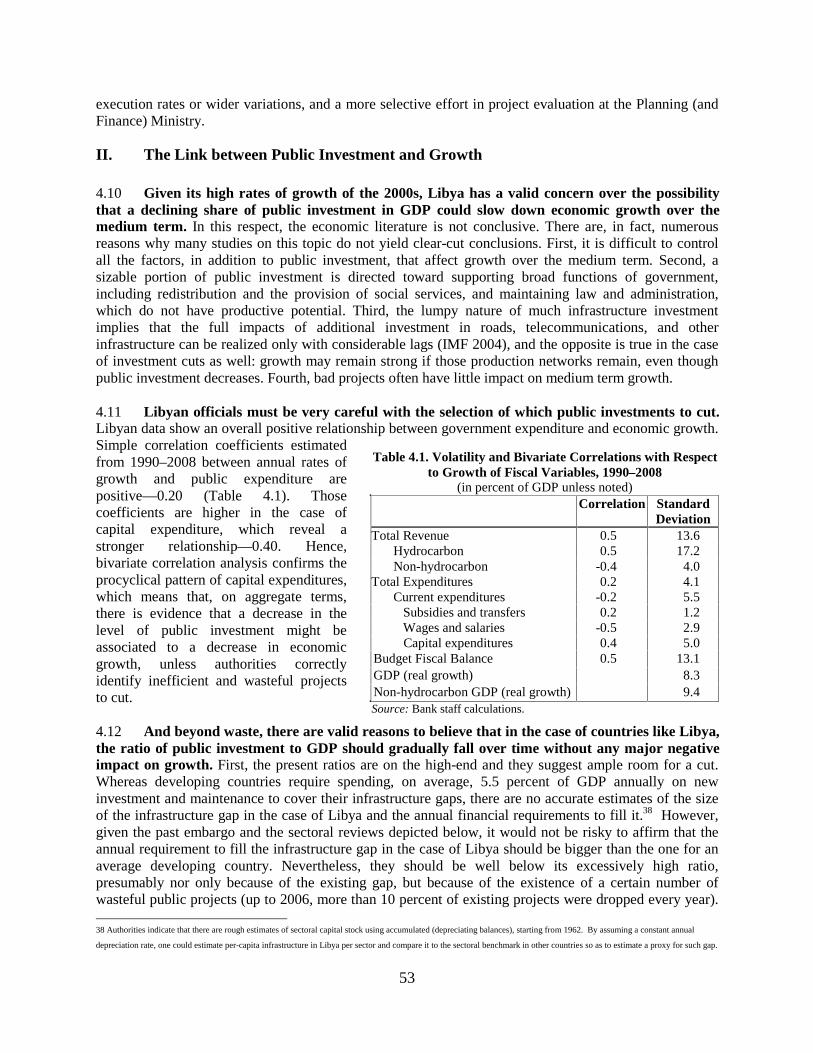
53
execution rates or wider variations, and a more selective effort in project evaluation at the Planning (and Finance) Ministry.
II. The Link between Public Investment and Growth 4.10 Given its high rates of growth of the 2000s, Libya has a valid concern over the possibility that a declining share of public investment in GDP could slow down economic growth over the medium term. In this respect, the economic literature is not conclusive. There are, in fact, numerous reasons why many studies on this topic do not yield clear-cut conclusions. First, it is difficult to control all the factors, in addition to public investment, that affect growth over the medium term. Second, a sizable portion of public investment is directed toward supporting broad functions of government, including redistribution and the provision of social services, and maintaining law and administration, which do not have productive potential. Third, the lumpy nature of much infrastructure investment implies that the full impacts of additional investment in roads, telecommunications, and other infrastructure can be realized only with considerable lags (IMF 2004), and the opposite is true in the case of investment cuts as well: growth may remain strong if those production networks remain, even though public investment decreases. Fourth, bad projects often have little impact on medium term growth. 4.11 Libyan officials must be very careful with the selection of which public investments to cut. Libyan data show an overall positive relationship between government expenditure and economic growth. Simple correlation coefficients estimated from 1990–2008 between annual rates of growth and public expenditure are positive—0.20 (Table 4.1). Those coefficients are higher in the case of capital expenditure, which reveal a stronger relationship—0.40. Hence, bivariate correlation analysis confirms the procyclical pattern of capital expenditures, which means that, on aggregate terms, there is evidence that a decrease in the level of public investment might be associated to a decrease in economic growth, unless authorities correctly identify inefficient and wasteful projects to cut. 4.12 And beyond waste, there are valid reasons to believe that in the case of countries like Libya, the ratio of public investment to GDP should gradually fall over time without any major negative impact on growth. First, the present ratios are on the high-end and they suggest ample room for a cut. Whereas developing countries require spending, on average, 5.5 percent of GDP annually on new investment and maintenance to cover their infrastructure gaps, there are no accurate estimates of the size of the infrastructure gap in the case of Libya and the annual financial requirements to fill it.38 However, given the past embargo and the sectoral reviews depicted below, it would not be risky to affirm that the annual requirement to fill the infrastructure gap in the case of Libya should be bigger than the one for an average developing country. Nevertheless, they should be well below its excessively high ratio, presumably nor only because of the existing gap, but because of the existence of a certain number of wasteful public projects (up to 2006, more than 10 percent of existing projects were dropped every year).
38 Authorities indicate that there are rough estimates of sectoral capital stock using accumulated (depreciating balances), starting from 1962. By assuming a constant annual
depreciation rate, one could estimate per-capita infrastructure in Libya per sector and compare it to the sectoral benchmark in other countries so as to estimate a proxy for such gap.
Table 4.1. Volatility and Bivariate Correlations with Respect to Growth of Fiscal Variables, 1990–2008
(in percent of GDP unless noted) Correlation Standard
Deviation Total Revenue 0.5 13.6
Hydrocarbon 0.5 17.2 Non-hydrocarbon -0.4 4.0
Total Expenditures 0.2 4.1 Current expenditures -0.2 5.5
Subsidies and transfers 0.2 1.2 Wages and salaries -0.5 2.9 Capital expenditures 0.4 5.0
Budget Fiscal Balance 0.5 13.1 GDP (real growth) 8.3 Non-hydrocarbon GDP (real growth) 9.4 Source: Bank staff calculations.

54
Second, and perhaps more important, as declining public investment ratios would reflect a trend toward smaller government, they would also reflect policies looking for an increased participation by the private sector, further productivity and efficiency gains; while keeping growth rates high. This is exactly what the Authorities are promoting with their medium term investment strategy. 4.13 Public investment features low variability, despite high volatility of other fiscal variables, especially revenues, and economic growth. Macroeconomic volatility reflects the effect of external shocks hitting the economy. Total and hydrocarbon revenue are more volatile —and in double digits—than total expenditures (Table 4.1). This is so because oil price disturbances have an immediate impact on public revenues, and this is clearly reflected in the fiscal aggregates. Both current and capital expenditures exhibit lower volatility than GDP, which is an unexpected finding, because more or less variation in capital expenditure would have suggested a more conventional result. Predictable, however, is (a) the lowest volatility found in subsidies and transfers and wages and salaries, which also reflects their inertial character; (b) the high volatility shown by the budget fiscal balance, which varies endogenously with the level of economic activity; (c) hydrocarbon revenues showing higher volatility than total revenues; and (d) the fact that volatility of fiscal variables has increased in the 2000s (not shown in the table), as a result of the oil windfall. The latter argues for the importance of preserving an Oil Fund. 4.14 A second major conclusion emerges: in the medium term, the annual budgetary expenditure envelope should return to a benchmark around 30 percent of GDP (down from 35 percent of GDP in 2007), and to 16-18 percent of GDP in capital expenditure, in parallel with Libyan pre-windfall historic implementation capacity and the enforcement of minimum requirements of quality investment.39 These are the pre-windfall ratios of 2005. While there is no rule of thumb for defining an optimal size for public expenditure (and investment) in precise macro terms; there are three factors that will definitely contribute to an aggregated lower level. First, the second stage of civil service reform is projected to make new savings on current expenditure (it already cut payroll from 7.2 percent of GDP in 2005 to a budgeted 5.2 percent of GDP in 2008) (see chapter 3). Second, the authorities’ decision to increasingly approve public projects based on sound feasibility studies is essentially a microeconomic decision, based on technical criteria, but whose application will often lead, in aggregate terms, to a lower number of public projects approved per year (see below as well as chapter 10). Third, experience shows that limited domestic implementation capacity cannot be substituted, but to a limited extent, by the practice of massive contracting out, and at a significant risk of forced projects acceleration. At a minimum, there has to be a responsible follow-up of projects terms of reference, procurement, and very close supervision of their implementation. If this is not done properly, this will pose major risks in terms of low quality of investments, delays, waste of resources and spread of corruption. Slower project implementation is often an unavoidable outcome of the introduction of minimum public investment standards. The next sections review norms and introduce upgraded standards.
III. Assessing the Budget Cycle of Public Investment
Preliminary Institutional and Conceptual Remarks 4.15 The Libyan public investment management system (PIMS) is governed by the Planning Law approved in 2000. This law defines a complex institutional framework with clear functions and roles assigned to key institutions in the preparation and implementation of the development (capital) budget (see Box 4.1). Until 2007, the development budget was prepared under a one-year time horizon, but since 2007, the first multiyear plan for 2008–12 has been prepared on a pilot basis.
Box 4.1: The Institutional Framework Defined by the Planning Law
39 This would assume minimum savings of about one percent of GDP in payroll and four percent of GDP in capital expenditure with respect to 2007.

55
According to the Planning Law, at the top level of the public investment system there is the General Counsel for Planning and the Counsels for Planning to the shaabiats. Both entities are subsidiary to the General People’s Congress. The General Counsel for Planning is also called the National Counsel for Planning (NCP). The General Counsel for Planning (GCP) comprises the following: the secretary of the General Counsel for Planning; the secretary of the General People’s Committee for Planning (GPCP), and the secretaries of the Sectorial People’s Committees; the governor of the Central Bank of Libya; the secretaries of the planning counsels for the shaabiats; the secretaries of the People’s Committees for Shaabiats; the secretaries of the People’s Committees for the universities; the secretaries of the research centers; the secretaries of the financial enterprises; the secretaries of the public entities and enterprises; one delegate from the temporary General Committee for Defense; and the head of the trade , industry, and agriculture chamber. The secretary of the GCP is designated by the General People’s Congress (GPC). GCP functions are:
The GCP studies the proposals that are submitted to it. These proposals concern social and economic goals and policies. They are prepared by all parties concerned, experts, and planning counselors to the shaabiats. The GCP studies social and economic projects that require big public investment. It adjusts proposed projects (contracts) and their budgets, and submits reports on them to the GPC.
a. The GCP proposes goals and policies for economic and social development plans, in relation to the availability of human and financial resources. It reviews programs, projects, and budgets. It proposes the laws and regulations that are necessary for their development.
b. The GCP establishes periodic reports on the follow-up of the implementation of the plans. It prepares a yearly report that is presented to the GPC. Based on technical or financial reasons, and according to results obtained, it proposes changes to the development plans.
c. The GCP proposes alternatives of using available financial resources among development projects. It also defines a domestic and external borrowing policy, and sets the financing conditions.
d. The GCP is responsible for the plans and programs of development of the national statistics, the national census, and studies on the population and regional development.
e. The GCP is the recipient of all useful information—including the financial and administrative authorizations—concerning the development budget and the operating budget. It is also the recipient of annual and biannual follow-up reports made by the People’s Committees and the People’s Committees for Shaabiats. These reports must show the expenses for the realization of the projects, the rate of their implementation, and the obstacles met during the realization.
At the shaabia level, there is one counsel for planning in each shaabia. The counsel for planning in the shaabia comprises the following: The secretary of the counsel for planning to the shaabia; the People’s Committee to the Shaabia; the coordination committee of the experts league to the shaabia; the secretaries of the research centers to the shaabia; the secretaries of the local agencies of the financial enterprises; the director of the local agency of the retirement fund to the shaabia; the director of the local agency of the social solidarity fund to the shaabia; and the president of the trade, industry, and agriculture chamber to the shaabia. The counsel for planning to the shaabia has, at the regional level, almost the same missions (all but [b]) as those of the General Counsel for Planning. The role of key institutions in the preparation of the development budget is as follows:
• The General People’s Committee for Planning (GPCP) reviews budget proposals, sets the appropriations, issues the tafouidha, and follows up the use of funds.
• The General People’s Committee for Finance (GPCF) prepares, in cooperation with the GPCP, the development budget and orders the transfers of the funds from the development account to the recipient’s contract executing accounts.
• The line General People’s Committees propose the sectoral contracts, implement them, and report to the GPCP. • The Central Bank of Libya administers the development account, transferring money from the development account to the
recipient’s accounts.
While the sectorial People’s Committees are in charge of the preparation and implementation of the contracts, the GPCP is the major actor in the final stage of the preparation, monitoring, and evaluation of the development budget. To that purpose, it involves four departments: the Department of Social and Economic Planning, the Department of Human Resources Growth and Planning, the Department of Monitoring and Evaluation, and the Department of Administrative and Financial Affairs.

56
4.16 A central feature of the Libya PIMS is that it is non-uniformly based on the term “contract” rather than on the standard budgetary term of “project.” This is explained by two reasons: (a) small contracts prevail as they fit inside a lower value threshold that exempts them from obtaining prior approval before release of their initial resources proceeds40; and (b) small contracts, with simplified procedures, work better for weak local administrations especially during the decentralization period, 1999–2005, when public investment was prepared at the shaabia level (except for some sectors like defense, justice, and external affairs).41 But not all sectors have applied this term uniformly. Indeed, whereas a few ministries design what could be considered as a project (for instance, the Ministry of Electricity, Water and Gas), most other ministries use contracts as unit. For instance, a General People’s Committee for Communications and Transportation report illustrates how what should be five components (activities) of the same project are split into separate contracts, as follows: (a) the first stage of deepening the second part of Cyrte harbor; (b) removal of the sand dunes around Cyrte harbor; (c) setting stop waves hurdles in the Cyrte harbor; (d) the first stage of deepening the third part of Cyrte harbor; and (e) setting the internal fence of Cyrte harbor. 4.17 The excessive fragmentation of public “projects” resulting from the extensive use of contracts in the public investment system is conceptually flawed and complicates project management unnecessarily. Annex A provides a detailed account of the excessive fragmentation that was predominant in the decentralization period among shaabiats projects. Conceptually, the standard definition of a project includes its goals, complete list of its physical targets, human resources and financial inputs required for its implementation, and projected starting and ending dates. These parameters allow its monitoring and evaluation during and after its implementation. In exchange, a contract often contains a smaller subset of those parameters. Thus, while the final goals of a project are formulated in relation to its different components and inputs, a contract often addresses an intermediary goal associated to a specific component. In addition, while the inputs of a project represent commitments to the final output, the inputs of a contract are commitments to partial outputs. It is obvious that the actual number of public projects is much lower than the thousands of contracts registered in the Libyan PIMS system, which complicates their preparation, monitoring, and evaluation. 4.18 In addition, Libya features dual budgeting, which represents a major obstacle to budget modernization and to efficient public investment planning and implementation. Nor only thedevelopment (capital) budget is prepared as a separate budget from the operating (current) budget, but the operating budgetis classified as administrative and financial in nature, while the development budgetis classified by sector. Hence, in practical terms, these divisions prevent proper joint programming for operating and capital expenditures. Furthermore, the absence of a modern budgetary classification (nomenclature) impedes the linkage of resources with specific sectoral policy objectives. Dual budgeting is discussed at length at the end of this chapter. 4.19 The development budget has its own earmarked resources. These are provided by the hydrocarbon exports (in 2007 representing about 90 percent) and by other sources (taxes, repayments of loans, profits of public firms, and so forth). The determination of resources to be financed from oil resources is done as follows. First, authorities estimate the budget financing requirement from oil revenues for year t, including projected current and development expenditures. Second, 5 percent of estimated oil revenues were initially earmarked to repay the “national debt” (intragovernmental arrears accumulated during the embargo period), but once such debt was abolished, these become non-allocated. Adding these two amounts constitutes the total budget financing requirement, and divided by the expected
40 Because the procurement law exempts contracts below LD500,000 from an ex ante audit certificate required for the first payment, there is a myriad of existing contracts in the
pipeline below that amount. 41 From 2006 onward, the preparation of contracts takes place at the level of the sectorial People’s Committees, not at the shaabia level.

57
level of production they determine an oil reference price, set at US$35 per barrel in 2007.42 Similarly, this reference price, multiplied by the expected level of production, less the amount required for repayment of the “national debt,” determines the maximum amount of oil revenues that may be used for financing the development budget at year t+1. This amount is further split in a 70/30 mix between the development and current budget, respectively).43 The residual balance of available oil revenues goes to the Oil Reserve Fund (ORF). 4.20 The resources of the development budget are on deposit in a “development account” located at the Central Bank of Libya (CBL). The so-called “projects” (contracts) are mostly funded by the budget, but in some cases they are funded by state banks, which transform the funds they receive from the development budget into loans to “projects.” In the latter case, state banks have to follow up the implementation of the projects they finance. Once the appropriation corresponding to the project is approved, the General People Committee for Planning (GPCP) issues an “authorization” (tafouitha44) that allows the transfer of the funds to each “project” account (see Box 4.1). This is an unusual role for a Ministry of Planning, which usually takes less care of the financial management aspects of public investment—a function normally realized by the Ministry of Finance—and concentrates, rather, on the follow-up and efficiency of these investments and their real impact on the population. The Budget Cycle for Public Investment 4.21 The preparation stage. During the decentralization period, the preparation of the development budget followed social and political considerations rather than standard rules. Except for one or two sectors (hydrocarbon, water) there were no explicit drafts of sectoral strategies to lead the choice of public investment projects. During re-centralization, the procedure has become standard. At a rather late stage of the fiscal year (July–August), the General People’s Committee for Planning (GPCP) issues a circular to sectors asking them for their development budget proposals for the next year.45 After it receives proposals, the GCPC fixes the schedule for discussions on those proposals with line ministries. The discussions are organized by the GCPC. A draft law follows. Once the draft is revised, it is forwarded to the GPC for its approval (see Box 4.2). 4.22 The preparation process markedly improved in 2007. Since 2007, a joint a commission GPCP-GPCF has drafted the law. Previously, to the Authorities’ credit, the macroeconomic scenario of the Fiscal Law has been prepared by the GPCP with contributions from the GPCF. To do so, Authorities have also made active use of a comprehensive macroeconomic model that has been built over the last 6 year (for the most recent version, see Merza 2008 a,b). In addition, for the first time, both, the preparation of the portfolio of the Public Investment Plan (PIP) and the setting of its global and sectoral ceilings (authorizations) followed a bottom-up approach and envisioned a multiyear horizon. The circular for 2007 was also unusually issued earlier than in the past (in May) and contained important innovations: For the first time, (a) a five-year plan was requested; (b) a questionnaire had be filled out by the sectoral People’s Committees defining quantified targets for their sectors and providing basic arguments in support of budget demands; and (c) more time than in past years was allowed to ministries to prepare their own budget requests. Such process was replicated in 2008.
42 Authorities indicate that the process is iterative depending on whether the reference price is lower or higher than the current or expected oil price. 43 Before the 1990s, an 80/20 ratio was applied to capital/current spending financed with oil resources, but it was modified during the 1990s fiscal crisis. 44 The tafouidha is an official form issued by the GPCP that allows the recipient of the project to proceed with expenses. To this purpose, the recipient needs funds to be
transferred from the development account (at the CBL) to its own account. Following the tafouidha, the transfer is completed after an order to transfer resources is given by the
GPCF). 45 Most countries send the circular on the preparation of the budget for year t+1 during the end of the second quarter of year t. Notice, however, that the circular for the current
budget is sent to line ministries in June, which reflects a segregated management between the two budgets.
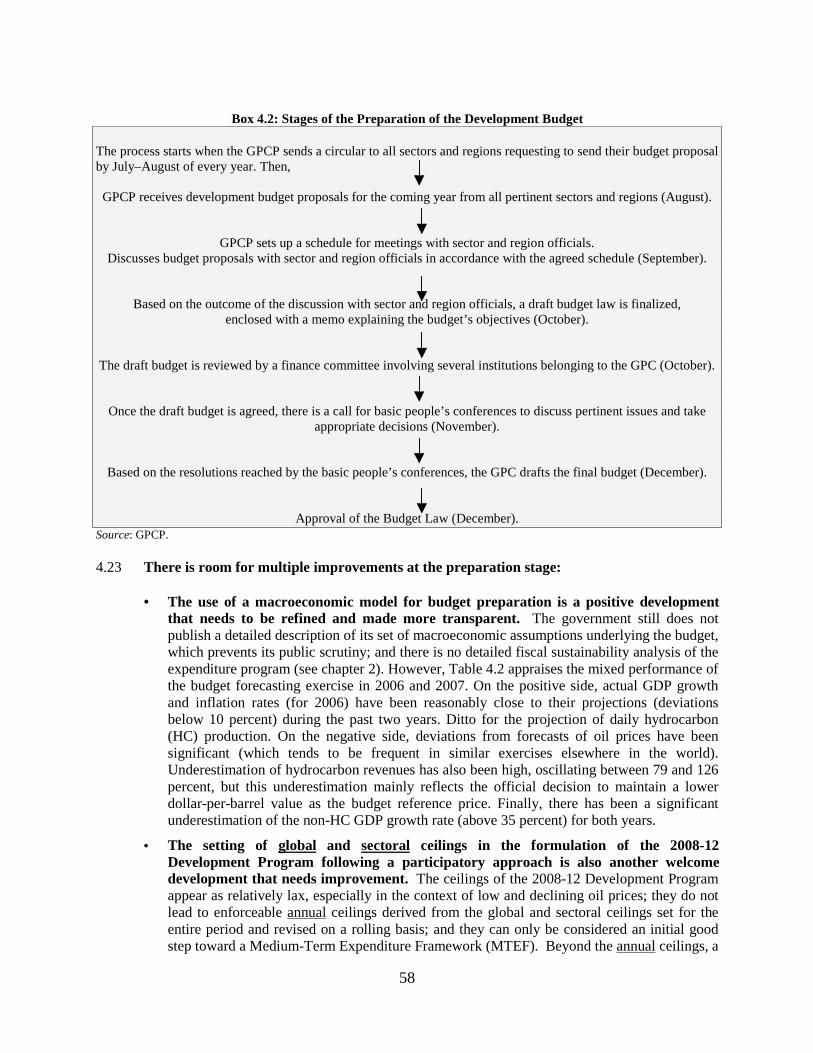
58
Box 4.2: Stages of the Preparation of the Development Budget
The process starts when the GPCP sends a circular to all sectors and regions requesting to send their budget proposal by July–August of every year. Then,
GPCP receives development budget proposals for the coming year from all pertinent sectors and regions (August).
GPCP sets up a schedule for meetings with sector and region officials. Discusses budget proposals with sector and region officials in accordance with the agreed schedule (September).
Based on the outcome of the discussion with sector and region officials, a draft budget law is finalized, enclosed with a memo explaining the budget’s objectives (October).
The draft budget is reviewed by a finance committee involving several institutions belonging to the GPC (October).
Once the draft budget is agreed, there is a call for basic people’s conferences to discuss pertinent issues and take appropriate decisions (November).
Based on the resolutions reached by the basic people’s conferences, the GPC drafts the final budget (December).
Approval of the Budget Law (December). Source: GPCP. 4.23 There is room for multiple improvements at the preparation stage:
• The use of a macroeconomic model for budget preparation is a positive development that needs to be refined and made more transparent. The government still does not publish a detailed description of its set of macroeconomic assumptions underlying the budget, which prevents its public scrutiny; and there is no detailed fiscal sustainability analysis of the expenditure program (see chapter 2). However, Table 4.2 appraises the mixed performance of the budget forecasting exercise in 2006 and 2007. On the positive side, actual GDP growth and inflation rates (for 2006) have been reasonably close to their projections (deviations below 10 percent) during the past two years. Ditto for the projection of daily hydrocarbon (HC) production. On the negative side, deviations from forecasts of oil prices have been significant (which tends to be frequent in similar exercises elsewhere in the world). Underestimation of hydrocarbon revenues has also been high, oscillating between 79 and 126 percent, but this underestimation mainly reflects the official decision to maintain a lower dollar-per-barrel value as the budget reference price. Finally, there has been a significant underestimation of the non-HC GDP growth rate (above 35 percent) for both years.
• The setting of global and sectoral ceilings in the formulation of the 2008-12 Development Program following a participatory approach is also another welcome development that needs improvement. The ceilings of the 2008-12 Development Program appear as relatively lax, especially in the context of low and declining oil prices; they do not lead to enforceable annualceilings derived from the global and sectoral ceilings set for the entire period and revised on a rolling basis; and they can only be considered an initial good step toward a Medium-Term Expenditure Framework (MTEF). Beyond the annualceilings, a

59
MTEF also requires to link specific intra-sectoral investment ceilings to the main expenditure categories of the economic classification, and to define explicitly their annual implications over current spending. The completion of a MTEF is a major challenge at the core of the government’s investment strategy. An MTEF is a key instrument with which the government can articulate its strategic spending—both current and capital—priorities within a sustainable fiscal resources envelope that is revised on a rolling basis.
Table 4.2: Libya Fiscal Law: Initial and Complementary—Assumptions and Actual Values
2006 2007 Projected Actual Projected Actual
GDP Growth (%) 6.5 5.9 6.5 6.8 Non-HC GDP Growth (%) 5.8 7.9 7.0 10.3 Inflation Year End (%) 2.0 2.8 10.0 7.3 Hydrocarbon Revenues (millions LD)
16.9 38.2 24.0 43.4
Daily HC Production (millions bls) 1.7 1.8 1.7 1.8. Crude Oil Price (US$/barrel) 26.0 62.5 35.0 69.1 New Employment (thousands) 135.0 — 100.0 —
Source: GPCP and IMF. — = Not available. Note: Budget assumptions also include an assumption on the growth rate of living standards and on the growth rate of
accumulation (proxy for investment). • For a few sectors included in the 2008-12 Development Program, projects (contracts) do not
emanate from comprehensive sectoral strategies for the simple reason that those were nonexistent or incomplete in many cases. The point of departure for sound public investment budgeting must be the formulation of updated comprehensive sectoral strategies. Among five sectors examined in this PER, two appeared with reasonably well developed strategies (power and health), one with some elements of a partial strategy (education at all three levels: general, higher and, perhaps a bit weaker, voluntary education), and two with essentially a list of general sectoral objectives: roads and water. Water prepared a draft strategy, dated 2004, that has been partly applied, and transports (which includes roads), has an outdated 1985 Master Plan.
• Ensuing resources programmed in the draft 2008–12 pipeline have little strategic content. According to GPCP officials, sectors submitted their proposals with little reference to resources assigned to medium-term priorities. And although sectoral strategic goals were accompanied by sectoral quantitative targetsfor a few sectors, there is no disaggregated intra-sectoral indication whatsoever as to how resources allocated (inputs) are related to such targets; as well as there is often a mix between outputs and outcomes in the definition of such targets. In the future, GPCP is considering introducing quantitative criteria by predefined weight and rankings, in a similar system that has proven somewhat effective in other countries (see below and Chapter 10) in forcing sectors to adopt new projects according to pre-agreed targets, which would limit discretion in their selection.
• Dual budgeting and misclassified current expenditure prevents project preparation to fully include current spending implications. According to authorities, the percentage of current spending in the development budget reaches could be 35 percent or above, and given the information contained in the project request forms, it is actually impossible to disentangle current from capital outlays. In the road sector, for instance, the practice of not separating (preventive) maintenance from rehabilitation or investment is generalized, and in most sectors, project expenses also include salaries, which are thus wrongly financed by the development budget.
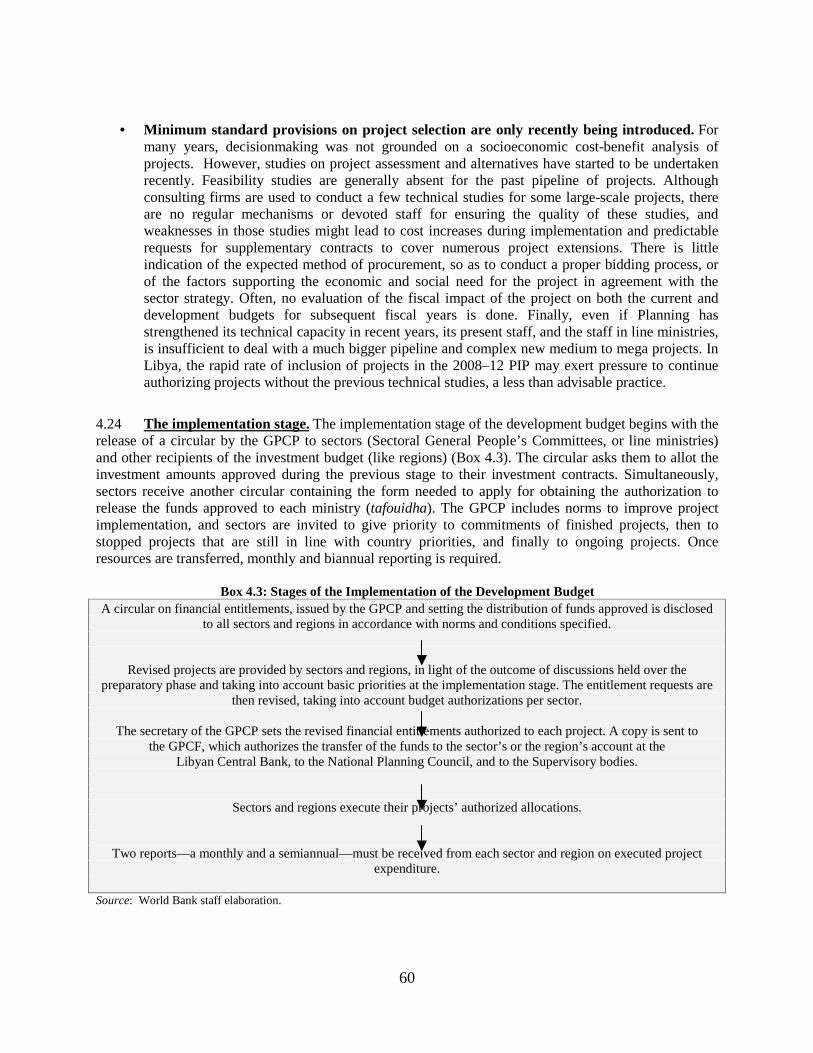
60
• Minimum standard provisions on project selection are only recently being introduced. For many years, decisionmaking was not grounded on a socioeconomic cost-benefit analysis of projects. However, studies on project assessment and alternatives have started to be undertaken recently. Feasibility studies are generally absent for the past pipeline of projects. Although consulting firms are used to conduct a few technical studies for some large-scale projects, there are no regular mechanisms or devoted staff for ensuring the quality of these studies, and weaknesses in those studies might lead to cost increases during implementation and predictable requests for supplementary contracts to cover numerous project extensions. There is little indication of the expected method of procurement, so as to conduct a proper bidding process, or of the factors supporting the economic and social need for the project in agreement with the sector strategy. Often, no evaluation of the fiscal impact of the project on both the current and development budgets for subsequent fiscal years is done. Finally, even if Planning has strengthened its technical capacity in recent years, its present staff, and the staff in line ministries, is insufficient to deal with a much bigger pipeline and complex new medium to mega projects. In Libya, the rapid rate of inclusion of projects in the 2008–12 PIP may exert pressure to continue authorizing projects without the previous technical studies, a less than advisable practice.
4.24 The implementation stage. The implementation stage of the development budget begins with the release of a circular by the GPCP to sectors (Sectoral General People’s Committees, or line ministries) and other recipients of the investment budget (like regions) (Box 4.3). The circular asks them to allot the investment amounts approved during the previous stage to their investment contracts. Simultaneously, sectors receive another circular containing the form needed to apply for obtaining the authorization to release the funds approved to each ministry (tafouidha). The GPCP includes norms to improve project implementation, and sectors are invited to give priority to commitments of finished projects, then to stopped projects that are still in line with country priorities, and finally to ongoing projects. Once resources are transferred, monthly and biannual reporting is required.
Box 4.3: Stages of the Implementation of the Development Budget
A circular on financial entitlements, issued by the GPCP and setting the distribution of funds approved is disclosed to all sectors and regions in accordance with norms and conditions specified.
Revised projects are provided by sectors and regions, in light of the outcome of discussions held over the preparatory phase and taking into account basic priorities at the implementation stage. The entitlement requests are
then revised, taking into account budget authorizations per sector.
The secretary of the GPCP sets the revised financial entitlements authorized to each project. A copy is sent to the GPCF, which authorizes the transfer of the funds to the sector’s or the region’s account at the
Libyan Central Bank, to the National Planning Council, and to the Supervisory bodies.
Sectors and regions execute their projects’ authorized allocations.
Two reports—a monthly and a semiannual—must be received from each sector and region on executed project expenditure.
Source: World Bank staff elaboration.

61
4.25 The cycle of expense is also standard. The steps include: commitment, tender committee, purchase order, committee for service delivery check and certification, payment order, and payment. The autonomy of the budget officers within line ministries is well defined. The payment procedure is secured by the obligation to obtain two different signatures for the issuance of the check (budget authorizer and accountant). The occurrence of fraudulent practices seems low with regard to the institutional practices (World Bank 2006). 4.26 There is room for multiple improvements at the budget execution stage as well:
• There is no fixed periodicity in the issuance of prior authorization by the GPCP, in a bureaucratic step that runs the risk of provoking involuntary implementation delays. The GPCP reviews each project and its full documentation in order to ensure the readiness and maturity of the project to be launched before releasing the funds. In some developing countries, such a prior authorization of resources allocated to projects takes place beforethe project is actually registered in the draft fiscal law and the law is approved. This late step in the Libyan case could be a direct result of the late start-up of the preparation stage of the development budget. In addition, this prior authorization may signal a temporary heavy involvement of the GPCP, during the time sound public investment norms are introduced government-wide, while reducing the autonomy of line ministries. In addition, the GPCP might incur bureaucratic delays, and the average could be higher due to four reasons: (a) incomplete forms submitted by sectoral ministries that do not have all paperwork required and are rejected for re-elaboration, (b) weak technical capacity in sectoral ministries for filling out these forms properly, (c) special paperwork required in some projects that requires more time to complete (like the special authorization needed for purchasing cars); and (d) eventual delays in processing of the authorization at Planning. Regarding the latter, and according to GPCP information, the average time lag between the formal receipt of a request for authorization and its issuance complies with the required five days. However, line ministries complain that the date of the formal receipt of a request often does not correspond to the date of its initial submission, and that the five-day average applies only to requests that already satisfy all requirements. Those incomplete and non compliant requests submitted, they argue, are only formally received once they do all prior adjustments and complete additional information, in a process often going longer than the five days indicated above.
• The choice of a contract instead of a project as the management unit for the allotment of the appropriations has some shortcomings. As mentioned, a project could comprise several contracts, and there is a real risk of approving separated contracts corresponding to the same project, while leaving a critical contract unauthorized. Hence, a legitimate question is whether allotment could be realized at a higher grouped level. The notion of chapter could be introduced. A chapter is a set of homogeneous investment actions that provide the same result in terms of services provided. The use of the chapter instead of the contract for the allotments of the funds would ease both the implementation stage and the monitoring of the sectorial public investment programs.
• Regularly appraising actual execution of investment expenditure is impossible under the present financial management system. Accounts are consolidated only on an annual basis and are not used systematically for reporting. This is due to the disconnect between the GPCF (Treasury) disbursement and payment processing, accounting, and reporting tasks undertaken by the line ministries. Hence, once the GPCF receives the authorization to release, and the Central Bank of Libya transfers, the funds registered on the authorization to the account of the recipient line ministry, resources are considered as executed. Although amounts unspent by a line ministry corresponding to the current budget are supposed to be transferred back to

62
the Treasury, this does not happen. And in the case of the resources of the development budget, these are allowed to be carried over. The lack of integration between budget accounting and reporting, and the incomplete and untimely status of reporting, also make very difficult an integrated expenditure planning with cash requirements.
• The procurement system is in need of review. The vast size of the PIP and the considerable increase in the number of contracts being awarded and managed in the context of the 2008–2012 PIP call for strengthening of the procurement management system. This should enhance the efficiency and transparency of the contracting process and prevent corruption, while ensuring swift execution of investments under sound conditions from the standpoint of cost-effectiveness, particularly in the case of mega- and medium-size projects.
4.27 The monitoring stage. Project monitoring is at an infant stage; it was only recently introduced and is limited to the financial monitoring of Executing Units that have projects under way. Monitoring is normally based on an effective and integrated information technology (IT) system, and on being user-friendly to both the budget authority and the project executor. In an effort to improve accountability, in 2007, GPCP introduced a biannual report on project execution in May (2006) and a monthly execution report. The monthly report is on the use of the funds received. The biannual report is on its financial aspects and, to the extent possible, on the execution of the contracts. In addition, there is a yearly report on the execution of the budget that includes much more detail. 4.28 There is room for multiple improvements at the budget monitoring stage:
• There is no comprehensive IT-supported database for projects yet. No sound project management can be made properly without a sound project database, whose design needs a modern nomenclature, and whose data feeding should be done on a daily basis. This database should provide not only financial, but also physical, information on progress toward reaching the target indicators of the projects. However, Planning has been working intensively to fill this gap, so as to dispose of a full database in 2009.
• The quality of actual reporting is poor, and only a fraction of executing units comply with reporting requirements. Projects do not set intermediary benchmarks, in physical or financial terms. Hence, measurement of progress in a project execution cannot be made on preset parameters. In fact, monthly and biannual reports contain only financial data on contract appropriations and payments done during the respective month or semester. However, commitments are not reported; payments reported by the line ministries and the shaabiats are not reconciled with the payment orders (issued by budget authorizers), information systems are rudimentary (manual) with no integrated IT system between line ministries and the Ministry of Finance in place, and monthly reporting on payments is disconnected from quarterly information collected for cash-based accounting (World Bank 2006). In addition, not all executing units comply with reporting: in 2007, and according to the GPCP, barely about a third (35 out of 95) of biannual reports were received, and even in the case of those submitted, some incurred delays in delivery. The 2007 execution report was only finalized in October 2008.
4.29 The evaluation stage. Rules that norm the evaluation stage are determined by the Planning Law. This task is of great importance to make sure that resources are not wasted and to learn lessons for the design and implementation of future projects. In practice, however, the country is only recently starting to pay attention to project evaluation, given insufficient human and financial means allocated to this task.

63
IV. Policy Recommendations 4.30 Libyan authorities recognize the need for reforming toward a modern budgetary system that would support sound fiscal policies and efficient budget management, and enhance the quality of public service delivery. An effective public investment system is a central component of such reform. It requires six critically interrelated tasks in sequence:
a) Refining the ongoing formulation of a medium-term expenditure framework by (a) setting the development budget annual needs in agreement with annualglobal and sectoral ceilings; (b) tightening their link to current expenditure needs; (c) reducing its forecast horizon from five to three years, so as to minimize forecasting errors, while continue revising its projections on a rolling annual basis; and (d) assessing its fiscal sustainability in the medium term at least every year (see Chapter 2).
b) Taking advantage of the recent merging of Finance and Planning so as to convert the new ministry in the pivotal point for strategic decision making and project implementation, while creating a special unit to deal with mega projects that reports directly to the General Planning Council.46 Figure 4.6 describes the proposed new policy-making process for public investment.
c) Completing the formulation of key sectoral strategies that frame the priority pipeline.
d) Maintaining the pace to introduce high quality standards in project selection.
e) Fostering project execution.
f) Timely supporting the ongoing introduction of project monitoring and evaluation so that results feed back into the investment cycle.
4.31 On the design of the medium-term macrofiscal framework, key actions could include:
• Institutional strengthening of the recently created interministerial macrofiscal management unit. This unit was initially created to prepare the macro frame of the 2008-12 Development program. A broader mandate would allow it to monitor the evolution of the fiscal accounts under the 2008–12 pipeline; prepare updated macroeconomic and fiscal scenarios for the Cabinet; and continue revising those projections on a rolling year basis. The unit could join efforts of the new ministry of Finance and Planning with Central Bank staff and be recipient of continuous specialized training. A detailed review of the macroeconomic model, its performance and possible extensions would also be a welcome development.
• Adopting a realistic stance and gradually reducing the total amount of the projected development budget during 2009–12, toward a medium-term benchmark ratio (for example, 16 to 18 percent of GDP—the pre-windfall level of 2005).47 This benchmark is based upon a reasonable soft landing described above, especially in the context of falling oil prices (para 3.14). More important, it is consistent with the LD25 billion per year that Authorities have estimated as baseline investment volume for the period 2009-12 under updated assumptions of falling oil prices in their macroeconomic model. Such figure would be equivalent to about 17.6 percent of GDP in 2008 (GPCP 2008 and Merza 2008c).48 Setting a benchmark would give medium-term visibility to fiscal policy. And according to the
46 This report does not take any stance on whether such unit should be in or out the jurisdiction of the recently merged ministries of Finance and Planning, as this is a political
decision. However, it conveys the necessity that such unit had special reporting access to the GPC. 47 If the actual development (capital) budget execution rate approaches 80 percent (of 24.4 percent of GDP), then the 2007 projected execution of the development budget might
be equivalent to about 20 percent of GDP, a figure that still remains very high by international and Libyan standards. 48 The official documents even conclude that if the oil price goes down below US$30 per barrel, the annual amount of investment should go below LD25 billion.

64
authorities, the speedof the rationalization of the planned investment under the development budget (transition period) should be determined by (a) the antyciclical policy played by authorities (see chapter 2), (b) the intensity of inflationary pressures, and (c) the speed at which the private sector becomes offsets the expected decrease in public investment (GPCP 2009b). Furthermore, the sequence (ordering)of the projects to be slowed down or scaled back should be determined by sectoral priorities and micro considerations (see below).
• Maintaining a prudent fiscal stance regarding hiring during the period of fiscal expansion. This implies minimizing the permanent increase in current expenditure generated by the accelerated introduction of new projects, thus avoiding the creation of potentially serious social risks in the medium term in the event that the record-high oil prices return to more normal levels.
• Before the definite 2008–12 pipeline is approved, carefully considering the gradual authorization of new projects. In addition, authorize those corresponding to 2009, only once the effective implementation of the projects authorized in the 2008 budget has been assessed by the sectoral ministries and Planning.
Figure 4.6: The Proposed New Public Investment Management System for Libya
General Planning Council(Discusses and makes
general decisions)Relies on its Secretariat
(Analyses proposals, approves projects)
General People’s Committee for Finance and Planning
(Instructs public investment directives, advises on
projects’ approval)
Feasiblity Studies commissioned for major projects
Quality at entry directives issued for mid to low-size Projects and authorization
Validates Project
Profiles, and reporting provided
Local Planning Councils(Reviews proposals with
local significance and monitors implementation)
Desig
nPu
blic
Inve
stm
ent
Polic
yFr
amew
ork
Project Proposalscan be initiated by…
Shaabiats
Local Branches of Sector GPCs
Authorization
Special Unit for
Mega Projects
Sector General People Committee’s (Strategic goals and
performance indicators)
Decentralizedm
onitoringandreporting
Projectsimplem
entation
Source: World Bank staff elaboration.
4.32 On the upgrading of the public investment management system (see Figure 4.6):
• The General Planning Council (GPC) could establish parallel tracks for processing types of projects depending on their size.49 A major obstacle for project management, both at line ministries and at Planning, is the present mix of large (mega)-scale with medium-size and small projects (contracts). And the number of new projects has significantly increased in the draft 2008–12 PIP. A differentiated treatment is possible under a threshold to be defined.
• Given the complexity of, and responsibility involved in, the sound management of mega public projects, some countries have even opted for creating a special independent agency dealing with “Special”—generally large-scale—projects. This is the case of Algeria with the Caisse Nationale d’Equipément pour le Développement (CNED) (Box 4.4).
49 Size cannot be the only criterion. In Morocco and Algeria, for instance, the PIP divides projects per Executing Unit into three categories: centralized, de-concentrated, and
decentralized.
65
Box 4.4 The Special Role of the CNED in Algeria The Caisse Nationale d’Equipément pour le Développement (CNED) was created to help address multiple weaknesses in project preparation and execution in Algeria. It is an autonomous public enterprise of industrial or commercial nature created by Decree 04–162 of June 5, 2004. The CNED is governed by a board chaired by the Minister of Finance, and comprises four other ministers in addition to the minister directly concerned with the issue under discussion, and individuals selected for their competence and credibility. Management is entrusted to a director-general with the autonomy and responsibility appropriate to a professionally run enterprise. The decree envisions several roles for the CNED, but in the context of the central need to support the efficient implementation of the 2005–09 investment program, it focuses on essential functions—technical oversight of the preparation, execution, and evaluation of major projects, and guidance and facilitation of capacity building in the line ministries.
The CNED began its activities in June 2006, with the review of three major ongoing projects, and became fully operational before the end of 2007. It has wide-ranging technical responsibility. This includes technical functions to (a) provide a prior opinion on the general economic viability of major projects ideas before detailed studies and other formal preparatory steps are launched; (b) confirm that the procedures are respected in form and substance, with confirmation required before a project can be included in the investment budget; (c) follow up the execution of major projects; (d) lead the preparation of manuals, guides, and procedures for the concerned staff in the line ministries; and (e) initiate evaluations of major projects and build evaluation capacity within line ministries.
In its review of project preparation, the CNED is expected to ascertain the consistency of the proposed project with the sector strategy. If an appropriate strategy is lacking, incomplete, or out-of-date, the CNED may comment to the extent that such factors could impede the preparation of economically sound projects. However, as a technical body, the CNED has no authority to review the sectoral strategies themselves, let alone contribute to their reformulation. The formulation of sector strategies is the core responsibility of the concerned ministries in consultation with each other and the Ministry of Finance, and they must be approved at the highest levels of government.
The scope of CNED authority is limited to “major projects.” These are defined by quantitative and qualitative criteria, as noted earlier. The quantitative criterion of the project (or program) is its total cost, including both the initial investment and estimated future recurrent costs, with a uniform threshold and higher thresholds set sector by sector. The qualitative criteria can include the special innovative nature of certain projects or programs, or unusual risks that the project entails. Because application of the qualitative criteria sometimes requires judgment calls beyond the domain of the CNED, the scope of its operations essentially covers all major projects that reach the total cost threshold, and any other projects or programs for which the Minister of Finance specifically requests review by the CNED. However, at the local level, CNED must, for example, let some local institutions act, such as the territorial divisions in charge of planned investments (DPAT), which conceive strategic sector plans.
CNED has a light structure. “Light” here implies short lines of command, a small team of highly competent staff, and an operational mode that commissions and supervises studies and reviews by external consultants.
• Organization. Under its director-general, one CNED office for administration supports three functional offices headed by directors for, respectively, methodology, review of major project preparation, and monitoring of major project execution. A small section for evaluation could become a full-fledged office.
• Staffing. About 35 to 40 professionals and a small support staff. Professionals would include a small number of task leaders (chargés d’études) trained in economics, preferably with some engineering background and the personal qualities and professional flexibility to move from one task to another across sectors. There would also be a group of specialists in a pool from which they contribute as required. By contrast, the monitoring of project execution would require technical specialists in each sector.
• Accountability. External audit of the financial transactions of CNED itself is ensured by the Court of Accounts. Professional ethics, integrity, and resource use would be monitored by the General State Inspectorate. These arrangements would apply to the CNED, as they would to any public enterprise. However, in this case, a special “review of reviewers” would be provided in the form of periodic substantive audits of the technical quality of CNED activities by an independent, external entity.
CNED operations are managed and overseen by the government. They are part of the much broader challenge of improving the efficiency of public investment in the medium term and in sustainable ways. Thus, even though the CNED is expected to be active for a number of years, its existence is essentially justified during a phase of transition from a system without effective quality controls to a system where such effective controls exist and are exercised primarily where they belong—in the line ministries themselves.
Source: World Bank staff elaboration

66
Such special Technical Unit could be created with a certain degree of autonomy. If the latter option is adopted, the bulk of the work at the GPCP would then rather concentrate on medium- to low-size projects (under a threshold to be defined). Even small (mostly decentralized) projects—below a certain threshold—could have a simplified track. This would make project processing more effective
• Even in the case of no introduction of separate tracking, a straightforward suggestion for the streamlining of project management would be to have a “simplified regime” for those projects below (or above) a certain threshold. An interesting example is Canada, with a two-stage process for certain “big” projects only (Box 4.5). For its part, Peru has a simplified “grouped by conglomerates” regime for “mini” projects executed by local governments. Such regimes involve lighter project preparation and procurement procedures.
Box 4.5. Approval Procedure for Investment Projects in Canada
Only projects from CAN$1 million to CAN$60 million (depending on the sector and the nature of the project) must be approved by the cabinet committee responsible for expenditure and personnel management—that is, the Treasury Board (supported by the Treasury Secretariat).
A two-stage approval is limited to specific phases of the project that have been appropriately defined and costed. First, Preliminary Project Approval (PPA) allows all or part of the project to be defined. To support a proposal for PPA, departments must demonstrate a requirement directly related to the achievement of program goals and responsibilities. They must show that the proposed project is the best way to meet that requirement. Second, when the project is fully defined, the responsible ministry requests Effective Project Approval (EPA) in order to fund and implement the project. The EPA also establishes the cost and other critical dimensions of the project baseline. Detailed requirements are specified for submitting a project for both PPA and EPA. Exceptions for special types of projects are allowed that effectively combine the PPA and EPA into a single approval process.
Source: Project Management and Other Policies Guidance, Treasury Board of Canada Secretariat (http://www.tbs-sct.gc.ca/pm-gp/category-categorie.asp?Language=EN&site=PMD&id=081)
4.33 On the formulation of key sectoral strategies, authorities could:
• Thoroughly complete the preparation of comprehensive sector strategies. Sectoral line ministries engaged in mega projects should have urgent priority, because the country risks engaging in “white elephants”; and for those engaged in medium-size projects, ensure due consideration to their interaction with other sector needs.
• Encourage sectoral ministries to also define annual budgetary ceilings, through iterative permutations between line ministries and Finance, and adjusted on a rolling basis annually. The ceiling should be a joint effort by the line ministries and the GPCP in conjunction with improved modeling and information methods. These ceilings could be defined either as a percentage of the total development budget or as a percentage of GDP. Such action would frame the negotiation between Planning and Finance and sectoral ministries over the inclusion or exclusion of certain new projects, given a maximum sectoral allocation. They can also be used as criteria for in-year budget allocations. Another advantage of this approach is that each ministry would know in advance what is the projected size of its investment envelope for the following years, and government priorities regarding the investment program would be transparent. As a rule of thumb, if annual sectoral ceilings were to be adopted, their initial setting should closely follow historical rates of execution, with the exception of those ministries implementing mega projects. Box 4.6 defines a best practice process of defining sectoral ceilings for Peru (under the framework of a MTEF), which are also published widely.
67
4.34 On the maintenance of high quality standards in project selection, the authorities could implement several actions:
• A culture of “Quality at Entry” in project preparation could be promoted, by progressively introducing minimum technical standards. Minimum standard provisions are defined below. Quality at entry should be guaranteed by sectoral line ministries through the individual definition of sound portfolios composed of well-selected projects, and prior to budget approval. This implies an early launching of necessary feasibility studies that ensure the selection of the best in their portfolio.
• A Manual of technical standards on public projects should be prepared and these standards gradually introduced. Minimum standards could contain at least the following requirements: (a) an indication of the factors supporting the economic and social need for the project in agreement with the sector strategy; (b) a feasibility study, at least for selected medium-size to mega projects, with specific technical requirements adopted per type of project; (c) an indication of the expected method of procurement, so as to conduct a proper bidding process; and (d) an evaluation of the fiscal impact of the project on both the current and development budgets for subsequent fiscal years.
Box 4.6. The Stages of Definition of Sectoral Ceilings in Peru
As part of the Law on Fiscal Prudence and Transparency, since 2000, the Government of Peru has published Multi-Annual budgets (MABs), themselves based on Sector Strategic Plans (SEPs). MABs represent the bridge between annual and multiannual budgets, and sustain medium term political priorities. They cover both, current and capital expenditure, albeit a good share of the current budget is rigid and has little space to change for it is devoted to salaries. Sectoral ceilings are adopted in a highly iterative process, and take place before and after budget approval. The 8 steps to set them up work as follows.
1. Agreement on a macro- fiscal budgetary framework for 3 years (revised annually). Based on a macro-fiscal model, the exercise is led by the ministry of Finance, but has significant technical participation from the Central Bank. Unless the economy is subject to a major shock, this exercise takes place only once a year. Then, the adoption of the multiyear framework frames the setting of the sectoral annual budget ceilings.
2. Development by line ministries of sector strategic plans (SEPs) on sector objectives, outputs and initial costing of priority activities (only). Some indicative multiyear sectoral ceilings are defined for a few ministries only.
3. Initial definition of the overall and sectoral annual ceiling resources allocations by the ministry of finance, followed by its written communication to line ministries, so they formulate their annual budgets under such soft constraint. Annual ceilings should be consistent with their multiyear targets.
4. Formulation of a counterproposal of sectoral annual ceilings by line ministries (small deviations from initial ceilings allowed).
5. Multiple and iterative arbitrages on the sectoral annual ceilings (and expenditure programs) between line ministries and the ministry of finance take place.
6. Final decision on sectoral annual ceilings adopted by the Prime Minister (for unsolved budget allocations arising from the arbitrage process).
7. Presentation to Parliament for approval, followed by wide dissemination of multiyear budget, together with the annual budget finally approved.
8. In year-adjustments take place on the sectoral ceilings, based on actual expenditure execution by line ministries (which de facto modify them to a minor extent). Doing so rewards performance in budget execution.

68
• Budgetary reclassification is an urgent and top priority, and entails a proper definition of programs (groups of projects) or projects, while redefining most actual contracts as subprojects or activities. Grouping the multiplicity of actual contracts would be an ad hoc solution to project fragmentation, but under the present budgetary classification, it would just be a “second best” solution. The new classification would also make a proper distinction between current (operating expenses) wrongly classified as pertaining to investment, and capital expenses. The new budgetary classification must be in line with the IMF’s 2001 Government Finance Statistics Manual. It defines sectors, subsectors, programs, and so forth. This would be a major action that would assign budget allocations to true projects; eliminate actual project fragmentation through contracts, that is, their grouping, under a standard nomenclature; and facilitate success of a differentiated tracking policy in project management.
• An alternative and technically more advanced solution that a few developing countries have applied in new project selection consists of the introduction of an IT-supported scoring system that quantitatively ranks (and selects) projects according to preestablished criteria. Chapter 10 develops this topic extensively, with an eye on the 2008-12 Development Program. So, this section barely introduces a simplified version of the methodology as follows: First, new projects are listed and rated according to selected criteria. Then, those with the highest rates are selected, minimizing discretion and political interference in project selection. This system has been applied with some success in the Maldives Islands and Afghanistan, and in a much simpler framework, in Guatemala. Other examples are mentioned in Chapter 10. Based on international experience, there are multiple caveats to keep in mind to optimize the efficacy, reliability, and transparency of such a scoring system. These caveats are that: (a) the number of criteria should be small; (b) different weights (percentages) should be assigned to each criterion in an agreement between Planning and the sector authorities; (c) sectoral ceilings should be adopted first, otherwise good projects concentrated in a few high-ranked sectors might prevail over lower-ranked projects in other sectors—that is, good projects in a sector should be adopted until they fill its sectoral quota; (d) a final, qualitative review of the final ranking per sector should make only very minor discretional adjustments, such as, between two projects with the same or similar score; and (e) decisions should be final. Old projects do not participate in the ranking exercise, but they should be reviewed annually with respect to their progress, so that their eventual downsizing or elimination opens further fiscal space for approving new projects in their own sector.
4.35 On the fostering of project execution, several possible recommendations follow:
• The process of authorization might need streamlining and training. The present database system at the GPCP does not have enough hard data to track the submission of project proposals from its initial stage, only from the moment the submission is accepted. Completing such a preliminary step and providing technical assistance to prevent rejections is needed.
• Investment projects could look for opportunities for public-private partnership (PPPs) or other forms of private participation. Several principles apply:
o These projects should be examined and programmed on an integrated basis. They must be consistent with overall government and sectoral policies.
o Projects implemented under PPP agreements should have specific benchmarks to measure progress.
o The fiscal and governance risks attached to PPP agreements should be very carefully assessed.
69
• Project implementation (maîtrise d’oeuvre) could be strengthened. The line ministries are responsible for project choice and ownership (maîtrise d’ouvrage), but in the absence of highly skilled staff, often delegate or outsource to private firms the responsibility for execution, or in some cases, to the head of the shaabia, under the supervision of the ministry concerned. These private firms enjoy in practice a high degree of autonomy, and their follow-up implementation is poor. In any case, delegation does not mean abdication of responsibility, and effective contracting demands adequate negotiating and monitoring capacity of the line ministry, and close oversight by central entities. Where the ministry lacks such capacity, it should contract an independent entity to act in its behalf. A specialized agency, like the Algerian CNED (see Box 4.2), can also make a short-term contribution to improving project execution, but the longer-term solution lies in strengthening both the capacity and the accountability of the line ministries concerned.
• The public procurement code could be reviewed. This activity goes beyond the scope of the PER, but is critical. Initially this could suggest, among other things, the following technical actions:
o Preliminary preselection of enterprises when studies are being finalized or specifications prepared for major projects. Preselection should take place on the basis of quantifiable technical criteria that are clear and transparent, based on the work to be done or supplies to be provided.
o Streamlining of procedures and provision of incentives for participation in small projects would attract the development of Small and Medium Enterprises (SMEs) in local projects.
o Standardization of technical specifications for facilitating close monitoring and oversight of all contracts. This would most likely permit an assessment of the effectiveness of procurement and contract management and would allow sufficient time for the adoption of corrective measures, in the interest of project execution.
• Continuous procurement training should be provided to relevant staff at adequate levels in all line ministries.
4.36 On timely monitoring and evaluation, possible steps include:
• Monitoring could be based on a performance-based system. Current regulatory instruments for project reporting should be enforced and upgraded from a manual to an IT-based virtual system. A possible solution for guaranteeing that Executing Units in line ministries comply with compulsory reports is to enforce the norm that links project authorizations to regular reporting of their projects. In addition, building a performing system also requires (a) an IT-supported database (the Ministry of Planning already has a simple one, but is not a virtual one); (b) a few key—physical and financial—sectoral- and project-specific performance benchmark indicators; and (c) perhaps replacement of the monthly report with a quarterly report, thus allowing Executing Units to have more time to provide more detailed information on projects.
• In the medium term, the practice of signing performance contracts for project execution could also be introduced with Executing Units in charge of major projects.
• Given the lack of project evaluation, its gradual introduction could be piloted on a few selected, medium-size projects, and its results fed back into the preparation and implementation process. In the short term, this activity could easily be outsourced, while being properly monitored by Planning. In the medium term, though, significant training could be provided to the Executing Units in line ministries, and by Planning ex post evaluation.
70
V. The Challenge of Budget Unification 4.37 Budget unification has been identified by several sources as the cornerstone of budget modernization in Libya. The IMF (2006) indicates that unifying the coverage of the presently dual budget constitutes a key component of a broader medium-term reform. In its view, the past diffusion of responsibilities between the Ministry of Finance and the Ministry of Planning made it difficult to form a unified view of budget reform, to identify a champion of the reform process, and to ensure its effective leadership. In practice, specific areas of reform would present various technical and policy issues on which difficult decisions would have to be taken by a single entity. Perhaps the best example is offered by one of its key requirements: a new budget reclassification that integrates the budgets for current and capital expenditure. For its part, the World Bank (2006) adds that in the case of Libya, it is a concern, because no institutional mechanism seems to be in place for ensuring the adequate fit between both expenditures; because the 30/70 ratio devoted to current/development expenditure may be a source of inefficiency; and because the fragmentation of the budget makes it difficult to adequately program joint expenditures for operation and maintenance, which is key for the optimal use of public capital. Put in simple terms, dual budgeting often translates into hospitals that lack funding for medical staff and supplies; schools without sufficient funding for teaching staff, supplies, and materials; and roads without proper maintenance. Dual budgeting can also lead to waste, because it can duplicate funding on the same activity, especially if reporting systems are weak. Libya is no exception, as shown by numerous sectoral examples below. 4.38 Dual budgeting originated in European countries in the 1930s, but it lasted only briefly. It essentially helped governments ensure that resources they borrowed were used only for capital expenditures in a period of massive reconstruction work. After World War II, though, budgets in those countries were reintegrated, with the exception of Belgium, France, and Spain. However, in the 1960s, dual budgets resurfaced in many developing countries in Africa, Latin America, and the Middle East, and in countries having European roots; and in many Eastern European countries where National Development Plans (NDPs) became a leftover of the Soviet-era planning model. With NDPs went dual budgeting, separate investment/development budgets (supervised by the Ministry of Planning), and current budgets (supervised by the Ministry of Finance). 4.39 Recent trends in budget unification call for merging the ministries of Finance and Planning as Libya recently did. Nowadays, several English-speaking developing countries have merged their finance and planning or development ministries, as in Bangladesh, Botswana, Ethiopia, Jamaica, Lesotho, the Gambia, Tanzania, and Uganda. Similarly, most French-speaking African countries have completed this stage, as in Cameroon, Cape Verde, the Central African Republic, Comoros, Guinea, Guinea Bissau, Madagascar, Niger, Rwanda, and Togo. Finally, other developing countries like the Czech Republic, the Republic of Korea, Mauritius, Mexico, Paraguay, Sri Lanka, and Thailand have closed their planning or development ministries and absorbed them into their finance ministries (Sarraf 2005). 4.40 However, a minority of other developing countries, mainly in the Former Soviet Union, still retain two separate ministries. This is the case of China, Mongolia, and Turkey. In this regard, even if the Chinese model is essentially a heritage of the traditional planning model, it is remarkable in not preventing the economy from attaining very high rates of growth. 4.41 Hence, despite the fact there seems to be worldwide acceptance that unified budgeting works better than dual budgeting, a country might still have powerful reasons that could prevent budget unification, in part because there are obstacles to a swift merging of both ministries. One reason could be political: countries with surviving dual budgeting in favour of a mix between a group of strong economic advisors in Planning, close to the Prime Minister, and a weak and purely operational

71
Ministry of Finance. Another possible reason could be institutional rivalry, as the merging might imply seniority problems in combining staff at Planning, often economists/planners who have gained few promotions and are perceived as undergraded, and staff at Finance, often financial analysts, who have gained new ranks rapidly and perceive the merging as a downgrading of their status. More fundamentally, a third reason could be the lack of clarity regarding the functions to be played by Finance. In strict terms, the core functions of a Ministry of Finance are three: (a) mobilizing resources; (b) ensuring the integrity of public financial management systems; and, to a partial extent (c) stewarding macroeconomic policy, especially revenue forecasting and macro policy advice. In this regard, the extra function of allocating public expenditure, and capital investment in particular, is not part of the exclusive core mandates of a Ministry of Finance or of a Ministry of Planning, but rather of a collegial decision making body, normally entrusted at the highest level of the Cabinet. The advantage of this flexible setup is that, whether budgets are merged or not, it puts the responsibility of agreeing on sensible expenditure plans squarely where it belongs: in the Cabinet. As a result, the decision on proceeding (or not) on budget unification can be perceived as a significant governance issue that would essentially affect political power, institutional rivalries, and a complex decision-making process at the highest level of government. 4.42 On technical grounds, though, the integration of current and development budgets is a needed development for Libya for various reasons:
• Massive amounts of capital expenditure now involve significant amounts of misclassified current expenditure (they can go above a third of development outlays);
• Wasted (duplicated) resources from both budgets addressing the same activity should be prevented; and
• Only an integrated analysis of both types of expenditures can identify an optimal mix of expenditures toward similar social outputs and outcomes (in anticipation of a results-oriented budgeting process).
4.43 Even if Libya has decided to merge both ministries last March 2009, and assuming it desires to achieve unified budgeting rather soon, there is no single path toward such an objective. Thus, beyond the “what to do,” there is an important “how to do it” question to respond to. In so doing, the country will have to define its own budget integration strategy. According to international experience, such strategy requires four components. 4.44 The need for a modern budget reclassification. A new budget reclassification would facilitate the effective integration of the preparation of current and capital budgets in an operational sense, that is, in the detailed classification of budget revenues and expenditure (Weber 2008). The standard budget reclassification combines the economic classification based on the IMF Government Finance Statistics Manual (GFSM) of 2001, and a functional classification consistent with the Classification of the Functions of Government (COFOG) published by the United Nations, with funds being appropriated at the level of the main categories of the economic classification (current and capital) (IMF 2006). In addition to the economic and functional classifications, it should also include a legislative classification appropriations (with administrative agency mandates); an administrative classification defining appropriations according to administrative spending agencies (typically line ministries); and, at a more advanced stage, a program-oriented classification, aligning budgetary activities with specific government policy objectives, supported by performance objectives and indicators. Finally, the basic, but visible and readily achievable step toward integrating budget presentation consists of a summary table in the budget preparation law presenting the total planned (current plus capital) fiscal operations for the next fiscal year, also including a single fiscal balance and common sources of financing (in case of a deficit). 4.45 The need for institutional reorganization and mobilization of staff in the merging of both ministries. According to Stevens (2008), one country that merged Planning and Finance quickly and

72
successfully was Botswana, in 1970. No external consultants were involved in this task, only nationals. In fact, Planning took over Finance, as Planning officials had a high-prestige function—the production and implementation of the National Development Plan, together with donor aid management. Key to integrating two different institutional cultures was to put senior officials from Planning and Finance opposite each other on the same corridor. Also critical was to integrate both filing systems (which nowadays would mean developing an IT-supported integrated fiscal information system). Finally, the merger was spearheaded by the naming of the Minister of Planning as the minister of the new Ministry of Finance and Development Planning, as it is the case in Libya. The entire process was completed in a month, with every staff moved to his or her new position and new functions assigned. 4.46 The need for integration of budget preparation. Ideally, countries unifying their budgets should move toward the preparation of the budget under a single operational unit. Several initial steps can help, like unifying budget preparation schedules. Another important milestone is to integrate the previous macrofiscal units in both ministries into a single unit. Finally, designing a single manager department with staff from both previous budgets could help speed the merging process. In this case, merging would be effective, otherwise “unification” revert into “coordination” between the two budgets (Sarraf 2005). 4.47 The need for unification of the accounting and reporting systems. A common rule of thumb in eliminating dual budgeting is that the integration of budget preparation is much easier than that of budget execution. The integration of both systems at the execution stage is a critical, and perhaps the most difficult, part of the process. It is so difficult that many developing countries still use different accounting systems and reporting schedules for several reasons: (a) the budget appropriation structure often does not go beyond a single line item for each project; (b) budget reclassification takes time to materialize; (c) separate banking arrangements tend to exist for projects (there are above 4,000 banking account and no Treasury single account in Libya (IMF 2006); and (d) there is little incentive to break the operational (that is, procurement, auditing, accounting) procedures that apply to separate current and capital spending (Sarraf 2005). This is why, Libyan budget unification would have to work only slowly on this dimension, with a possible initial step consisting of the preparation of standard monthly reports using a common spreadsheet application. These reports would show the status of budget execution for both the current and capital budget. Another useful suggestion would be the creation of an entrusted committee from both merging ministries that would evolve over time into a unified entity performing joint accounting and reporting systems, while gradually clarifying and strengthening their needs in terms of functions and personnel (GPCP 2009b).
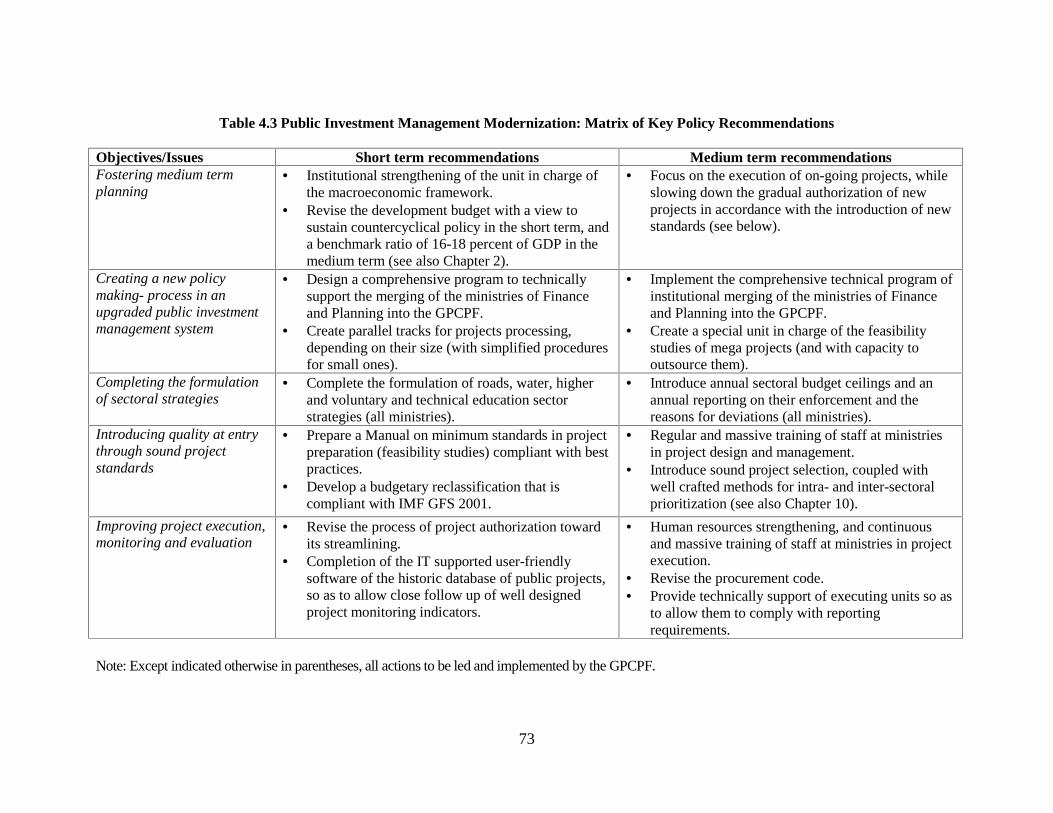
73
Table 4.3 Public Investment Management Modernization: Matrix of Key Policy Recommendations
Objectives/Issues Short term recommendations Medium term recommendationsFostering medium termplanning
• Institutional strengthening of the unit in charge ofthe macroeconomic framework.
• Revise the development budget with a view tosustain countercyclical policy in theshort term, anda benchmark ratio of 16-18 percent of GDP in themedium term (see also Chapter 2).
• Focus on theexecution of on-going projects, whileslowing down the gradual authorization of newprojects in accordancewith the introduction of newstandards (seebelow).
Creating a new policymaking- process in anupgraded public investmentmanagement system
• Design a comprehensive program to technicallysupport the merging of theministriesof Financeand Planning into the GPCPF.
• Create parallel tracks for projects processing,depending on their size (with simplified proceduresfor small ones).
• Implement the comprehensive technical program ofinstitutional merging of theministriesof Financeand Planning into the GPCPF.
• Create aspecial unit in charge of the feasibilitystudiesof mega projects (and with capacity tooutsource them).
Completing the formulationof sectoral strategies
• Complete the formulation of roads, water, higherand voluntary and technical education sectorstrategies (all ministries).
• Introduce annual sectoral budget ceilings and anannual reporting on their enforcement and thereasons for deviations (all ministries).
Introducing quality at entrythrough sound projectstandards
• Prepare aManual on minimum standards in projectpreparation (feasibility studies) compliant with bestpractices.
• Develop a budgetary reclassification that iscompliant with IMF GFS2001.
• Regular and massive training of staff at ministriesin project design and management.
• Introduce sound project selection, coupled withwell crafted methods for intra- and inter-sectoralprioritization (see also Chapter 10).
Improving project execution,monitoring and evaluation
• Revise the process of project authorization towarditsstreamlining.
• Completion of the IT supported user-friendlysoftwareof the historic database of public projects,so as to allow close follow up of well designedproject monitoring indicators.
• Human resources strengthening, and continuousand massive training of staff at ministries in projectexecution.
• Revise the procurement code.• Provide technically support of executing unitsso as
to allow them to comply with reportingrequirements.
Note: Except indicated otherwisein parentheses, all actionsto beledand implemented by theGPCPF.

74
Chapter 5: Balancing Efficiency and Quality of Education in Libya
Despite Libya has made considerable achievement in access to education, supported by sizable investments, the poor quality and low performance of the education system are its main concerns. There are no systematic efforts to monitor students learning achievement, or to assess the percentage of graduates who find jobs, which complicates measuring the impact and returns these investments have. The most important shortcomings of the education system are: low internal efficiency rates, featuring very high repetition rates; low quality of education services, with a student/teacher ratio among the lowest in the world and a proliferation of small schools; very high unit school costs in terms of the MENA region (the current estimate cost of a classroom for basic education reached 175,000 LD equivalent to the cost of an average standing department in Tripoli); lack of coordinated education planning and management with three uncoordinated ministerial resulting in waste of resources; high recurring costs overcrowded by teachers’ salaries and ensuing lithe room for funding other inputs; lack of equitable geographical distribution of resources, with urban areas getting most of the resources, and rural areas being underserved. In a nutshell, the education system gives priority to the provision of expensive inputs, (teachers, buildings, textbooks), but there is little attention to outputs and outcomes, with little respect for standards, policies, monitoring and evaluation, and a general lack of accountability at all levels. Although there is equity in regards to access to schools, there is considerable inequity regarding learning outcomes among shaabiats observed in the exit exam at the end of secondary or on illiteracy rates. The decentralization period aggravated all these trends, and in particular the staff uncontrolled hiring. Higher education enrollments are high, however most graduates supplied do not meet labor market needs. Finally, there is an embryonic private sector participation in education, accounting for less than 2 percent in general education and reaching barely 4 percent in higher education.
I. Introduction 5.1 Libya has made impressive achievements in access to education. At the country’s independence in 1951, Libya had 14 high school graduates and about 5,000 people who could read, write, and count. Today, a third of the population (1.8 million) is enrolled in the education system, and in a relatively short time, Libya has achieved universal access for primary education, 98 percent gross enrollment for secondary education, and 46 percent for tertiary education. These are impressive achievements compared to countries in the region and to countries with the same level of development. Enrollments in higher education are high compared to middle-income countries. The only exception regarding access is to preschool education, which has only a 6 percent enrollment rate. This is due to the specificity of Jamahiriya philosophy, which confirmed that the public education in the early stages is one of the duties of the mother and the family. 5.2 Libya has also achieved impressive progress on gender equity. For the past 10 years, girls’ enrollment has increased by 12 percentage points, in all levels of education. The result is that in secondary and tertiary education, girls outnumber boys by 10 percentage points. Although there is a global tendency to have higher girls’ enrollment, it usually is by 2 to 3 percentage points, making Libya a unique case in its gender distribution of students. 5.3 Progress achieved has been supported by considerable investment and effort to build the education system. In the last few decades, the level of funding devoted to education reached up to 9.2 percent of non-oil gross domestic product (GDP) in 2001, and 9.5 percent in 2005, which is the highest GDP allocation of any Organization for Economic Co-operation and Development (OECD) country. The result is that Libya today has an important schooling and university infrastructure, a vast number of

75
teaching and non-teaching staff, and a high level of recurrent expenditures (22 percent of its national recurrent budget).
II. The Performance of the Education Sector
5.4 Enrollment. Since the revolution of 1969, education has been a guaranteed right for Libyan citizens, and the state provides it free to all Libyans. Since 1975, education has been compulsory for all children aged 6 to 15. In 2007, one-third of the population is enrolled (1.133 million in basic education, 0.355 million in secondary education, 0.150 in vocational training, and 0.250 million in higher education). The intake ratio to the first year of primary education exceeds 100 percent for both boys and girls, and the gross enrollment ratios are 114 percent for primary education (Because of the early inscription and the adoption of domestic education), 124 percent for basic education, 81 percent for secondary education, and 38 percent for higher education (not including enrollment in the private sector of higher education and students abroad). 5.5 Preschool education coverage is low in Libya, which contrasts with high enrollments in the rest of the system. In 2006, fewer than 22,300 children were enrolled in preschool and kindergarten (Figure 5.1). This corresponds to a coverage ratio of 6.1 percent for the relevant age group (aged 3 to 5). Although this enrollment rate is low, it is growing and almost doubled during 1999–2006, from 3.2 percent to 6.1 percent. Girls’ enrollment is about 48 percent.
Figure 5.1: Enrollment in Preschool
11.0
14.617.2 16.8 17.2
20.321.7 22.2
3.2%
4.3%
5.0% 4.8% 4.9%
5.7%6.0% 6.1%
0%
1%
2%
3%
4%
5%
6%
7%
0
5
10
15
20
25
30
1999 2000 2001 2002 2003 2004 2005 2006
Enrollment (1,000) Gross enrollment ratio
Source: GPC for General Education, UNESCO and our calculations.
5.6 A comparison with other Arab countries also shows that access to preschool education (and participation of the private sector) is very low in Libya. In many countries, the private sector plays an important role in the provision of these services. In Libya, the share of the private sector is the lowest in the Middle East and North Africa (MENA) region (17 percent in Libya compared to an average of 45 percent in Arab countries) (Figure 5.2).
Figure 5.2: Preprimary in Arab States, Enrollment and Place of Private Sector
AlgeriaArab States
Bahrain
Djibouti
Egypt
Jordan
Kuwait
Lebanon
Libya
Mauritania
MoroccoOman PAT
Qatar
SudanSyria
Tunisia
UAE
Yemen
0
20
40
60
80
100
0 20 40 60 80 100
Gross Enrollment Ratio, Preprimary
Percentage of private enrolment, Preprimary
Source: UNESCO most recent data 2003–07.
5.7 Education and Population distribution. The distribution of education among the population does not follow the traditional pyramidal distribution. It is almost an inverse pyramid, with a wide left top, and shrinks in the middle (Table 5.1). This is a result of (a) universal primary education; (b) a decrease in population growth, which, as a result, has lowered the number of new entrants into the school system; (c) a low drop-out rate; and (d) a very high transition rate from secondary to tertiary education, particularly for girls.
Table 5.1. Libya, Educational Pyramid (2007)
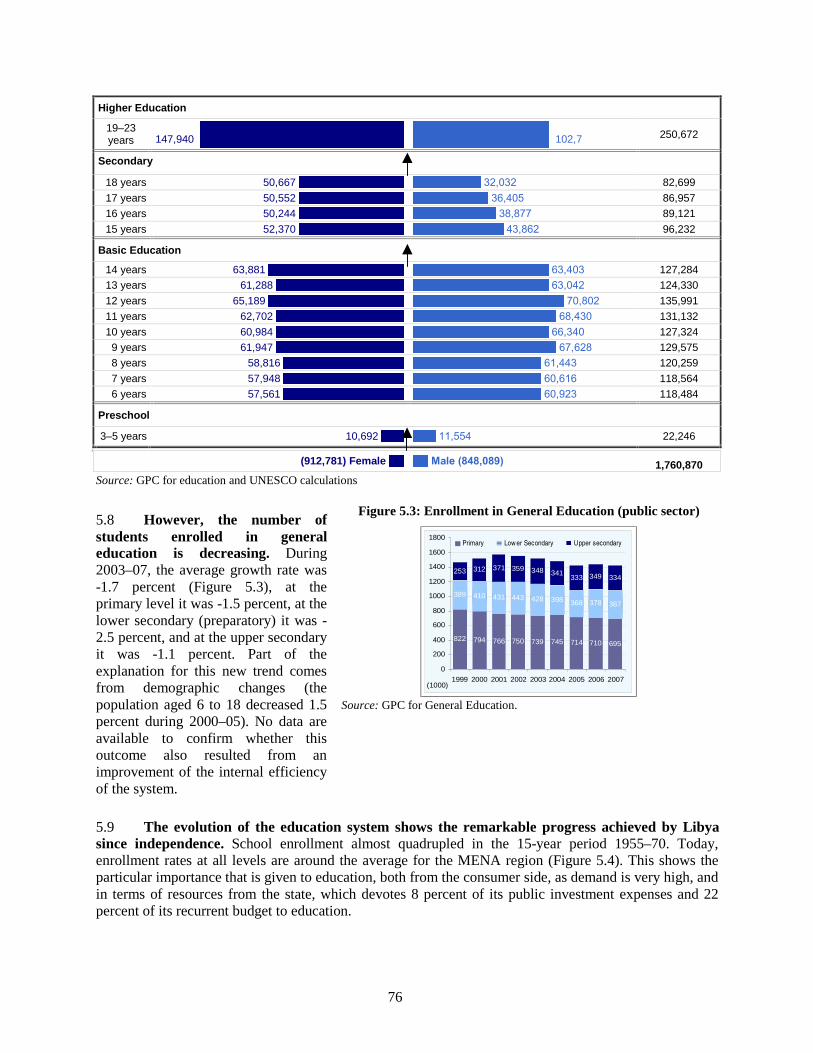
76
Higher Education
19–23 years 147,940 102,7 250,672
Secondary
18 years 50,667 32,032 82,699
17 years 50,552 36,405 86,957
16 years 50,244 38,877 89,121
15 years 52,370 43,862 96,232
Basic Education
14 years 63,881 63,403 127,284
13 years 61,288 63,042 124,330
12 years 65,189 70,802 135,991
11 years 62,702 68,430 131,132
10 years 60,984 66,340 127,324
9 years 61,947 67,628 129,575
8 years 58,816 61,443 120,259
7 years 57,948 60,616 118,564
6 years 57,561 60,923 118,484
Preschool
3–5 years 10,692 11,554 22,246
(912,781) Female Male (848,089) 1,760,870 Source: GPC for education and UNESCO calculations
5.8 However, the number of students enrolled in general education is decreasing. During 2003–07, the average growth rate was -1.7 percent (Figure 5.3), at the primary level it was -1.5 percent, at the lower secondary (preparatory) it was -2.5 percent, and at the upper secondary it was -1.1 percent. Part of the explanation for this new trend comes from demographic changes (the population aged 6 to 18 decreased 1.5 percent during 2000–05). No data are available to confirm whether this outcome also resulted from an improvement of the internal efficiency of the system.
Figure 5.3: Enrollment in General Education (public sector)
822 794 766 750 739 745 714 710 695
389 410 431 443 428 398 368 378 387
253 312 371 359 348 341333 349 334
0
200
400
600
800
1000
1200
1400
1600
1800
1999 2000 2001 2002 2003 2004 2005 2006 2007
Primary Low er Secondary Upper secondary
(1000)
Source: GPC for General Education.
5.9 The evolution of the education system shows the remarkable progress achieved by Libya since independence. School enrollment almost quadrupled in the 15-year period 1955–70. Today, enrollment rates at all levels are around the average for the MENA region (Figure 5.4). This shows the particular importance that is given to education, both from the consumer side, as demand is very high, and in terms of resources from the state, which devotes 8 percent of its public investment expenses and 22 percent of its recurrent budget to education.

77
5.10 There are marked differences in enrollment rates by gender. Improved access has particularly benefited girls, whose enrollment rates exceed those of boys from age 12. The comparison of schooling between 1995 and 2005 shows a marked improvement for different age categories. For all of the school-age population (aged 6 to 23), the rate for girls has increased by 12 percentage points, while that of boys has grown by only 2 points. Although the global tendency is for higher girls’ enrollment in both secondary and tertiary education than for boys, the difference observed is 2-4 percentage points. In the case of Libya, however, it is as much as 10 percentage points for tertiary education (Figure 5.5). This phenomenon occurs in several countries in the MENA region.
Figure 5.4: Gross Enrollment Rate, by Age Group and Gender (2005–06)
118%116%
53%
95%
39%
67%
117%
46%
81%
0%
20%
40%
60%
80%
100%
120%
06 - 14 years 15 - 18 years 19 - 23 years
Female
Male
Total
GER %
Source: GPC for General Education and our calculations
Figure 5.5. Gross Enrollment Rate, by Age Group and Gender
Source: GPC for General Education, United Nations, Population Division, General Authority for Information, General Population Census 1995, and our calculation.
Figure 5.6. Gross Enrollment Rate in Primary Education, Libya and MENA
20%
37%
59%
113%
78%
111%
118%125%
109%105%
113%
137%
87%
82%70%
0%
20%
40%
60%
80%
100%
120%
140%
1950 1955 1960 1965 1970 1975 1980 1985 1990 1995 2000 2003
Liby a MENA
Source: World Bank 2007.

78
5.11 The education Millennium Development Goals have been achieved in Libya. Universal access to education and the completion of the first five years of studies appears to be high (Figure 5.6). Although there are no repetition and drop-out data available to accurately calculate primary completion rates, a proxy estimate can be made based on the 2003 Household Survey. On this basis, the primary completion rate is 97 percent. There is gender equity in primary and secondary education, and enrollment rates in secondary (lower and upper) have significantly increased—from 21 percent in 1970 (lower than that of the MENA region) to over 100 percent reached in the early 2000s—far exceeding the MENA average, which was 69 percent in 2002 (Figure 5.7).
Figure 5.7: Gross Enrollment Rate in Secondary Education, Libya and MENA
21%
76%
86%
104%
23%
42%
57%
69%
0%
10%
20%
30%
40%
50%
60%
70%
80%
90%
100%
110%
1970 1980 1990 2002
Libya Average MENA
Source: World Bank 2007.
5.12 Higher-education enrollment has grown at an accelerated pace in recent decades, but is reversing. The number of enrolled students rose from 13,417 students in one university in 1970 to 250,000 students in 12 universities in 2007, reaching a ratio of 4,600 students for 100,000 inhabitants (among the highest in the region). However, recent trends show a decline in enrollment from 257,000 in 2005 to 250,000 in 2007, representing an annual decline of 1.3 percent. The students are currently spread over 12 universities with the largest ones being Al-Fateh (Tripoli) and Garyonis (Benghazi), which enroll 46 percent of all higher education students. There are 33 higher institutes spread over different shaabiats,28 of which specialize in the field of health. Tables Table A.5.22 and A.5.23 in the statistical appendix show the distribution of students and teachers, including university and higher institutes, for the academic year 2006–07. 5.13 The gross enrollment ratio (GER) in tertiary education in Libya, which was around 56 percent in 2003, is also high. This level is comparable to the average for OECD countries and countries like France, Ireland, Japan, Portugal, and the Netherlands. Figure 5.8 shows the remarkable progress made by Libya during the decade of the 1990s in expanding access to higher education. Indeed, in the early 1990s, the GER was comparable to that of the MENA average, or 13.8 percent. In the space of 15 years, the rate rose by over 40 percentage points (or, almost fourfold), while the average for the region has less than doubled.
Figure 5.8: GER, Tertiary Level, Libya and MENA
Algeria
BahrainEgy pt
Iraq
Jordan
Kuwait
Lebanon
Liby a
Morocco
Oman
Qatar
Saudi ArabiaTunisia
UAEMENA
0
10
20
30
40
50
60
0 10 20 30 40
Gross Enrollment Rate, Tertiary (2003-2006)
Gross Enrollment Rate, Tertiary (1990-1991)
Source: According World Bank and UNESCO data.

79
5.14 The student-teacher ratio per university varies considerably. Higher education employs 15,870 teachers, 10,980 under open-ended contracts and 4,890 of which are temporary. About three-quarters of permanent professors are Libyans (Table A.5.24 in Statistical Appendix). This represents an average ratio of 15.8 students per teacher, but this ratio varies considerably among universities (for example, 2.2 for Naser and 28 for Asmarya).
5.15 A unique feature of Libyan tertiary education is the disproportionate enrollments in health- related fields (one out of four university students enrolled) (Figure 5.9). The distribution of specialty fields in higher education shows a predominance of arts and sciences, which enrolls a third of all students.
5.16 Vocational training has experienced a significant increase in enrollment in recent years, which was not accompanied by commensurate investment in infrastructure and training in human resources (Table 5.2). This has resulted in a quantitative and qualitative deficit. The sector includes a middle cycle consisting of 384 training centers for 73,000 students supervised by 9,134 trainers, and an advanced cycle with 85 centers for 41,660 students supervised by 2,872 trainers. There are nine training specialties.
Table 5.2. Vocational Training Data (2006)
Middle Cycle
Advanced Cycle
Total
Training Center 384 85 469
Students 72,923 41,660 114,583
Trainers 9,134 2,872 12,006
Classroom 1,464 1,512 2,976
Workshops and Labs 3,330 1,472 4,802
Student-trainer Ratio 8.0 14.5 9.5
Source: GPC for Manpower.
5.17 Illiteracy has fallen sharply in Libya, for both men and women. According to the United Nations Educational, Scientific and Cultural Organization (UNESCO), the literacy rate increased by 10 percentage points during the last decade, from 74.7 percent in 1994 to 84.2 percent in 2004 (Table 5.3). It is now among the highest in the region and among the countries of the same level of development (Figure 5.10). This has benefited especially women, whose literacy rate increased by nearly 23 percent during 1994–2004 compared to 6.8 percent for men. In 2004, only 2 percent of disabled young people aged 15 to 24 were illiterate.
Figure 5.9: Student Distribution, by Field (2006–07)
Source: Calculations based on data from GPC for Higher Education
Table 5.3. Literacy Rate in Libya: Evolution from 1994 to 2004
Adult Age 15 and 15+ Young Age 15–24
1994 2004 1994 2004
Female 61.0 74.8 90.8 96.5
Male 86.9 92.8 98.9 99.5
Total 74.7 84.2 94.9 98.0
Source: UNESCO data, 2007.

80
Figure 5.10. Literacy Rate, International Comparison (2004)
Source: UNESCO data, 2007.
III. The Institutional Framework and its Accountability
5.18 The Libyan education system comprises five levels:
• Preschool Level (optional): Duration three years, for children aged 3 to 5. • Basic Education: Divided into three parts: the first and second cycles, which comprise,
respectively, four and two years, and correspond to primary education for children aged 6 to 11; and the third cycle (lower secondary or “preparatory”), which comprises three years and enrolls children aged 12 to 14. Those who successfully complete nine years of basic education are awarded a Basic Education Certificate.
• Intermediate Education (upper secondary) and Training: Comprises three to four years, and includes General Secondary Education (until 2005) and specialized secondary schools and technical and vocational centers and institutes, and enrolls individuals aged 15 to 18. Students who successfully complete secondary education are awarded a Secondary Education Certificate (SEC). SEC students are eligible to continue with university studies. This level also qualify for admission to higher institutions of training or the job market for students of training centers who give the medium vocational diploma.
• University Education: includes universities, higher institutes (higher-education institutions not under the supervision of universities), and higher technical and vocational centers; it lasts for three years for some centers and institutes and for six years for some university programs.
• Advanced Studies: includes M.A. (Masters) degree, and Ph.D. (Doctorate) degree, and an advanced studies diploma in various specialization fields.
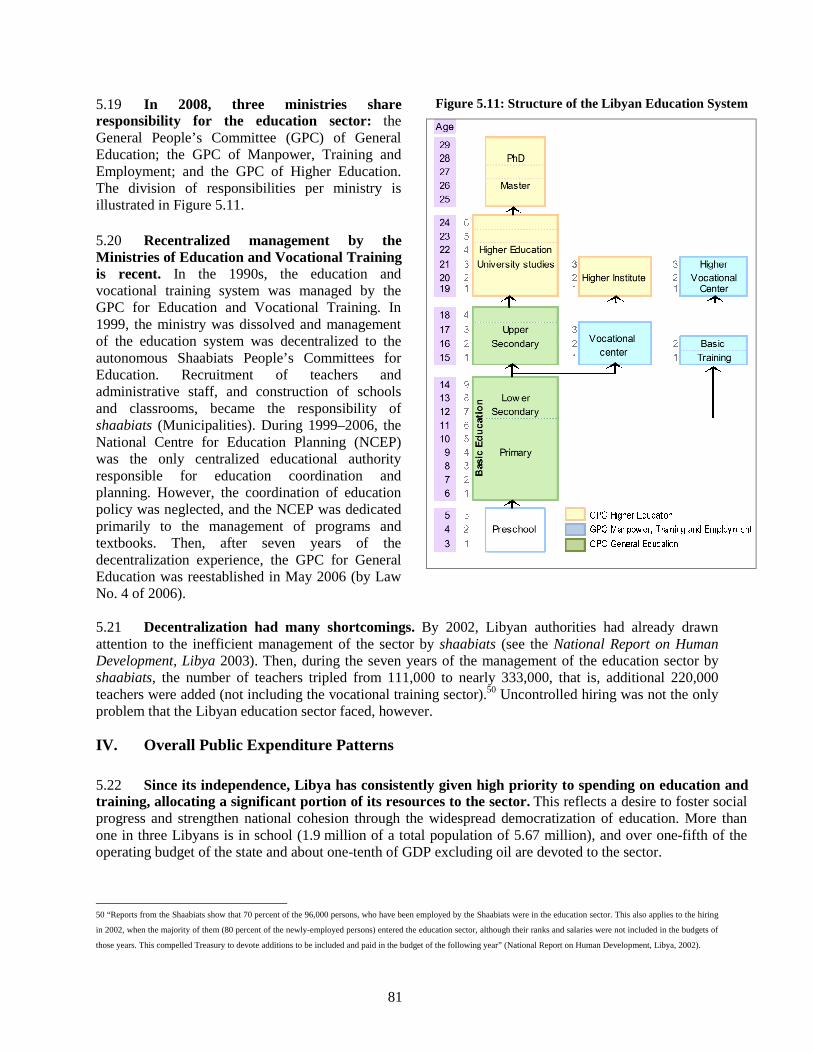
81
5.19 In 2008, three ministries share responsibility for the education sector: the General People’s Committee (GPC) of General Education; the GPC of Manpower, Training and Employment; and the GPC of Higher Education. The division of responsibilities per ministry is illustrated in Figure 5.11.
5.20 Recentralized management by the Ministries of Education and Vocational Training is recent. In the 1990s, the education and vocational training system was managed by the GPC for Education and Vocational Training. In 1999, the ministry was dissolved and management of the education system was decentralized to the autonomous Shaabiats People’s Committees for Education. Recruitment of teachers and administrative staff, and construction of schools and classrooms, became the responsibility of shaabiats (Municipalities). During 1999–2006, the National Centre for Education Planning (NCEP) was the only centralized educational authority responsible for education coordination and planning. However, the coordination of education policy was neglected, and the NCEP was dedicated primarily to the management of programs and textbooks. Then, after seven years of the decentralization experience, the GPC for General Education was reestablished in May 2006 (by Law No. 4 of 2006).
Figure 5.11: Structure of the Libyan Education System
5.21 Decentralization had many shortcomings. By 2002, Libyan authorities had already drawn attention to the inefficient management of the sector by shaabiats (see the National Report on Human Development, Libya 2003). Then, during the seven years of the management of the education sector by shaabiats, the number of teachers tripled from 111,000 to nearly 333,000, that is, additional 220,000 teachers were added (not including the vocational training sector).50 Uncontrolled hiring was not the only problem that the Libyan education sector faced, however.
IV. Overall Public Expenditure Patterns 5.22 Since its independence, Libya has consistently given high priority to spending on education and training, allocating a significant portion of its resources to the sector. This reflects a desire to foster social progress and strengthen national cohesion through the widespread democratization of education. More than one in three Libyans is in school (1.9 million of a total population of 5.67 million), and over one-fifth of the operating budget of the state and about one-tenth of GDP excluding oil are devoted to the sector.
50 “Reports from the Shaabiats show that 70 percent of the 96,000 persons, who have been employed by the Shaabiats were in the education sector. This also applies to the hiring
in 2002, when the majority of them (80 percent of the newly-employed persons) entered the education sector, although their ranks and salaries were not included in the budgets of
those years. This compelled Treasury to devote additions to be included and paid in the budget of the following year” (National Report on Human Development, Libya, 2002).

82
5.23 Public expenditure on education has steadily increased in the 2000s. It went from LD 1.035 billion in 2001 to LD 1.86 billion in 2005. This represents an annual growth of 9.3 percent. During this period, the share of education spending declined as a proportion of overall GDP from 5.5 percent to 2.5 percent, but this fall is due to the exceptional development of the oil sector, which grew at an annual rate of 56 percent. Compared to non-oil GDP, the share of education has been maintained or even improved, from 9.2 percent to 9.5 percent during 2001–05. This is higher than the highest percentage for OECD countries, which is 8.4 percent for Denmark (Figure 5.12).
Figure 5.12: Education Share of GDP
5,5%
3,8%3,5% 3,1%
2,5%
9,2%8,6%
9,2%9,8% 9,5%
0%
1%
2%
3%
4%
5%
6%
7%
8%
9%
10%
11%
2001 2002 2003 2004 2005 2006 2007
Share on GDP Share on Non-Oil GDP
Source: GPC for Planning; and IMF staff estimates.
5.24 It is impossible to reconstruct the historical evolution of public expenditure on education, because of the transfer of responsibilities to the shaabiats sector during 1999–2006. Data collected are partial and do not cover all categories of expenditures. Available data are presented below. They include data from the GPC for Finance and from the International Monetary Fund (IMF) on overall spending, and the GPC plan for capital expenditure. Data for 2007 represent the only budget since 1999 under a centralized management of education. 5.25 Spending on education during 2001–03 represents a low average of 4.5 percent of total public expenditure, or 9.5 percent of government expenditure, but it excludes allocations to the shaabiats.
5.26 There are three periods in the evolution of public investment in education. Figures 5.13 and 5.14 illustrate these developments:
• The first periodstarts after the revolution and spans a decade: it is the phase of massive construction of school infrastructure, which enabled a remarkable expansion of access to basic and secondary education. During this period, investment grew at an average annual rate of 35 percent.
• The second periodcovers 1982–99, during which investment in the education sector saw a stabilization or even a decline compared to the record levels attained in the early 1980s. During this period, investment fell at an average annual rate of 2.5 percent and planned investments were not fully realized. The execution rates fell sharply, reaching an average execution ratio of 59 percent.
• The third period starts from the late 1990s. Investments in the education sector saw a strong recovery due to the construction undertaken by the shaabiats in general and higher education. During 1999–2007, investments grew at an average annual rate of 27.4 percent.
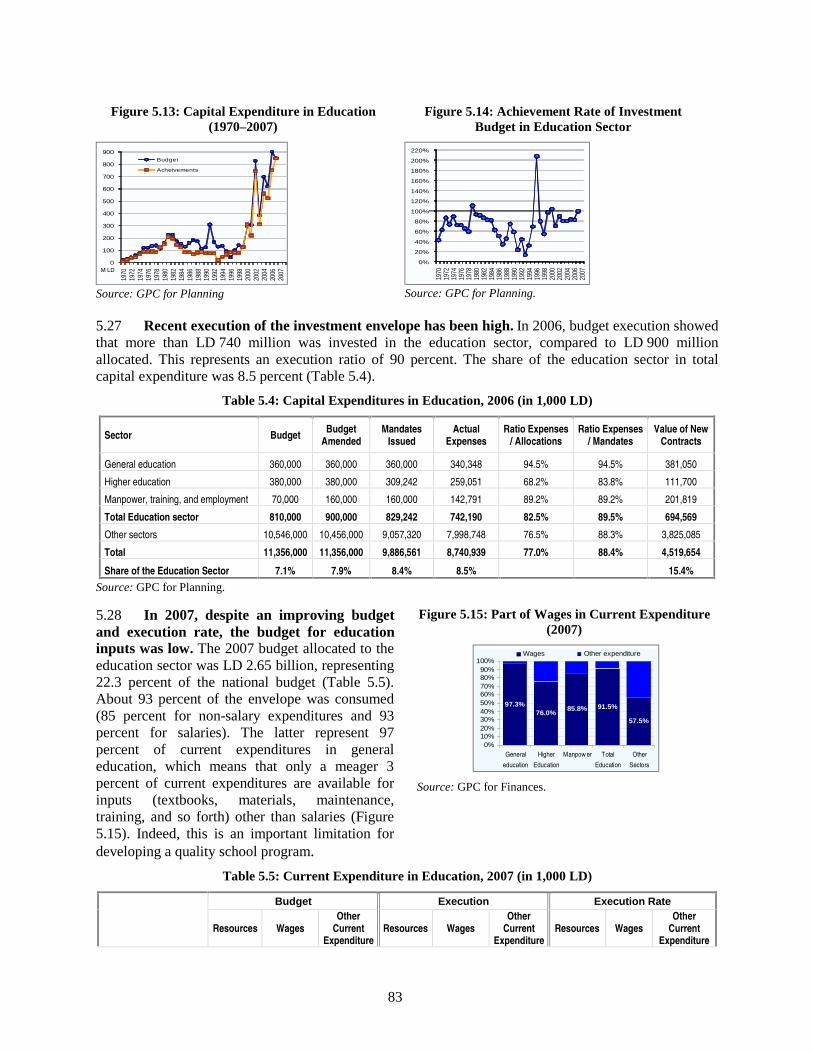
83
Figure 5.13: Capital Expenditure in Education (1970–2007)
0
100
200
300
400
500
600
700
800
900
1970
1972
1974
1976
1978
1980
1982
1984
1986
1988
1990
1992
1994
1996
1998
2000
2002
2004
2006
2007
Budget
Acheivements
M LD
Source: GPC for Planning
Figure 5.14: Achievement Rate of Investment Budget in Education Sector
0%
20%
40%
60%
80%
100%
120%
140%
160%
180%
200%
220%
1970
1972
1974
1976
1978
1980
1982
1984
1986
1988
1990
1992
1994
1996
1998
2000
2002
2004
2006
2007
Source: GPC for Planning.
5.27 Recent execution of the investment envelope has been high. In 2006, budget execution showed that more than LD 740 million was invested in the education sector, compared to LD 900 million allocated. This represents an execution ratio of 90 percent. The share of the education sector in total capital expenditure was 8.5 percent (Table 5.4).
Table 5.4: Capital Expenditures in Education, 2006 (in 1,000 LD)
Sector Budget Budget Amended
Mandates Issued
Actual Expenses
Ratio Expenses / Allocations
Ratio Expenses / Mandates
Value of New Contracts
General education 360,000 360,000 360,000 340,348 94.5% 94.5% 381,050
Higher education 380,000 380,000 309,242 259,051 68.2% 83.8% 111,700
Manpower, training, and employment 70,000 160,000 160,000 142,791 89.2% 89.2% 201,819
Total Education sector 810,000 900,000 829,242 742,190 82.5% 89.5% 694,569
Other sectors 10,546,000 10,456,000 9,057,320 7,998,748 76.5% 88.3% 3,825,085
Total 11,356,000 11,356,000 9,886,561 8,740,939 77.0% 88.4% 4,519,654
Share of the Education Sector 7.1% 7.9% 8.4% 8.5% 15.4%
Source: GPC for Planning.
5.28 In 2007, despite an improving budget and execution rate, the budget for education inputs was low. The 2007 budget allocated to the education sector was LD 2.65 billion, representing 22.3 percent of the national budget (Table 5.5). About 93 percent of the envelope was consumed (85 percent for non-salary expenditures and 93 percent for salaries). The latter represent 97 percent of current expenditures in general education, which means that only a meager 3 percent of current expenditures are available for inputs (textbooks, materials, maintenance, training, and so forth) other than salaries (Figure 5.15). Indeed, this is an important limitation for developing a quality school program.
Figure 5.15: Part of Wages in Current Expenditure (2007)
97.3%76.0%
85.8% 91.5%
57.5%
0%10%20%30%40%50%60%70%80%90%
100%
General
education
Higher
Education
Manpow er Total
Education
Other
Sectors
Wages Other expenditure
Source: GPC for Finances.
Table 5.5: Current Expenditure in Education, 2007 (in 1,000 LD)
Budget Execution Execution Rate
Resources Wages Other
Current Expenditure
Resources Wages Other
Current Expenditure
Resources Wages Other
Current Expenditure
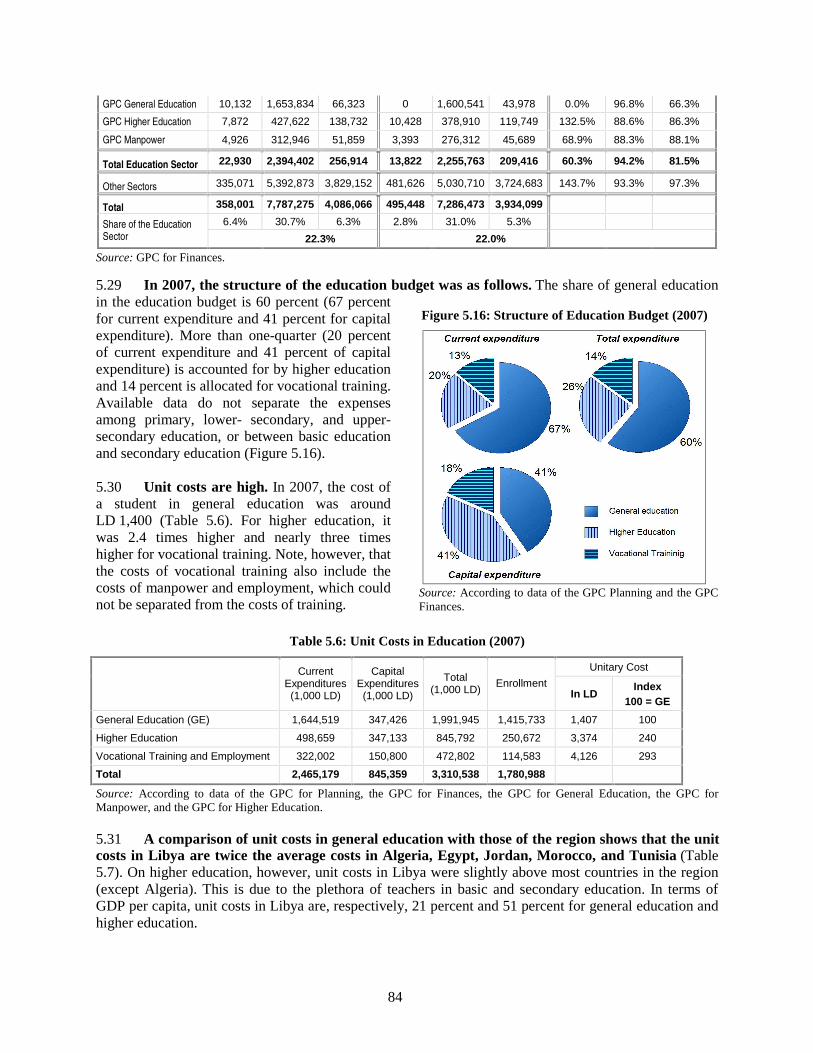
84
GPC General Education 10,132 1,653,834 66,323 0 1,600,541 43,978 0.0% 96.8% 66.3%
GPC Higher Education 7,872 427,622 138,732 10,428 378,910 119,749 132.5% 88.6% 86.3%
GPC Manpower 4,926 312,946 51,859 3,393 276,312 45,689 68.9% 88.3% 88.1%
Total Education Sector 22,930 2,394,402 256,914 13,822 2,255,763 209,416 60.3% 94.2% 81.5%
Other Sectors 335,071 5,392,873 3,829,152 481,626 5,030,710 3,724,683 143.7% 93.3% 97.3%
Total 358,001 7,787,275 4,086,066 495,448 7,286,473 3,934,099
6.4% 30.7% 6.3% 2.8% 31.0% 5.3% Share of the Education Sector 22.3% 22.0%
Source: GPC for Finances.
5.29 In 2007, the structure of the education budget was as follows. The share of general education in the education budget is 60 percent (67 percent for current expenditure and 41 percent for capital expenditure). More than one-quarter (20 percent of current expenditure and 41 percent of capital expenditure) is accounted for by higher education and 14 percent is allocated for vocational training. Available data do not separate the expenses among primary, lower- secondary, and upper-secondary education, or between basic education and secondary education (Figure 5.16).
5.30 Unit costs are high. In 2007, the cost of a student in general education was around LD 1,400 (Table 5.6). For higher education, it was 2.4 times higher and nearly three times higher for vocational training. Note, however, that the costs of vocational training also include the costs of manpower and employment, which could not be separated from the costs of training.
Table 5.6: Unit Costs in Education (2007)
Unitary Cost Current Expenditures (1,000 LD)
Capital Expenditures (1,000 LD)
Total (1,000 LD)
Enrollment In LD
Index 100 = GE
General Education (GE) 1,644,519 347,426 1,991,945 1,415,733 1,407 100
Higher Education 498,659 347,133 845,792 250,672 3,374 240
Vocational Training and Employment 322,002 150,800 472,802 114,583 4,126 293
Total 2,465,179 845,359 3,310,538 1,780,988
Source: According to data of the GPC for Planning, the GPC for Finances, the GPC for General Education, the GPC for Manpower, and the GPC for Higher Education.
5.31 A comparison of unit costs in general education with those of the region shows that the unit costs in Libya are twice the average costs in Algeria, Egypt, Jordan, Morocco, and Tunisia (Table 5.7). On higher education, however, unit costs in Libya were slightly above most countries in the region (except Algeria). This is due to the plethora of teachers in basic and secondary education. In terms of GDP per capita, unit costs in Libya are, respectively, 21 percent and 51 percent for general education and higher education.
Figure 5.16: Structure of Education Budget (2007)
Source: According to data of the GPC Planning and the GPC Finances.

85
Table 5.7: Unit Costs per Student in Education, International Comparison
In US $ PPP In % GDP/Capita PPP General Education Higher Education General Education Higher Education
Algeria 1,150 5,805 20.0% 100.8% Egypt 709 3,419 18.6% 89.7% Jordan 819 2,262 20.3% 56.2% Libya 2,196 5,267 21.3% 51.0% Morocco 1,148 4,321 30.1% 113.4% Tunisia 1,427 4,803 21.1% 71.1% OECD 6,238 10,526 22.5% 40.0%
Source: Algeria, Egypt, Jordan, Morocco, and Tunisia: World Bank (2002–2004); Libya: GPCs for Finance, General Education, and Higher Education, (2007); OECD: Education at a Glance 2007 and our calculations. 5.32 Regarding the costs of higher education, two issues deserve attention:
• The cost of higher education studies abroad is very high. It accounts for more than 47 percent of the capital budget for higher education (Figure 5.17), representing about US$54,000 per student per year. This exceeds 10 times the local unit cost.
• There is a wide disparity in unit costs among universities. As shown in Figure 5.18, the average cost of a student is LD 1,540. However, the difference in unit cost among universities is quite large, ranging from LD 1,200 at the University of April 7 to nearly LD 6,400 at the University of Naser. Admittedly, the costs of the various fields are different, but these differences call into question the criteria for budget allocations and their equity and efficiency.
Figure 5.17: Structure of Capital Expenditure in Higher Education (2006)
Source: GPC for Planning, Report follow up the implementation of the investment budget, 2006.
Figure 5.18: Current Expenditure, Units Cost per Student
1 978
1 385
2 716
2 807
2 035
1 207
1 261
6 386
1 360
1 544
1 911
220
0 1 000 2 000 3 000 4 000 5 000 6 000 7 000
Omar Mokhtar
Garyounes
Ettahaddi
Sabha
El Djebel Gharbi
7 April
El Fatah
Naceur
7 October
El Markeb
El Asmaria
El MaftouhaAverage: 1541
Source: According to GPC for Higher Education data.
5.33 Private expenditures in education are not known with precision. The Economic and Social Household Survey (2002–2003) shows that the average Libyan household devotes an average of 2 percent of its income to education. This does not change between urban and rural areas, but varies among regions (1.3 percent in the rural area Zawia; 3.3 percent in the rural areas of El Al Bayen Awel) (Tables A5.25 and A5.26 in the Statistical Appendix). 5.34 The participation of the private sector in education is still embryonic. Its weight, in terms of enrollment, does not exceed 2 percent in general education and
Figure 5.19: Part of the Private Sector, by Level of Education and Place of Residence

86
reaches nearly 4 percent in higher education (Figure 5.19). Data from 2003 show that the private sector is more prevalent in urban than in rural areas.51 In addition, about 10,000 children have home education, and the goal is to reach 150,000 in 2015. If this method of teaching seems like an attractive formula for resolving the issue of education in areas with low population density, careful analysis of the social impact of such teaching should be made. Schools are key institutions to develop social skills, and apart for learning science and math, children learn to live in and to be part of a social group and a community.
Source: The Economic and Social Survey, 2002–2003, GAI.
5.35 Private returns to education. Education helps improve the standard of living of Libyan households: The 2002–2003 Economic and Social Household Survey shows that family size is shrinking with the improvement of education. In addition, spending per person has increased with improved levels of instruction. Figures 5.20 and 5.21 show that the size of families went from more than 7 for households in which the head of household had a primary-level education to less than 6 for households in which the head of household had a university-level education. Expenditure per household rises above 35 percent, from LD 1,111 to DL 1,513, for this same group.
Figure 5.20: Household Size, by the Level of Education Status of the Head of Household
Source: The Economic and Social Survey, 2002–2003, GAI. Unit is persons
Figure 5.21: Expenditure per Person per Year, by the Education Status of the Head of Household
Source: The Economic and Social Survey, 2002–2003, GAI. Unit is Libyan Dinars
51 Since 1985, the concept of home education has emerged in Libya. It aims to accommodate parents who want and who have the skills to provide basic education to their children
at home. The state encourages these initiatives and provides a bonus to parents who opt for this mode of instruction.
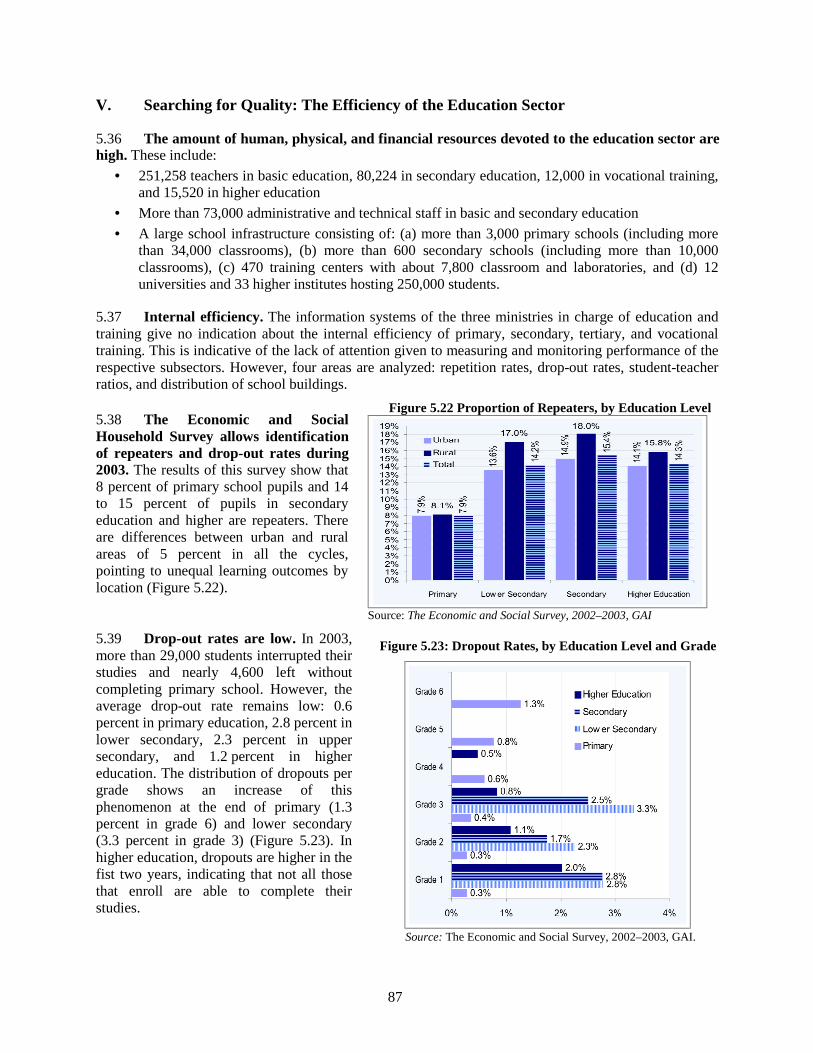
87
V. Searching for Quality: The Efficiency of the Education Sector
5.36 The amount of human, physical, and financial resources devoted to the education sector are high. These include:
• 251,258 teachers in basic education, 80,224 in secondary education, 12,000 in vocational training, and 15,520 in higher education
• More than 73,000 administrative and technical staff in basic and secondary education
• A large school infrastructure consisting of: (a) more than 3,000 primary schools (including more than 34,000 classrooms), (b) more than 600 secondary schools (including more than 10,000 classrooms), (c) 470 training centers with about 7,800 classroom and laboratories, and (d) 12 universities and 33 higher institutes hosting 250,000 students.
5.37 Internal efficiency. The information systems of the three ministries in charge of education and training give no indication about the internal efficiency of primary, secondary, tertiary, and vocational training. This is indicative of the lack of attention given to measuring and monitoring performance of the respective subsectors. However, four areas are analyzed: repetition rates, drop-out rates, student-teacher ratios, and distribution of school buildings. 5.38 The Economic and Social Household Survey allows identification of repeaters and drop-out rates during 2003. The results of this survey show that 8 percent of primary school pupils and 14 to 15 percent of pupils in secondary education and higher are repeaters. There are differences between urban and rural areas of 5 percent in all the cycles, pointing to unequal learning outcomes by location (Figure 5.22).
5.39 Drop-out rates are low. In 2003, more than 29,000 students interrupted their studies and nearly 4,600 left without completing primary school. However, the average drop-out rate remains low: 0.6 percent in primary education, 2.8 percent in lower secondary, 2.3 percent in upper secondary, and 1.2 percent in higher education. The distribution of dropouts per grade shows an increase of this phenomenon at the end of primary (1.3 percent in grade 6) and lower secondary (3.3 percent in grade 3) (Figure 5.23). In higher education, dropouts are higher in the fist two years, indicating that not all those that enroll are able to complete their studies.
Figure 5.23: Dropout Rates, by Education Level and Grade
Source: The Economic and Social Survey, 2002–2003, GAI.
Figure 5.22 Proportion of Repeaters, by Education Level
Source: The Economic and Social Survey, 2002–2003, GAI

88
5.40 Dropout by grade and region varies significantly. Overall, there is a low drop-out rate in primary education—less than 2 percent (green surface) except for Golf of Syrt for the final year of primary education—and a concentration and a worsening of this phenomenon in the region of Al Albayen Awel at the beginning of college (rate exceeding 6 percent), and especially the first year of secondary school (higher than 10 percent: red and brown surface) (Figure 5.24).
Figure 5.24: Dropout Rate, by Grade Level, and Region
Source: Staff calculations based on The Economic and Social Survey, 2002–2003, GAI.
5.41 The reasons for dropout are diverse. For example, there is a certain discomfort among students who leave school at the lower secondary level; nearly 80 percent of them lose the desire to study (Figure 5.25). This shows the difficulties of adjustment and transition between each stage of secondary education. Also revealing is that economic reasons for abandoning school (need to work) increase with age.
Figure 5.25: Reasons for Dropout, by Education Level
Source: The Economic and Social Survey, 2002–2003, GAI.
5.42 Quality of Education. Assessing the quality of education can only be partial in the absence of standardized assessments of student achievement. An examination at the end of secondary gives only a proxy in this regard. Figure 5.26 illustrates the distribution of the results of the two examination session for the two secondary regimes (3-year and 4-year regimes). It shows that the success rate of the first session is low, at 40 percent, in contrast to the success rate of the second and final session, which is high (80 percent), and which is attained by a systematic catching up during the second session (retakes). This improves the exam results by around 50 percent. During the field interviews, several officials showed

89
concern about the lower impartiality and rigor of the second examinations, which minimizes the role of examinations and their validity as a tool for assessing student achievement.
Figure 5.26: Success Rate in the examination at the end of secondary (2006–07)
Three-year System
0%
10%
20%
30%
40%
50%
60%
70%
80%
90%
100%
1 2 3 4 5 6 7 8 9 101112131415161718192021222324
First SessionSecond Session
Four-year System
0%
10%
20%
30%
40%
50%
60%
70%
80%
90%
100%
1 2 3 4 5 6 7 8 9 101112131415161718192021222324
First SessionSecond Session
1 El Batnan, 2 El Djebel El Akhdar, 3 El Djebel El Gharbi, 4 El Jafara, 5 El Zaouia, 6 El Kofra, 7 El Marj, 8 El Markeb, 9 El Nikat Elkoms, 10 El Wahat, 11 Benghazi, 12 El Jofra, 13 Darna, 14 Sebha, 15 Syrt, 16 Tripoli, 17 Ghat, 18 Marzek, 19 Misrata, 20 Nalout, 21 Wadi El Hayet, 22 Wadi El Chati, 23 Outside Libya, 24 Jamahiriya. Source: GPC for General Education.
5.43 The analysis of the distribution of the results by shaabiats shows a very wide dispersion. In the success rate at the first session, the standard deviation of the distribution (20.5 percent) exceeds the national average (40.6 percent). The less efficient shaabiats are El Jebel Akhdar, Ghat, Wadi El Hayet, El Wahat El Kofra, and Benghazi. On the other hand, the success rates in Shabiat El Marj exceed 97 percent (Figure 5.27). 5.44 No indicators are available on the performance of higher education, because the information system of the Ministry is poorly developed and basic data, like the number of graduates and their distribution, are neither collected nor analyzed. However, a proxy indicator of internal performance is possible. Taking the distribution of graduates by field of study from the University of Benghazi, the ratio of graduated to enrolled indicates a good performance—the ratio approaches 20 percent (Table 5.8). Data report severe underperformances in the fields of economy, engineering, sciences, law, and agriculture, for a total of five out of seven disciplines.
Figure 5.27. Success Rate in the examination at the end of secondary, by Shaabiats (2006–07)
El Batnan
El Jofra
El Zaouia
El Kofra
El MarjEl Markeb
El Nikat Elkoms
El Wahat
Benghazi
El Jafara
Darna
Sebha
Sy rtTripoli
Ghat
Marzek
MisrataNalout
Ouadi El Hay et
Ouadi El Chati
Libya
30%
40%
50%
60%
70%
80%
90%
100%
30% 40% 50% 60% 70% 80% 90% 100%
Success Rate (3 years system)
Success Rate (4 years system) El Djebel El Akhdar
El Djebel El Gharbi
Source: According data of GPC for General Education.

90
Table 5.8: Benghazi University, Enrollment and Graduates, 2006
Arts Economy Law Science Engineering
Teacher Training Agriculture
Enrollment 4,695 8,602 2,337 4,002 3,960 1,649 795
Graduates 1,141 318 260 259 156 301 128
Graduates/Enrollment 24.3% 3.7% 11.1% 6.5% 3.9% 18.3% 16.1%
Source: University of Benghazi.
5.45 No information is available on the external effectiveness of education and training. The unemployment rate is not published by level of education, and follow-up surveys on employability of graduates are not conducted. In addition, data from the labor market are skewed by the effect of recruiting policies that do not follow economic needs but are motivated by social considerations. 5.46 Recruitment has largely exceeded the needs of the sector. Whereas in 1995, the number of teachers was 178,520, or 15.9 percent of the labor force, in 2007, there were over 552,000, more than one-third of the 2007 estimated labor force, that is, an increase of nearly 18 percentage points. Currently, there are more than 360,000 teachers in the public education system (taking into account the vocational training sector), and 70 percent teach in basic education (Figure 5.28). In addition to this plethora, a new corps of teachers has emerged called “reservists,” which represent about one-third of general education teachers (107,000 receive their salaries and allocations without working. 5.47 There are marked challenges of inefficiency and inequity in the management of human resources in education. In general education, with an administrative staff of 107,000 and three times more teachers, the student-teacher ratio has been reduced to 4.6, the lowest in the world. The number of students per administrative and technical staff is 13.1, which is also an extremely low ratio. The number of administrative staff could be divided by at least three without any negative impact on the proper management of general education. The latest data submitted in December 2008 show that the efforts of the GPC’s confirmation in office have reduced the number of staff to less than 295 000 of which 172 346 teachers in schools, 65364 administrative and technicians and over 57 000 educationally empowered (reservists).
Figure 5.28: Teachers, by Level and Status (2006–07)
170
81
55
26
9 311
50
20406080
100120140160180
Incl
ass
Res
ervi
st
Incl
ass
Res
ervi
st
Mid
dle
Adva
nced
Form
al
Coo
pera
tors
Basic Education Secondary Voca. Training Higher Education
(100
0)
Source: GPC for General Education, Higher Education and Manpower.

91
5.48 The allocation of teachers and administrative staff per student is severely inappropriate. Figure 5.29 shows the breakdown by “office” (130 “offices” are administrative subdivisions of general education in shaabiats) of the ratios in (a) the number of students per administrative staff, and (b) the number of students per teacher in general education. A wide dispersion follows (the standard deviations are 9 and 4 for 70 percent and 80 percent averages, respectively) regardless of the size of offices in terms of numbers of students. This depicts an irrational allocation of human resources among school districts.
Figure 5.29: Pupil-teacher Ratio and Pupil-administrative Staff Ratio, by Education Office (subdivision of Shaabiats)
-10
0
10
20
30
40
50
0 5 10 15 20
Office (130 offices)
Pupils/teacher ratio
Pupils/administrative-technical Staff Ratio
The size indicates the importance in terms of number of pupils
National Average
Source: According to data of GPC for General Education.
5.49 Another example shows the inefficiency and inequity in the distribution of resources. It concerns the distribution of the student-teacher ratio for primary and secondary (Figure 5.30). The correlation of these two variables shows that the same regions are underserved in terms of allocation of human resources at the primary and secondary level. The wide dispersion in the distribution provides a second look at the lack of criteria for teacher deployment.˜We also note the relatively high pupil-teacher ratio in some shaabiats (such as Ghat et Kofra) because of the lack of demand for teachers.
Figure 5.30: Pupil-teacher Ratio in Primary and Secondary
Education, by Shaabiats
Zawia
Al Jofra
TripoliAl Mergib
MisurataSirtAl Wahat
Benghazi
Al Marj
Al Jabel AkhdarDerna
Al Batnan
Al Kofra
Al Jfara
Mazag
Sabha
Wadi Hayet
Ghat
Wadi Shati
Al Jebel GarbiNalut
R2 = 0.89
0
1
2
3
4
5
6
7
8
9
10
0 2 4 6 8 10 12 14
Libya
Pupil-teacher ratio, Basic Education
Pupil-teacher ratio, Secondary
Al Nekat ElKhoms
Source: GPC for General Education and authors’ calculation.

92
5.50 Paradoxically, in contrast to several countries that feature higher student-teacher ratios in rural and sparsely populated areas, in Libya, the ratios of students per teacher in urban areas are similar to those in urban areas. Even in some shaabiats in rural areas where schools are more dispersed, the student-teacher ratio features greater ratios. The cases of shaabiats Kofra, Ghat, Wahat, Sabha (rural but with a high pupil-teacher ratio), and Sebrata, Zawia, and Nikat Khams (urban with a low pupil-teacher ratio) illustrate this finding (Figure 5.31). Once again, this shows that teacher distribution does not take into account the real needs of schools.
Figure 5.31: Relation between Pupil-teacher Ratio and Pupil Density (2005–06)
Source: GAI and CPG for General Education data and our calculation.
5.51 More broadly, international comparisons show that Libya is the country with the lowest student-teacher ratio in the world (4 pupils per teacher in primary and secondary education). Figure 5.32 shows that the ratio is 27.9 in low- and middle-income countries, 42.6 in low-income countries, 18.7 in upper-middle-income countries, 14.0 in high-income countries, 44.7 in Sub-Saharan Africa, 17.5 in Europe and Central Asia, 25.1 in Latin America and the Caribbean, and 21.9 in the Middle East and North Africa.
Figure 5.32: Pupil-teacher Ratio in Primary and Secondary, Positioning of Libya Compared with other Countries
Source: UNESCO, 2007, GPC for General Education.

93
5.52 The trend to an excess supply of teachers is not recent. It emerged in the 1980s and was exacerbated in the 1990s and 2000s (Figure 5.33). In the 1970s, Libya was in a situation comparable to the average for the region. Between the early 1970s and mid-2000, this ratio decreased by 34 percent for the region, from 29.9 percent to 20.0 percent, while it was divided by 6.6 percent in Libya. The legacy of the Shaabiats Period on uncontrolled recruitments is quite damaging. During this period, the education system turned into a haven to absorb unemployment, without taking into consideration either qualifications or the needs of the sector.
Figure 5.33: Pupil-teacher Ratio in Primary, Libya and MENA Average, 1970–2007
28.5
18.1
13.7
8.1
4.3
29.9
25.623.5
20.6 20.0*
0
5
10
15
20
25
30
35
1970 1980 1990 2000 2007
Libya MENA
(*) : 2003-04
Source: World Bank 2007; and GPC for General Education.
Figure 5.34: Pupil per Class Ratio by Shaabiats, Basic Education, 2006–07
Figure 5.35: Pupil per Class Ratio by Shaabiats, Secondary Education, 2006–07
Source: Author’s conception using GPC for General Education data. Source: Author’s conception using GPC for General Education data
5.53 The process of school construction is anarchic. In 2007, the general education school infrastructure comprised 4,253 schools, with 2,947 allocated to basic education, 594 to secondary education, and 316 to a combination of basic and secondary education). Schools include 43,540 classrooms in good condition (98 percent out of 44,660 classrooms). This corresponds to an overall ratio of 31.6 pupils per classroom. However, the distribution per shaabiats shows a great dispersion, from under 25 pupils per classroom to over 55 (Figures 5.34 and 5.35). Several schools with infrastructure gaps have initiated a double shift; this is the case in more than half the basic education schools. 5.54 These shortcomings point to the absence of a master plan in school construction since the late 1990s. Schools are often built without a rational analysis of needs, and with little respect for norms

94
and standards. This has also led to a proliferation of small schools, known as “dwarf schools,” which are the result of local initiatives. They may be motivated by noble goals to ensure a place for children in school, but they are devoid of professionalism. There are 653 primary schools with fewer than 100 students and fewer than 10 classes. This number reaches 244 in secondary schools. Schools with fewer than 50 students represent about 7 percent of primary schools and 8 percent of secondary schools (Table 5.9). These buildings have reduced the distance between school and home (Table 5.10), but at an extremely high unit cost, both in terms of investment and operation. By international standards, the optimal size of a school is 300 students.
Table 5.9: School Size in Basic and Secondary Education (2005–06)
Basic Education Secondary School Size Pupils Classes School Structure Pupils Classes School Structure < 50 6,865 1,193 234 6.8% 2,837 246 89 7.7%
50–100 31,746 3,084 419 12.1% 11,453 708 155 13.4%
100–200 138,397 7,940 930 27.0% 42,960 2,082 294 25.5%
200–300 137,939 6,514 570 16.5% 47,496 1,983 192 16.7%
300–400 125,350 5,560 363 10.5% 37,821 1,366 109 9.5%
> 400 646,097 23,541 934 27.1% 205,388 6,043 314 27.2%
Total 1,086,394 47,832 3,450 100.0% 347,955 12,428 1,153 100.0%
Source: GPC for General Education.
Table 5.10: Distance between School and Home
Urban Rural Total
Primary Lower Secondary
Upper Secondary Primary Lower
SecondaryUpper
Secondary Primary Lower Secondary
Upper Secondary
<200 m 15.4% 13.0% 5.9% 11.8% 9.0% 5.6% 14.9% 12.4% 5.8%
200–400 m 14.8% 14.8% 7.5% 10.4% 9.2% 5.7% 14.2% 14.0% 7.2%
400-600 m 26.0% 24.1% 11.2% 22.9% 20.6% 8.9% 25.5% 23.6% 10.8%
>600m 43.8% 48.1% 75.5% 54.9% 61.1% 79.7% 45.3% 49.9% 76.1%
Source: The Economic and Social Survey, 2002–2003, GAI.
5.55 School location does not appear to be a major issue. About 55 percent of primary schools and 50 percent of colleges are located within 600 meters of students’ homes (Figure 5.36). Even in rural areas, more than 45 percent of primary schools are located within 600 meters of students’ homes.
5.56 External efficiency. Whereas available data do not allow an analysis of the external efficiency of the sector, some indications in vocational training show that it could also be low: nearly 20 percent of students fail to get the desired degree (they leave with a lower degree diploma), and the satisfaction of employers with the quality of graduates is very weak.52 Regarding higher education, even though more than 26,000 students graduate annually, there are no data available on their employability. Since the system of higher education is driven by social demand, students have the right to
52 See National Economic Strategy, Monitor Group, 2006.
Figure 5.36: Distance between School and Home
14.9% 12.4% 5.8%
25.5% 23.6%
10.8%14.2% 14.0%7.2%
45.3%49.9%
76.1%
0%10%20%30%40%50%
60%70%80%90%
100%
Primary Low er Secondary Upper Secondary
<200 m 200-400 m 400-600 m >600m
Source: The Economic and Social Survey, 2002–2003, GAI.

95
choose the kind of education they wish, as mandated by the law of higher education.53 The result is that there is a mismatch between what students and families choose as fields of study, and the needs for economic development and the labor market. 5.57 The most striking example of external education inefficiency is medical studies. Currently, higher education in Libya has the highest rate of specialization in the fields of medicine and health in the world (Figure 5.37). Nearly one student in four is currently enrolled in medicine and health-related programs. The international average is less than 10 percent. This figure is 3.8 percent in Morocco, 6.8 percent in Algeria, 5 percent in Tunisia, 5.2 percent in Saudi Arabia, and 5.4 percent in Turkey. Indeed, there are more than 55,000 students enrolled in these sectors: 23,000 in medicine (in 1997 there were 6,371 doctors in the country), more than 8,300 in dental surgery (in 1997 there were 693 dentists in the country), and around 5,670 in pharmacy (in 1997 there were 1,225 pharmacists in the country).
Figure 5.37: Enrollment in Health Fields: International Comparison
Source: UNESCO and Libyan data (2006–07).
VI. Policy Recommendations 5.58 The quality of education and unplanned investment are the biggest concerns faced by the education sector in Libya. This is consistent with previous findings in other sector reports (Adam Smith International 2006). The Government has prepared a preliminary investment program 2008-12 that is under review (See Annex B in Volume III). Although there are considerable investments made in education, few efforts are made to monitor the quality of service delivery and performance. In fact, there are no systematic efforts to monitor student learning achievements or repeaters, or to assess the percentage of graduates who find jobs, and therefore, there is no way to assess the returns of investments in education.
53 Law No. 1 of 1992, Article 7: “Higher education is free for holders of formal Arabic nationality, and everyone has the right to choose the kind of education that suits him and
can meet that desire, taking into account the community’s need and possibilities for universities and other institutions of higher education.”

96
5.59 The most important challenges faced by the education system are:
• Equitable access is accompanied by low internal efficiency rates. Although Libya has impressive gross enrollment rates (GERs), and balanced gender and urban/rural access to general education, the GER distribution by shaabia not only is very dispersed, but the GERs of most of the shaabiats are 120. Too-high GERs indicate low internal efficiency, often reflected in high repetition rates. Plus additional explanation regarding the presence of foreign students (who represent about 2% of students), the early registration before the age of 6 years and the inclusion in domestic education. Although neither the GPC for General nor Higher Education monitors repetition rates, 8 percent of primary-education students are repeaters, as are 17 percent of lower-secondary students, 18 percent of upper-secondary students, and 15 percent of higher-education students. These repetition rates are very high, even compared with low-income countries; the average repetition rate in OECD countries is less than 1 percent, the average for MENA countries is 4.3 percent, and the average for Sub-Saharan Africa is 15 percent.
• Learning outcomes are also inequitable. In addition to high repetition rates, there is wide dispersion by shaabia in illiteracy rates and in exit exams at the end of secondary school. The same shaabiats that show higher illiteracy rates are those with lower secondary enrollments.
• Urban areas seem to get the most abundant resources, leaving rural areas underserved. Sector allocations follow international standards: 60 percent of resources are devoted to general education (basic, upper, and lower secondary), 26 percent go to higher education, and 14 percent go to vocational education and training. However, there are important regional disparities in the distribution of human resources, mainly for higher and secondary education. The analysis of unit costs by students (in terms of budgetary allocations granted to shaabiats) and the level of income per capita show that the 13 poorest shaabiats have the fewest resources and the 5 wealthiest ones receive most of the resources.
• The student-teacher ratio in Libya is the lowest in the world, with an average of 4.3 students per teacher. The average for OECD countries is 16 for primary and 13 for secondary. The lowest student-teacher ratio found in an OECD country is Portugal, with 7, and the average for MENA is 20. An excessive number of teachers is the main reason: In 2007, the education sector absorbed one out of three people in the labor force in Libya.
• The lack of school mapping or planning has led to the proliferation of small schools. More than 50 percent of schools have less than 400 students, about 18 percent of primary schools have less than 100 students, and as many as 7 percent have less than 50 students. This explains why 40 percent of the schools operate on double shifts. The proliferation of small schools has had mixed results. On the one hand, it has facilitated access: more than 60 percent of primary and secondary students have their schools less than 600 meters from their homes in urban and in rural areas. On the other hand, despite the fact that the national average of students per classroom is 36, which is normal by international standards, it has not prevented a wide dispersion of this ratio among shaabiats, ranging from 25 to 55.
• Libya’s general education has the highest unit costs in the MENA region. Compared with other countries, the unit costs for general education (about US$1,200) are twice those of Algeria, Egypt, Jordan, Morocco, and Tunisia. Domestic higher-education costs are lower than the MENA average, but the cost of Libyan students abroad is very high at US$54,000 per student per year.
• Lack of adequate management has resulted in wasted resources. In education, the uncontrolled provision of inputs (hiring of teachers and building construction) has had priority over the introduction of education quality standards, monitoring, and accountability at all levels. Excess hiring is particularly worrisome. Nowadays, the education sector itself constitutes the most significant source of employment, at a very high cost and poor efficiency levels.

97
• Teachers’ national deployment does not follow the distribution of population density. Rural areas like Ghat, Kobra, Sabha, and Wahat have the highest student-teacher ratios, while urban areas like Nikat Khams, Sebrata, and Zawia show low student-teacher ratios. This is an indication that teachers are deployed based on their preferred locations, which does not necessarily match the needs of schools.
• Higher-education enrollment is high, but its distribution per field does not meet labor market needs. Libyan enrollment in higher education is the highest in the MENA region, but the distribution of students per discipline shows an uneven and problematic pattern. Whereas arts and humanities and medicine and health-related fields enroll a high 33.5 percent of the students and 22.4 percent, respectively, engineering barely gets 9 percent. High enrollment in medicine and health-related areas makes it difficult to accommodate the vast number of graduates in these fields.
• Low graduation rates are an indication that the quality of teaching and the readiness of students to learn are major problems. Estimates of the ratio of graduates to enrollment done at the University of Benghazi showed that the ratio is as low as 3.9 percent for economics and engineering, 6.5 percent for science, and the highest, 24 percent, for arts.
• High recurrent costs (mainly salaries), leave little room for other inputs, thus limiting the capacity to improve the quality of education. Whereas the OECD country with the highest percentage of GDP expenditure in education is Denmark, with 8 percent, about 10 percent of Libya’s non-oil GDP is devoted to education. The 2007 budget allocated to the education sector represented 22 percent of the national budget. However, salaries represent 97 percent of current expenditures, leaving a meager 3 percent to other current expenditures (textbooks, training, school materials, and so forth). This is a major limiting factor for developing a program for improving the quality of education services.
• Private sector participation in education is embryonic. Private expenditures on education are not known with precision, but the Economic and Social Survey (2002–2003) shows that the average Libyan spends about 2 percent of his or her income on education in both urban and rural areas, which is low. The private sector contribution to education accounts for less than 2 percent in general education and barely reaches 4 percent in higher education (Source: The Economic and Social Survey, 2002–2003, GAI).
5.60 The most critical decisions ahead are how to reallocate human and financial resources in order to meet the real needs of schools, and how to improve quality.
• Rationalization of human resources. As the government deploys a voluntary departure program, the reallocation of remaining teachers should have to follow a per-student allocation formula. It is clear that teachers concentrated in urban areas will have to be redeployed to rural and underserved areas. Adequate incentive mechanisms are required for teachers to relocate. The Government of Libya education development program for 2008–12 aims to reduce teachers in basic education by 35 percent and in secondary education by 25 percent, and has included a measure to triple salaries for teachers that will locate to schools more than 1ž0 kilometers away from their homes. These policies are an important step in the right direction. The current goal is to reduce the pupil-teacher ratio to above 7 in basic education and to 6 in secondary education. However, this reduction is modest; the target could be doubled without posing any risk to the quality of education.
• Developing a teacher professionalization program. One positive aspect of the 2008–12program is that it includes teacher training on a wider spectrum of courses, promoting various teaching skills of teachers, and helping solve the problem of a lack of teachers for certain

98
disciplines. While careful analysis of the criteria, incentives, and opportunities should be given to those that would voluntarily leave their posts, this program should combine with upgrading those skills of those remaining and requiring to upgrade their qualifications in the system. This would lead to define performance criteria, assessment methodologies, and incentives.
• Rationalization of physical resources. The goal of the GPC for General Education is to reduce the ratio of the number of students per classroom to 20 to 25. This program aims to bring order in the school map and streamline the distribution between regions within a goal of equity and efficiency. However, there are three key recommendations to improve it.
o Construction costs could be lowered. The current estimated cost of a classroom for basic education reached LD 175,000, equivalent to the cost of an average apartment in Tripoli. Several measures could help reduce these costs, such as defining different construction standards for basic and secondary education. A study of costs and standards of school buildings by category is recommended to better define the various components of cost and identify opportunities for economies of scale.
o Upgrade double shifts in some regions, but according to specific school needs and equipment. Double shifts have several advantages and help to effectively use the school infrastructure available, especially for primary education.
o Make a diagnostic of why a high number of construction sites have been abandoned. This would yield lessons and recommendations for future construction planning.
• Develop a program to improve the quality and relevance of education. The first step is to develop a system to monitor and evaluate student learning. Currently, the exam after basic education is the only national assessment after nine years of study. It would be desirable to (a) organize national examinations for assessment purposes for grades 4 or 6; and (b) participate in international assessments: the Trends in International Mathematics and Science Study (TIMSS), organized by the International Association for the Evaluation of Educational Achievement (IEA) and the Program for International Management in Higher Education (PISA), organized by the OECD. A quality improvement program would also need to include a comprehensive set of reforms in four areas: (a) a solid curriculum and sound pedagogy, (b) well-trained and motivated teachers, (c) a good monitoring and evaluation system, and (d) competent school managers.
• Development of a policy for higher education admissions, consistent with labor market needs and increasing demand for technical and vocational education and training (TVET) programs. A policy for higher education enrollment will need to be developed, including new admissions criteria and enrollment targets. For example, the number of students enrolled in teacher-training programs will have to be reduced, because there are now 28,365 students who are undergoing training and who will soon be seeking jobs. In the best-case scenario, assuming the resumption of the whole “qualitative deficit,” new recruitment of teachers for the next five years will take 14,000 graduates. A similar situation is observed for health-related programs.
• In addition to a new admissions policy, the higher-education system needs to reinforce a quality-assurance system. This is in order to evaluate the current institutions and the programs they offer, their relevance to the job market, and their alignment with international standards. As an important aspect of the higher education reform program, an exercise to define unified costs by fields of study is critical, and measures such as performance-based funding formulas for universities should be taken into consideration. Because the Government of Libya intends to increase private participation in the delivery of education, it is important to also analyze cost-sharing mechanisms for students from a higher socioeconomic status.
• The current expansion plan of universities needs to be revisited. Detailed projections of enrolment indicate that even if all graduates from secondary education were to enroll in public
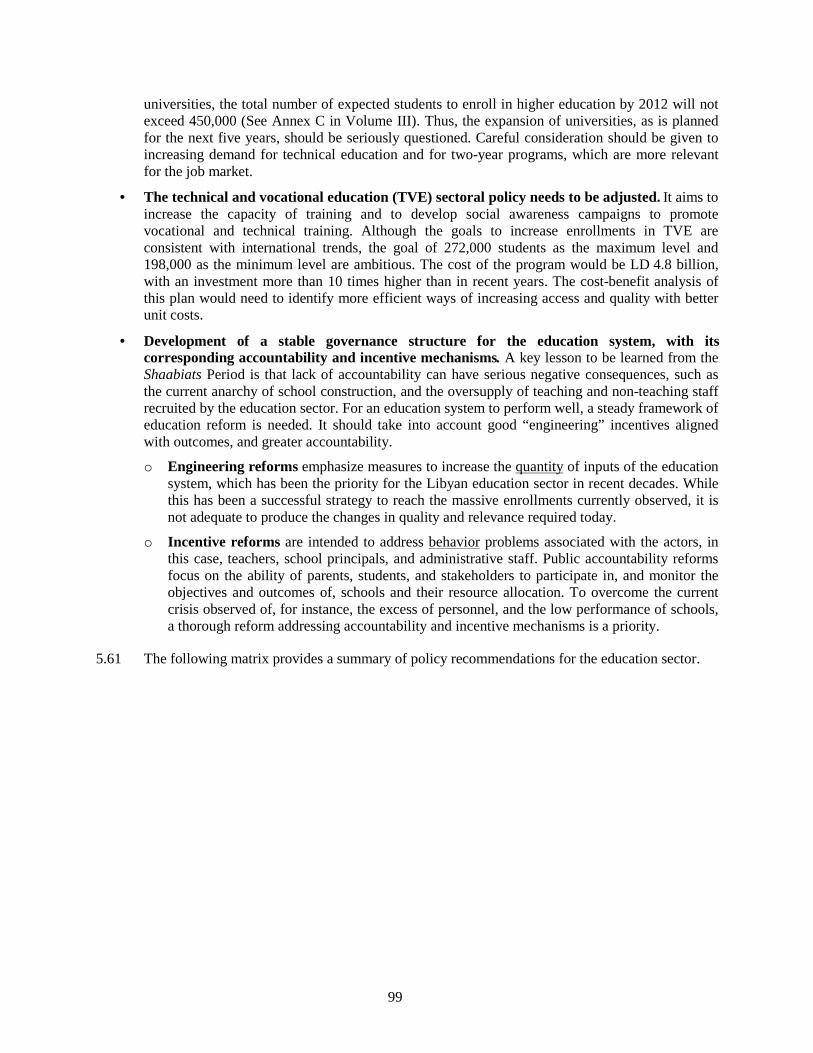
99
universities, the total number of expected students to enroll in higher education by 2012 will not exceed 450,000 (See Annex C in Volume III). Thus, the expansion of universities, as is planned for the next five years, should be seriously questioned. Careful consideration should be given to increasing demand for technical education and for two-year programs, which are more relevant for the job market.
• The technical and vocational education (TVE) sectoral policy needs to be adjusted. It aims to increase the capacity of training and to develop social awareness campaigns to promote vocational and technical training. Although the goals to increase enrollments in TVE are consistent with international trends, the goal of 272,000 students as the maximum level and 198,000 as the minimum level are ambitious. The cost of the program would be LD 4.8 billion, with an investment more than 10 times higher than in recent years. The cost-benefit analysis of this plan would need to identify more efficient ways of increasing access and quality with better unit costs.
• Development of a stable governance structure for the education system, with its corresponding accountability and incentive mechanisms. A key lesson to be learned from the Shaabiats Period is that lack of accountability can have serious negative consequences, such as the current anarchy of school construction, and the oversupply of teaching and non-teaching staff recruited by the education sector. For an education system to perform well, a steady framework of education reform is needed. It should take into account good “engineering” incentives aligned with outcomes, and greater accountability.
o Engineering reforms emphasize measures to increase the quantity of inputs of the education system, which has been the priority for the Libyan education sector in recent decades. While this has been a successful strategy to reach the massive enrollments currently observed, it is not adequate to produce the changes in quality and relevance required today.
o Incentive reforms are intended to address behavior problems associated with the actors, in this case, teachers, school principals, and administrative staff. Public accountability reforms focus on the ability of parents, students, and stakeholders to participate in, and monitor the objectives and outcomes of, schools and their resource allocation. To overcome the current crisis observed of, for instance, the excess of personnel, and the low performance of schools, a thorough reform addressing accountability and incentive mechanisms is a priority.
5.61 The following matrix provides a summary of policy recommendations for the education sector.
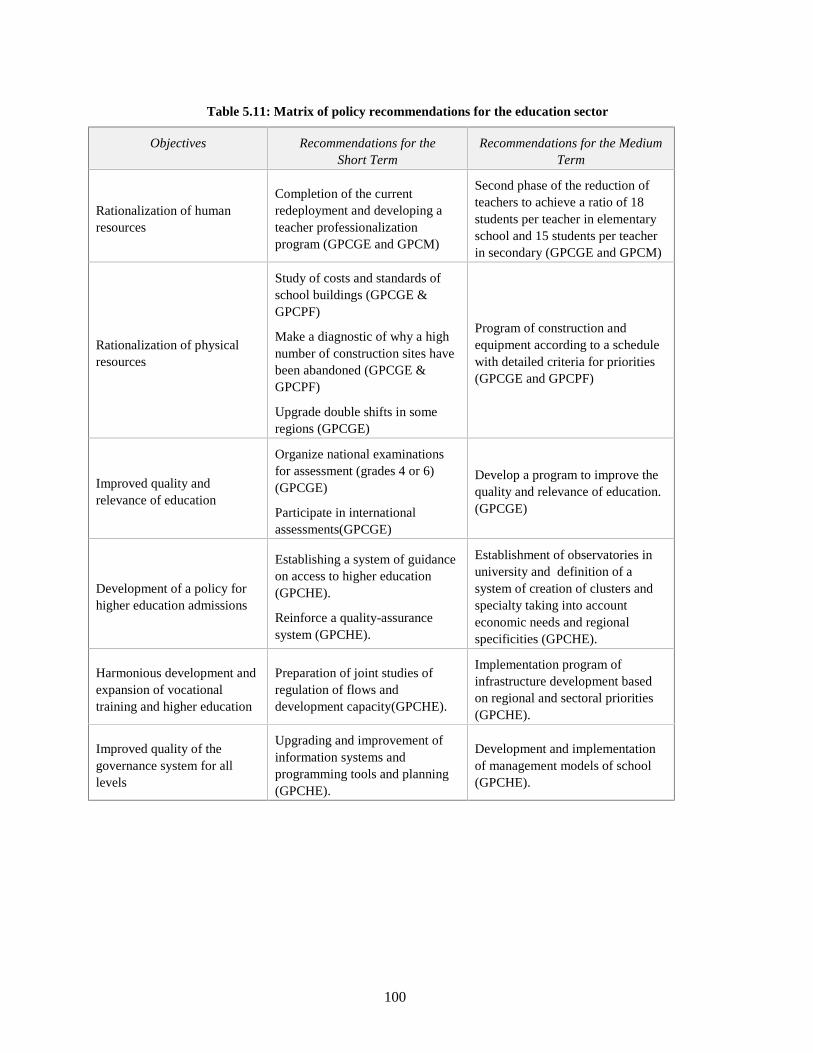
100
Table 5.11: Matrix of policy recommendations for the education sector
Objectives Recommendations for the Short Term
Recommendations for the Medium Term
Rationalization of human resources
Completion of the current redeployment and developing a teacher professionalization program (GPCGE and GPCM)
Second phase of the reduction of teachers to achieve a ratio of 18 students per teacher in elementary school and 15 students per teacher in secondary (GPCGE and GPCM)
Rationalization of physical resources
Study of costs and standards of school buildings (GPCGE & GPCPF)
Make a diagnostic of why a high number of construction sites have been abandoned (GPCGE & GPCPF)
Upgrade double shifts in some regions (GPCGE)
Program of construction and equipment according to a schedule with detailed criteria for priorities (GPCGE and GPCPF)
Improved quality and relevance of education
Organize national examinations for assessment (grades 4 or 6) (GPCGE)
Participate in international assessments(GPCGE)
Develop a program to improve the quality and relevance of education. (GPCGE)
Development of a policy for higher education admissions
Establishing a system of guidance on access to higher education (GPCHE).
Reinforce a quality-assurance system (GPCHE).
Establishment of observatories in university and definition of a system of creation of clusters and specialty taking into account economic needs and regional specificities (GPCHE).
Harmonious development and expansion of vocational training and higher education
Preparation of joint studies of regulation of flows and development capacity(GPCHE).
Implementation program of infrastructure development based on regional and sectoral priorities (GPCHE).
Improved quality of the governance system for all levels
Upgrading and improvement of information systems and programming tools and planning (GPCHE).
Development and implementation of management models of school (GPCHE).

101
Box 5.1. International Experiences in Increasing Private Sector Participation in Education
In Libya, there is a proposal to transition from a state-dominated economy to a private-led economy. There are important lessons to learn about this from countries with transition economies, and from experiences in Latin America and the United States, where initiatives on introducing private financing and/or management of education were taken.
The most commonly used policy instrument in the privatization of education is school choice and financing of education that follows the student. The latter is known as the voucher system. In the Czech Republic, this change had a major impact on the education system. Once the transition period began, private schools became legal and public funding was reformed, so that private schools received funding in proportion to the number of students enrolled. This funding formula also applied to public schools. Students and their families in the Czech Republic got school choice, and the system was financed by a voucher-like mechanism. A similar system has also been used in Chile, Colombia, and the United States.
The main arguments used to justify the use of vouchers are that (a) privately managed education is inherently more cost-effective than public education, (b) a privatized education system is more efficient in providing social mobility for low-income students, and (c) the social costs of privatizing public education are minimal. Several studies have been conducted to evaluate the results obtained by the use of vouchers.
In Chile, as part of the overall free-market policy introduced by the military regime in 1980, teachers’ contracts were revoked and teachers’ unions eliminated, allowing public schools to hire and fire teachers. In addition, a fully subsidized deregulated private school system was introduced so that, through the use of vouchers, public and private schools compete for students. The results of this experience have shown that: • Spending on education dropped considerably, initially for tertiary and secondary education, and by the end of
the 1980s, in primary education, as well. As a result, however, some inequities in access and quality were observed, because the most prosperous districts were able to spend more money on schools, and upper- and middle-income families were able to overcome the shortfall in funding by supplementing the vouchers and sending their children to private schools.
• Higher-income families used the vouchers to send their children to private schools. • Student learning showed no improvement. Similar results have been found in Milwaukee (USA).
The experience of using vouchers in Colombia has shown that vouchers can have a high payoff for the best group of excluded low-income students up to the point at which they can be absorbed by the existing, high-quality private schools. Beyond that point, however, payoffs decline rapidly.
In sum, this is a key area for further analysis in the case of Libya. The salient question is whether expanded low-quality private education paid for by government funds is superior in education outcomes to existing, more expensive, and low-quality public education.
Source: World Bank staff elaboration.

102
Chapter 6: Improving Health Services for All in Libya
While Libya appears to have resolved issues related to physical, geographic, and financial access to health care, the fact that about one-fifth of health expenditures are private in a system where the state offers 100 percent coverage of and access to a very generous package of health care services points to the low quality of care and patient dissatisfaction with the way the services are organized and delivered. There is a consensus that the Libyan health care system suffers from the following shortcomings based on existing survey data and the organization of the health system: (a) absence of a strong national institutional setup and information base for effective stewardship, policy and planning, regulatory framework, and quality assurance/control; (b) lack of gatekeeping and no hierarchy in access to care and patient referral; (c) input-based financing of health facilities and providers without any incentive mechanisms for productivity or performance; (d) lack of a long-term human resources development policy (planning, production, deployment, and management); and (e) health-care-seeking behavior modulated by a perception that access to health care is a right and should be used freely and as often and as much possible, with no regard to appropriateness of seeking care or to costs.
I. Introduction 6.1 The development of the health sector in the Libyan Arab Jamahiriya reflects both the country’s commitment to social welfare and its heavily decentralized political and administrative systems. Libya’s social development is relatively advanced, as indicated by its human development index of 0.818, giving it a rank of 56th out of 177 countries (UNDP 2007). This makes it the highest-ranked country in Africa, the fifth-highest in the Middle East and North Africa region after four Gulf Cooperation Countries, and a member of the highest of the three ranking brackets, High Human Development. Gross domestic product (GDP) per capita is approximately LD12,118 at current prices, or US$9,225 in current dollars (2006 value),54 with an adult literacy rate for individuals aged 15 and older estimated to be 84 percent.55
6.2 Libya has witnessed rapid urbanization and an aging population, which has direct implications on the performance of the health sector, including the social security system. The social security fund covers 75 percent of the labor force, representing the highest coverage rate in the region, paying benefits equivalent to 1.4 percent of GDP. The gap between contributions and benefits is expected to widen in the future. 6.3 Each of the 22 municipalities, or shaabiats, is responsible for the provision and delivery of health services financed centrally. However, since the introduction of economic sanctions in the mid-1980s, Libya’s health care system has been prone to a lack of medical supplies and the availability of specialized treatment, combined with a general lack of coordinated and centralized health policy and planning. Total health expenditures account for 3.5 percent of GDP, or US$332 per capita (at the international dollar rate), 81 percent being public and 19 percent being out-of-pocket in 2005.56 Despite universally free health care, many Libyans travel abroad for health care or seek private services, resulting in a relatively high proportion of private expenditures.
54 International Monetary Fund 2008. World Economic Outlook, October 2008 Database. 2008 estimates are LD7,682 (constant prices), LD12,118 (current prices) and US$9,225
(current prices). World Bank Gross National Income per capita estimate is US$9,010 for 2007 (current US$, Atlas method). 55 UNESCO Institute of Statistics data, UN Statistics Division Common Database. 56 World Health Organization, National Health Account data (2007). Values may differ from national estimates due to accounting differences.

103
6.4 Recent research by the National Committee for Health Education (ElFituri and other 2006) in Libya has suggested that health officials and the general public prioritize health issues differently. For example, out of 20 issues, “regular medical checkups” was ranked third highest by the general public, but did not feature in the top 10 ranked issues by health officials. The public’s changing preferences ultimately influence their demand for health services, with implications for health policy and planning in Libya. The use of Tunisian and European health services by Libyans is also very common. 6.5 This chapter examines how efficiently and equitably government expenditures on health are allocated and used, and whether government investment increases health system performance and results in better health outcomes. It covers the overall organization of the health system, the role of public and private sectors in service provision, total and public financing trends including intra-sectoral allocations by expenditure categories, and the distribution of supply and utilization across geography and socioeconomic groups. The chapter draws on data from existing public health service and expenditure data and information, sectoral reports, and data from the 2002–2003 Household Survey. This information is complemented by other qualitative information through interviews with government officials, service providers, and community-based organizations in select regions/districts. 6.6 The chapter is organized as follows. Section II presents a profile of the performance of the health sector. Section III provides a description of the institutional framework, that is, the way the system is governed, organized, services provided, and who are the financial agents, and the provision of health services and patterns of its utilization. The overall expenditure trends are then presented in Section IV. It analyzes general trends in public expenditure. A brief analysis of the efficiency in the sector is presented in Section V, which refers to some material on equity considerations. Section VI offers policy recommendations. 6.7 Data availability is limited. Due to data limitations, some aspects of health expenditure and utilization patterns have not been analyzed, which include the following. First, while it would be useful to disaggregate public budget expenditures by economic classification such as itemized capital and operational costs and wages, information on such expenditure was limited. Second, limited information was available regarding the intra-sectoral distribution of public expenditures across levels of health care (that is, primary, secondary, tertiary, extended care), which excluded these analyses from the review. Third, information regarding state-approved reimbursement rates for health services and the real costs of health services was not available by which to conduct an assessment of the correlation between the two. Fourth, in many cases, data on expenditures and utilization over time were limited, rendering it difficult to analyze trends over time for some indicators. Finally, data regarding quality of care and the extent and type of services used abroad were not available. The analysis can be updated in the future upon availability of this information.
II. The Performance of the Health Sector
6.8 Health status. Key social and demographic indicators for Libya compared to the average values for the Middle East and North Africa (MENA) region are introduced in Table 6.1. While key health indicators such as average life expectancy and infant mortality rates have decreased over the past 10 years and are higher than the MENA average, they are relatively average by international standards given GDP. While being ranked relatively high on the Human Development Index scale, its health sector rankings in 2000 were 107 and 94 in terms of level of health and in system performance on the level of health, respectively (WHO 2000). Life expectancy at birth is 74 years (males 71 years and females 76 years), on a par with most middle-income countries. Compared to other MENA countries, as Figure 6.1 shows, for its GDP per capita, Healthy Average Life Expectancy (HALE) is over the average regression line.

104
6.9 Infant mortality rates (IMR) and under-5 mortality rates (U5MR) are lower in Libya than in most MENA countries, at 18 and 21 per 1,000 live births in 2007, respectively. Trends in IMR and U5MR during 1998–2005 using data from various international and national sources are presented in Table 6.2. Generally, national estimates for infant and under-5 mortality rates are slightly higher than other sources. In relation to its GDP per capita, Libya’s IMR and (U5MR) is on a par with most middle-income countries, as shown in Figure 6.2. In 2007, the maternal mortality ratio for Libya was 27 deaths per 100,000 live births. By comparison, in 2000, the maternal mortality ratio was estimated at 40 per 100,000 lives births (Ministry of Health), which is considerably lower than in Egypt (84), Lebanon (150), or Tunisia (120).57 Since 1990, IMR has been steadily decreasing as shown in Figure 6.3, although it remains higher than other upper-middle and high-income countries located in the Gulf Cooperation Council and the European Union.
Table 6.1: Social and Demographic Indicators in Libya, 2006
Sources: (1) World Economic Outlook, October 2007, International Monetary Fund; data for 2006–08 based on Fund staff estimates. (2) Ministry of Health, Libya. Data for MENA is for 2005 based on World Development Indicators, World Bank, 2008 (3) Human Development Report 2005, UNDP.
Table 6.2: Health-related MDG Indicators from Various Sources in Libya, 1990–2005
Health indicator 1990 1995 2000 2007 Infant Mortality (per 1,000 live births) 27 24 21 18 Under-5 Mortality (per 1,000 live births) 43 30 27 20 Maternal Mortality (per 100,000 live births) 77 77 40 27
Source: Ministry of Health, Libya.
57 WHOSIS 2008; data shown are for 2000.
Units Libya MENA GDP Per Capita (1) PPP$ $12,027 $7,565 Demographic Indicators Population (2) Millions 5.42 301.9
Aged 0–14 Percent of total 32.4 34.3 Aged 65 and above Percent of total 4.5 4.0
Age Dependency (2) Ratio 0.51 0.63 Urban Population (2) Percent of total 85 68.9 Life Expectancy at Birth (2) Years 72.5 70.4
Male 72 68.7 Female 73 72.2
Immunization Rate (2) Percent of infants younger than 12 months immunized
Measles 98 91.7 DPT 98 91.7
Human Development Index (HDI) (3) Index 0.818 0.713

105
Figure 6.1: Global Trend Analysis of Under-Five Mortality Rate, 2005
y = 164475e-2.2929x
R2 = 0.8171
0
50
100
150
200
250
300
Per capita GDP, PPP, 2005
Und
erFi
veM
orta
lity
(per
1,00
0liv
ebi
rths
)
Libya
10,000100 1000 100,000
Source: World Development Indicators 2007; UNICEF, State of the World Children 2007; IMF,
World Economic Outlook Database, April 2007.
Figure 6.2. Global trends in Infant Mortality Rates, 1990-2006
Global trends in Infant Mortality Rate, 1990 - 2006
MENA
Egypt
Kuwait
Libya
Malta
Tunisia
U.A.E.
E.U.0.0
10.0
20.0
30.0
40.0
50.0
60.0
70.0
1990 1995 2000 2005 2006
Year
IMR
(dea
thsp
er1,
000
liveb
irths
)
MENA Algeria Egypt Iran Jordan Kuwait
Lebanon Libya Malta Morocco Tunisia UAE
WBG EAP ECA EU LAC
Source: World Bank Development Indicators, 2009. MENA = Middle East and North Africa Region. UAE = United Arab Emirates. WBG = West Bank and Gaza. EAP = East Asia/Pacific Region. ECA = Eastern and Central Asia Region. EU = European Union. LAC = Latin America and Caribbean Region
6.10 Libya continues its demographic transition, with a high total fertility rate of 5.2 children per woman of reproductive age.58 Its population is relatively young; 32 percent are below age 15 and nearly 5 percent are over age 65. Eighty-five percent live in urban areas, and access to improved sanitation is nearly universal, at 98 percent in both rural and urban areas.59 Tobacco is used by 35 percent of the adult population;58 a relatively high percentage of adolescents aged 13 to 15, 12.4 percent, use tobacco products, and more than two times as many males as females use tobacco products (17.1% versus 7.2% respectively).
58 World Health Organization, Regional Office for the Eastern Mediterranean Database. Data shown are for 2003. 59 World Development Indicators. Data for age breakdown are for 2006, and data for urbanization and sanitation are for 2004.
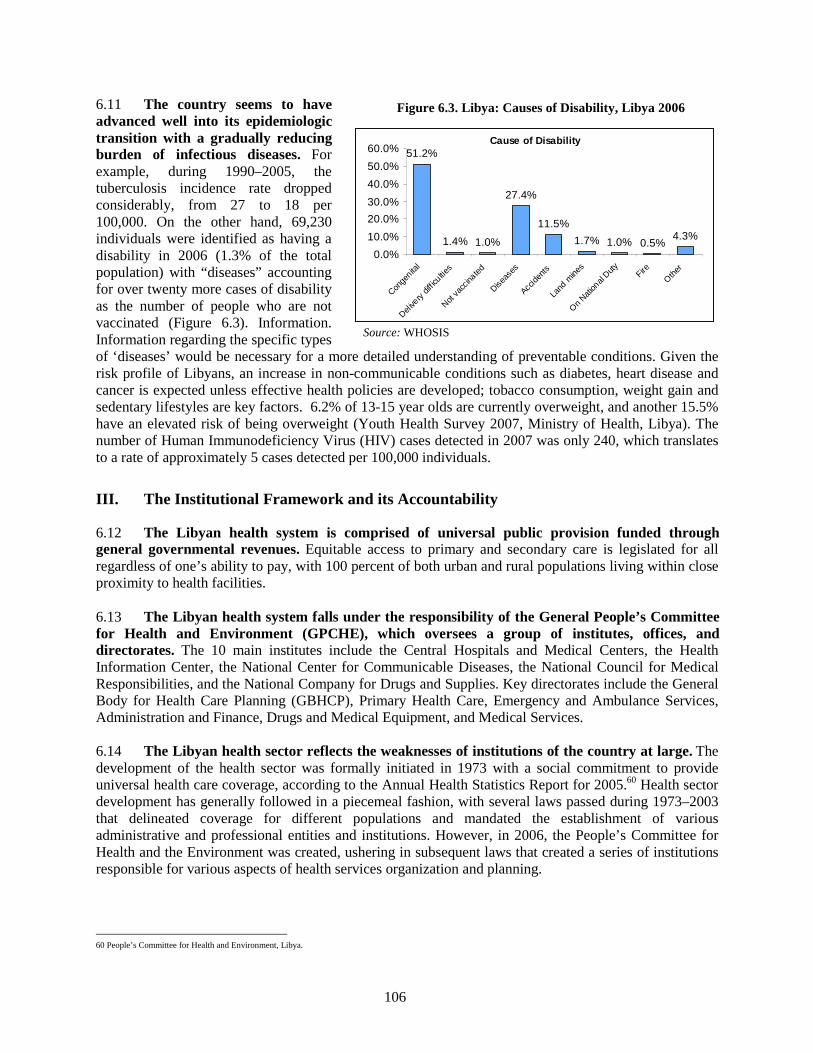
106
6.11 The country seems to have advanced well into its epidemiologic transition with a gradually reducing burden of infectious diseases. For example, during 1990–2005, the tuberculosis incidence rate dropped considerably, from 27 to 18 per 100,000. On the other hand, 69,230 individuals were identified as having a disability in 2006 (1.3% of the total population) with “diseases” accounting for over twenty more cases of disability as the number of people who are not vaccinated (Figure 6.3). Information. Information regarding the specific types of ‘diseases’ would be necessary for a more detailed understanding of preventable conditions. Given the risk profile of Libyans, an increase in non-communicable conditions such as diabetes, heart disease and cancer is expected unless effective health policies are developed; tobacco consumption, weight gain and sedentary lifestyles are key factors. 6.2% of 13-15 year olds are currently overweight, and another 15.5% have an elevated risk of being overweight (Youth Health Survey 2007, Ministry of Health, Libya). The number of Human Immunodeficiency Virus (HIV) cases detected in 2007 was only 240, which translates to a rate of approximately 5 cases detected per 100,000 individuals.
III. The Institutional Framework and its Accountability
6.12 The Libyan health system is comprised of universal public provision funded through general governmental revenues. Equitable access to primary and secondary care is legislated for all regardless of one’s ability to pay, with 100 percent of both urban and rural populations living within close proximity to health facilities.
6.13 The Libyan health system falls under the responsibility of the General People’s Committee for Health and Environment (GPCHE), which oversees a group of institutes, offices, and directorates. The 10 main institutes include the Central Hospitals and Medical Centers, the Health Information Center, the National Center for Communicable Diseases, the National Council for Medical Responsibilities, and the National Company for Drugs and Supplies. Key directorates include the General Body for Health Care Planning (GBHCP), Primary Health Care, Emergency and Ambulance Services, Administration and Finance, Drugs and Medical Equipment, and Medical Services.
6.14 The Libyan health sector reflects the weaknesses of institutions of the country at large. The development of the health sector was formally initiated in 1973 with a social commitment to provide universal health care coverage, according to the Annual Health Statistics Report for 2005.60 Health sector development has generally followed in a piecemeal fashion, with several laws passed during 1973–2003 that delineated coverage for different populations and mandated the establishment of various administrative and professional entities and institutions. However, in 2006, the People’s Committee for Health and the Environment was created, ushering in subsequent laws that created a series of institutions responsible for various aspects of health services organization and planning.
60 People’s Committee for Health and Environment, Libya.
Figure 6.3. Libya: Causes of Disability, Libya 2006
Source: WHOSIS
Cause of Disability51.2%
1.4% 1.0%
27.4%
11.5%
1.7% 1.0% 0.5%4.3%
0.0%
10.0%
20.0%
30.0%
40.0%
50.0%
60.0%
Conge
nital
Delive
rydif
ficultie
s
Notva
ccina
ted
Diseas
es
Accid
ents
Land
mine
s
On
Nation
alDuty Fire
Oth
er

107
6.15 The overall aim of the current national health policy is to achieve comprehensive and uniform distribution of health services through central coordination and improved efficiency. Only very recently, the GPCHE Development Program for 2008–201261 has identified a set of objectives geared at improving overall quality of care with the following five specific policy priorities for the health sector:
• Improvement of quality and access to primary health care services for all citizens. • Advancement of standards and practices in curative care with linkages to international centers
of excellence. • Enhancement of private sector development in health. • Improvement of the quality of medical infrastructure and standards. • Advancement of public health and environmental standards and policies.
6.16 As part of its Health Sector Development Program, the Libyan government has included a comprehensive assessment. It includes a retrospective evaluation of the following: improvements in maternal and child health and other overall health indicators; the supply of health infrastructure such as health care centers, hospitals, and emergency ambulances; the availability of health professionals; the capacity of medical training; and future plans to address primarily the supply of services. 6.17 The provision of health services is made up of both public and private health care, with the underlying public system providing free coverage to all citizens. The health system operates on three main levels. The first level consists of primary health care facilities which are organized in terms of catchment area size, consisting of (a) health units which provide care to relatively small catchment areas, (b) health centers, covering larger populations, and (c) polyclinics, providing primary as well as some outpatient services as hospital satellite units to still larger catchment areas. The second level consists of general hospitals, and the third consists of tertiary, specialized hospitals. Specialized public hospitals and private hospitals operate in parallel in both a complementary and competitive way, depending on the nature of treatment sought and the availability of care. The nature of private health care in Libya in comparison to other countries is discussed further in Box 6.1. 6.18 The underlying governance structure is unclear as to which health care functions are fulfilled at what level, and how the lines of authority and accountability on technical and fiduciary matters are aligned. For instance, the existing health care laws date from the 1970s. While hospitals receive their budgets directly from the Ministry of Finance, other facilities such as health care units and centers receive budgets from the Shaabiats Health Secretariat. Out of 99 hospitals,62 21 have a higher degree of autonomy to use their budget, hire and fire health professionals, or provide them with much higher salaries, but other hospitals, often with similar vocation or degree of specialization, do not have that privilege. The private sector operates under unclear conditions on the basis of licenses granted to them by individual shaabiats, rather than through a national system of licensure overseen by the General People’s Committee for Health and Environment centrally. While the Health Information Center currently collects health status and system indicators at a central level, Libya would benefit from a more systematic and detailed monitoring and evaluation of health outcomes and system performance. There is a lack of information technology equipment at the facilities to enter, store, and use health, health services, and cost data, and relative lack of information necessary to assess performance leveling terms of satisfaction, efficiency and corruption. 6.19 The involvement of other stakeholders is limited. This concerns physicians, other allied health professional associations, labor unions, and civil society groups representing beneficiaries. So, while in
61 Libyan Arab Jamahiriya 2007. Development Program for Health and Environment 2008–2012, General People’s Committee for Health and Environment. 62 Libyan Arab Jamahiriya 2007, Development Program for Health and Environment 2008–2012.

108
theory the population is involved in decision-making through People’s Congresses, there is no mechanism in the health sector for them to participate in the governance of facilities or indirectly through premium or out-of-pocket payments, thus limiting the incentives for them to expect accountability from providers. Besides, providers are not directly involved through any professional association in decisions regarding their licensing, wage negotiations, and other issues pertaining to human resources management. 6.20 Libya appears to have a comprehensive and abundant health care infrastructure, as shown in Table 6.3, yet efficiency may be relatively low. As of 2008, there are 370 beds and 170 physicians per 100,000 population (Ministry of Health, Libya), comparatively higher than several MENA countries such as Egypt (220 and 54 respectively), Iran (170 and 87), and Tunisia (180 and 134).63 Relatively limited data on service use for both primary health care and inpatient levels were available or accessible (for example, the number of outpatient visits per capita, admission rates, average length of stay, occupancy ratio) for a comprehensive assessment of performance relative to other countries. Bed occupancy rate is relatively low at 56 percent and average length of stay per person per year is relatively long at 9 days (Ministry of Health, Libya, data for 2005). The number of outpatient visits per person per year is estimated to be 1.7 (Ministry of Health, Libya, data for 2005). More information on caseload and output indicators is needed to assess efficiency in the Libyan health system. 6.21 Human resources. Libya appears to be well endowed in human resources, although there is a preponderance of professionals in Ben-Ghazi and Tripoli, which has traditionally been resolved by hiring foreign health professionals from other parts of MENA and South Asia to work in other urban and rural areas. Professionals from South Asia account for 15 percent of physicians and 6 percent of nurses as of 2007, as shown in Table 6.4. Overall, 69 percent of all doctors and 32 percent of all nurses work in hospitals. Of all health professionals working in hospitals, foreign doctors account for 51% and foreign nurses account for 92 percent, which indicates a high reliance on foreign professionals in the area of inpatient care.
63 World Health Organization 2008. WHO Statistical Information System (WHOSIS). Figures reported for hospital bed and physician ratios in Egypt are for 2005 and 2003,
respectively; for Iran, 2005 and 2004, respectively; and for Tunisia, 2004 for both. Figures are estimates based on public providers.
Table 6.3 Health Care Resources and Utilization in Libya, 1995–2007
1995 2000 2007 Hospital beds per 100,000 412 420 370 Private beds as % of all hospital beds 1.7 2.8 6.0 Inpatient admission rate (% of population) — — 8.1 Bed occupancy rate (all hospitals) — 49 56 Average length of stay (all hospitals) 6.5 — 9.0 Average catchment population per health center 4,350 4,600 4,347 Physicians per 100,000 — — 170 Nurses and Midwives per 10,000 — — 50 Midwives per 10,000 45 48 48 Number of outpatient visits per person per year — — 1.7 Source: Ministry of Health, Libya.
109
BOX 6.1 PUBLIC-PRIVATE PARTNERSHIPS IN THE LIBYAN HEALTH SECTOR
Expanding the role of the private sector in Libya has been identified as a key policy objective in the 2008-2012 Health Sector Development Program. While the Libyan health system offers free and universal health care to all of its citizens, a private sector has developed in parallel with little interference by the State. Overall, according to government figures in 2007, out of 1,658 polyclinics, primary health centers, and outpatient clinics, approximately 25 percent are private, and out of 19,950 hospital beds, approximately 7 percent are private.
Evidence from the 2003/4 Household Survey in Libya shows that households report using services in the public sector two to four times as often as the private sector on average. The private sector is currently used mostly for services such as medical examinations, medications, physician consultations, laboratory tests and x-rays, and dental treatment. Reasons for using private services may include real or perceived quality, such as the availability of drugs and functional medical equipment, waiting times, staff responsiveness and attentiveness to patient needs, or convenience and access considerations.
Options for reform include addressing supply-side factors such as the availability of high-quality infrastructure including drugs and medical equipment as well as staff incentives, within the framework of efficiency and cost control. Private sector development in the health sector may take on a variety of roles, from a limited, supplementary role where the public sector remains the dominant financing and delivery agent, to a larger role where services may be largely delivered by the private sector, where the state assumes regulatory functions. Its role largely depends on the diagnosis of the particular problems within the existing public system.
There are many lessons worldwide from collaboration with the private sector through public-private partnerships (PPPs). Yet effectiveness and sustainability issues should be carefully evaluated. Examples from Europe include the privatization of outpatient dialysis services in Romania (leading to lower costs and improved quality of care), transformation of a large public hospital in Germany (teaching facility state-run and acute care privately managed, incorporating national system of diagnostic-related groups (DRGs), leading to improved patient care without increasing costs), and recently-developed PPPs in Portugal involving construction or revitalization of ten hospitals and additional health care centers (where a public entity will monitor progress and outcomes to ensure efficiency and quality of care at higher standards than public hospitals). In the case of Romania in 2002, the government arranged a leasing arrangement with private providers who operated and managed public facilities for the provision of radiology and laboratory services, and were entitled to revenues generated from these services. In the case of some rural hospitals in South Africa, the private sector recently became wholly responsible for building, operating, and staffing the facility with either public or private providers for a specified term, transferring ownership to the public sector at a pre-determined date (Nikolic and Maikisch, 2006). The advantages included lower public costs at providing services, higher-quality care, and the shift of financial and demand risk away from the public hospital to private providers, with an incentive for the providers to operate efficiently, assuming appropriate regulatory and incentive measures are in place to promote equity of access and efficiency of care (Marek et al, 2003).
Options for reforming the private health system in Libya are best assessed based on the nature of systemic challenges, the relative importance of various policy objectives, and the existence or development of policy levers to enhance effectiveness and sustainability of public-private collaboration. Regarding poorly-perceived quality of care and lack of efficiency, it would be important to accurately characterize which facilities and/or providers reflect which challenges through the use of nationally-representative health facility surveys, including patient- and provider-based perspectives. Should the role of the private sector evolve, key features that can enhance its success at meeting policy objectives include: (a) a strong public regulatory role for monitoring and ensuring quality of care; (b) a pre-determined tariff or DRG system for controlling costs and ensuring efficiency; (c) and careful selection of services for private provision and associated public financing schemes that ensure equity of access. Such features should be carefully examined and designed in Libya prior to expanding the role of the private sector.
Source: World Bank staff elaboration.

110
6.22 The Libyan health workforce policy and strategy has resulted in an excess number of medical professional trained for fewer positions than there are available, and the supply of family physicians has been too low. There are approximately 20,000 undergraduates in the nine medical and other health sciences faculties who, upon graduation, will put enormous pressure on the system that has limited job openings. In addition, the quality of education does not appear to be on a par with international standards and qualification requirements, because all students invariably graduate with very little attrition. Finally, the skills and qualifications of the graduates, which are often in highly specialized areas of medicine, do not necessarily meet the needs of the population, which continues to need primary health services, given the increase in non-communicable chronic conditions.
Table 6.4. Composition of Health Care Professionals by Nationality in Libya, 2007
Professionals Doctors Nurses & Midwives Pharmacists Dentists Technical Administration Total Total 8,663 32,048 1,033 1,094 15,559 37,567 95,964 Libyan nationals 7,317 30,009 986 987 15,070 37,567 91,936 Percent of total 84.5 93.6 95.5 90.2 96.9 100.0 95.8 Non-Libyan nationals 1,346 2,039 47 107 489 0 4028 % of total 15.5 6.4 4.5 9.8 3.1 0.0 4.2
Source: Ministry of Health 2007. Percentages based on author’s calculations.
6.23 Health services delivery. Overall, universal access to public health care regardless of ability to pay is legislated in Libya. Rates for immunization, prenatal coverage, and births attended by a qualified health care worker are approximately 98% (Ministry of Health, Libya, 2007 data). However, there may be access problems to high-quality obstetrical care for pregnancy complications, which explains the relatively high maternal mortality ratio in Libya that exceeds the average for middle-income countries. Further analysis is needed to more carefully examine equity in the quality of health care delivery in Libya in terms of geographical, gender and socioeconomic equity. 6.24 Pharmaceutical provision. The National Company for Drugs and Supplies oversees the licensing, acquisition and production of pharmaceutical products. Information on regulatory measures for the safety, quality and effectiveness of pharmaceutical products is limited; as such, little information is available regarding a national list of either essential drug policy or policy governing the use of branded and generic drugs. A nominal fee of LD1 is required to fill a prescription through a public dispensary, but it in practice there is a significant use of private pharmacies and high out-of-pocket payments for medications based on the 2002-2003 Libyan Household Survey, elaborated later in this report. 6.25 Quality of care. There are indications that the quality of care in Libya may not be up to par with population expectations. There are three reasons why quality of care appears to be of concern: (a) there is a thriving private sector providing medical care despite free access to a generous package of publicly provided services, (b) about 18 percent of health expenditures are private and out-of-pocket, and (c) those who can afford it often go to neighboring countries to receive better-quality care. 6.26 The concern about quality of care has two components: (a) perceived low technical quality of care, especially at the PHC level; and (b) perceived low quality of care for non-clinical aspects of service delivery, that is, lack of responsiveness to the population’s expectations and increased demand for health care, which puts additional pressure on the PHC level, resulting in very short visit with the provider, and consequent visits for diagnostics, prescriptions, and drugs. In addition, despite having in theory three levels of care (primary health care, general hospitals, and specialized hospitals), there is no gatekeeping, nor a functional patient referral system in place. This system has resulted in access at all levels being left to the discretion of the patient—the so-called “open buffet”—where people are free to pick and choose
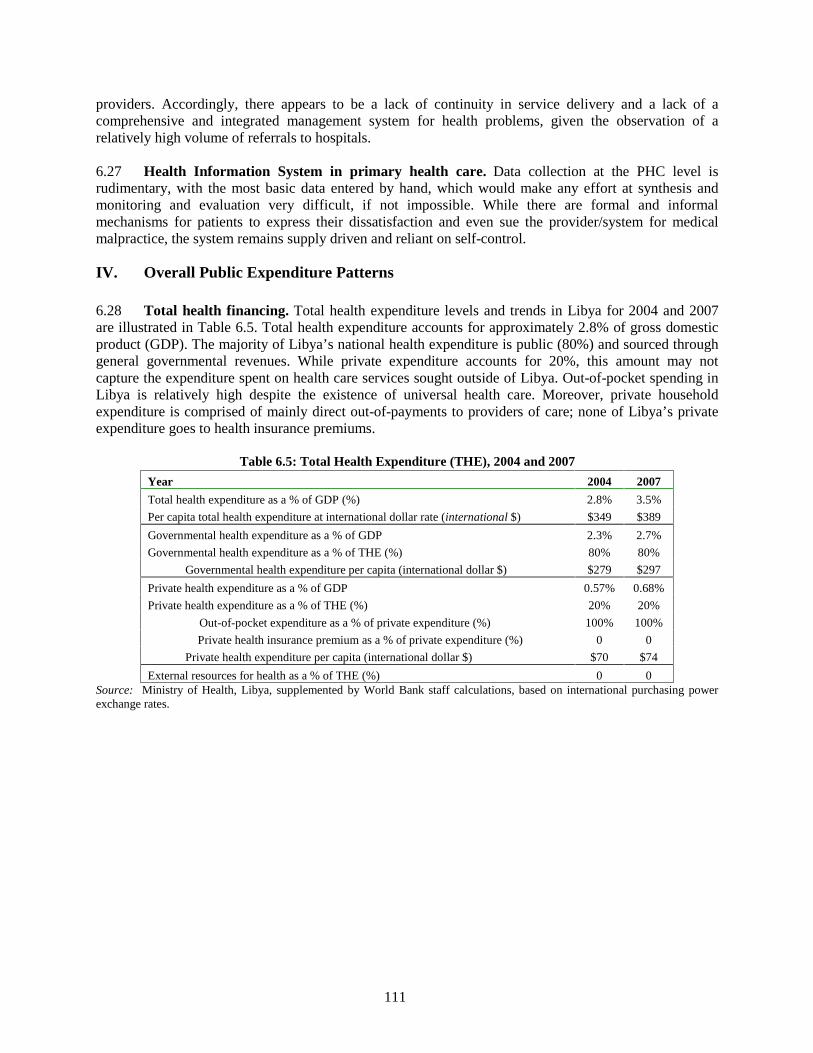
111
providers. Accordingly, there appears to be a lack of continuity in service delivery and a lack of a comprehensive and integrated management system for health problems, given the observation of a relatively high volume of referrals to hospitals. 6.27 Health Information System in primary health care. Data collection at the PHC level is rudimentary, with the most basic data entered by hand, which would make any effort at synthesis and monitoring and evaluation very difficult, if not impossible. While there are formal and informal mechanisms for patients to express their dissatisfaction and even sue the provider/system for medical malpractice, the system remains supply driven and reliant on self-control.
IV. Overall Public Expenditure Patterns 6.28 Total health financing. Total health expenditure levels and trends in Libya for 2004 and 2007 are illustrated in Table 6.5. Total health expenditure accounts for approximately 2.8% of gross domestic product (GDP). The majority of Libya’s national health expenditure is public (80%) and sourced through general governmental revenues. While private expenditure accounts for 20%, this amount may not capture the expenditure spent on health care services sought outside of Libya. Out-of-pocket spending in Libya is relatively high despite the existence of universal health care. Moreover, private household expenditure is comprised of mainly direct out-of-payments to providers of care; none of Libya’s private expenditure goes to health insurance premiums.
Table 6.5: Total Health Expenditure (THE), 2004 and 2007
Year 2004 2007
Total health expenditure as a % of GDP (%) 2.8% 3.5%
Per capita total health expenditure at international dollar rate (international $) $349 $389
Governmental health expenditure as a % of GDP 2.3% 2.7%
Governmental health expenditure as a % of THE (%) 80% 80%
Governmental health expenditure per capita (international dollar $) $279 $297
Private health expenditure as a % of GDP 0.57% 0.68%
Private health expenditure as a % of THE (%) 20% 20%
Out-of-pocket expenditure as a % of private expenditure (%) 100% 100%
Private health insurance premium as a % of private expenditure (%) 0 0
Private health expenditure per capita (international dollar $) $70 $74
External resources for health as a % of THE (%) 0 0Source: Ministry of Health, Libya, supplemented by World Bank staff calculations, based on international purchasing power exchange rates.

112
6.29 In comparison to other countries at a similar level of development, total health expenditure in Libya as a percent of GDP is relatively low. Figure 6.4 shows a global comparison of total health expenditure by country income per capita. While other middle-income countries spend approximately 6-7% of GDP on health in total, Libya spends approximately 2.8%, which is nearly one-third the average amount spent amongst middle-income countries. However, this expenditure may not include total health expenditures including private expenditures. For example, private expenditures on health care abroad, including health service and incidental costs such as transportation, may be under-estimated in current estimates.
Table 6.6: Governmental Expenditure on Health (in LYD), 2000-2006
Year Units 2000 2001 2002 2003 2004 2005 2006 Gross domestic product
billion, current LYD
17,775 17,621 28,257 34,041 43,730 59,746 73,344
Total governmental expenditure
billion, current LYD
4,240 5,276 8,389 6,068 7,719 11,986 15,177
Total governmental health expenditure
million, current LYD
510 586 949 1,046 992 960 1,147
Recurrent expenditure
million, current LYD
402 450 552 720 743 781 873
Investment expenditure
107 136 397 326 249 179 274
International dollar conversion Purchasing power parity international exchange rate (1)
LYD per international
dollar
0.379 0.408 0.548 0.579 0.694 0.868 0.959
Total governmental health expenditure
million, PPP (3)
1,345 1,436 1,732 1,806 1,429 1,106 1,196
Total governmental health expenditure (GHE) per capita Population million 4,762 4,849 4,937 5,027 5,120 5,213 5,324 GHE per capita (2) current LYD 107 121 192 208 194 184 215
PPP 282 296 351 359 279 212 225 GHE = Government health expenditure. TGE = Total government expenditure. Source: Ministry of Health, Libya, except: (1) World Economic Outlook Database, October 2008, International Monetary Fund. (2) Staff calculations. 6.30 Governmental health expenditures. As shown in Table 6.6 and 6.7, overall governmental fiscal capacity in Libya is relatively high, with total governmental expenditure amounting to 20 percent of GDP in 2006. General government expenditure on health is currently 7.6 percent of total government expenditures, based on 2006 figures. Governmental health expenditure as a proportion of GDP is approximately 1.6% of GDP and has been declining since 2001 at an average annual change of nearly -9%, as shown in Table 6.8. By contrast, governmental health expenditure as a proportion of GDP has been steadily increasing over the same period in other countries in MENA, Latin America and the European Union.
Figure 6.4: Global Trend Analysis of Total Health Expenditure, 2004
Source: World Bank staff’s estimates.

113
Table 6.7: Governmental Expenditure on Health in Libya as a percent of GDP, 2000–2006
Year 2000 2001 2002 2003 2004 2005 2006 TGE as a % of GDP (%) 23.9 29.9 29.7 17.8 17.7 20.1 20.7 GHE as a % of GDP (%) 2.9 3.3 3.4 3.1 2.3 1.6 1.6 GHE as a % of TGE (%) 12.0 11.1 11.3 17.2 12.8 8.0 7.6 Source: Ministry of Health, Libya. GHE = governmental health expenditure. TGE = total governmental expenditure. GDP = gross domestic product.
Table 6.8: Global Trends in Public Expenditure on Health, 2001-2005
Country/Region Governmental expenditure on health (GHE) as % of GDP, 2005
% Change in GHE 2001-2005
Average annual % change
Libya 1.6% -42.6% -8.8% MENA 3.1% +16.8% +4.4% Latin America 3.2% +66.8% +17.7% EURO Area 7.4% +7.42% +2.05% Source: Ministry of Health, Libya. Other countries: World Bank Development Indicators, 2009. GHE = governmental health expenditure. GDP = gross domestic product 6.31 The amount of government health expenditures in Libya is relatively low by international standards. Government health expenditures in other middle-income countries are nearly double the amount spent in Libya, as shown in Figure 6.5.
Figure 6.5. Health Expenditures in Libya, 2004
0
2
4
6
8
10Total exp for health as % of GDP
Gov exp on health as % of total expon health
Private exp on health as % of totalexp on health
Gen gov exp on health as % of totalgov exp
Per capita total exp on health atPPP
Per capita public exp on health atPPP
Libya Comparators
Note: Comparators include Algeria, Egypt, Iran, Jordan, Morocco, Syria, and Tunisia. Units for per capita total/public expenditure on health are 100. Units for government expenditure on health and private expenditure on health as percentage of total expenditure on health are 10. Source: World Health Organization, World Health Report 2007; International Monetary Fund, World Economic Outlook Database, April 2007.
6.32 The availability of information at the time of writing regarding the distribution of total health expenditure by functional and economic classification was limited. However, important trends are to be found in Table 6.9, which shows that in relative terms personnel expenditure has decreased since 2000, from nearly 50 percent of governmental health expenditure (GHE) to 36 percent in 2005. Conversely, expenditure on drugs and medical equipment has increased from 14 percent to 27 percent over the same period. It is has been estimated that 40 percent of all public health expenditure in 2005 was devoted to primary health care (Russo 2005), which would appear to be relatively healthy spending. More information is needed on the distribution of health expenditure by economic and functional

114
classifications, and on trends in the prices of medical goods in Libya, to further elucidate emerging patterns.
Table 6.9. Libya: Governmental Health Expenditure, Drugs and Medical Goods, 2000–05
Economic classification
Unit 2000 2001 2002 2003 2004 2005 2006 2007 % Change, 2007
compared to 2000
Recurrent Expenditure
Personnel million LYD 248 274 290 309 324 350 421 549 n/a
Other expenses 155 176 262 411 419 431 452 622
Total recurrent 402 450 552 719 743 781 873 1,171
Capital Expenditure 107 136 397 326 249 179 274 485Pharmaceuticals and medical goods 75 75 161 250 250 260 n/a
Total governmental health expenditure 510 586 949 1,046 992 960 1,147 1,656 n/a
International dollar conversion
Purchasing power parity international exchange rate
national currency per dollar 0.379 0.408 0.548 0.579 0.694 0.868 0.959 1.064 n/a
Recurrent Expenditure
Personnel million PPP $ 654 672 529 533 467 403 439 516 -21.1%
Other expenses 408 431 478 709 603 497 471 585 43.3%
Total recurrent 1,062 1,103 1,007 1,243 1,070 900 910 1,101 3.7%
Capital Expenditure 283 333 725 563 359 206 286 456 60.8%Pharmaceuticals and medical goods 198 184 294 432 360 300 - - 51.4%
Total governmental health expenditure 1,345 1,436 1,732 1,806 1,429 1,106 1,196 1,556 15.7%
Expenditure by economic classification as a percent of total GHE
Personnel % of GHE 48.6% 46.8% 30.6% 29.5% 32.7% 36.4% 36.7% 33.2% n/aPharmaceuticals and medical goods % of GHE 14.7% 12.8% 17.0% 23.9% 25.2% 27.1% - - n/a
Sources: (1) Ministry of Health, Libya. (2) World Economic Outlook Database, October 2008, International Monetary Fund. (3) Staff calculations. Pharmaceutical/medical goods expenditure not available for 2006-2007. 6.33 Regional governmental health expenditure. The distribution of health care resources and outcomes across geography represents an important facet of Libya’s commitment to ensuring universal access and coverage. Libya’s highly decentralized administrative system is made up of 22 municipalities, or shaabiats, with each shaabia further divided into small Basic People’s Congresses. Information on per capita government expenditure on health and outcomes by region was not available for a comprehensive subnational analysis. However, information on the distribution of health care resources may serve as a proxy for public investment, as highlighted below.
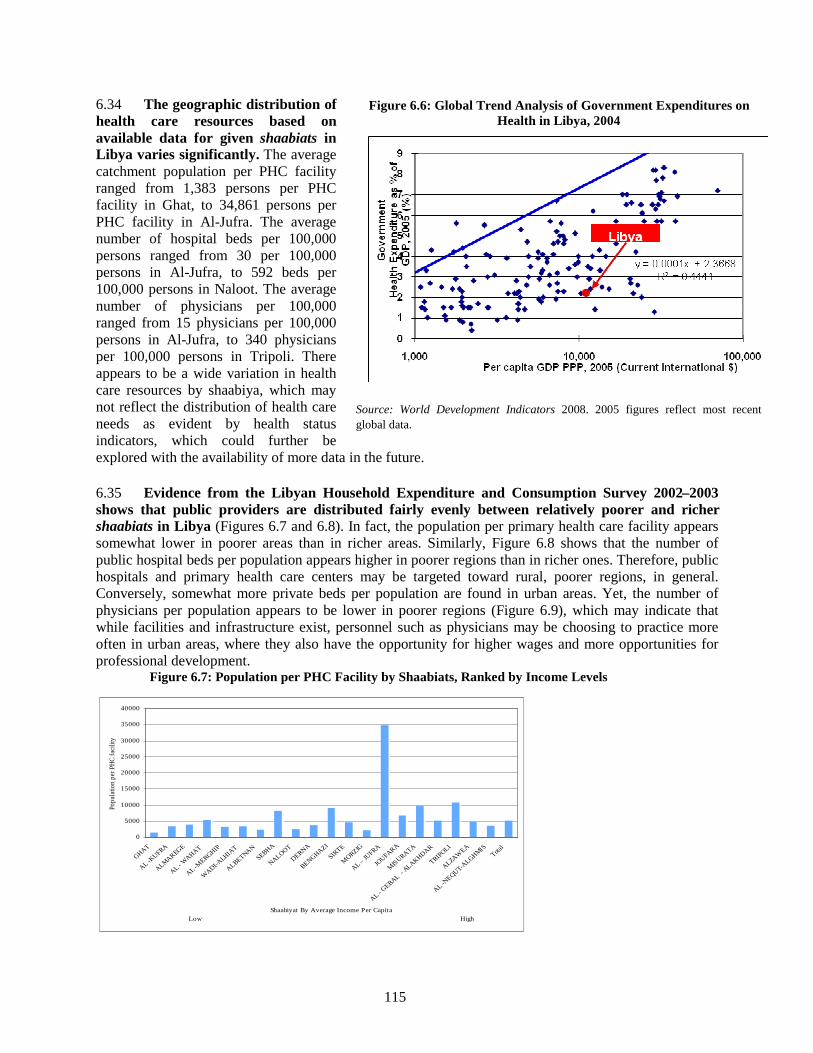
115
6.34 The geographic distribution of health care resources based on available data for given shaabiats in Libya varies significantly. The average catchment population per PHC facility ranged from 1,383 persons per PHC facility in Ghat, to 34,861 persons per PHC facility in Al-Jufra. The average number of hospital beds per 100,000 persons ranged from 30 per 100,000 persons in Al-Jufra, to 592 beds per 100,000 persons in Naloot. The average number of physicians per 100,000 ranged from 15 physicians per 100,000 persons in Al-Jufra, to 340 physicians per 100,000 persons in Tripoli. There appears to be a wide variation in health care resources by shaabiya, which may not reflect the distribution of health care needs as evident by health status indicators, which could further be explored with the availability of more data in the future. 6.35 Evidence from the Libyan Household Expenditure and Consumption Survey 2002–2003 shows that public providers are distributed fairly evenly between relatively poorer and richer shaabiats in Libya (Figures 6.7 and 6.8). In fact, the population per primary health care facility appears somewhat lower in poorer areas than in richer areas. Similarly, Figure 6.8 shows that the number of public hospital beds per population appears higher in poorer regions than in richer ones. Therefore, public hospitals and primary health care centers may be targeted toward rural, poorer regions, in general. Conversely, somewhat more private beds per population are found in urban areas. Yet, the number of physicians per population appears to be lower in poorer regions (Figure 6.9), which may indicate that while facilities and infrastructure exist, personnel such as physicians may be choosing to practice more often in urban areas, where they also have the opportunity for higher wages and more opportunities for professional development. Figure 6.7: Population per PHC Facility by Shaabiats, Ranked by Income Levels
0
5000
10000
15000
20000
25000
30000
35000
40000
GHAT
AL -KUFR
A
ALMAREGE
AL - WAHAT
AL -MERGHIP
WADI-A
LHIA
T
ALBETNAN
SEBHA
NALOOT
DERNA
BENGHAZI
SIRTE
MORZIG
AL – JUFRA
JOUFARA
MIS
URATA
AL - GEBAL- ALAKHDAR
TRIPOLI
ALZAWEA
AL -NEQUT-A
LGHMISTota
l
Shaabiyat By Average Income Per CapitaLow High
Popu
latio
npe
rPH
Cfa
cilit
yFigure 6.6: Global Trend Analysis of Government Expenditures on
Health in Libya, 2004
Source: World Development Indicators 2008. 2005 figures reflect most recent global data.

116
Figure 6.8: Distribution of Public and Private Hospital Beds by Shaabiats, Ranked by
Income Levels
0
100
200
300
400
500
600
700
GHAT
AL -KUFRA
ALMAREGE
AL - WAHAT
AL -MERGHIP
WADI-ALHIA
T
ALBETNANSEBHA
NALOOT
DERNA
BENGHAZI
SIRTE
MORZIG
AL – JUFRA
JOUFARA
MISURATA
AL - GEBAL- ALAKHDAR
TRIPOLI
ALZAWEA
AL -NEQUT-A
LGHMISTota
l
Shaabiyat by Average Income Per CapitaLow High
No.o
fhos
pital
beds
per1
00,0
00
No. of Public Beds per 100,000 No. of Private beds per 100,000
Source: For both Figures 6.7-6.8: Number of providers, Ministry of Health 2007; provider-to-population ratios, author’s calculations; income per capita calculations by shaabia, author’s calculations, Libya HHS 2002–2003.
Figure 6.9: Distribution of Physicians by Shaabiats, Ranked by Income Levels, 2002–03
0
50
100
150
200
250
300
350
400
GHAT
AL -KUFRA
ALMAREGE
AL - WAHAT
AL -MERGHIP
WADI-ALHIA
T
ALBETNANSEBHA
NALOOT
DERNA
BENGHAZI
SIRTE
MORZIG
AL – JUFRA
JOUFARA
MISURATA
AL - GEBAL- ALAKHDAR
TRIPOLI
ALZAWEA
AL -NEQUT-A
LGHMISTota
l
Shaabiyat By Average Income Per Capita Low High
No.o
fphy
sician
sper
100,0
00
Source: Number of providers, Ministry of Health 2007; provider-to-population ratios, author’s calculations; income per capita calculations by shaabia, author’s calculations, Libya HHS 2002–2003.
6.36 As discussed earlier, the hospital bed occupancy rate is relatively low in Libya, which suggests that despite the presence of public facilities in both rural and urban regions, the use of services lags behind. Indeed, empirical evidence from the 2002–2003 Libyan Household Survey64 suggests that 60 percent of households live near a health care facility that they tend to use, suggesting that the remaining 40 percent either live too far from a health care facility, or choose not to use nearby facilities. This could be due to a number of factors such as health need, preferences, or ability to pay. As a proxy for health need, the prevalence of chronic illnesses, defined as a chronic health condition or a long-term disability, was assessed across shaabiats as shown in Figure 6.10, also shown in table form in the Statistical Appendix (see Volume III). As indicated, the prevalence of chronic illnesses, defined as a disability or a chronic health condition (that is, heart disease, diabetes, and so forth) appears relatively evenly distributed across regions, although slightly higher in the poorest and wealthiest regions. These
64 Libya Household Survey 2002–03 background available from: Libya Household Survey 2002–2003 Questionnaire; Libya Household Survey 2002–2003 Guide to Respondents;
Libya Household Survey 2002–2003 Questionnaire Index.

117
data are based on self-reported health status, which may not accurately capture the existence of chronic conditions or medical need. 6.37 Nonetheless, having addressed how medical need is distributed across shaabiats, the use of services across shaabiats was then explored to evaluate the relationship between the two. This is shown in Figure 6.11, while the Statistical Appendix shows the distribution mapped by shaabiats names. Results suggest that the use of public services tends to be somewhat higher in middle-income regions.Coupled with information discussed in previous sections regarding poor quality of care, it is possible that the poorest shaabiats may have the worst quality of care, while households in the wealthiest regions use private services or travel abroad for health care.
Figure 6.10: Prevalence of Chronic Illness, by Average Expenditure Per Shaabia, 2002–03
y = -7E-12x 4 + 4E-08x 3 - 9E-05x 2 + 0.0759x - 14.385
R 2 = 0.1037
0.01.02.0
3.04.05.06.0
7.08.0
9.010.0
0 500 1000 1500 2000 2500 3000Average Expenditure Per Capita Per Shaabiya (LYD)
Figure 6.11: Use of Public Services, by Average Expenditure Per Shaabia, 2002–03
y = -4E-05x 2 + 0.1422x - 68.26R 2 = 0.2121
0.010.020.0
30.040.050.0
60.070.080.0
90.0100.0
0 500 1000 1500 2000 2500 3000Average Expenditure Per Capita Per Shaabiya (LYD)
Source: Author’s calculations for Figure 6.10-6.11, Libya HHS 2002–2003.
V. Searching for Quality: The Efficiency of the Health Sector
6.38 Given the available data, a review of the public expenditure on health in Libya has identified several important concluding issues. These issues fall under two broad categories: (a) allocative efficiency, and (b) technical efficiency. The reasons for the challenges faced by the Libyan health sector are addressed and largely relate to issues of organization and performance incentives. 6.39 Allocative efficiency appears to be very low. While the data limitations make it difficult to make an objective judgment on allocative efficiency, the fact that there is very little information on the burden of disease and risk factors and on their distribution by age, gender, location, and wealth or poverty quintiles suggests that the allocation of financial resources is made with a lack of consideration to real
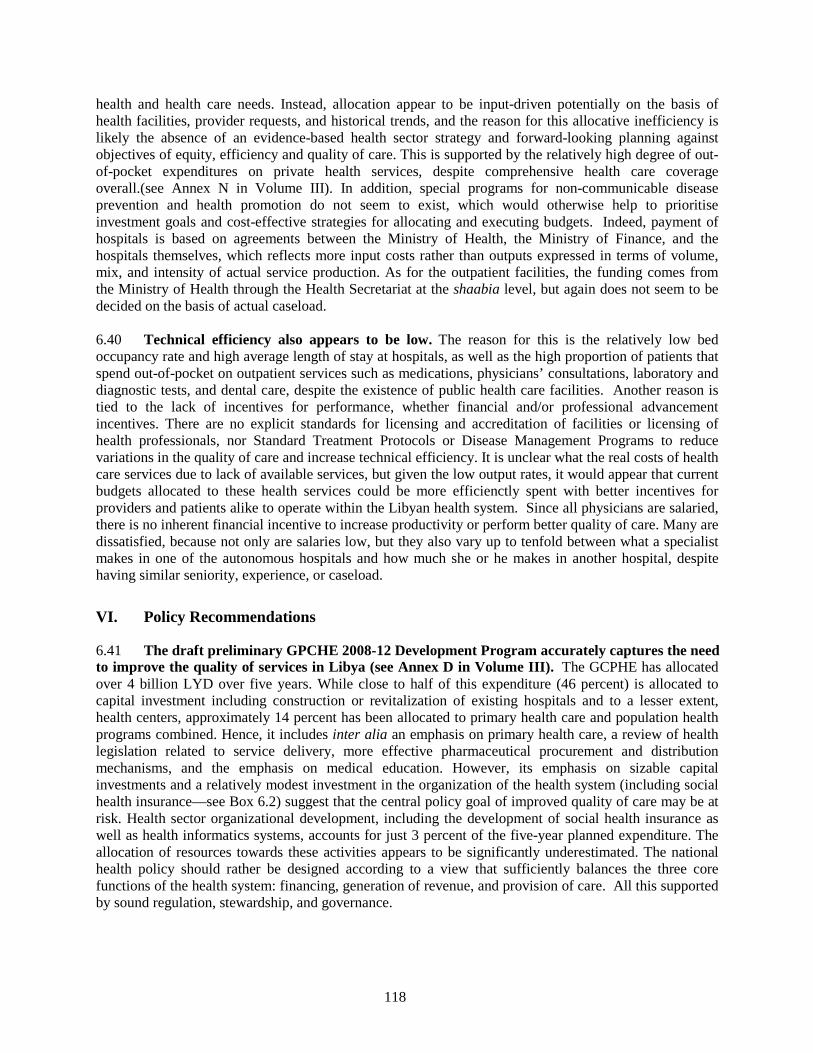
118
health and health care needs. Instead, allocation appear to be input-driven potentially on the basis of health facilities, provider requests, and historical trends, and the reason for this allocative inefficiency is likely the absence of an evidence-based health sector strategy and forward-looking planning against objectives of equity, efficiency and quality of care. This is supported by the relatively high degree of out-of-pocket expenditures on private health services, despite comprehensive health care coverage overall.(see Annex N in Volume III). In addition, special programs for non-communicable disease prevention and health promotion do not seem to exist, which would otherwise help to prioritise investment goals and cost-effective strategies for allocating and executing budgets. Indeed, payment of hospitals is based on agreements between the Ministry of Health, the Ministry of Finance, and the hospitals themselves, which reflects more input costs rather than outputs expressed in terms of volume, mix, and intensity of actual service production. As for the outpatient facilities, the funding comes from the Ministry of Health through the Health Secretariat at the shaabia level, but again does not seem to be decided on the basis of actual caseload. 6.40 Technical efficiency also appears to be low. The reason for this is the relatively low bed occupancy rate and high average length of stay at hospitals, as well as the high proportion of patients that spend out-of-pocket on outpatient services such as medications, physicians’ consultations, laboratory and diagnostic tests, and dental care, despite the existence of public health care facilities. Another reason is tied to the lack of incentives for performance, whether financial and/or professional advancement incentives. There are no explicit standards for licensing and accreditation of facilities or licensing of health professionals, nor Standard Treatment Protocols or Disease Management Programs to reduce variations in the quality of care and increase technical efficiency. It is unclear what the real costs of health care services due to lack of available services, but given the low output rates, it would appear that current budgets allocated to these health services could be more efficienctly spent with better incentives for providers and patients alike to operate within the Libyan health system. Since all physicians are salaried, there is no inherent financial incentive to increase productivity or perform better quality of care. Many are dissatisfied, because not only are salaries low, but they also vary up to tenfold between what a specialist makes in one of the autonomous hospitals and how much she or he makes in another hospital, despite having similar seniority, experience, or caseload.
VI. Policy Recommendations
6.41 The draft preliminary GPCHE 2008-12 Development Program accurately captures the need to improve the quality of services in Libya (see Annex D in Volume III). The GCPHE has allocated over 4 billion LYD over five years. While close to half of this expenditure (46 percent) is allocated to capital investment including construction or revitalization of existing hospitals and to a lesser extent, health centers, approximately 14 percent has been allocated to primary health care and population health programs combined. Hence, it includes inter alia an emphasis on primary health care, a review of health legislation related to service delivery, more effective pharmaceutical procurement and distribution mechanisms, and the emphasis on medical education. However, its emphasis on sizable capital investments and a relatively modest investment in the organization of the health system (including social health insurance—see Box 6.2) suggest that the central policy goal of improved quality of care may be at risk. Health sector organizational development, including the development of social health insurance as well as health informatics systems, accounts for just 3 percent of the five-year planned expenditure. The allocation of resources towards these activities appears to be significantly underestimated. The national health policy should rather be designed according to a view that sufficiently balances the three core functions of the health system: financing, generation of revenue, and provision of care. All this supported by sound regulation, stewardship, and governance.

119
6.42 The recommendations that follow address the issues identified, and areas that have not been explicitly addressed in the Development Programme. The proposed technical assistance between the World Bank and the Government of Libya will prioritise the development of an action plan as an output that serves as a mnual on each individually agreed policy action jointly selected. This is the next sage and will be pursued on a sector basis directly with the General People’s Committee for Health and Environment. These are subject to further discussions with the Libyan government. 6.43 In the short term, that is, one to two years:
• There is a critical need for building a National Health Management Information System. While the establishment of the system may take time and could possibly not be completed in the short term, the necessary policy decisions need to be made and resources allocated to that effect as soon as possible in order to support the quality-oriented goals and strategies highlighted in the Development Programme.
• There also is a need to establish a Health Policy and Strategy Unitin the Ministry of Health with strong policymaking, policy analysis, and monitoring and evaluation capabilities.
• Four sectoral studiesneed to be commissioned and carried out in order to obtain better insight into how the system performs. These include: o An assessment of real costs and quality of care for a select number of episodes of care in
hospitals. o A user satisfaction survey. o A provider behavioral survey (including their attitudes for piloting some performance-based
payment schemes). o A Public expenditure tracking survey.
6.44 In the medium term, that is, one to three years:
• A review of medical school training should be concluded, including admission criteria and alignment of entries with long-term physician needs, along with the introduction of licensing and accreditation criteria applicable to both the private and public sector.
• Libya should invest in the development of Standard Treatment Protocols and Disease Management Programs for the most prevalent and/or costly inpatient and outpatient medical conditions.
• In addition, it will be important to review the existing budgeting and payment models with a view to moving toward output-based payment, and a consideration of the pros and cons of nominal user charges to curtail unnecessary use of services while promoting necessary services.
• The preparation of an updated list of essential drugs and/or positive and negative drug listsbased on cost-effectiveness will enable a more rational use of medications.
6.45 In the longer term, that is, three to five years: While it is difficult to set an agenda of recommendations for the longer term, given the lack of explicit vision for the sector, the following could be considered, together with a review of the role of the state in the health sector:
• Introduction of Family Medicine for Primary Health Care; • Gate-keeping and a rational patient referral system across the four levels of health care; • A review of the mapping of the health facilities in line with the demographic and epidemiologic
transition and household health and nutrition surveys. 6.46 Increasing incentives for efficiency and quality of health outcomes by introducing measures that separate the state as a purchaser of services from provision of care, by establishing a separate health fund or agency coupled with performance-based strategic purchasing of services. This would entail allowing

120
greater autonomy to public, semi-public, and private providers by introducing output-based payment for health services

121
Box 6.2 From Tax-Based Systems to Social Health Insurance in Libya Many countries face the challenge of the financial sustainability of social protection. The debate continues between proponents of tax-financed health systems and social health insurance (SHI) models. There does not exist a ‘one-size-fits-all’ model. The advantages and disadvantages of each model should be examined within the context of the political economy of a country. The primary rationale for the development of the SHI scheme includes improving the financial sustainability within the existing system, by shifting some of the financial risk to employers and channeling household out-of-pocket payments back into the system through formal user charges. The lessons from other countries shed light on the effectiveness of SHI at meeting policy objectives within the Libyan context.
Historically, health systems have moved along a spectrum of alternative financing schemes, including fully tax-based national health services (such as the case of the UK and Libya); federal, social-health insurance schemes (such as the case of Germany and to an extent, Tunisia); compulsory, private health insurance schemes (such as case of Switzerland); and voluntary private health insurance schemes with parallel-operating free, public schemes for targeted groups (such as the case of the United States). Each scheme reflects different policy objectives and values, be it equity of access or choice.
The advantages and disadvantages of SHI have recently come under greater scrutiny. For instance, three of the oldest SHI schemes—France, the Netherlands, and Germany—have decreased their reliance on SHI revenues in favor of general revenue, largely owing to problems with cost escalation and low quality of care due to relatively poor regulation of SHI-financed providers (Wagstaff et al, 2007). At the same time, numerous developing countries have recently adopted SHI schemes with mixed results. Based on panel data from 1990-2004, evidence from 28 Central and Eastern European and Central Asian (ECA) countries adopting SHI—including the Czech republic (since 1993), Estonia (1992), Hungary (1990), Russian Federation (1993) and Turkey (pre-1990)—suggests that the adoption of SHI did not necessarily meet policy objectives such as improved quality of care and efficiency. This finding holds despite no matter which way funds are generated (payroll taxes versus general revenues) and the micro-organization of how providers are paid. Examples of tax-based countries included in the analysis are Poland, Ukraine, Latvia and Armenia. SHI was also found to have increased national health spending by 15 percent on average and hospital activity rates by 2-4 percent, although it did not improve health outcomes (Wagstaff and Moreno-Serra, 2007). In addition, private expenditures increased through hospital-payment mechanisms, with fee-for-service associated with 34 percent of higher private spending.
Experience in neighboring MENA countries sheds similar light on the performance of SHI. In Tunisia, 70 percent of the population is covered by social health insurance schemes operated centrally, with the remainder covered by public assistance; yet the government continues to face the challenge of improving the quality and efficiency of health services (World Bank, 2006d). In Algeria, while over 90 percent of the population are covered by social health insurance with a generous benefits package, financial sustainability and efficiency have been identified as key concerns (e.g. there is a low bed occupancy rate of 42 percent) (World Bank, 2002). In Egypt, while SHI adopted in 1964 improved access to and quality of health services amongst those employed in the formal sector, family members are not entitled to services unless they are eligible for other SHI schemes such as enrolled students’ schemes (Yip and Berman, 2001).
Considering the shift from general revenues to social health insurance financing, the government of Libya is best advised to consider a staged approach. This implies insuring appropriate demand- and supply-side policy instruments are in place to incentivize the intended activities, including stewardship and governance. Advantages of SHI include the possibility of generating more revenue and introducing competition between providers and pay-for-performance incentives, i.e. quasi-market features such as those adopted in the United Kingdom’s National Health Service. Disadvantages of SHI include perverse incentives and moral hazard owing to unregulated or retrospective provider payment mechanisms. This may marginally improve, or at worst, deteriorate health services, increase spending, and exacerbate health inequities. Other quasi-market options that the Libyan government should consider includes introducing incentives for higher quality of care, such as pay-for-performance and performance-based strategic purchasing (Preker et al, 2007). Source: World Bank staff elaboration.
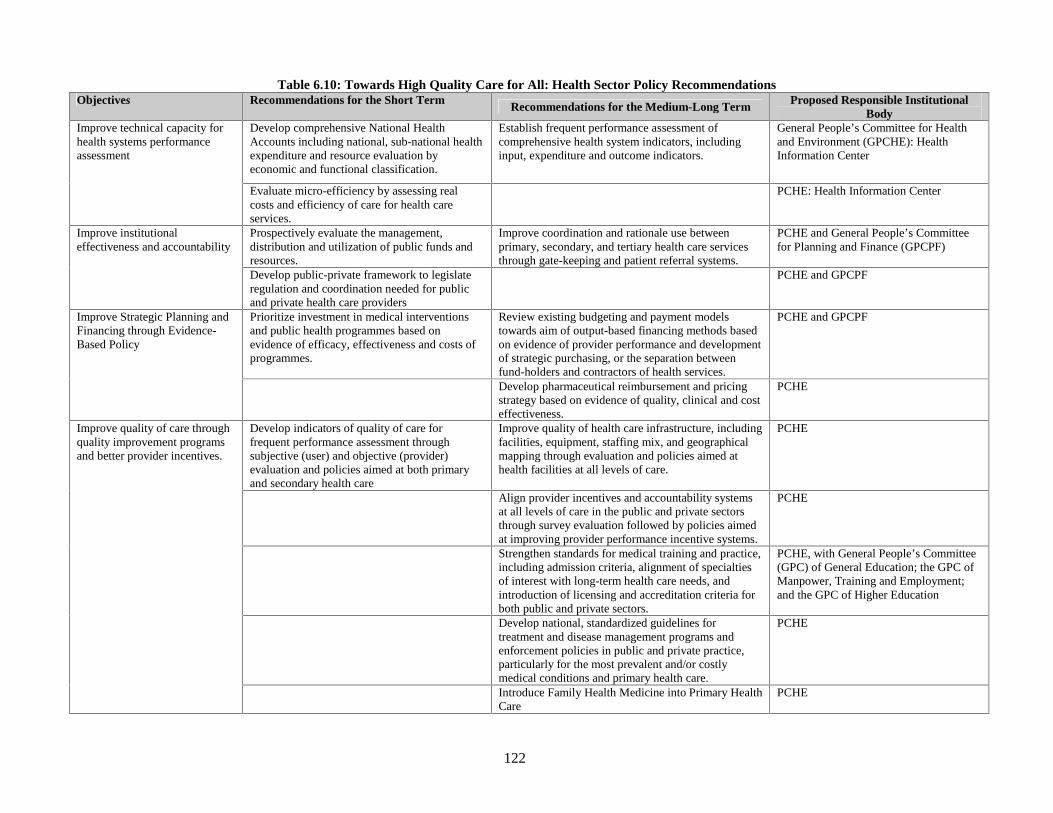
122
Table 6.10: Towards High Quality Care for All: Health Sector Policy RecommendationsObjectives Recommendations for the Short Term Recommendations for the Medium-Long Term Proposed Responsible Institutional
BodyDevelop comprehensiveNational HealthAccounts including national, sub-national healthexpenditureand resourceevaluation byeconomic and functional classification.
Establish frequent performanceassessment ofcomprehensivehealth system indicators, includinginput, expenditureand outcome indicators.
General People’s Committee for Healthand Environment (GPCHE): HealthInformation Center
Improve technical capacity forhealth systems performanceassessment
Evaluate micro-efficiency by assessing realcosts and efficiency of care for health careservices.
PCHE: Health Information Center
Prospectively evaluate the management,distribution and utilization of public funds andresources.
Improve coordination and rationale use betweenprimary, secondary, and tertiary health care servicesthrough gate-keeping and patient referral systems.
PCHE and General People’s Committeefor Planning and Finance (GPCPF)
Improve institutionaleffectiveness and accountability
Develop public-private framework to legislateregulation and coordination needed for publicand private health care providers
PCHE and GPCPF
Prioritize investment in medical interventionsand public health programmes based onevidence of efficacy, effectiveness and costs ofprogrammes.
Review existing budgeting and payment modelstowards aim of output-based financing methods basedon evidence of provider performance and developmentof strategic purchasing, or the separation betweenfund-holders and contractors of health services.
PCHE and GPCPFImprove Strategic Planning andFinancing through Evidence-Based Policy
Develop pharmaceutical reimbursement and pricingstrategy based on evidence of quality, clinical and costeffectiveness.
PCHE
Develop indicators of quality of care forfrequent performance assessment throughsubjective (user) and objective (provider)evaluation and policies aimed at both primaryand secondary health care
Improve quality of health care infrastructure, includingfacilities, equipment, staffing mix, and geographicalmapping through evaluation and policies aimed athealth facilities at all levels of care.
PCHE
Align provider incentives and accountability systemsat all levels of care in the public and private sectorsthrough survey evaluation followed by policies aimedat improving provider performance incentive systems.
PCHE
Strengthen standards for medical training and practice,including admission criteria, alignment of specialtiesof interest with long-term health care needs, andintroduction of licensing and accreditation criteria forboth public and private sectors.
PCHE, with General People’s Committee(GPC) of General Education; the GPC ofManpower, Training and Employment;and the GPC of Higher Education
Develop national, standardized guidelines fortreatment and disease management programs andenforcement policies in public and private practice,particularly for the most prevalent and/or costlymedical conditions and primary health care.
PCHE
Improve quality of care throughquality improvement programsand better provider incentives.
Introduce Family Health Medicine into Primary HealthCare
PCHE

Chapter 7. Increasing the Efficiency of the Power Sector in Libya
In Libya, the organization of the power sector is a good reflection of the distributive nature of the state. Households and businesses receive energy at affordable highly subsidized costs and the state also guarantees that reliable electricity is provided. Given strong present and future economic growth, the Libyan power sector faces a daunting challenge in its efforts to secure and satisfy future power needs while, at the same time, ensuring its financial sustainability. Technical and commercial losses are very high. Given inappropriate maintenance of its power plants, the reserve margin in generation has deteriorated significantly and calls for urgent remedial action. The sector institutional and regulatory framework needs to be modernized to clarify the roles and attributes among the different players and promote the development of a culture of accountability and efficiency, especially in GECOL management. Finally, the most important challenge faced by electricity tariff reform in Libya is to reduce or minimize the “inclusion errors” of richer households that can afford higher tariffs. At present, most consumers – poor and not poor – benefit from subsidized electricity consumption.
I. Introduction 7.1 During the present decade, Libya has witnessed strong economic growth associated with strong demand for electric energy. Peak load grew at 7 percent per year during 2001–07. While this growth of electricity demand was primarily driven by residential and commercial consumers, industrial consumption has also intensified and is expected to grow further in the future with the completion of new industrial and resort projects initiated recently by the government. The Government of Libya, however, faces other pressing needs in social and infrastructure sectors that it must address. To sustain its current and future growth prospects, the government recognizes the need to improve the performance of its power sector while accelerating investment in the sector. This section describes the electricity market. 7.2 Libya currently has an electric power production capacity of about 5000 Megawatts (MW). Most of Libya’s existing power plants are oil fired, though several were recently converted to natural gas. Libya’s electricity demand, however, is growing rapidly (around 7 percent annually), and is expected to reach 7.3 gigawatts (GW) in 2010 and 15 GW in 2020. 7.3 During the 2004 summer, Libya was hit by widespread blackouts, because power plants could not keep up with demand. To prevent such blackouts in the future and to meet surging power consumption, Libya decided to build a large number of new combined cycle and steam cycle power plants. A decision was also made to rehabilitate existing plants and upgrade and expand the transmission and distribution networks. Interconnections with Egypt from the East and Tunisia from the West will also improve network stability and will enable electric power exchanges with neighboring countries. These ambitious plans, however, are hampered by the slow pace with which new projects are currently being implemented. For example, only 720 MW were added to the network capacity during 2000–06, and no significant renewable energy projects were realized during this period. On the transmission side, the slow implementation of the 400-KV upgrade program affects network stability and losses, and limits the interconnection capacity with neighboring countries.

124
7.4 Demand. Although Libya is a large country with a relatively small population, access to electricity in Libya is high. The annual growth in electricity demand has fluctuated from a high of 11.6 percent in 2001 to a low of 3.8 percent in 2006. On average, electricity demand in Libya has grown at 7.4 percent per year over the past eight years. Fluctuations are due to the different pace of mega project implementation, and to changes in the economy and policies. Table 7.1 shows demand characteristics (maximum capacity demand [MW], energy consumption [GWh], and consumption per capita [kWh]) and rate of change of each of these variables during 2000–07. 7.5 Growth of electricity demand is mainly driven by strong residential consumption, economic growth, and the mega projects announced by the government. The population annual growth rate dropped in 2006 from 2.86 percent to 1.83 percent, whereas the maximum growth in peak demand has dropped in the last five years from around 8.4 percent to 3.8 percent. This indicates that a significant part of the need for additional electricity capacity stemming from the lifting of United Nations sanctions has slowed. However, an increase in electricity demand growth should be expected in the future as the economy continues to grow with the development of the private sector. 7.6 While increased demand for electricity often correlates with a fast-growing economy, it might also stem from lack of energy-efficient production and consumption patterns. This is the case especially if the electricity tariffs are extremely low, as they are in Libya. Figure 7.1 shows Libya’s electricity energy consumption (GWh) and its maximum demand (MW) over the last eight years, 2000–07. It can be seen that both curves are steadily increasing with similar trends and growth rates.
Figure 7.1: Electricity Consumption and Maximum Demand, 2000–07
0
5000
10000
15000
20000
25000
1998 2000 2002 2004 2006 2008
year
Con
sum
ptio
n(G
WH
)
0
1000
2000
3000
4000
5000
Max
imum
dem
and
(MW
)
Consumption (GWh)Max Demand (MW)
Source: Bank staff estimates based on Libyan data.
7.7 Technical and commercial losses are high, and so are losses from street lightening. Figure 7.2 shows the distribution of electricity consumption per sector during 2000 and 2006. The residential sector consumes about a third, large and small agriculture around 10 percent, and light and heavy industry another 10 percent, and iron and steel consume 11 and 14 percent, respectively. One of the highest-consuming sectors is street lightening: it consumes almost 10 percent of the total energy distributed! This is well above international standards and requires appropriate measures. The sector also features a high
Table 7.1: Electricity Demand, 2000–07
Year Max Demand (MW)
Percent Change
(%)
GWh Consum
ed
Percent Change
(%)
Consumption Per Capita
kWh*
Percent Change
(%) 2000 2630 12330 2001 2934 11.6 12983 5.2 2438 2002 3081 5.0 14292 10.0 2797 14.7 2003 3341 8.4 15527 8.6 2953 5.6 2004 3612 8.1 16614 7.8 3039 3.5 2005 3857 6.8 18893 13.7 3256 7.14 2006 4005 3.8 20546 8.8 3696 13.5 2007 4420 10.4 23961 11.8 3966 7.3 * Estimated. Source: GECOL.

125
level of technical and commercial losses. Targeted programs toward the reduction of both commercial and technical losses should be considered, and implemented and monitored for results.
Figure 7.2: Energy Consumption by Sector, 2000 and 2006
2000
2006
Source: GECOL
7.8 Libya’s consumption of electricity is high compared to its Middle East and North Africa region neighbors, and to Organization for Economic Co-operation and Development (OECD) countries. Figure 7.3 displays the consumption per capita of electricity in Libya as of 2006.65 It shows low efficiency and poor utilization of electric energy. This low efficiency is due to two main reasons: low tariff on electric energy and low efficiency of household equipment.
65 This should not be compared to industrial countries since consumption is high in the residential sector.
Figure 7.3: Per Capita Energy Consumption in Libya Compared to OECD and MENA Countries
0
2000
4000
6000
8000
10000
12000
14000
USA
France
Spain Italy
Greece
Libya
Lebanon
Iran
Turkey
Jord
anEgyp
t
Tunisia
Algeria
Morroco
Con
supt
ion
perc
apita
(kW
h)
Source: Bank staff’s estimates.
Residential33%
Smallagriculture
6%
Large agriculture
6%
GMMR 0%
Small Industry3%
Large Industry17%
Iron and steel0%
Commercial12%
General utilities14%
Street lighting9%
Residential30%
Small agriculture8%
Large agriculture2%
GMMR 2%
Small Industry4%
Large Industry7%
Iron and steel15%
Commercial9%
General utilities14%
Street lighting9%

126
7.9 Supply. Electricity generation in Libya is summarized in Table 7.2, which shows the maximum power capacity in MW and the energy consumption generated during the year. Most of Libya’s electricity is generated by thermal power plants using heavy fuel (26 percent); light fuel (41 percent), and natural gas (33 percent). The total nameplate capacity of power plants reached 5,457 MW in 2006 and comes from 11 main power plants (see Statistical Appendix A.5.8). Power plants in Libya are either steam cycle (24 units, 1932 MW) or gas (27 units, 3525 MW). Two of these power plants (Benghazi North and Zawia ) changed to combined cycle to reduce the MWH cost with a total nameplate capacity ( 2320 MW ). Figure 7.4 shows how the generation capacity was developed over the past 20 years. The power generation plans suffered from interruption of investments during which the total megawatt capacity was not expanded. During the past 20 years, these interruptions caused no addition of generation capacity during 1985–93, 1995–98, and 2000–04. During these periods, no power plant capacity was added to the system. As a result, the available generation capacity reserve dropped (the percentage of additional capacity available between generation and maximum demand), yet, it is still in the safe range of 15 to 25 percent. In addition, rehabilitation of existing plants was poor, thus operating at lower capacities and further reducing available megawatts.
7.10 The transmission network in Libya is based mainly on 220-KV power lines, which are currently being gradually upgraded to 400 KV. The transmission and distribution network components are summarized in Appendix Tables A.5.3 and A.5.4. Interconnection with neighboring countries is an important aspect of the Libyan electricity network. The network is interconnected with Egypt and with Tunisia through 220-KV lines, though power exchanges between these countries remain limited.66 Plans to upgrade the interconnection to Egypt with a 400-KV line are underway. This interconnection also puts Libya in a good position to export electricity to other countries and to Europe, capitalizing on the rich resources of conventional and renewable fuel.
66 Libya sent 91 GWh to Egypt and received 122.5 GWh in 2006.
Figure 7.4: Generation Capacity, Number of Generating Units, and Reserve Capacity
0
1000
2000
3000
4000
5000
6000
1980 1985 1990 1995 2000 2005 2010
MW
0
10
20
30
40
50
60Units
Generation capacityMax demandNumber of units
reserve
Source: Bank staff’s estimates.
Table 7.2: Electricity Supply Characteristics, 2000–07
Year Generation Capacity
(MW)
Percent Change
(%)
GWh Generated
Percent Change
(%) 2000 4716 15496
2001 4610 -2.25 16111 3.97
2002 4708 2.13 17531 8.81
2003 4708 0.00 18942 8.05
2004 4642 -1.40 20202 6.65
2005 5125 10.40 22450 11.13
2006 5438 6.11 23993 6.87
2007 25514 6.33 Source: GECOL.

127
II. The Performance of the Power Sector 7.11 Electricity tariffs in Libya are low compared to most countries in the region. Figure 7.5 compares a weighted average index of residential electricity tariffs among several MENA countries for 2006. It appears that Libya has the lowest residential tariff, although it has the highest GDP per capita (US$11,630) among the highlighted countries. While maintaining low residential consumption tariffs has social merits, it has a harmful effect on the efficient use of electricity by households. The low level of residential electricity tariff reflects the distributive approach that characterizes the functioning of the state in Libya. Not only does the government subsidize generation through low fuel energy prices, but it also provides the capital investment and covers GECOL’s operating deficits resulting from below-cost end-user tariffs. 7.12 Electricity tariffs changed several times in recent decades. Residential tariffs were reformed substantially in 1981, 1998, 2004, and 2006. The 2004 tariff reform was probably the most important one, though it did not last long. As shown in Table 7.3, the 2004 reform introduced an inclining block tariff structure to promote efficient use of electricity. Its objective was to make electricity consumption more costly to those households consuming more energy. As a result, electricity bills of middle- and high-income households went up and led to widespread complaints from government civil servants, whose salaries had been frozen since 198167.. 7.13 In 2006, another tariff reform was implemented by the government, which substantially changed the electricity tariff structure for residential consumers. The number of tariff bands was reduced from six to three, with the social tariff band increased from 500 kWh to 1,000 kWh (See Appendix Table A 5.7). As a result of this new tariff structure, most residential customers now fall under the first tariff band. In fact, 92.2 percent of the residential customers fell into the first tariff band in 2007 compared to 3.6 percent in the second tariff band and 4.2 percent in the third tariff band. Clearly, the current tariff structure is globally nonselective and does not enable appropriate targeting of the power consumption subsidies. This change made it difficult to encourage efficient use of electricity, because it made electricity a cheap source of energy compared to alternative sources. A committee68 formed by Decree No. 15 of 2007 by the GPC for Planning estimated the fiscal cost of the 2006 tariff reform at approximately LD238 million, of which 68 percent was due to below-cost tariffs for residential consumers.
67 As a result of repeated complaints from consumers through the Basic People’s congresses after the implementation of Decree No 76 of 2004 increasing electricity tariffs, a joint committee was formed to consider ways to address these complaints. Consequently, the General People’s Committee issued its decree No 247 of 2006 amending Decree No 76 of 2004. 68 Memorandum of activities of the Committee formed by Decree No. 15 of 1997 of the GPC Secretary.
Figure 7.5: Residential Tariff for Libya Compared to other Countries in the Region
0123456789
10
Lebanon USA Jordan Tunisia SaudiArabia
Syria Egypt Libya
Reg
iona
lTar
iff(U
SC
/kW
h)20
07
Source: Bank staff’s estimates.
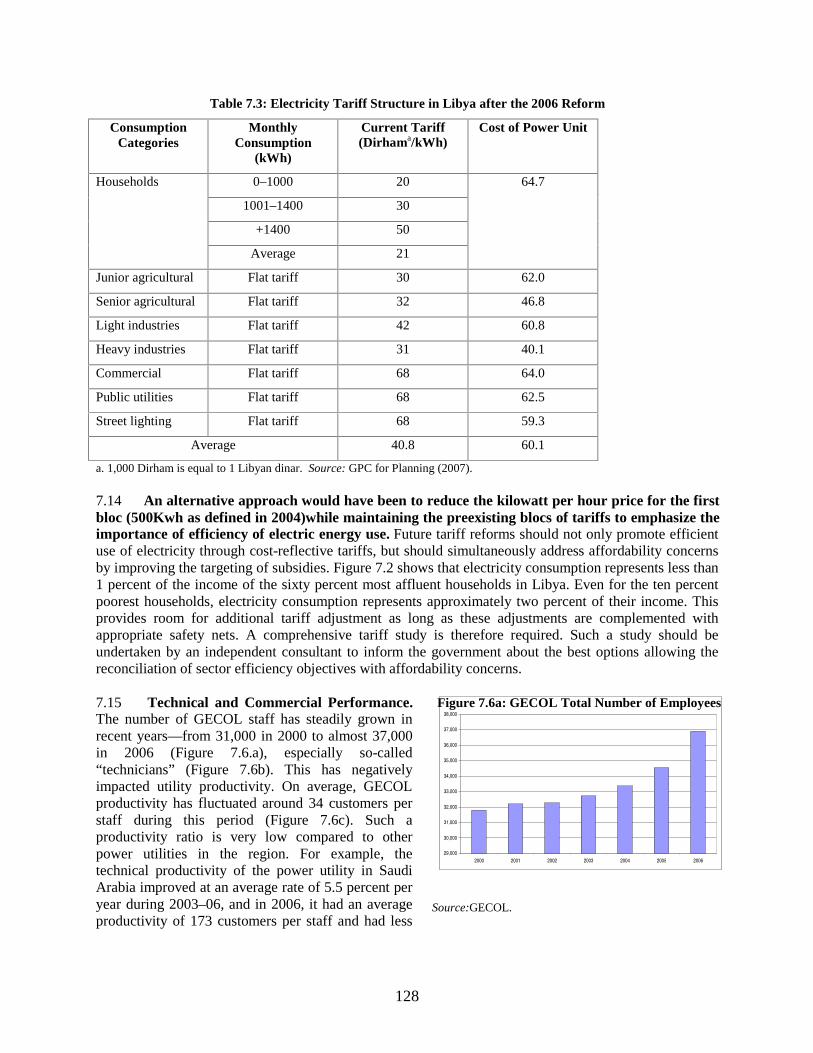
128
Table 7.3: Electricity Tariff Structure in Libya after the 2006 Reform
Consumption Categories
Monthly Consumption
(kWh)
Current Tariff (Dirhama/kWh)
Cost of Power Unit
0–1000 20
1001–1400 30
+1400 50
Households
Average 21
64.7
Junior agricultural Flat tariff 30 62.0
Senior agricultural Flat tariff 32 46.8
Light industries Flat tariff 42 60.8
Heavy industries Flat tariff 31 40.1
Commercial Flat tariff 68 64.0
Public utilities Flat tariff 68 62.5
Street lighting Flat tariff 68 59.3
Average 40.8 60.1
a. 1,000 Dirham is equal to 1 Libyan dinar. Source: GPC for Planning (2007). 7.14 An alternative approach would have been to reduce the kilowatt per hour price for the first bloc (500Kwh as defined in 2004)while maintaining the preexisting blocs of tariffs to emphasize the importance of efficiency of electric energy use. Future tariff reforms should not only promote efficient use of electricity through cost-reflective tariffs, but should simultaneously address affordability concerns by improving the targeting of subsidies. Figure 7.2 shows that electricity consumption represents less than 1 percent of the income of the sixty percent most affluent households in Libya. Even for the ten percent poorest households, electricity consumption represents approximately two percent of their income. This provides room for additional tariff adjustment as long as these adjustments are complemented with appropriate safety nets. A comprehensive tariff study is therefore required. Such a study should be undertaken by an independent consultant to inform the government about the best options allowing the reconciliation of sector efficiency objectives with affordability concerns. 7.15 Technical and Commercial Performance. The number of GECOL staff has steadily grown in recent years—from 31,000 in 2000 to almost 37,000 in 2006 (Figure 7.6.a), especially so-called “technicians” (Figure 7.6b). This has negatively impacted utility productivity. On average, GECOL productivity has fluctuated around 34 customers per staff during this period (Figure 7.6c). Such a productivity ratio is very low compared to other power utilities in the region. For example, the technical productivity of the power utility in Saudi Arabia improved at an average rate of 5.5 percent per year during 2003–06, and in 2006, it had an average productivity of 173 customers per staff and had less
Figure 7.6a: GECOL Total Number of Employees
Source:GECOL.
29,000
30,000
31,000
32,000
33,000
34,000
35,000
36,000
37,000
38,000
2000 2001 2002 2003 2004 2005 2006
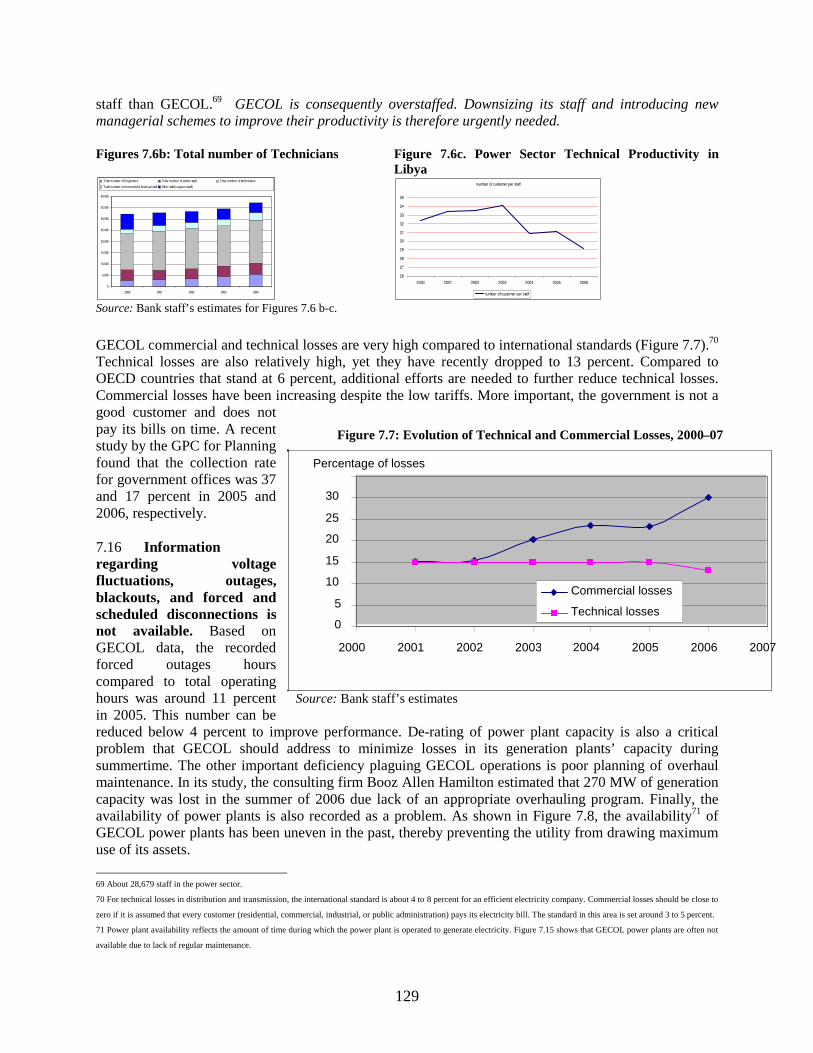
129
staff than GECOL.69 GECOL is consequently overstaffed. Downsizing its staff and introducing new managerial schemes to improve their productivity is therefore urgently needed. Figures 7.6b: Total number of Technicians Figure 7.6c. Power Sector Technical Productivity in
Libya
0
5,000
10,000
15,000
20,000
25,000
30,000
35,000
40,000
2000 2001 2002 2003 2004
Total number of Engineers Total number of admin staff Total number of technicians
Total number of economist & financial staff Other staff (support staff)number of customer per staff
26
27
28
29
30
31
32
33
34
35
2000 2001 2002 2003 2004 2005 2006
number of customer per staff
Source: Bank staff’s estimates for Figures 7.6 b-c.
GECOL commercial and technical losses are very high compared to international standards (Figure 7.7).70 Technical losses are also relatively high, yet they have recently dropped to 13 percent. Compared to OECD countries that stand at 6 percent, additional efforts are needed to further reduce technical losses. Commercial losses have been increasing despite the low tariffs. More important, the government is not a good customer and does not pay its bills on time. A recent study by the GPC for Planning found that the collection rate for government offices was 37 and 17 percent in 2005 and 2006, respectively.
7.16 Information regarding voltage fluctuations, outages, blackouts, and forced and scheduled disconnections is not available. Based on GECOL data, the recorded forced outages hours compared to total operating hours was around 11 percent in 2005. This number can be reduced below 4 percent to improve performance. De-rating of power plant capacity is also a critical problem that GECOL should address to minimize losses in its generation plants’ capacity during summertime. The other important deficiency plaguing GECOL operations is poor planning of overhaul maintenance. In its study, the consulting firm Booz Allen Hamilton estimated that 270 MW of generation capacity was lost in the summer of 2006 due lack of an appropriate overhauling program. Finally, the availability of power plants is also recorded as a problem. As shown in Figure 7.8, the availability71 of GECOL power plants has been uneven in the past, thereby preventing the utility from drawing maximum use of its assets.
69 About 28,679 staff in the power sector. 70 For technical losses in distribution and transmission, the international standard is about 4 to 8 percent for an efficient electricity company. Commercial losses should be close to
zero if it is assumed that every customer (residential, commercial, industrial, or public administration) pays its electricity bill. The standard in this area is set around 3 to 5 percent. 71 Power plant availability reflects the amount of time during which the power plant is operated to generate electricity. Figure 7.15 shows that GECOL power plants are often not
available due to lack of regular maintenance.
Figure 7.7: Evolution of Technical and Commercial Losses, 2000–07
Source: Bank staff’s estimates
0
5
10
15
20
25
30
2000 2001 2002 2003 2004 2005 2006 2007
Percentage of losses
Commercial losses
Technical losses

130
Figure 7.8: GECOL Power Plant Availability, 2005
9 6 %
9 2 %
9 0 %
8 8 %
8 8 %
8 3 %
7 1 %
7 0 %
4 4 %
2 2 %
0 % 2 0 % 4 0 % 6 0 % 8 0 % 1 0 0 %
K h o m s S T
T r ip o l i s o u t h
Z a w iy a
B e n g a z i N o r t h
K h o m s
M is u r a t h a
T r ip o l i w e s t
Z w i t e n a
D e r n a
T u b r e k
Source: Booz Allen Hamilton 2006.
7.17 Financial Performance. This report does not intend to make a full review of the financial performance of GECOL, but it has based its partial review on the findings of a task force established in 2007 by the GPC for Planning to review GECOL performance. Table A.5.10 in Statistical Appendix shows GECOL financial results for fiscal years 2004 and 2005 as discussed by the GPC taskforce. It shows that GECOL losses increased from LD181 million in 2004 to LD216 million in 2005 despite the tariff reform of 2004. GECOL’s deficit has worsened, reaching LD238 million at the closing of the 2006 fiscal year. In relative terms, GECOL’s deficits have represented 0.45 percent, 0.4 percent, and 0.37 percent of the country’s GDP in 2004, 2005, and 2006, respectively. These growing deficits can be explained by at least three factors including below-cost end-users tariffs, recent increases in the prices of fuel oil supplies, and company internal deficiencies. 7.18 According to article 7 of Law 17, GECOL should receive appropriate compensation from the government for end-user tariffs being set below cost. In practice, this compensation mechanism does not seem to work effectively. To avoid the cascade effect resulting from this situation, it is advisable to make these subsidies explicit by integrating them into the government recurrent budget. This reform will be relatively easy to implement considering that the government fixes end-user tariffs after reviewing GECOL’s proposed unit costs. The government could, therefore, include budgetary appropriations to cover the difference between actual costs and tariff levels. But GECOL also needs to significantly improve its productive efficiency, as discussed earlier. 7.19 In summary, the power sector model established in Libya is relatively unique. The government redistributes oil fiscal proceeds by generously providing a capital subsidy to the sector so it can expand or modernize its productive assets. Downstream, the government fixes below-cost tariffs for electricity consumption and is required by law to compensate the utility for any resulting revenue gaps. In between, fuel oil and natural gas are provided to GECOL at prices set below their international comparators. Although similar institutional settings exist in other oil-producing countries, in Libya there has been no tangible attempt to improve the power utility efficiency or make it more accountable. In other countries, governments rely on performance-based contracts with the utility. In some countries,72
governments have established a dedicated “state-owned asset holding company” through which they channel capital investment to the sector. The asset holding company will then finance the utility assets and be compensated up to a certain proportion from the tariffs collected from end users by the service
72 In Egypt, national holding companies have been established in the electricity and water sectors to channel and coordinate investment programs to the sectors. Regional
distribution companies, affiliates of the holding companies, are in charge of service provision to end users. So far, although there are no performance-based contracts between the
affiliates and their mother companies, the institutional setting clearly delineates responsibilities among the different entities.

131
provider. The utility or service provider will be held accountable through a performance-based contract signed with the asset holding company. An urgent challenge for the sector is to significantly improve its productive efficiency, which can only materialize if all interested parties are held more accountable for their actions. It is crucial to design an incentive-based scheme that links to, or conditions the transfer of capital budget on, the achievement of a set of pre-agreed performance targets.
III. The Institutional Framework and Its Accountability 7.20 The organization of the Libyan power sector is a good reflection of the distributive nature of the state in Libya.73 In Libya, the state guarantees that reliable electricity is provided to households and businesses at affordable prices. To make sure this objective is achieved, the state has consistently intervened throughout its production chain. For instance, the state ensures that enough budgetary appropriations are made to cover the power sector investment needs for the network expansion and modernization. Likewise, the Libyan government established a publicly owned company, the General Electricity Company of Libya (GECOL), in 1983 to operate the country power grid network and deliver electricity services to consumers. Downstream, the state decides GECOL tariffs and makes sure to keep them affordable to consumers, while it has to compensate the utility for operating deficits resulting from end-user tariffs set below costs. Finally, the state ensures that GECOL is supplied with fuel oil or natural gas by the National Oil Company at prices set below their international comparators. The electricity production value chain is, consequently, fully controlled by the state, which can also use it for redistributive purpose. Not surprisingly, these interventions lead to inefficient allocation of resources in the industry and, consequently, to poor performance. 7.21 The General People’s Committee’s decision No. 121, enacted on March 8, 2007, organizes the electricity, water, and gas sector in Libya. The General People’s Committee (GPC) for (Ministry of) Electricity, Water and Gas (MWEG) elaborates and implements the government policy in the sector. MWEG prepares the sector strategy and development plan, but shares important policy responsibilities with other government institutions (see Figure 7.1). Decree No. 121 of 2007 spells out the attributes of the GPC for water, electricity, and gas (MWEG). Its organization chart includes the next departments: Quality and Control; Planning; Projects; Research and Development; Training and Human Resources; Monitoring; Administrative and Financial Affairs; Legal Affairs Bureau; and Technical Cooperation. 7.22 To date, MWEG organization does not clearly define which of its departments prepares and formulates sector policy. In contrast, regulatory functions are concentrated in the quality control department, which, according to article 8 of Decree No. 121 of March 8, 2007, is in charge of: (a) the preparation and enforcement of legislation and regulations, (b) issuing permits, (c) setting and monitoring the performance of the service providers, (d) verifying the compliance with service quality standards, and (e) reviewing electricity tariffs and handling complaints submitted by consumers. 7.23 The General People’s Committee for Finance (GPCF) exercises the financial oversight over the sector’s recurrent budget. According to Law No. 112 of February 1993, the GPC for Finance shall cover any GECOL operating deficit resulting from below-cost end-user tariffs decided by the government as a matter of it social policy.74 This assumes, although not clearly stated in the legislation, that GECOL does its best to minimize its production costs (productive efficiency). The GPC for Planning (GPCP) exercises financial oversight over the sector capital budget, including its preparation and implementation.
73 According to Vandewalle (1998), “distributive states are those that do not depend on extraction of its citizen but derive their income almost exclusively from the sale of a
commodity. Most states need to perform their functions. What matters is how the government gets its money, from whom it takes it, and which compromises it must make in return
for the revenues it extracts…” (p. 18). 74 “…. the government should cover GECOL’s operational deficit resulting from low electricity tariffs (connection charges, subscription charges, and consumption tariffs).”

132
GPCP coordinates the preparation of the capital budget and ensures overall consistency of the capital budget allocation across sectors. 7.24 The National Oil Company (NOC) supplies the energy fuel (light fuel oil, heavy fuel oil, natural gas, and so forth) to GECOL at administered prices decided by the government. These prices are substantially below international market prices. In theory, it is assumed that the GECOL and NOC operating deficits resulting from the government-administered prices will be ultimately covered by the government75. In practice, this compensation scheme does not seem to be working effectively. Government transfers to GECOL and fuel cost payments from GECOL to NOC are often delayed. Even if all payments were timely, this arrangement is not conducive to cost minimization and efficiency improvement. 7.25 The role of the Housing Infrastructure Board (HIB) has often been overlooked by previous studies (BAH 2006; CERA 2005). Whereas HIB plays an important role in the expansion of the electricity distribution network, it is in charge of urban development planning and shares responsibility with GECOL for the expansion of electricity distribution networks to new urban settlements. HIB plans and finances the development of a low-voltage distribution network, whereas GECOL is responsible for the medium-voltage distribution network76 and operates the entire distribution network. However, it is unclear whether these assets are incorporated into GECOL’s balance sheets (see Box 7.1). 7.26 The delivery of electricity services in Libya falls under the monopoly of GECOL. GECOL was established by Law No. 80 in 1983. This law was supplemented by Law No. 17 of 1984 and revised in 1993 by Decree No. 112. GECOL is established as a joint stock company with limited liability. Its shares are fully owned by the Government of Libya. In accordance with articles 4 and 5 of Decree No. 112, GECOL is a vertically integrated electricity utility that is in charge of generation, transport, and distribution of power electric services throughout Libya (Figure 7.1). GECOL has developed a strategic plan for the electricity sector (2007-2012) in 2005 with the support of the consulting firm Booz Allen Hamilton. This plan was subsequently endorsed by the newly established ministry of water, electricity and gas (MWEG) which also took over its implementation. This strategic plan has been presented to the general people committee for planning in 2007 and was endorsed. Figure 7.9 highlights the power sector organization as it stands today.
75 This is a more complex issue than stated here. In fact fuel price supplied by NOC can be set below international prices as long as the resulting selling prices are enough to cover
NOC Long term production costs. However, the management of energy fuel price, and the adjustment of GECOL tariffs calls for separate but intertwined analyses so clear
linkages can be highlighted. 76 Low voltage refers to electric distribution networks supplying services between 0.2 kilovolts (KV) to 11 KV; medium voltage refers to electric distribution networks supplying
services 11 KV to 66 KV.

133
Box 7.1. General Electricity Company of Libya (GECOL)
According to article 3 of Decree No. 112, GECOL was established for a period of 25 years. What might happen to the company at the expiration of its current legal term, which is expected to be in 2009? Article 3 implies that the government could enact another decree extending the company’s legal term for an additional 25 years, following a recommendation of the People’s Committee.
GECOL is a vertically integrated power utility that is in charge of generating, transporting, and distributing electric power services throughout Libya, but also plays an important role in policymaking and regulation. For instance, article 5 of Decree No. 112 states that GECOL can suggest policies and necessary rules for electricity and seawater desalination in Libya, and can draft electricity specifications and standards.
GECOL is managed in accordance with the provisions of Law No. 13 of 1990, which regulates the operations of People’s Committees for establishments and basic systems. Its governance structure combines a board of directors and a General People’s Committee (GPC), which serves as its executive management team. The secretary of the company’s People’s Committee is its chief executive officer, who runs the company on a daily basis (article 33).
In principle, GECOL is entitled to cost recovery tariffs. According to article 48 of resolution No. 80, GECOL shall provide its services in return for specific fees determined on the basis of a sound accounting costs system. This decree does not, however, provide specific guidance on how electricity tariffs are determined, and does not specify any requirement for GECOL’s efficiency. Nevertheless, the current regulatory framework does not provide clear rules or guidelines as regards end-user contributions to cost recovery through the tariffs they are subject to. Overall, the process under which electricity tariffs are decided strongly favors social and political considerations as opposed to economic efficiency. For instance, electricity tariffs are, in a first step, determined by the People’s Committee of GECOL, which then submits its recommendation to the company’s board of directors. When approved by the board of directors, tariffs are referred, for final review and approval, to the GPC for Power (the minister in charge of power). Finally, and in accordance with art. 35 of Decree 82 of 1993, GECOL has the authority to disconnect customers who do not pay their electricity bill, but this regulation has been loosely enforced. Source: GECOL.
Figure 7.9: Power Sector Structure and Organization in Libya
Sector Policy and Planning
EconomicRegulation
ElectricityGeneration
Transport
Distribution and Sale of
ElectricityServices
Consumers
National Oil
Company
Min. of Water, Electricity and Gas
GMMRResidentialCustomers
Min. of Planning
Min. of Finance
IndustriesStreets lightsFarms
Govt. Offices
General Electricity Company of Libya (GECOL)
Fuel Supply
Capital BudgetSupply
O&M Subsidy
Housing InfrastructureBoard (HIB)
Source: World Bank staff elaboration.

134
7.27 Prior to the government reorganization in January 2009 that has merged the Ministry of Water, Electricity and Gas (MWEG) into a new Infrastructure Ministry, MWEG has prepared a development strategy for electricity. This strategy aims at: (i) achieving a high level of efficiency and technical reliability of the electricity supply; (ii) shifting from electricity service delivery from a bureaucratic into a commercial culture; and (iii) a progressive liberalization of the electricity market. It is unclear, however, to which extent the new cabinet’s reorganization will affect the implementation of this strategy. 7.28 Figure 7.10 highlights the institutional changes contemplated then by the Government. These changes intend to align the Libyan power sector organization with international best practices. To improve efficiency, accountability, and ensure reliable supply of electricity in Libya, the government has come to the conclusion to deepen the power sector reform. The proposed reform entails the separation of policy making, service provision, and regulation functions. Therefore, the government intends to establish two regulatory entities (water; electricity and gas) under the tutelle of the Ministry in charge of infrastructure, but with financial and administrative autonomy. Furthermore, the government has decided to create a new set of operating entities, including: the electricity and water desalination holding company; the gas holding company; the water holding company; the nuclear power plants authority; the general authority for renewable energy; and the general water authority. The gas holding company will purchase gas from NOC and transport and distribute it to end users, including power generation plants.
Figure 7.10: Proposed Institutional Changes
7.29 The proposed reform agenda further clarifies the missions and the prerogatives of the ministry in charge of electricity. It is proposed that the role of the Ministry will primarily focus on the formulation of the sector policies, and in overseeing their implementation. The new organization also includes the establishment of a central planning authority for electricity, gas and water (Electricity, water and Gas projects authority), as well as it proposes the creation of an information and sector documentation center. Likewise, GECOL’s activities will be integrated within the Electricity and Water desalination holding company, with its generation, transmission, and distribution activities separated into independent affiliates. The government has opted for a vertical separation of GECOL activities. The new holding company for electricity and desalination will be in charge of the implementation of the sector development plan, and will coordinate the commercial activities of its three affiliates: (i) national company for electricity distribution; (ii) national company for electricity transmission, and (iii) national company for electricity generation.

135
Figure 7.11: MWEG Structure
Source: MWEG, 2008. 7.30 The national company of electricity generation will be responsible for the development and operation of generation plants, and will sell its electricity to the national company for electricity transmission. The reform also envisages the introduction of independent power producers (IPP), including through joint-ventures between national company for electricity generation and private operators. The national electricity distribution company will purchase electricity from the national company for electricity transmission. Although the draft reform package assumes the progressive shift to cost reflective wholesale tariffs, it is unclear to which extent retail tariffs will be adjusted to reflect the cost of electricity supply. This is an important area where additional clarifications are needed before the market structure model is finalized. Similarly, and assuming that commercial contracts will be signed between the generation and transmission companies on one side, and the transmission and the distribution companies on the other side, it is not clear what will be the role of the holding company for electricity and water desalination over these commercial transactions. 7.31 Within this context, establishing an autonomous regulator for electricity and gas is a positive development. But, regulating public owned utilities has proven to be very challenging across countries, including in developed countries. These challenges are likely to be amplified in Libya, considering the extensive government interventions in the electricity production chain. However, developing strong capacity on economic and technical regulation will be crucial in piloting the shift from administered electricity tariffs and in creating the enabling environment required to promote accountability and efficiency within the sector.

136
Figure 7.12: Proposed power sector structure
Consumers
Power Market Structure After the Reform
The Regulatory Authority for Electricity and Gas
(…) Stock Company for
Electricity Distribution
Electricity Distribution Company
(Companies)
General Company
for Electricity
Transmission
Electricity Production
Company
(Companies)
(…) Stock Company for
Electricity Production
(…) Stock Company for Renewable
Energy
ContractualRelation
ContractualRelation
ContractualRelation
Contractual Relation
Contractual Relation
Electricity Holding Company
Outsourcing of Supporting Services
Level of Service Agreements
ContractualRelation
(…) Stock Company for
Water Desalination
Contractual Relation
Source: MWEG, 2008.
IV. Overall Public Expenditure Patterns 7.32 The Sector Investment Program. It is widely recognized that investments in electricity supply are crucial for development, but ensuring its fiscal sustainability is often a challenging task in many developing countries. The sector, consequently, faces a major challenge in its efforts to secure and satisfy the economy’s current and future electric energy needs while, at the same time, ensuring its fiscal sustainability. The problem is compounded by the fact that in Libya and other countries where an effective planning process linking the resource mobilization to improving sector efficiency has not been developed, electricity supply and reliability is taken for granted. Annual statistics show a maximum demand of 3,857 MW in 2005, 4,005 MW in 2006, and 4,420 MW in 2007. Although this might not reflect all future activities, it can be taken as an indicator of the natural growth of electricity demand.77 This growth of demand should also be reflected in investment programs in transmission and distribution. During 2002–07, electricity development projects represented an estimated LD5493 million without taking into consideration the mega projects. This investment effort has allowed GECOL to keep pace with high demand growth stemming from rapid urbanization and economic growth. 7.33 Underinvestment in generation has resulted in the decline of the reserve margin as highlighted above. The Table shown in footnote 76 shows investment level in generation compared to transmission and distribution. Given the lack of maintenance or appropriate overhauling of old power plants, the generation capacity has grown relatively slowly. The preparation of the 2008–12 investment program should take into account generation expansion and power plant rehabilitation.
77 In Libya, self-generation is very limited and most of the unmet demand can be captured through outages or waiting list for connections.

137
7.34 The preliminary investment plan for 2008–12 highlights an increase of investment in generation capacity from 5,400 MW to 12,000 MW78 (see Table A.7.22 in the Statistical Annex) . While this increase is needed to cope with rapid demand development, it is an ambitious plan whose successful implementation is dependent on the ability of GECOL to overcome internal and external deficiencies. The previous plan has just achieved a 15.3 percent increase of the total available generation capacity, whereas the current plan aims at a 120 percent increase. It envisions adding an average of 1,450 MW generation capacity yearly during this period, whereas only an average of 100 MW per year were added during 2000–0679. This will not only require quick and well-designed contracts, but it will also need effective local mobilization within the company and its local suppliers. The energy market in general and the electricity market in particular, are packed with orders. The waiting or lead period for new plants is estimated between 2 and 2.5 years, while the project completion timeline is around 3 years. The cost of power plants has also gone up dramatically over the past two years; as shown in Table 7.4, the 2008–12 investment plan and objectives have been prepared based on indicative costs as of 2006–07. 7.35 Future demand and load forecast80. To identify the sector investment needs, projections of future demand for electricity have been prepared. The various scenarios and assumptions used are described below. Overall, it is assumed that future demand will largely be determined by economic growth and natural growth in consumption, mega projects, and changes expected in the pricing of electricity in Libya. For instance, a shift from nontransparent input-oriented subsidies to transparent output-based subsidies will enhance the role of cost-reflective pricing in controlling consumer behavior and consumption patterns. Moreover, it is important to expect that the effective implementation of demand-side management measures will also contain the growth of electricity demand. 7.36 Figure 7.13 plots the percentage change in maximum demand (MW) growth of electricity over the past seven years. A polynomial function was fitted to the curve to evaluate the average trend
78 The table below provides new figures on the investment plan as approved by the general people committee for planning in October 2008. The new figures cover the 2008-2012
period (Value is in million LD)
Production (Gen) Transmission and control Distribution
Contracted Projects (remaining commitment (% of total) 4583 (75.6%) 3802 (81.5 %) 4721 (80%)
Projects under study to be contracted 902 3929 2442
Projects to be financed by private investor and already contracted 2242
Total 7727 7731 7163
Grand total 22621 million LD
Source: MWEG, 2008.
This table differs from Table A5.21 above but it does not include investment projections for renewable energy even though the government intends to develop this area. It also
projects some investment in generation to be undertaken by the private sector. In the rest of the study, we rely on table 7.4 for which we have reviewed all the supportive elements. 79 The management of GECOL feels very confident about their ability to achieve this expansion target, claiming that they have already launched the construction of 1500 MW
additional generation capacity since 2008. 80 A comprehensive load forecasting exercise covering 2008-2025 has been prepared by MWEG in collaboration with the Korean consulting firm, KEPCO.
Figure 7.13: Percentage Change in Demand and Corresponding Trend
0.00%
2.00%
4.00%
6.00%8.00%
10.00%
12.00%
14.00%
2000 2002 2004 2006 2008 2010%ch
ang
ein
exp
ecte
dd
eman
dan
dtr
end
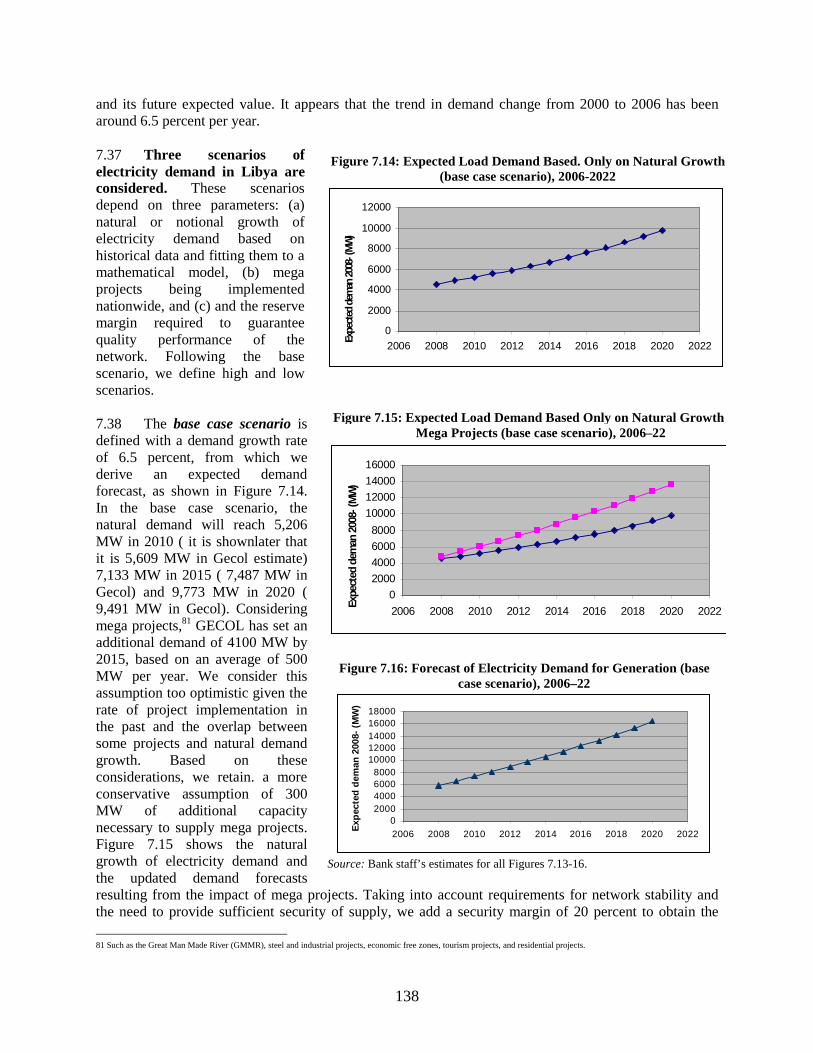
138
and its future expected value. It appears that the trend in demand change from 2000 to 2006 has been around 6.5 percent per year. 7.37 Three scenarios of electricity demand in Libya are considered. These scenarios depend on three parameters: (a) natural or notional growth of electricity demand based on historical data and fitting them to a mathematical model, (b) mega projects being implemented nationwide, and (c) and the reserve margin required to guarantee quality performance of the network. Following the base scenario, we define high and low scenarios. 7.38 The base case scenario is defined with a demand growth rate of 6.5 percent, from which we derive an expected demand forecast, as shown in Figure 7.14. In the base case scenario, the natural demand will reach 5,206 MW in 2010 ( it is shownlater that it is 5,609 MW in Gecol estimate) 7,133 MW in 2015 ( 7,487 MW in Gecol) and 9,773 MW in 2020 ( 9,491 MW in Gecol). Considering mega projects,81 GECOL has set an additional demand of 4100 MW by 2015, based on an average of 500 MW per year. We consider this assumption too optimistic given the rate of project implementation in the past and the overlap between some projects and natural demand growth. Based on these considerations, we retain. a more conservative assumption of 300 MW of additional capacity necessary to supply mega projects. Figure 7.15 shows the natural growth of electricity demand and the updated demand forecasts resulting from the impact of mega projects. Taking into account requirements for network stability and the need to provide sufficient security of supply, we add a security margin of 20 percent to obtain the
81 Such as the Great Man Made River (GMMR), steel and industrial projects, economic free zones, tourism projects, and residential projects.
Figure 7.14: Expected Load Demand Based. Only on Natural Growth (base case scenario), 2006-2022
0
2000
4000
6000
8000
10000
12000
2006 2008 2010 2012 2014 2016 2018 2020 2022Ex
pect
edde
man
2008
-(M
W)
Figure 7.15: Expected Load Demand Based Only on Natural Growth and Mega Projects (base case scenario), 2006–22
0
2000
4000
6000
8000
10000
12000
14000
16000
2006 2008 2010 2012 2014 2016 2018 2020 2022
Expe
cted
dem
an20
08-(
MW
)
Figure 7.16: Forecast of Electricity Demand for Generation (base case scenario), 2006–22
02000400060008000
1000012000140001600018000
2006 2008 2010 2012 2014 2016 2018 2020 2022
Exp
ecte
dd
eman
2008
-(M
W)
Source: Bank staff’s estimates for all Figures 7.13-16.

139
demand forecast displayed in Figure 7.16. This curve provides the base case scenario for projected demand for 2006–20. In this case generation capacity needs will reach 7320 MW ( 8,883 MW in Gecol) 11440 MW ( 15,678 MW in Gecol) and 16400 MW ( 22,003 MW in Gecol) in 2010,2015, and 2020 respectively. 7.39 The high case scenario reflects the demand assumptions made by the electricity company (GECOL). GECOL has based its forecast on higher assumptions of a natural electricity demand growth of 8 percent per year, to which is added the impact stemming from mega projects (on average, an additional 500 MW/year) and a 30 percent reserve margin to secure sufficient electricity supply security. As a result, a step increase in electricity demand is observed in 2010, given the significant impact of large industrial projects anticipated. Figure 7.17 illustrates how this scenario compares with other scenarios considered for this analysis. 7.40 The low case scenario takes into account the urgent need for Libya to implement a demand-side management (DSM) program and energy efficiency measures. It is assumed that tariff adjustments, implementation of time-of-use (TOU) tariffs, and policies to promote the adoption by end users of compact fluorescent lamps (CFLs), solar heaters, and other efficient electrical equipment will yield about 10 percent of capacity demand saving in eight years; mega project implementation will require only 150 MW per year, because they will not be implemented as fast as expected; and that reserve margins are at their low end of 15 percent. These assumptions will result in the low case scenario, which yields 5,800 MW, 7,500 MW, and 9,700 MW generation capacity for 2010, 2015, and 2020, respectively. Figure 7.17 compares the scenarios considered for this analysis. 7.41 Figure 7.18 shows the evolution of total energy consumed, including losses (commercial and technical) in the base case scenario. Actual consumption is significantly below generation. The average annual growth rate is 7 percent. It is assumed that tariff adjustments, implementation of TOU tariffs, and policy to promote the adoption by end users of CFLs, solar heaters, and other efficient electrical equipment will yield 10 to 20 percent of energy saving, hence reducing the demand by a minimum of 10 percent per year.
Figure 7.17: High, Low, and Base Case Scenarios for Demand Generation Capacity Forecast, 2006–22
0
4000
8000
12000
16000
20000
2006 2008 2010 2012 2014 2016 2018 2020 2022
Gen
erat
ion
cap
acit
yd
eman
dFo
rcas
t(M
W)
Base case scenarioHigh case scenarioLow case scenario
Source: Bank staff’s estimates.
Figure 7.18: Energy Consumption Forecast for the Base Case Scenario
0
10000
20000
30000
40000
50000
2000 2005 2010 2015 2020
Fore
cast
cons
umpt
ion
(GW
h)
Source: Bank staff’s estimates.
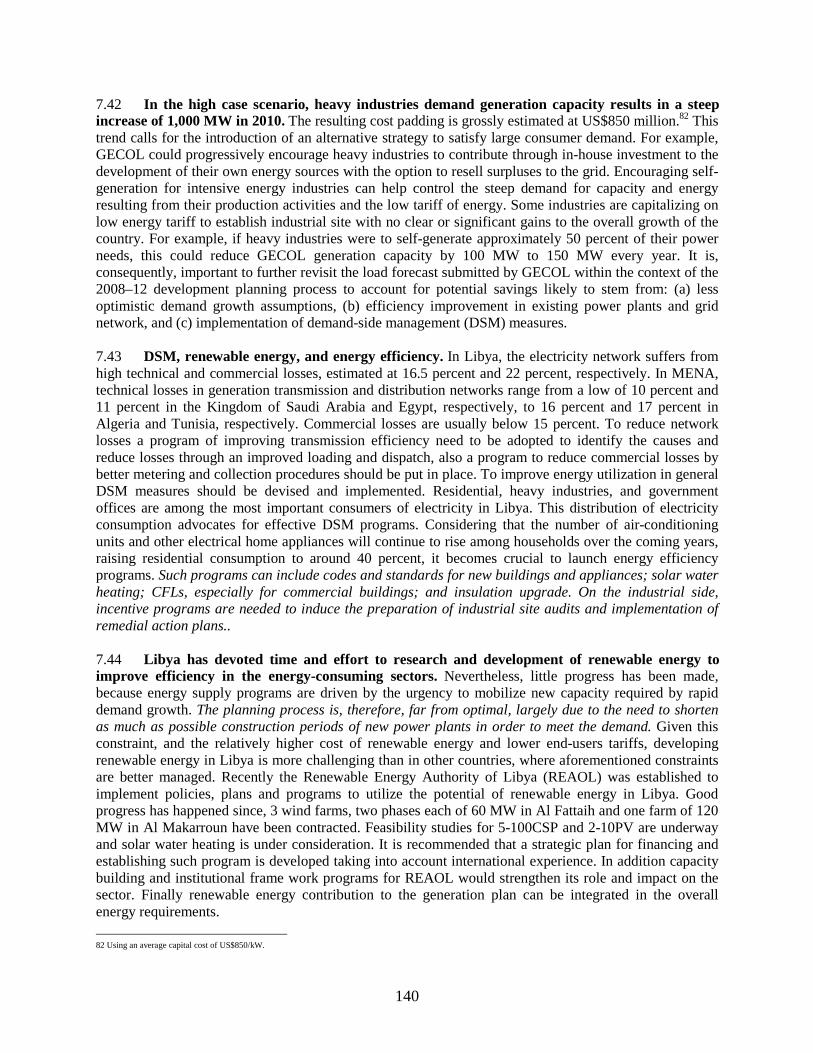
140
7.42 In the high case scenario, heavy industries demand generation capacity results in a steep increase of 1,000 MW in 2010. The resulting cost padding is grossly estimated at US$850 million.82 This trend calls for the introduction of an alternative strategy to satisfy large consumer demand. For example, GECOL could progressively encourage heavy industries to contribute through in-house investment to the development of their own energy sources with the option to resell surpluses to the grid. Encouraging self-generation for intensive energy industries can help control the steep demand for capacity and energy resulting from their production activities and the low tariff of energy. Some industries are capitalizing on low energy tariff to establish industrial site with no clear or significant gains to the overall growth of the country. For example, if heavy industries were to self-generate approximately 50 percent of their power needs, this could reduce GECOL generation capacity by 100 MW to 150 MW every year. It is, consequently, important to further revisit the load forecast submitted by GECOL within the context of the 2008–12 development planning process to account for potential savings likely to stem from: (a) less optimistic demand growth assumptions, (b) efficiency improvement in existing power plants and grid network, and (c) implementation of demand-side management (DSM) measures. 7.43 DSM, renewable energy, and energy efficiency. In Libya, the electricity network suffers from high technical and commercial losses, estimated at 16.5 percent and 22 percent, respectively. In MENA, technical losses in generation transmission and distribution networks range from a low of 10 percent and 11 percent in the Kingdom of Saudi Arabia and Egypt, respectively, to 16 percent and 17 percent in Algeria and Tunisia, respectively. Commercial losses are usually below 15 percent. To reduce network losses a program of improving transmission efficiency need to be adopted to identify the causes and reduce losses through an improved loading and dispatch, also a program to reduce commercial losses by better metering and collection procedures should be put in place. To improve energy utilization in general DSM measures should be devised and implemented. Residential, heavy industries, and government offices are among the most important consumers of electricity in Libya. This distribution of electricity consumption advocates for effective DSM programs. Considering that the number of air-conditioning units and other electrical home appliances will continue to rise among households over the coming years, raising residential consumption to around 40 percent, it becomes crucial to launch energy efficiency programs. Such programs can include codes and standards for new buildings and appliances; solar water heating; CFLs, especially for commercial buildings; and insulation upgrade. On the industrial side, incentive programs are needed to induce the preparation of industrial site audits and implementation of remedial action plans..
7.44 Libya has devoted time and effort to research and development of renewable energy to improve efficiency in the energy-consuming sectors. Nevertheless, little progress has been made, because energy supply programs are driven by the urgency to mobilize new capacity required by rapid demand growth. The planning process is, therefore, far from optimal, largely due to the need to shorten as much as possible construction periods of new power plants in order to meet the demand. Given this constraint, and the relatively higher cost of renewable energy and lower end-users tariffs, developing renewable energy in Libya is more challenging than in other countries, where aforementioned constraints are better managed. Recently the Renewable Energy Authority of Libya (REAOL) was established to implement policies, plans and programs to utilize the potential of renewable energy in Libya. Good progress has happened since, 3 wind farms, two phases each of 60 MW in Al Fattaih and one farm of 120 MW in Al Makarroun have been contracted. Feasibility studies for 5-100CSP and 2-10PV are underway and solar water heating is under consideration. It is recommended that a strategic plan for financing and establishing such program is developed taking into account international experience. In addition capacity building and institutional frame work programs for REAOL would strengthen its role and impact on the sector. Finally renewable energy contribution to the generation plan can be integrated in the overall energy requirements.
82 Using an average capital cost of US$850/kW.

141
7.45 International experience points out the importance of incentive-based policies to develop renewable energy, even when there is a cost disadvantage. Likewise, energy efficiency, particularly related to DSM measures, faces challenges when prices are too low. Under such circumstances, measures aimed at reducing the demand at peak periods and thus relieving the pressure on investment to meet peak demand is critical. At present, the development of renewable energy remains limited in Libya. Nevertheless, the government now realizes that renewable energy sources could take up a significant share of the energy supply options if they were properly developed, and has decided to make it a priority. An Executive Renewable Energy Agency has been established to be responsible for implementing policies, plans, and programs in this area. 7.46 While renewable energy has significant potential in Libya,83 this potential is not yet fully realized due to various obstacles and impediments including generous subsidies on fossil fuels, high initial capital costs, lack of an operational plan for implementation, and an embryonic domestic manufacturing industry. Preliminary measurements of wind speeds show that average speeds are between 5-9 m/s, with the most promising are being the south east with speeds between 8-9 m/s and north east. The renewable energy plan (2008–12) includes an investment of LD1,100 million for the development of 330 MW in generation capacity (240 MW have now been contracted). Wind and solar energy can be considered for Libya for environmental, future economical and for clean energy export. Asound wind atlas and a detailed action plan should be prepared for project implementation as soon as possible. Egypt and Morocco have taken serious steps in the wind generation sector. Egypt already has 230 MW installed and has plans to include an additional 7,000 MW by 2020 (almost 500 MW /year). Morocco has 56 MW in operation and 200 MW should be commissioned in 2008. Tunisia has a 20-MW wind farm in operation and 150 MW in the pipeline. All three countries are involving the private sector in the wind-generation plants and are preparing specific regulations conducive to public-private partnership development in this area. Libya can cooperate with its neighbors to learn from their experiences and accelerate implementation of its program.. 7.47 Solar thermal power plants are also being introduced in Egypt and Morocco, with power plant projects of 140 MW and 240 MW, respectively. Libya has strong potential for solar energy as it has 3200 hours of solar radiation/ year with an average of 5.5-7.0 kWh/m2. Solar energy has good prospects all over with more potential towards the south. It is thought that for the future, solar thermal technology can become a competitive source of power generation in the region, which possesses large desert areas and the long hours of sunshine. Initiatives to support solar plans with incentives and export potential may accelerate the promotion and expansion of implementation of solar technologies. It will be valuable for Libya to become engaged as soon as possible in such technologies. On the demand side, solar water heating is an effective renewable project for Libya, which has many two-, three-, and four-story buildings. Solar heating can contribute to the development of a local manufacturing industry. Awareness of, and government incentives to, support such projects are essential. Tunisia is subsidizing solar water heating up to 20 to 30 percent of their costs and aims to install 500,000 square meters (m2) of solar heating panels by 2009. Syria is planning to subsidize 50 percent of the solar panels and to enable households to pay the rest in installments through their electricity bills. Table 7.5 shows the level of investments per year in Egypt, Morocco, Tunisia, and Libya.
83 Libya has good potential for both wind and solar renewable energy programs. The wind speeds of 5 to 8 meters per second are reasonable for wind projects, certain locations
such as Darana are promising sites, and wind- generation units in Libya are yet to join its electricity grid. Annual sunshine of useful solar radiation is 3,200 hours per year, and the
high solar radiation levels of 5 kWh/m2 to 7 kWh/m2 are good conditions for solar programs.
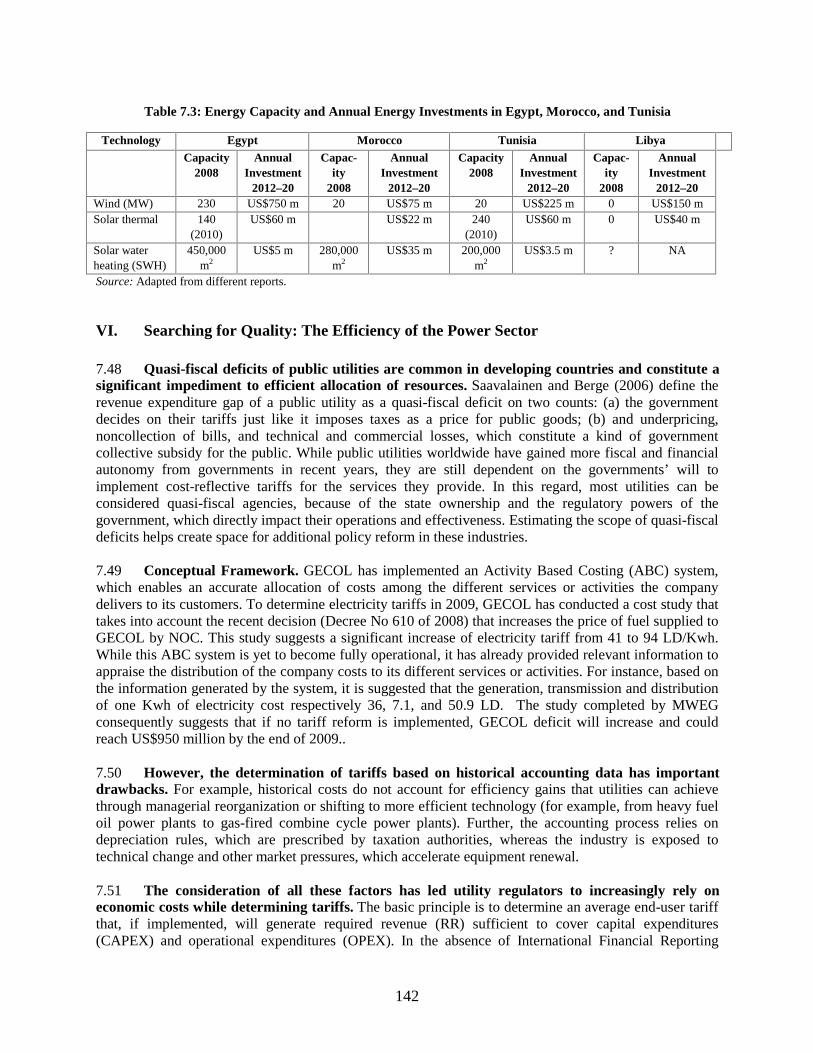
142
Table 7.3: Energy Capacity and Annual Energy Investments in Egypt, Morocco, and Tunisia
Source: Adapted from different reports.
VI. Searching for Quality: The Efficiency of the Power Sector 7.48 Quasi-fiscal deficits of public utilities are common in developing countries and constitute a significant impediment to efficient allocation of resources. Saavalainen and Berge (2006) define the revenue expenditure gap of a public utility as a quasi-fiscal deficit on two counts: (a) the government decides on their tariffs just like it imposes taxes as a price for public goods; (b) and underpricing, noncollection of bills, and technical and commercial losses, which constitute a kind of government collective subsidy for the public. While public utilities worldwide have gained more fiscal and financial autonomy from governments in recent years, they are still dependent on the governments’ will to implement cost-reflective tariffs for the services they provide. In this regard, most utilities can be considered quasi-fiscal agencies, because of the state ownership and the regulatory powers of the government, which directly impact their operations and effectiveness. Estimating the scope of quasi-fiscal deficits helps create space for additional policy reform in these industries. 7.49 Conceptual Framework. GECOL has implemented an Activity Based Costing (ABC) system, which enables an accurate allocation of costs among the different services or activities the company delivers to its customers. To determine electricity tariffs in 2009, GECOL has conducted a cost study that takes into account the recent decision (Decree No 610 of 2008) that increases the price of fuel supplied to GECOL by NOC. This study suggests a significant increase of electricity tariff from 41 to 94 LD/Kwh. While this ABC system is yet to become fully operational, it has already provided relevant information to appraise the distribution of the company costs to its different services or activities. For instance, based on the information generated by the system, it is suggested that the generation, transmission and distribution of one Kwh of electricity cost respectively 36, 7.1, and 50.9 LD. The study completed by MWEG consequently suggests that if no tariff reform is implemented, GECOL deficit will increase and could reach US$950 million by the end of 2009.. 7.50 However, the determination of tariffs based on historical accounting data has important drawbacks. For example, historical costs do not account for efficiency gains that utilities can achieve through managerial reorganization or shifting to more efficient technology (for example, from heavy fuel oil power plants to gas-fired combine cycle power plants). Further, the accounting process relies on depreciation rules, which are prescribed by taxation authorities, whereas the industry is exposed to technical change and other market pressures, which accelerate equipment renewal. 7.51 The consideration of all these factors has led utility regulators to increasingly rely on economic costs while determining tariffs. The basic principle is to determine an average end-user tariff that, if implemented, will generate required revenue (RR) sufficient to cover capital expenditures (CAPEX) and operational expenditures (OPEX). In the absence of International Financial Reporting
Technology Egypt Morocco Tunisia Libya Capacity
2008 Annual
Investment 2012–20
Capac-ity
2008
Annual Investment
2012–20
Capacity 2008
Annual Investment
2012–20
Capac-ity
2008
Annual Investment
2012–20 Wind (MW) 230 US$750 m 20 US$75 m 20 US$225 m 0 US$150 m Solar thermal 140
(2010) US$60 m US$22 m 240
(2010) US$60 m 0 US$40 m
Solar water heating (SWH)
450,000 m2
US$5 m 280,000 m2
US$35 m 200,000 m2
US$3.5 m ? NA

143
Standards-compliant financial statements, we could not rely on this approach. Instead, we will calculate GECOL’s Long-Run Average Incremental Cost (LRAIC) of generating, transporting, and distributing electricity. The difference between actual tariffs and LRAIC will be considered an explicit subsidy,84 because it is the government’s prerogative to set tariffs, whereas it is the utility’s or regulator’s responsibility to accurately inform the government about the service delivery costs. 7.52 Three types of subsidies are identified in the sector: (a) subsidies on fuel costs;85 (b) capital subsidy for network expansion and modernization; and (c) GECOL hidden costs, which include underpricing of end-user services. As subsidy (b) is hard to approach in a context of incomplete information, the proposed analysis estimates: (a) subsidies on fuel costs, and (b) hidden costs.86. Subsidy is computed as the difference between the actual revenues charged at regulated prices and collected from consumers and the revenues required to fully cover the operating cost of production and capital depreciation. Similarly, to calculate hidden costs, we use the World Bank and IMF methodology as described in Ebinger (2007). This methodology computes three deficiency components affecting the delivery of electricity service: (a) poor collection of bills, (b) excessive losses due to inefficient operations or theft from the network, (c) and tariffs set below their cost-reflective level. Box 7.2 provides a detailed explanation of the cost modeling.
Source:Bank staff elaboration.
7.53 Implicit subsidies on fuel prices. Table 7.4 provides an overview of the evolution of GECOL fuel prices in recent years. These prices are decided on the basis of decrees issued by the GPC for oil. For instance, the local price of natural gas has remained constant at 208 LD per million British Thermal Units (MMBTU) since 1992, whereas price adjustments were made for light and heavy fuel oil.
84 When tariffs are deliberately set below cost, an explicit subsidy is justified to enable the service provider to cover all its costs and ensure a reasonable remuneration to its
shareholders. 85 The National Oil Company supplies fuel products to GECOL at prices that are fixed below international market prices by the government. In recent years, domestic prices of
energy fuel have been kept very low—representing, on average, 3.2 percent of the international market price in 2006, in the case of natural gas. 86 Hidden costs reflect GECOL’s internal and external deficiencies and can be considered an illegitimate claim on public resources, since GECOL should be required to be
efficient in its operations.
Box 7.2. Calculation of Hidden Costs
Hidden costs (H) are consequently defined by the difference between expected revenues (R*) and the actual revenues (R): H = R* -R. Alternatively, H can be expressed as a function of tariffs below cost recovery, unaccounted losses, and poor collection of bills (equation 1).
H = Qe * (Tc – Te) + Qe*Tc * (lm – ln)/(1-lm) + Qe*Te * (1 – Rct) (equation 1),
where: • Qe = End-user consumption • Tc = Average cost recovery price • Te = Weighted average of actual tariffs • Lm = Total loss rate (distribution and transmission) • Ln = Normative loss rate (distribution and transmission) • Rct = Bill collection rate.
Source: Ebinger 2007.

144
Table 7.4: Evolution of Fuel Prices87
7.54 In contrast to the mechanisms to set domestic prices, international fuel energy prices are freely decided by the market and have fluctuated in recent years. These prices significantly increased during 2000–07, as shown in Figure 7.19. The difference between domestic and international energy fuel prices results in a price parity gap. In other words, the international price parity gap represents an opportunity cost to the government, which might face a revenue gap. This revenue gap can be considered an implicit subsidy transferred in a nontransparent manner to the power sector.
Figure 7.19: Evolution of International Prices of Energy Fuel, 2000–07
International prices of energy fuel
0
10
20
30
40
50
60
70
80
90
2000 2001 2002 2003 2004 2005 2006 2007
$per
bbl
LFO - $/bbl HFO - $/bbl NG - $/MMBTU
Source: NOC and International Energy Agency.
87 As per decision No. 610 of 2008, GECOL will be charged new fuel prices which are significantly higher as depicted by table 7.7. However, it remains unclear if this decision has been enforced since.
Type of Fuel Light Fuel LD26/m3
Prices before 1/1/2002
LD36/m3
Decree No. 182 for the year 1369 DP of the Secretary of the GPC for Oil – effective as of 1/1/2002
LD56/m3
Decree No. 122 for the year 2005 of the GPC Secretariat
LD 150/m3
Decision No. 610 for the year 2008 to be effective starting 2009
Heavy Fuel LD8.4/m3
Prices before 1/1/2002
LD18.4/m3
Decree No. 182 for the year 1369 DP of the Secretary of the GPC for Oil – effective as of 1/1/2002
LD 36/m3
Decision No. 610 for the year 2008 to be effective starting 2009
Natural Gas 208 Dirham/MMBTU a/ Decree No. 14 for the year 1992 of the Secretary of the General GPC for Oil
LD 0.020/m3
Decision No. 610 for the year 2008 to be effective starting 2009
a/1000 dirham= 1LD Source: NOC and GPC for Planning.
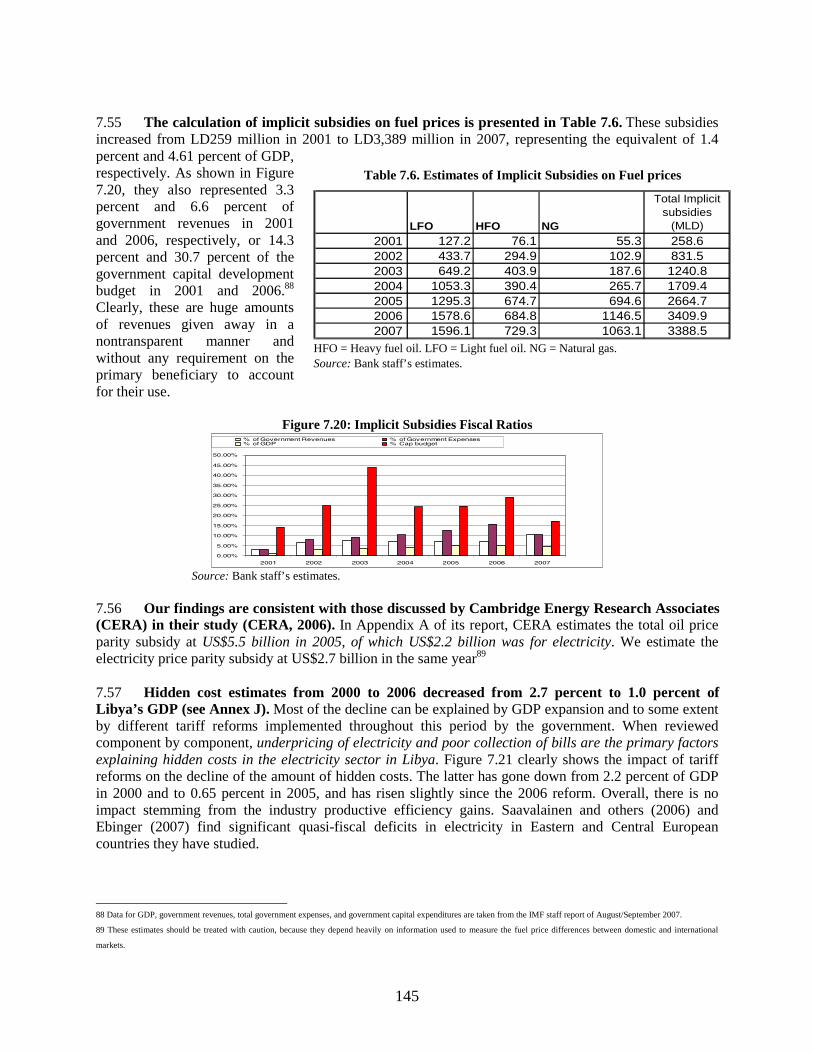
145
7.55 The calculation of implicit subsidies on fuel prices is presented in Table 7.6. These subsidies increased from LD259 million in 2001 to LD3,389 million in 2007, representing the equivalent of 1.4 percent and 4.61 percent of GDP, respectively. As shown in Figure 7.20, they also represented 3.3 percent and 6.6 percent of government revenues in 2001 and 2006, respectively, or 14.3 percent and 30.7 percent of the government capital development budget in 2001 and 2006.88 Clearly, these are huge amounts of revenues given away in a nontransparent manner and without any requirement on the primary beneficiary to account for their use.
Figure 7.20: Implicit Subsidies Fiscal Ratios
0.00%
5.00%
10.00%
15.00%
20.00%
25.00%
30.00%
35.00%
40.00%
45.00%
50.00%
2001 2002 2003 2004 2005 2006 2007
% of Government Revenues % of Government Expenses% of GDP % Cap budget
Source: Bank staff’s estimates.
7.56 Our findings are consistent with those discussed by Cambridge Energy Research Associates (CERA) in their study (CERA, 2006). In Appendix A of its report, CERA estimates the total oil price parity subsidy at US$5.5 billion in 2005, of which US$2.2 billion was for electricity. We estimate the electricity price parity subsidy at US$2.7 billion in the same year89
7.57 Hidden cost estimates from 2000 to 2006 decreased from 2.7 percent to 1.0 percent of Libya’s GDP (see Annex J). Most of the decline can be explained by GDP expansion and to some extent by different tariff reforms implemented throughout this period by the government. When reviewed component by component, underpricing of electricity and poor collection of bills are the primary factors explaining hidden costs in the electricity sector in Libya. Figure 7.21 clearly shows the impact of tariff reforms on the decline of the amount of hidden costs. The latter has gone down from 2.2 percent of GDP in 2000 and to 0.65 percent in 2005, and has risen slightly since the 2006 reform. Overall, there is no impact stemming from the industry productive efficiency gains. Saavalainen and others (2006) and Ebinger (2007) find significant quasi-fiscal deficits in electricity in Eastern and Central European countries they have studied.
88 Data for GDP, government revenues, total government expenses, and government capital expenditures are taken from the IMF staff report of August/September 2007. 89 These estimates should be treated with caution, because they depend heavily on information used to measure the fuel price differences between domestic and international
markets.
Table 7.6. Estimates of Implicit Subsidies on Fuel prices
LFO HFO NG
Total Implicit subsidies
(MLD)
2001 127.2 76.1 55.3 258.62002 433.7 294.9 102.9 831.52003 649.2 403.9 187.6 1240.82004 1053.3 390.4 265.7 1709.42005 1295.3 674.7 694.6 2664.72006 1578.6 684.8 1146.5 3409.92007 1596.1 729.3 1063.1 3388.5
HFO = Heavy fuel oil. LFO = Light fuel oil. NG = Natural gas. Source: Bank staff’s estimates.

146
Figure 7.21: Hidden Costs by Components in Percentage of GDP
0.00%
0.50%
1.00%
1.50%
2.00%
2.50%
2000 2001 2002 2003 2004 2005 2006 2007
Tariffs set below cost % GDP Excessive technical losses - % GDP
Poor Bills collection - % GDP
Source: Bank staff’s estimates.
7.58 Estimation of hidden costs for 2008–12. Using the same methodology as above, we have projected hidden costs for 2008–12. During this period, it is assumed that GECOL could achieve significant efficiency gains by minimizing technical and commercial losses, which, in return, will also lower its unit cost from 72 Dirham per kWh to 51 Dirham per kWh. An expected lower unit cost (average cost recovery level) stemming from an aggressive modernization program conducted by GECOL explains the drop in hidden costs from 0.6 of GDP in 2008 to 0.4 percent in 2012. (Table 7.7).
Table 7.7 Hidden Cost Estimates, 2008–12
Qe (total energy consumed) - GWh
Tc (Average cost recovery tariff) - LD
Te (Actual Tariff) - LD
ln (standard rate of losses)
Rc (Rate of bills collection)
Hc (Hidden Costs) - MLD
GDP - MLD
Hc/GDP in %
2008 17957 0.051 0.041 0.08 0.73 436 77175 0.57%2009 18496 0.051 0.041 0.08 0.76 416 81034 0.51%2010 19051 0.051 0.041 0.08 0.79 399 85085 0.47%2011 19622 0.051 0.041 0.08 0.82 380 89340 0.43%2012 20211 0.051 0.041 0.08 0.85 356 93807 0.38%
Source: Bank staff’s estimates.
VII. Policy Recommendations 7.59 Possible options for reform. Universal service to electricity has been achieved in Libya, and government redistributive policies have ensured that electricity tariffs remain affordable to most Libyan households. Given current and future growth prospects of Libya, the power sector faces daunting challenges in its efforts to modernize itself, promote efficiency and accountability, while also ensuring sound fiscal sustainability. Indeed, the power sector in Libya faces multifaceted challenges that call for an in depth reform. Sector performance has been hampered in recent years by the sector institutional setting, and it can be improved only if a thorough institutional reform is designed and implemented. The proposed reform will, however, need to be tailored to the Libyan institutional and political environment. Given the quasi-exclusivity of the Libyan political and institutional setting, caution is advised in the replication of models stemming from international experience when devising Libyan reform. Whatever reform option is finally retained, however, it will be important to be guided by the following principles in shaping its implementation: (a) creating an institutional environment that provides the right incentives to people and institutions in the sector; (b) establishing rules, procedures, and processes to ensure greater accountability throughout the production chain; (c) making sure to implement systems enabling the generation of accurate and relevant information needed to guide the decision making, and (d) building the capacity of institutions and people to make the system effective and efficient. Recommendations are grouped into three categories: short term or urgent actions, medium term, and long term.

147
Short-term Actions 7.60 As reflected in the reform program prepared by MWEG, it is necessary to separate policymaking from regulation and service provision. The current institutional and regulatory setting does not induce efficiency and accountability in the delivery of electricity services in Libya. MWEG sets policies, performs as the regulator, and is closely involved with the operations of GECOL. Likewise, GECOL is also closely associated with policymaking and regulation. This lack of clarity in the roles and responsibilities of different sector players hampers accountability and transparency in the sector. 7.61 A sector development strategy has been prepared in 2008, its finalization and implementation is urgently required. The sector has elaborated a development strategy that outlines the visionary approach which should guide its development during the coming years. Prior to the government reorganization in January 2009, a sector’s reform program has been prepared, including draft legislation for electricity and gas. It is crucial that the new government refines and adopts the sector reform agenda. The finalization process should focus on some of the following areas: optimal fuel mix options for electricity generation; progressive shift to cost reflective tariff, fine tuning of the market structure arrangements, further clarification of the attributes of the electricity and gas regulatory authority; etc. 7.62 Information gap. In preparing this document, reports and studies were kindly provided by GECOL, MWEG, NOC, and the GPC for Planning. While the information is relatively abundant, its consistency is poor. As the electricity sector is going through a restructuring process, quality and consistency of information has suffered. Until 2004, GECOL published annual reports, but has since replaced these reports with short statistical reports. Even though these documents are generated by the same organization, consistency is not assured on different statistics across years. Considering that accurate information is critical to effective decision-making, we recommend that a sector observatory be created within the Ministry of Water, Electricity and Gas90. The primary mandate of this observatory will be to collect, store, analyze, and publish sector statistics while ensuring data consistency from year to year. 7.63 Low electricity tariffs should be adjusted, because they are sending the wrong message to consumers91. The electricity tariffs in Libya are low and heavily subsidized by the government. The current tariff structure and levels, however, present many drawbacks: (a) consumers do not receive the signal that electricity is costly and should not be wasted, (b) high consumption leads to costly expansion programs whereas containing consumption could save fiscal resources for other purposes, (c) all consumers get the subsidies whereas it will be more effective to target the subsidy to the consumers that need them most, and (d) some firms can decide their location in Libya to take advantage of the subsidized electricity. There is, consequently, an urgent need to improve the targeting of consumption subsidies in electricity. 7.64 By increasing the social tariff band from 500 kWh to 1000 kWh, the 2006 tariff reform expanded the bracket of households benefiting from the social tariff band. In fact, 92 percent of GECOL customers fall under this band. We recommend abandoning the current tariff structure and replacing it with a new tariff structure that will include a “real social tariff band” at 300 kWh instead of 1000 kWh. The proposed tariff structure could include the following bands: (a) a social band at 300 kWh, (b) an intermediary consumption band between 300 kWh and 500 kWh, (c) a medium-high consumption band between 500 kWh and 1000 kWh, (d) and a high- consumption band beyond 1000 kWh. Subsidized
90 In the sector reform agenda prepared in 2008 by MWEG, it is proposed to establish an Information and Sector Documentation Center within the Ministry. This is a positive
move that will help to redress the weaknesses compiling sector data and information. 91 Maintaining extremely low electricity tariffs is probably justified by the limited income available to most households, since salaries were frozen in 1981. But, electricity tariffs
are not the best instruments for income redistribution.

148
rates could be computed for the first two bands. For example, the social band could benefit from a subsidized rate estimated at 75 percent of the cost recovery price, whereas the intermediary band could be subsidized at 40 percent. We recommend that a comprehensive tariff study be conducted by an independent consultant. Such a study will: (i) develop an economic cost model for tariff determination; (ii) determine the average electricity tariff that covers the total cost through the computation of required revenues; (iii) propose options for tariff structure and tariff policy; (iv) define and propose a transparent process for electricity tariff determination and adjustment.
Medium-term Actions 7.65 The proposed sector reform agenda creates the appropriate conditions to shift from operating-deficits compensation to performance-based subsidies. According to article 7 of Law No. 17, GECOL is entitled to appropriate compensation from the government for end-user tariffs being set below their costs. In practice, this compensation mechanism does not seem to work effectively. To avoid the cascade effect resulting from below-cost pricing, we recommend shifting to performance-based subsidies. This will make the subsidies explicit and transparent. The government can, therefore, include budgetary appropriations to cover the differences between actual costs incurred by the service provider and the tariff levels it decides. Furthermore, a tariff indexation formula could be devised (see Para. 86) to induce GECOL productive efficiency. This reform will be relatively easy to implement, provided the new sector law is adopted and enacted. 7.66 The sector reform agenda recognizes the need to promote private sector participation in electricity generation. For instance, the revised investment program for 2008-2012 anticipates approximately 2,242 million LD of private sector investment in generation. However, increased private sector participation can be immediately promoted by GECOL in two concrete areas: maintenance of its distribution network and the distribution and collection of customer bills. For example, a private operator can be competitively contracted to install and operate a Collection Management and Metering (CMM) system through the installation of Automatic Meter Reading (AMR) at customer premises92. Such a public-private partnership scheme can be done through a design-build-operate (DBO) approach whereby GECOL will tender two contracts. The first contract will be a turnkey contract for the installation of pre-specified equipment (AMR, CMM), and the second contract will be a service provider contract. Interlinking the two contracts will provide sufficient incentives to the private sector to deliver the outcomes specified by GECOL. 7.67 The government needs to accelerate the implementation of DSM measures. Considering further that the number of air-conditioning units and other electrical home appliances will continue to increase in the future, we recommend launching energy efficiency programs. Such programs can include codes and standards for new buildings and appliances, solar water heating to equip households, compact fluorescent lamps (CFLs) for commercial buildings, and incentive programs to induce industrial site audits. 7.68 On the demand side, solar water heating systems can be effectively promoted in Libya if adequate policies and government incentives are implemented. Likewise, in Libya, streetlights consume up to 10 percent of the total energy consumed in the country. This is surprising and far from international standards. A thorough energy audit should be conducted and a systematic replacement made of incandescent bulbs with CFL bulbs.
92 Contracting out billing and collection requires that metering is accurate. This implies the need to contract out in parallel the management of meters. However, as it has been
rightly pointed out by one peer reviewer, if the underlying issue is the poor technical capacity of staff, then contracting out to private management will be effective. Conversely,
contracting out will not be effective if there are deeper social problems leading to a culture of non-payment of bills. In this case, GECOL will need to address the issue directly
before it can contract out metering and bills collection to private sector.

149
7.69 The renewable energy plan for 2008-12 includes the development of a 330-MW capacity with renewable energy (RE), 280 Wind, 50 CSP, with estimated cost of 1100 million LD, but it has not been reflected in the load forecasting for the period. A positive move in RE has been the recent establishing of REAOL to take the responsibility of implementing policies and plans for RE. It is recommended that REAOL develops a strategy for financing and operating the RE programs and to strengthen its capacity and institutional arrangement. It is also recommended to prepare a sound wind atlas especially for the areas with promising potential. Similarly, solar technology is considered to become a competitive source of power generation in the region. Libya should explore its options in the area and develop a plan with projects to be developed including with private sector participation. Libya can also consider exporting clean energy to Europe via an under-water cable to Italy. 7.70 Enhancing fiscal discipline in the sector. The current institutional arrangement does not induce greater efficiency in the power sector. GECOL has little accountability regarding its capital investment program, and the government has yet to condition its capital contribution on the performance achieved by the company. We recommend that, in the future, the Ministry of Planning condition the disbursement of its capital budget allocation on the achievement of specified performance indicators—such as the availability of power plants, de-rating of power plant capacity, distribution and transmission losses, and commercial losses. Moving to performance-based contracts will create the right incentives to improve efficiency in the sector. Another option could be for the government to fund, through its capital budget, an agreed portion of GECOL’s investment program, while the remainder will be funded by loans directly contracted by the company. Increasing GECOL’s accountability will, however, require the implementation of a revised tariff structure for electricity, signaling clearly to consumers that electricity has to be used efficiently. 7.71 An urgent challenge for the sector is to significantly improve its productive efficiency in the medium term. Therefore, it is crucial to design and implement incentive-based schemes linking or conditioning the transfer of capital budget support to GECOL on the achievement of a set of pre-agreed performance targets. For instance, the government could split the sector capital budget into two categories: (a) priority programs, because of their national security or political implications (energy supply security); and (b) normal programs, which should be justified on standard economic terms. In this regard, there should be a requirement that all projects belonging to the “normal projects category” be supported with professional feasibility studies or analyses. Planning will then review the feasibility studies and, based on its findings, decide on their final incorporation into the plan. 7.72 The preliminary assessment of the load forecast submitted by the MWEG shows that required generation capacity to meet the electricity needs of the Libyan economy has been overestimated. It finds that a step increase in required generation capacity of 1000 MW in 2010 is probably not justified if more conservative assumptions are used. About US$850 million or even more could be saved in the total investment program contemplated. Exploring alternative options to lower investment costs is therefore highly recommended to account for the impact of the global economy slow down. Growth prospects for Libya have been significantly revised down, thus also impacting prospects for strong electricity demand growth. 7.73 Promoting public-private partnerships in the power sector. In Libya, private sector participation in the electricity sector is at an early stage of development. The current regulatory scheme provides GECOL with a monopoly over the provision of electricity services nationwide. GECOL’s monopoly includes generation of electricity, transmission, distribution, and commercialization of electricity to end users. However and in accordance with the current legislation, GECOL can enter into joint venture operations entailing the production or any other activity in the sector. Nevertheless, it is worth emphasizing the urgent need to improve regulatory certainty and predictability, if Libya intends to

150
accelerate private capital flow into the power sector. Consequently, a new sector legislation authorizing and regulating private sector participation in the power sector is needed. The draft electricity and gas legislation under preparation should address this issue. Besides clarifying the roles and attributes of the different sector players, and organizing the electricity market structure, this legislation should also provide conditions and requirements to prevail over the liberalization of market segments such as generation, and services commercialization. 7.74 It is clear that Libya will continue to witness strong electricity demand in the future. One option the government might consider, in addition to reforming electricity tariffs and devising and implementing demand-side management measures, is to solicit the private sector for the development of independent power projects (IPPs). Libya has abundant gas and oil resources that can be provided on competitive terms to private investors willing to invest in the development and operation of new power plants. Instead of signing power purchase agreements (PPAs), the government could consider Energy Conversion Agreements (ECA).93 But, the introduction of IPPs will require that regulatory and political risks be addressed as effectively as possible. For example, it will be crucial before such projects are promoted that the electricity tariff structure be reformed and tariffs progressively adjusted to reflect their cost of production. Similar private sector participation schemes can also be envisioned for the development of renewable energy, such as PPPs for solar thermal plants or for wind farm plants. Jordan and Morocco recently tendered such projects, and the market reaction seems to be very positive. 7.75 Improving transparency in the determination and allocation of the subsidies on fuel prices is urgent. Because GECOL operates essentially under a cost-plus regime, it lacks incentives to minimize its costs and maximize its performance. A radical change in how energy fuel price subsidies are channeled to the power sector is, consequently, urgently needed. The goal of such a reform should be to enable GECOL to make decisions about the allocation of economic resources on the basis of market prices, not on administered prices. The government can decide to progressively expose GECOL to the discipline of market forces by explicitly linking the evolution of domestic prices of fuel energy to international market fluctuations. In compensation, the government should bear full responsibility for the explicit subsidies at the retail level, and make corresponding appropriations according in its recurrent budget. 7.76 Subsidized or preferential electricity prices encourage wasteful energy consumption by industries and other large consumers therefore undermining their competitiveness as these industries have no incentives to adopt energy efficient technology. Eliminating preferential rates and moving to full cost reflective electricity rates create the enabling environment that enhances industrial productivity. In general, governments worldwide like to keep subsidies “off-budget” for political reasons, since “on-budget” subsidies are an easy target for pressure groups interested in reducing the overall tax burden. For this reason, subsidies often take the form of price controls that set prices below full cost, and therefore become a fiscal burden bore by other electricity users. In fact, electricity subsidies are generally captured in their majority by commercial, institutional and industrial consumers. But, when granted to large industries, for example large consumers such as aluminum smelter plants, preferential rates are locked in long term contracts (20 to 25 years) which are subsequently difficult to renegotiate or to change. In this context, preferential electricity rates are included in the package of government incentives or measures to attract Foreign Direct Investment (FDI), or help some domestic industries to sustain competitive pressures from multinationals with the idea to protect employment.
93 With PPA agreements, GECOL or the government will purchase power as specified by the contract, and the private operator will have the responsibility to secure by its own
means supply of competitive fuel energy. In contrast to PPA, ECA agreements will enable GECOL or the government to supply fuel energy to the private operator, which will then
generate energy and sell it to the government or GECOL at a pre-agreed price. Both types of contracts are for 15 to 20 years and entail long-term commitments for both parties.

151
7.77 However, consumption subsidies in general and preferential rates in particular undermine electricity utilities’ return on investment and their ability and incentive to invest in new infrastructure. The dire financial straits of energy companies and the resulting under-investment in several developing countries, such as the state electricity boards in India, are largely due to under-pricing and poor collection rates. 7.78 To progressively eliminate subsidies to energy intensive industries, the guiding principle is to make these subsidies transparent and having them taken care by explicit tax incentives or holidays. Electricity tariffs should not be used as an industrial policy instrument, and most countries are consequently eliminating preferential tariffs they once conceded to large consumers (Brazil and most countries in Latin American which have most to cost reflective tariffs for electricity; European Union countries, State of Oregon in the United States, Quebec in Canada, etc.). To address this issue in Libya, we recommend the preparation of a comprehensive energy pricing strategy that will appraise the impact of energy (gas, LFG, electricity, oil) prices adjustments on inputs prices consumed by different industries (economic branches) in the economy. The study should also be extended to household consumers, and will simulate the impact of a phased reduction of electricity subsidies on the competitiveness of industries and their social impact on residential consumers. There are two approaches that can be used to assess prices adjustments impact: (a) elaboration of an Input-Output Table or Leontiev model; (b) the development of a Computable General Equilibrium (CGE) model for the Libyan economy. 7.79 The Leontiev model calculates the impact of electricity prices increase on inputs prices consumed by different economic branches and industries. Such an exercise was conducted in the case of Morocco in 2006 and gave the results displayed below. It was shown for example that an increase in prices of energy products (diesel, gasoline, HFO) would result in 1.8% price increased in water and electricity. The resulting impact on government budget would have been to roll back the cost of subsidies from 1 US$ 1 billion in 2006 to uS$400 million in 2007. 7.80 The other approach is to construct a CGE model to inform a comprehensive energy pricing strategy as undertaken by the Bank in Egypt in 2007-2009. The purpose of such a study would be to define a path toward energy price levels that are reflective of economic costs while considering their relevant social implications. To capture the effect of energy prices changes throughout the economy, and to large consumers in particular, the Egypt study constructed a tailored computable general equilibrium (CGE) model. Table 7.8 below displays recommended average prices for electricity services for all categories of consumers in order to phase out subsidies during a five year period: 2007/08 -2011/12. This table shows for instance that a yearly average increase of electricity rate of 30% will be required for industries in order to bring their electricity rates to cost reflective levels.
The Morocco Case� Price increases tested:
– Diesel +7%– Gasoline +5.6%– HFO +2%
� Impact on National price Index: 1.4%� Sector impact (selected):
– Transport 2.9%– Water and Electricity 1.8%– Chemical Industry 1.4%– Agro-industry 1.1%– Textile 0.86%– Hotels and restaurants 0.69%– Agriculture 0.62%– Education and social services 0.14%

152
Table 7.8: Average electricity prices - LE / MWh (nominal)
Source: Bank staff estimates based on GECOL data.
Table 7.9 displays the phasing out of subsidies as a result of price adjustments for all categories of consumers.
Table 7.9: Electricity subsidies, as a proportion of opportunity cost
pricesSource: World Bank (2009), Egypt Energy Pricing Strategy Report.
7.81 In conclusion, we recommend that MWEG or the Ministry of Economy and Finance, in collaboration with the Ministry in charge of electricity undertakes the preparation of a comprehensive energy pricing strategy in Libya. This process should begin with the preparation of the terms of reference for the study. These terms of reference will spell out the scope of the study (industries to be covered and households) and will state what energy price changes will be tested to facilitate the finalization of the report and its policy recommendations. An inter-ministerial task force will be established and coordinated by the Ministry of Economy and Finance and will include: (i) a seasoned economist, one econometrician, one foreign trade specialist ; (ii) an expert in National Accounts. Finally, the ministry of Economy and Finance will need to secure relevant data and an appropriate budget for the preparation of the study. In Egypt, a budget of US$700,000 - 1,000,000 was mobilized for the study.
7.82 In sum, phasing out subsidies to large electricity consumers is part of the broader tariff-subsidy reform of electricity tariffs that Libya needs to undertake in order to contain wasteful use of electric energy that has developed in the country. The issue at stake relates to the global competitiveness of those industries benefiting from preferential electricity rates. It is therefore important to assess to which extent a tariff rebalancing effort will impact their competitiveness, and decide ultimately what substitute measures can be put in place to ensure their competitiveness. Brazil is probably one of the few countries in the world that has now scaled back all preferential rates that used to be available to large electricity consumers such as aluminum smelter plants by replacing them with explicit but termed tax- holidays. As discussed above, Morocco and Egypt have also initiated steps to phase out such subsidies for large electricity consumers and have undertaken comprehensive studies to appraise the magnitude of the problem and options for reform, but implementation has remained mild due political sensitivity of the topic.

153
7.83 Reducing hidden costs is a crucial cost-effectiveness necessity. This would substantially reduce hidden costs in the industry and would quickly improve GECOL’s productive efficiency by lowering its costs to the efficiency frontier. As illustrated in the analysis, GECOL’s hidden costs can be substantially reduced if the technical and commercial losses are significantly improved and its unit costs significantly lowered. 7.84 A summary of the main policy recommendations follows (see Table 7.10).
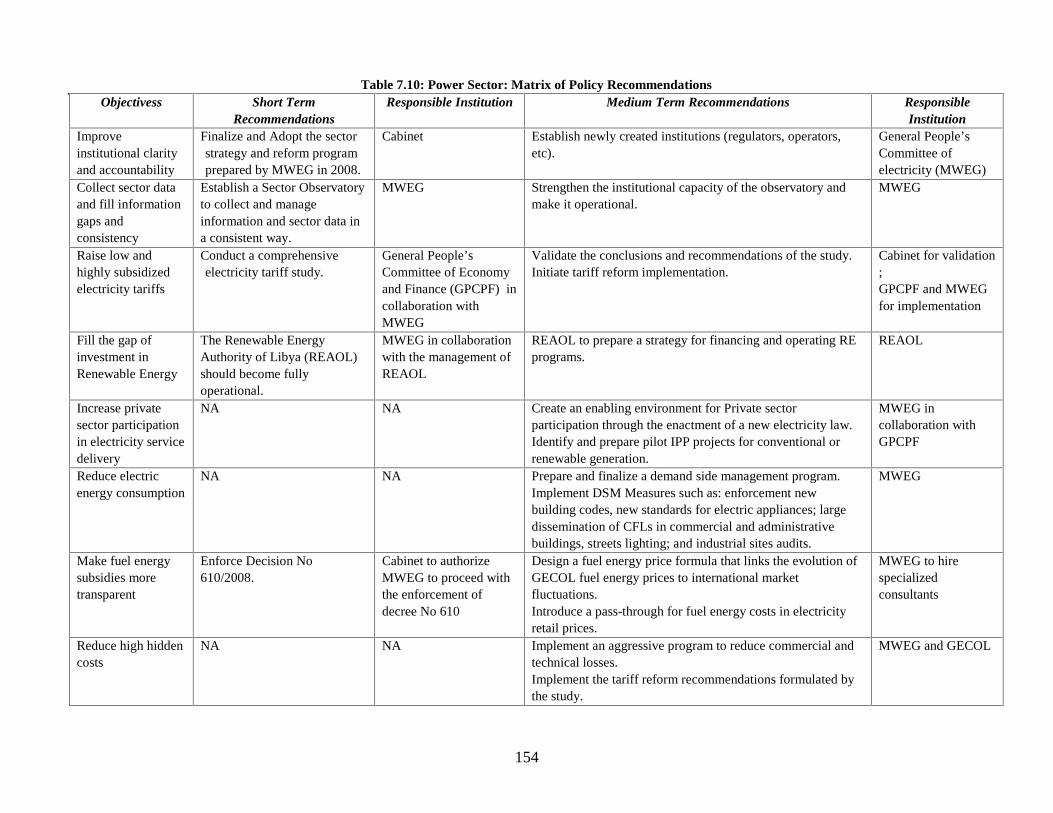
154
Table 7.10: Power Sector: Matrix of Policy RecommendationsObjectivess Short Term
RecommendationsResponsible Institution Medium Term Recommendations Responsible
InstitutionImproveinstitutional clarityand accountability
Finalize and Adopt the sectorstrategy and reform programprepared by MWEG in 2008.
Cabinet Establish newly created institutions (regulators, operators,etc).
General People’sCommittee ofelectricity (MWEG)
Collect sector dataand fill informationgaps andconsistency
Establish a Sector Observatoryto collect and manageinformation and sector data ina consistent way.
MWEG Strengthen the institutional capacity of the observatory andmake it operational.
MWEG
Raise low andhighly subsidizedelectricity tariffs
Conduct a comprehensiveelectricity tariff study.
General People’sCommittee of Economyand Finance (GPCPF) incollaboration withMWEG
Validate the conclusions and recommendations of the study.Initiate tariff reform implementation.
Cabinet for validation;GPCPF and MWEGfor implementation
Fill the gap ofinvestment inRenewable Energy
The Renewable EnergyAuthority of Libya (REAOL)should become fullyoperational.
MWEG in collaborationwith the management ofREAOL
REAOL to prepare a strategy for financing and operating REprograms.
REAOL
Increase privatesector participationin electricity servicedelivery
NA NA Create an enabling environment for Private sectorparticipation through the enactment of a new electricity law.Identify and prepare pilot IPP projects for conventional orrenewable generation.
MWEG incollaboration withGPCPF
Reduce electricenergy consumption
NA NA Prepare and finalize a demand side management program.Implement DSM Measures such as: enforcement newbuilding codes, new standards for electric appliances; largedissemination of CFLs in commercial and administrativebuildings, streets lighting; and industrial sites audits.
MWEG
Make fuel energysubsidies moretransparent
Enforce Decision No610/2008.
Cabinet to authorizeMWEG to proceed withthe enforcement ofdecree No 610
Design a fuel energy price formula that links the evolution ofGECOL fuel energy prices to international marketfluctuations.Introduce a pass-through for fuel energy costs in electricityretail prices.
MWEG to hirespecializedconsultants
Reduce high hiddencosts
NA NA Implement an aggressive program to reduce commercial andtechnical losses.Implement the tariff reform recommendations formulated bythe study.
MWEG and GECOL

155
Chapter 8. Rebalancing Road Maintenance and Network Development Despite considerable investments in developing the road sector over the last few years, the Government of Libya recognizes deficiencies in the capacity and quality of its highway network caused by under investing in new roads and long lasting neglect of maintenance. This legacy is posing a major constraint to trade and economic growth. As a first step to address this, the Authorities have initiated a vast road development program to be completed over the next five years. The neglect of preventive maintenance has resulted in an overall deterioration of a major part of Libya’s road network that was constructed during the 70’s, 80’s and 90’s and in a decline in the value of Libya’s road assets. Future economic growth will still be negatively affected if the increasing backlog of maintenance works is not addressed urgently. The above issue is compounded by the insufficient knowledge of the pavement conditions due to a lack of regular road condition surveys. Road construction programs are not prioritized based on a Master Transport Plan taking into account economic, technical, and social criteria, which would require better statistical information. The Roads and Bridges Department is also facing limited human and financial implementation capacity constraints. Although proceeds from road user charges are in line with short term marginal costs, high subsidies on fuel, relatively low road charges and artificially low truck tariffs made possible by overloading of trucks are not sustainable. Traffic safety is also deteriorating, due to poorly maintained roads and an increasing traffic. The Government has several options.
I. Introduction 8.1 With an area of 1,700,000 square kilometers (km2), mostly desert, and an estimated population of about 6 million (2008), Libya is one of the most sparsely populated countries in the world (3.15 inhabitants/km2). The major part of the Libyan population is located along the coastal strip of 1,900 kilometers (km). The average population growth rate is 1.9 percent per year. According to 2005 statistics, the urbanization rate is 87 percent, which is significantly higher than the average for Middle East and North Africa (MENA) countries. The major natural resources of Libya are oil and gas, with reserves estimated at, respectively, 29 billion barrels and 52 trillion cubic meters (m3). During the last four years, this sector’s share of the gross domestic product (GDP) was 62 percent, providing 96 percent of export earnings. The high reliance on a single export product, and the need to import almost all basic goods, are increasing the importance of the transport sector. 8.2 The transport sector’s share of GDP is 4.1 percent, and the road sector is the dominant mode of transport in the absence of a railway network. The interurban road network comprises about 30,000 km of paved roads, and about 50,000 km of gravel and earth roads in the more remote areas. The length of the paved urban road network is extensive but not documented. There are 3 main airports and another 20 airports with paved runways of more than 3,000 meters (m). 8.3 Whereas Libya significantly increased road investment in the 90s, the transport sector’ share of budget, at 0.8 percent of GDP has been historically low. No coherent transport policy and strategy was developed during the 1987–2003 period, and the transport sector activities and services were limited or operating at a slow pace, as a result of the decentralized planning and decision-making to the «Shaabiats»94. The embargo imposed during the 90’s also prevented the Libyan Authorities from calling for international road consulting companies’ services most of the time. A Transport Master Plan developed in 1985 addressed several transport sector issues and identified development programs and standards and guidelines for the sector. However, the follow-up was ineffective and few programs and projects were implemented.
94 The equivalent of a District or Governorate

156
8.4 This Chapter makes a sector diagnostic and includes a quick review of the preliminary version of the 2008-12 investment program. It provides recommendations that would strengthen the performance of the road sector, thereby increasing its contribution to the national economy and further alleviating of poverty.
II. The Performance of the Road Sector
8.5 The road network density is generally satisfactory. The total length of Libya’s paved road network is about 25,599 km (2006), of which 14,439 km constitute the primary network (see Box 8.1 for a glossary of terms Not included). The secondary road network is estimated at 4,200 km, and there are 6,960 km of paved agricultural roads. The unpaved network is about 3,000 km long. There is also a network of seasonal tracks about 50,000 km. The above figures are approximate in the absence of a full network survey after the General People’s Committee for Transport and Communication (GPCT) took over responsibility for roads from the shaabiats (municipalities) and the Agriculture Secretariat. However, based on available data (Table 8.1), Libya’s road network density would be adequate to meet the country’s needs. Because a large part of the country’s territory is semi-desert, Libya’s road network density is low at about 17.6 km/1,000 km2, compared to 40 km/1,000 km2 for Algeria and 32 km/1,000 km2 for Tunisia.
Table 8.1. Road Network Conditions in Libya and other Countries in the Region
Indicator Libya Tunisia Morocco Egypt Algeria Turkey Road density (km/1,000 pop.) 4.8 1.9 1.9 0.78 3.3 0.9 Road network coverage (km/1,000 km2) 17 32 12 62 40 10 Paved roads (% of total) 89 66 56 80 72 93 Roads in good and fair condition (% of total) — — 47/18 52/20 39/35 33/19 Vehicle density (veh./1,000 people) 245 113 — 23 104 — Vehicle density (veh./km road) 51 — — 54 — — — = Not available. Source: GPCT (2003); World Bank (latest data available for 2004–06).
8.6 The highway network (see Annex K) is classified into four main roadway types (the first two types are often referred to as “primary roads”):
• Expressways: Road arteries outside municipal borders linking the cities and regions with two carriageways and at least four lanes (two lanes or more in each direction).
• Main arteries: Roadways linking cities and regions, or serving cities within municipal boundaries. These are single carriageway roads of good paved standard or dual carriageways with 2 lanes in each direction.
• Secondary roads: These link district centers and villages. • Agricultural tracks: Roads linking agricultural land and farms with markets.
8.7 There is a large road maintenance backlog. Because of the decentralization of road management responsibilities during 1987–2003 and the resulting general decline of the quality of the network, the current state of the road network is precarious in many places. There is a considerable backlog of deferred maintenance work that now has to be addressed through the rehabilitation and reconstruction of large segments of the paved network. The extent of this backlog is not known, because road condition surveys have not been systematically conducted in the past. There is a real danger of losing valuable road assets, because most of the available budget is being used for network expansion and other improvements only, neglecting preventive maintenance expenditures.

157
8.8 Based on the preliminary assessments by GPCT and the age of the network, the backlog of necessary rehabilitation works could exceed 10,000 km (33 percent of the network). Based on a cost per kilometer of such restoration work at LD285,000, the total cost for removing such a backlog is about US$2.85 billion (US$570 million per year over five years). In addition, one has to meet regular maintenance needs (periodic and routine maintenance) of those sections of the network that are not included in the backlog, to prevent further erosion of assets and keep the network in a steady state (see Annex K on the general principles for formulating a maintenance management strategy). This may represent as much as US$180 million per year for the current road network as a whole (see section IV on Cost Recovery, below). 8.9 The workload of the Roads Administration is of concern. Due to the huge workload to implement the current five-year program, there is a risk of having to continue to postpone regular maintenance, which would further increase the backlog rather than eliminate it. A relevant factor is the administration’s capacity to implement all projects at any one time given the capacity constraints of the current technical staff level and current policies. Even if contracting out most studies of the design and supervision of construction works, there are limits on how effective such an outsourcing can be if it is not well managed. 8.10 The Libyan vehicle fleet is growing at a very high rate. The fleet of vehicles was estimated at 1.9 million in 2008, of which almost 80 percent are light vehicles (cars, taxis, pickups, and vans) and slightly more than 20 percent are trucks and buses. This corresponds to 310 vehicles per 1,000 inhabitants, a motorization rate two times higher than in Tunisia and 2.5 times higher than in Algeria. The very high annual increase in vehicle ownership observed over the last decade (20 percent annually for light vehicles, at times) is due to incentives such as lower import duties aiming at decreasing the age of the vehicle fleet and promoting private modes of transport. Therefore, the fleet is relatively new, with good mechanical performance (Figure 8.1). 8.11 There is little information on traffic demand and growth rates. There are no systematic surveys of road traffic in Libya. Specific classified traffic counts and origin/destination surveys are conducted for new roads as part of feasibility studies. The most recent (2006) was carried out for the Trans-Maghrebian motorway study. The maximum average daily traffic was estimated to 50,000 vehicles per day (vpd) close to Tripoli, 30,000 vpd close to Benghazi city, and between 1,000 vpd and 3,000 vpd on important intercity roads crossing the proposed alignment of the motorway. This would mean that traffic volumes are relatively low outside urban areas, and well within the capacity of paved single carriageway roads with two lanes.
8.12 The growth rate of traffic outside urban areas is expected to be consistent with past increases in Libya’s fuel consumption (5.3 percent per year for gasoline and 4.3 percent for diesel over the last eight years). The growth rate of the car fleet, recorded over the last eight years, is considerably higher. This means that the average annual distance traveled per vehicle must be decreasing for heavy vehicles, as the same distance and freight volume can be spread over more vehicles. For light
Figure 8.1. Increase of Vehicle Fleet, 1998–2006
LV = Light vehicles. HV = Heavy vehicles. Source: GPCT.
0200 400 600 800
1 000 1 200 1 400
1996 1998 2000 2002 2004 2006 2008Year
Vehicle fleet LV HV
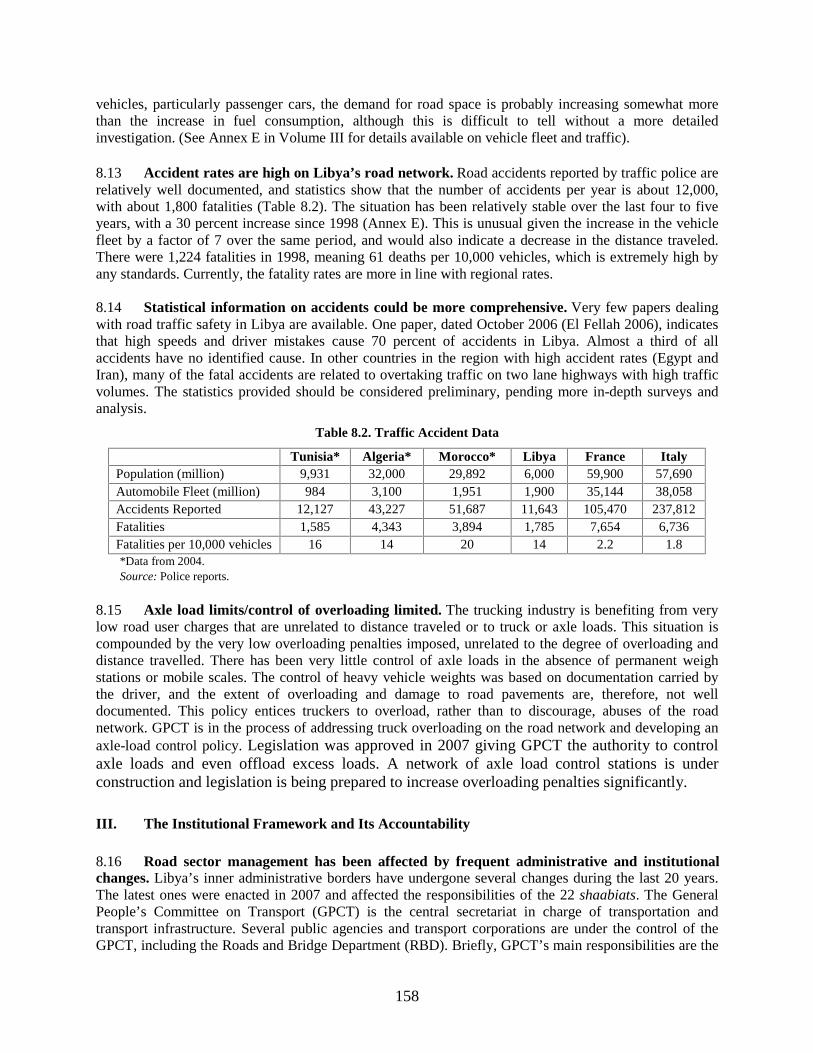
158
vehicles, particularly passenger cars, the demand for road space is probably increasing somewhat more than the increase in fuel consumption, although this is difficult to tell without a more detailed investigation. (See Annex E in Volume III for details available on vehicle fleet and traffic).
8.13 Accident rates are high on Libya’s road network. Road accidents reported by traffic police are relatively well documented, and statistics show that the number of accidents per year is about 12,000, with about 1,800 fatalities (Table 8.2). The situation has been relatively stable over the last four to five years, with a 30 percent increase since 1998 (Annex E). This is unusual given the increase in the vehicle fleet by a factor of 7 over the same period, and would also indicate a decrease in the distance traveled. There were 1,224 fatalities in 1998, meaning 61 deaths per 10,000 vehicles, which is extremely high by any standards. Currently, the fatality rates are more in line with regional rates. 8.14 Statistical information on accidents could be more comprehensive. Very few papers dealing with road traffic safety in Libya are available. One paper, dated October 2006 (El Fellah 2006), indicates that high speeds and driver mistakes cause 70 percent of accidents in Libya. Almost a third of all accidents have no identified cause. In other countries in the region with high accident rates (Egypt and Iran), many of the fatal accidents are related to overtaking traffic on two lane highways with high traffic volumes. The statistics provided should be considered preliminary, pending more in-depth surveys and analysis.
Table 8.2. Traffic Accident Data
Tunisia* Algeria* Morocco* Libya France Italy Population (million) 9,931 32,000 29,892 6,000 59,900 57,690 Automobile Fleet (million) 984 3,100 1,951 1,900 35,144 38,058 Accidents Reported 12,127 43,227 51,687 11,643 105,470 237,812 Fatalities 1,585 4,343 3,894 1,785 7,654 6,736 Fatalities per 10,000 vehicles 16 14 20 14 2.2 1.8 *Data from 2004. Source: Police reports.
8.15 Axle load limits/control of overloading limited. The trucking industry is benefiting from very low road user charges that are unrelated to distance traveled or to truck or axle loads. This situation is compounded by the very low overloading penalties imposed, unrelated to the degree of overloading and distance travelled. There has been very little control of axle loads in the absence of permanent weigh stations or mobile scales. The control of heavy vehicle weights was based on documentation carried by the driver, and the extent of overloading and damage to road pavements are, therefore, not well documented. This policy entices truckers to overload, rather than to discourage, abuses of the road network. GPCT is in the process of addressing truck overloading on the road network and developing an axle-load control policy. Legislation was approved in 2007 giving GPCT the authority to control axle loads and even offload excess loads. A network of axle load control stations is under construction and legislation is being prepared to increase overloading penalties significantly.
III. The Institutional Framework and Its Accountability 8.16 Road sector management has been affected by frequent administrative and institutional changes. Libya’s inner administrative borders have undergone several changes during the last 20 years. The latest ones were enacted in 2007 and affected the responsibilities of the 22 shaabiats. The General People’s Committee on Transport (GPCT) is the central secretariat in charge of transportation and transport infrastructure. Several public agencies and transport corporations are under the control of the GPCT, including the Roads and Bridge Department (RBD). Briefly, GPCT’s main responsibilities are the

159
planning and implementation of programs, the regulation of passenger and freight transport, and the monitoring and evaluation of sector activities. Additional information on administrative borders and institutional responsibilities is provided in Annex E in Volume III. 8.17 Responsibilities for expenditure management are shared. Recently created, (Decree No. 143 of 2005), the RBD has become the institution officially in charge of the road sector including the planning, programming, budgeting, and implementation of road investments. The RBD is set up like an external directorate of the GPCT. Furthermore, the responsibility for the management of road assets, including maintenance expenditures, seems unclear; not only the shaabiats, the RBD and its eight regional offices, and the GPCT have roles in the planning, programming, and budgeting operations, but the General Peoples’ Committee for Planning (GPCP), the Secretariat of Finance, and the Prime Minister’s Office are also involved in certain projects and types of expenditure (maintenance, toll roads, and public-private partnerships [PPP]). The frequent changes in administrative borders in the past further complicate the situation. 8.18 The Roads Department’s management structure has changed several times over the past years, and this has negatively affected the retention of qualified staff, caused loss of documents, information and road data, and made development of a clear strategy for the sector difficult. At the shaabiats level, eight regional RBD offices carry out road management tasks, each being in charge of two or more shaabiats.Those regional units are responsible for day-to-day project management and coordination with the shaabiats (Annex E) and this arrangement is apparently working well. 8.19 Experienced technical staff is lacking. At both the central and regional levels of the RBD, there is a shortage of experienced technical staff, considering the size of the road network. The agency employs 96 engineers, of which about 60 are spread among the 8 regional offices. The RBD is planning to hire another 130 engineers and technicians, but the general lack of experienced engineers and technical staff in Libya is making this difficult. The main reasons seem to be the current civil service compensation policies and poor professional career development prospects. There are also signs that key managerial appointments in the road sector are not based mainly on merit, and this may also be a factor discouraging recruitment to the sector. The Department annually develops a training program for staff in all technical, administrative and financial fields with the aim to enhance capacities. The Department is also in the process of preparing a financial regulation to improve staff salaries following the practice of other relevant agencies. 8.20 The RBD is largely turning to the private sector. A significant institutional strength is the fact that the RBD is relying on local and international consulting firms to undertake feasibility and design studies, preparing tender documents, and carrying out supervision of works both for all new investments and the rehabilitation or reconstruction of existing roads. Sometimes these firms, however, are managed by public corporations with no road management responsibilities. Resolving contractual disputes can, therefore, take considerable time, even in cases where studies provide critical management information such as road condition data. 8.21 The responsibility for urban road management is distorted. Urban and municipal roads fall under the purview of the Housing and Infrastructure Board (HIB). This agency, established in April 2006, is under the trustee of the GCPT as far as roads are concerned, and is uniquely in charge of construction and rehabilitation works (roads, habitat, and others) within urban agglomerations. The HIB’s Roads Department is responsible for contracting out urban road consulting and contracting services. However, this entity is only involved in urban roads investments, while the preservation and regular maintenance of urban road assets are under the responsibility of the Housing and Utilities General Corporation (HUGC), which is part of the Prime Minister’s Office. This distorts incentives, because the consequences of poor maintenance, in terms of high rehabilitation and reconstruction costs, are not shouldered by the budgeting

160
agency responsible for the (under-) funding of maintenance. Such a situation often results in suboptimal allocations of resources, and could cause both massive losses of urban road assets and much higher vehicle operating costs that most often far exceed funds saved through reduced spending on maintenance. 8.22 Funding arrangements do not include preventive maintenance. The consolidated budget is financing construction costs of all new roads and the rehabilitation of existing roads. In the past, the government has not used borrowing to finance road investments. Although road funding is generally adequate, there have been no budget allocations to regular road maintenance for many years, except for the renewal of road signs and road markings that are considered routine maintenance. For preventive maintenance, such as resealing or replacement of worn stretches on paved roads, normally called periodic maintenance, there are no specific allocations. Due to this inefficient allocation of resources, road pavements are left unattended until major rehabilitation works or reconstruction works are needed, at significant extra costs. 8.23 A multiyear planning framework has been lacking. No such plan was developed between 1985 and 2007. Too many projects are planned and implemented at once. For secondary and tertiary roads, shaabiats do not seem to apply planning procedures to select investments or maintenance projects. For new construction or rehabilitation investments, shaabiats conduct simple studies and transfer results to the RBD for adoption in future programs. Projects not considered feasible are reportedly rejected. For primary roads, the RBD undertakes studies for new road projects. It forwards projects proposed for implementation to the GPCP on a first-come, first-served basis. GPCP transfers them, in turn, to the Secretariat of Finance. 8.24 The government does not practice investment programming under budget constraints in the roads sector. Particularly for the next few years, the expected funding may likely be a stronger constraint than implementation capacity (except possibly for the availability of construction materials). This could create unreasonable expectations of benefits from large new investment programs that cannot be fulfilled due to institutional capacity constraints, or poor quality of works due to inadequate construction supervision. 8.25 A rationalization of the investments program based on explicit policies and strategies could improve investment efficiency. Such policies could also form the basis upon which the government would establish/restructure and integrate sector institutions, and formulate projects for the development of other transport subsectors in the short to medium term. That could initially be in the form of a Road Sector Development Program (Master Plan), with an annual update based on a multiyear expenditure framework. There seems to be a distortion between the proposed supplies of road infrastructure and actual demands (needs), although this needs to be verified. A Road Master Plan would do this and would remove the risks of suboptimal outcomes of large investment programs. 8.26 The selection of consulting firms seems to follow good international practice. Invitations to prepare proposals appear regularly in public newspapers, and engineering offices are short-listed or contractors prequalified for large and technically complicated projects. Choosing a firm is done in two steps. First, the agency carries out a technical evaluation on the basis of a given number of criteria relative to equipment, materials, human resources, execution deadlines, and financial capacity. Second, a financial evaluation is carried out on the basis of the financial offer and proposed payment schedule. Short-listed firms are invited to the opening of the financial proposals. 8.27 Strengthening the management of technical assistance would improve effectiveness. Discussions with representatives of consulting firms, a contractor, and government staff reveal that service providers to RBD have lately encountered the following difficulties in the sector:
• Poor institutional capacity, delaying comments on draft technical reports.

161
• Excessively short deadlines for studies and civil works completion set by the Libyan authorities often result in poor quality of works, delays to rectify deficiencies, and nonconformity with international technical standards.
• The RBD is reportedly slow in resolving contract disputes and claims, leading to frequent delays in the execution of works.
• Contractual payments for services are not processed in a timely manner and disbursements can take months.
• The above factors are complicated by the involvement of public corporations in undertaking and managing engineering studies, a role that is not well understood and may cause conflicts of interest while inhibiting private sector growth.
The Department is in the process of contracting out capacity development services in various fields to an international consulting firm to address the administrative constrains reported.
8.28 For urban projects, the HUGC often tenders a “package” of works for road/street construction, utility relocation, and street lighting. This often requires extensive subcontracting by the successful bidder and the mobilization of appropriately qualified construction supervision staff to address added difficulties and workload, due to more contractual disputes relative to subcontracting. Current arrangements and workload in urban areas also often result in delayed payments, extensions of time for completion, and sometimes poor quality of construction. 8.29 Private sector participation in the road sector is expected to increase. The private sector’s contribution to the Libyan economy is, generally, low. Private investments have barely exceeded 2 percent of GDP during the last five years (see Section V). In many countries, implementation of laws and regulations designed to promote the private sector has been disrupted by the following factors:
• A financial environment only partly meeting the expectations and obligations of the private sector.
• The reluctance of several public corporations’ administrative councils to adopt the provisions of the laws.
• The poor employment opportunities for the labor force of public corporations to be privatized.
• The reluctance of management of public monopolies to accept being exposed to competition for work.
8.30 The private sector does not contribute to investments in the road sector, but contributes significantly in providing consulting and contracting services. The GPCT plans to introduce public-private partnerships (PPPs) in the financing and implementation/operation of road infrastructure. A contract has been signed with a highway service company to operate and complete Ajdabiya/Tobruk highway to take advantage of the economic return of such a road and to make use of the income in maintenance, improvement and in making the road safer. It is considered as a pilot project that may be expanded later. A Public Private Partnership is a contractual mechanism allowing private sector participation (PSP) in an otherwise typical public sector domain via appropriate risk sharing mechanisms. There are several options for PSP in the road sector (Figures 8.2 and Table K.1 in Annex K). Boxes 8.1-8.3 summarize three experiences from Eastern Europe, Chile and China.
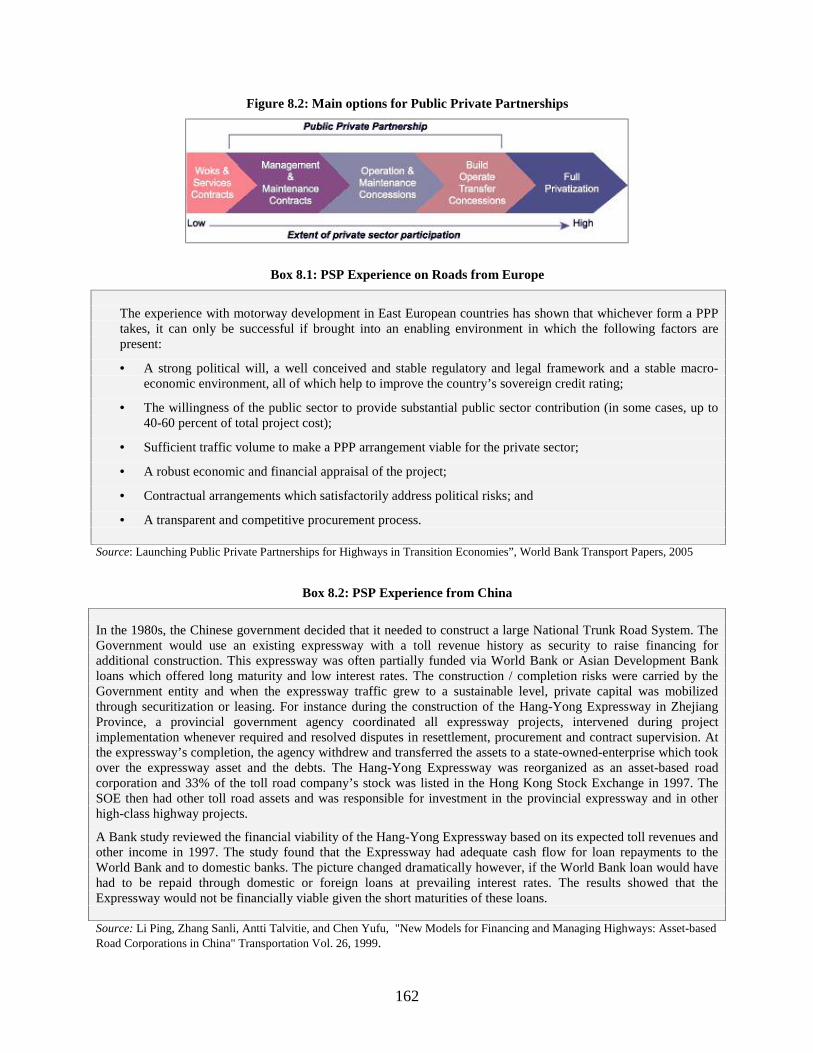
162
Figure 8.2: Main options for Public Private Partnerships
Box 8.1: PSP Experience on Roads from Europe
The experience with motorway development in East European countries has shown that whichever form a PPP takes, it can only be successful if brought into an enabling environment in which the following factors are present:
• A strong political will, a well conceived and stable regulatory and legal framework and a stable macro-economic environment, all of which help to improve the country’s sovereign credit rating;
• The willingness of the public sector to provide substantial public sector contribution (in some cases, up to 40-60 percent of total project cost);
• Sufficient traffic volume to make a PPP arrangement viable for the private sector;
• A robust economic and financial appraisal of the project;
• Contractual arrangements which satisfactorily address political risks; and
• A transparent and competitive procurement process.
Source: Launching Public Private Partnerships for Highways in Transition Economies”, World Bank Transport Papers, 2005
Box 8.2: PSP Experience from China
In the 1980s, the Chinese government decided that it needed to construct a large National Trunk Road System. The Government would use an existing expressway with a toll revenue history as security to raise financing for additional construction. This expressway was often partially funded via World Bank or Asian Development Bank loans which offered long maturity and low interest rates. The construction / completion risks were carried by the Government entity and when the expressway traffic grew to a sustainable level, private capital was mobilized through securitization or leasing. For instance during the construction of the Hang-Yong Expressway in Zhejiang Province, a provincial government agency coordinated all expressway projects, intervened during project implementation whenever required and resolved disputes in resettlement, procurement and contract supervision. At the expressway’s completion, the agency withdrew and transferred the assets to a state-owned-enterprise which took over the expressway asset and the debts. The Hang-Yong Expressway was reorganized as an asset-based road corporation and 33% of the toll road company’s stock was listed in the Hong Kong Stock Exchange in 1997. The SOE then had other toll road assets and was responsible for investment in the provincial expressway and in other high-class highway projects.
A Bank study reviewed the financial viability of the Hang-Yong Expressway based on its expected toll revenues and other income in 1997. The study found that the Expressway had adequate cash flow for loan repayments to the World Bank and to domestic banks. The picture changed dramatically however, if the World Bank loan would have had to be repaid through domestic or foreign loans at prevailing interest rates. The results showed that the Expressway would not be financially viable given the short maturities of these loans.
Source: Li Ping, Zhang Sanli, Antti Talvitie, and Chen Yufu, "New Models for Financing and Managing Highways: Asset-based Road Corporations in China" Transportation Vol. 26, 1999.
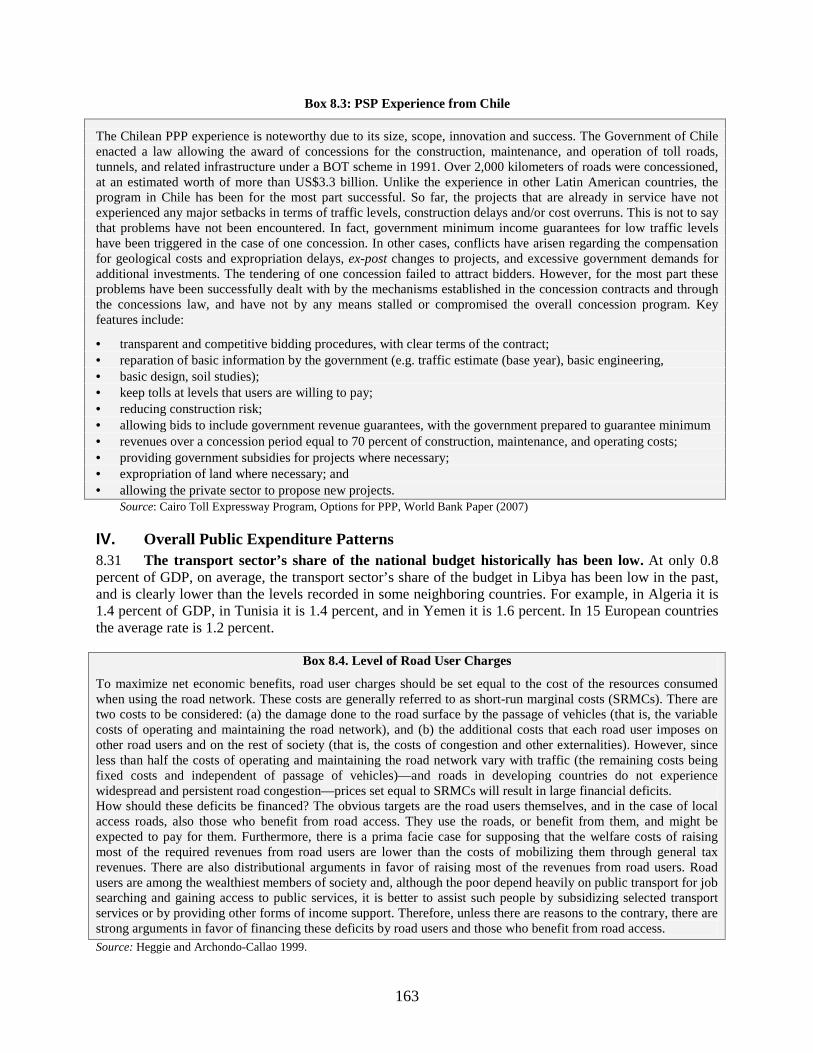
163
Box 8.3: PSP Experience from Chile
The Chilean PPP experience is noteworthy due to its size, scope, innovation and success. The Government of Chile enacted a law allowing the award of concessions for the construction, maintenance, and operation of toll roads, tunnels, and related infrastructure under a BOT scheme in 1991. Over 2,000 kilometers of roads were concessioned, at an estimated worth of more than US$3.3 billion. Unlike the experience in other Latin American countries, the program in Chile has been for the most part successful. So far, the projects that are already in service have not experienced any major setbacks in terms of traffic levels, construction delays and/or cost overruns. This is not to say that problems have not been encountered. In fact, government minimum income guarantees for low traffic levels have been triggered in the case of one concession. In other cases, conflicts have arisen regarding the compensation for geological costs and expropriation delays, ex-post changes to projects, and excessive government demands for additional investments. The tendering of one concession failed to attract bidders. However, for the most part these problems have been successfully dealt with by the mechanisms established in the concession contracts and through the concessions law, and have not by any means stalled or compromised the overall concession program. Key features include:
• transparent and competitive bidding procedures, with clear terms of the contract; • reparation of basic information by the government (e.g. traffic estimate (base year), basic engineering, • basic design, soil studies); • keep tolls at levels that users are willing to pay; • reducing construction risk; • allowing bids to include government revenue guarantees, with the government prepared to guarantee minimum • revenues over a concession period equal to 70 percent of construction, maintenance, and operating costs; • providing government subsidies for projects where necessary; • expropriation of land where necessary; and • allowing the private sector to propose new projects.
Source: Cairo Toll Expressway Program, Options for PPP, World Bank Paper (2007)
IV. Overall Public Expenditure Patterns 8.31 The transport sector’s share of the national budget historically has been low. At only 0.8 percent of GDP, on average, the transport sector’s share of the budget in Libya has been low in the past, and is clearly lower than the levels recorded in some neighboring countries. For example, in Algeria it is 1.4 percent of GDP, in Tunisia it is 1.4 percent, and in Yemen it is 1.6 percent. In 15 European countries the average rate is 1.2 percent.
Source: Heggie and Archondo-Callao 1999.
Box 8.4. Level of Road User Charges
To maximize net economic benefits, road user charges should be set equal to the cost of the resources consumed when using the road network. These costs are generally referred to as short-run marginal costs (SRMCs). There are two costs to be considered: (a) the damage done to the road surface by the passage of vehicles (that is, the variable costs of operating and maintaining the road network), and (b) the additional costs that each road user imposes on other road users and on the rest of society (that is, the costs of congestion and other externalities). However, since less than half the costs of operating and maintaining the road network vary with traffic (the remaining costs being fixed costs and independent of passage of vehicles)—and roads in developing countries do not experience widespread and persistent road congestion—prices set equal to SRMCs will result in large financial deficits. How should these deficits be financed? The obvious targets are the road users themselves, and in the case of local access roads, also those who benefit from road access. They use the roads, or benefit from them, and might be expected to pay for them. Furthermore, there is a prima facie case for supposing that the welfare costs of raising most of the required revenues from road users are lower than the costs of mobilizing them through general tax revenues. There are also distributional arguments in favor of raising most of the revenues from road users. Road users are among the wealthiest members of society and, although the poor depend heavily on public transport for job searching and gaining access to public services, it is better to assist such people by subsidizing selected transport services or by providing other forms of income support. Therefore, unless there are reasons to the contrary, there are strong arguments in favor of financing these deficits by road users and those who benefit from road access.
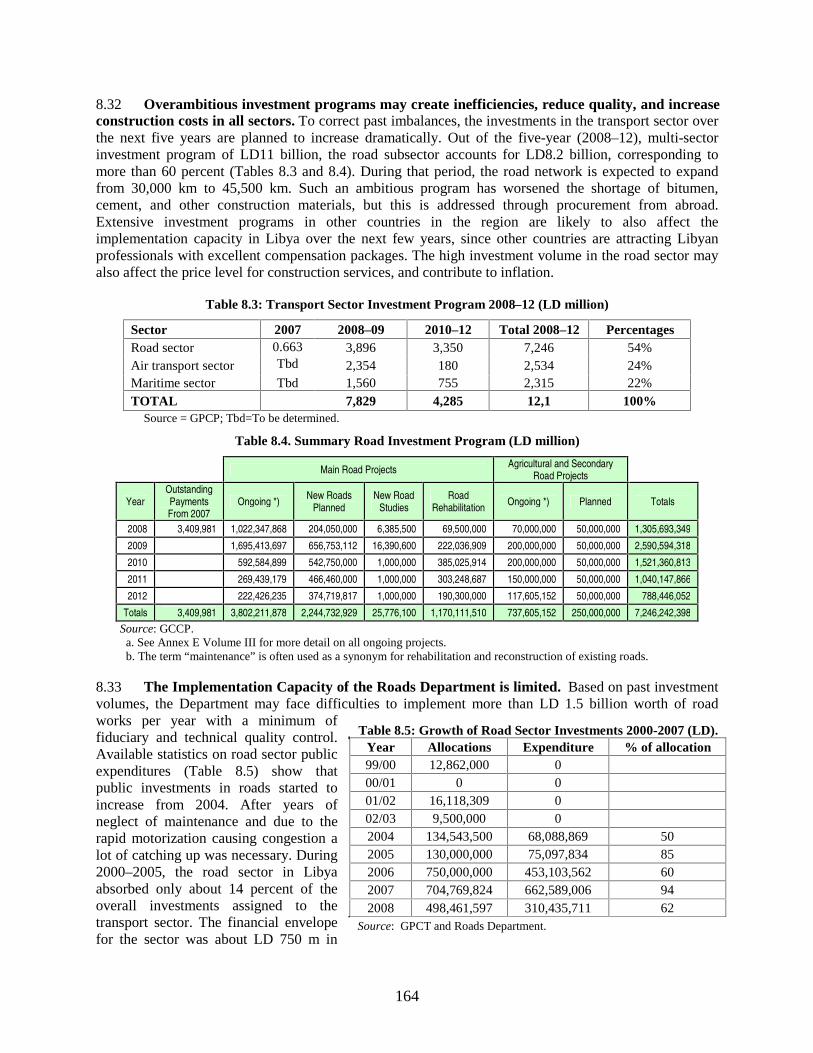
164
8.32 Overambitious investment programs may create inefficiencies, reduce quality, and increase construction costs in all sectors. To correct past imbalances, the investments in the transport sector over the next five years are planned to increase dramatically. Out of the five-year (2008–12), multi-sector investment program of LD11 billion, the road subsector accounts for LD8.2 billion, corresponding to more than 60 percent (Tables 8.3 and 8.4). During that period, the road network is expected to expand from 30,000 km to 45,500 km. Such an ambitious program has worsened the shortage of bitumen, cement, and other construction materials, but this is addressed through procurement from abroad. Extensive investment programs in other countries in the region are likely to also affect the implementation capacity in Libya over the next few years, since other countries are attracting Libyan professionals with excellent compensation packages. The high investment volume in the road sector may also affect the price level for construction services, and contribute to inflation.
Table 8.3: Transport Sector Investment Program 2008–12 (LD million)
Sector 2007 2008–09 2010–12 Total 2008–12 Percentages Road sector 0.663 3,896 3,350 7,246 54% Air transport sector Tbd 2,354 180 2,534 24% Maritime sector Tbd 1,560 755 2,315 22% TOTAL 7,829 4,285 12,1 100%
Source = GPCP; Tbd=To be determined.
Table 8.4. Summary Road Investment Program (LD million)
Main Road Projects Agricultural and Secondary Road Projects
Year Outstanding Payments From 2007
Ongoing *) New Roads
Planned New Road
Studies Road
Rehabilitation Ongoing *) Planned Totals
2008 3,409,981 1,022,347,868 204,050,000 6,385,500 69,500,000 70,000,000 50,000,000 1,305,693,349
2009 1,695,413,697 656,753,112 16,390,600 222,036,909 200,000,000 50,000,000 2,590,594,318
2010 592,584,899 542,750,000 1,000,000 385,025,914 200,000,000 50,000,000 1,521,360,813
2011 269,439,179 466,460,000 1,000,000 303,248,687 150,000,000 50,000,000 1,040,147,866
2012 222,426,235 374,719,817 1,000,000 190,300,000 117,605,152 50,000,000 788,446,052
Totals 3,409,981 3,802,211,878 2,244,732,929 25,776,100 1,170,111,510 737,605,152 250,000,000 7,246,242,398
Source: GCCP. a. See Annex E Volume III for more detail on all ongoing projects. b. The term “maintenance” is often used as a synonym for rehabilitation and reconstruction of existing roads.
8.33 The Implementation Capacity of the Roads Department is limited. Based on past investment volumes, the Department may face difficulties to implement more than LD 1.5 billion worth of road works per year with a minimum of fiduciary and technical quality control. Available statistics on road sector public expenditures (Table 8.5) show that public investments in roads started to increase from 2004. After years of neglect of maintenance and due to the rapid motorization causing congestion a lot of catching up was necessary. During 2000–2005, the road sector in Libya absorbed only about 14 percent of the overall investments assigned to the transport sector. The financial envelope for the sector was about LD 750 m in
Table 8.5: Growth of Road Sector Investments 2000-2007 (LD). Year Allocations Expenditure % of allocation 99/00 12,862,000 0 00/01 0 0 01/02 16,118,309 0 02/03 9,500,000 0 2004 134,543,500 68,088,869 50 2005 130,000,000 75,097,834 85 2006 750,000,000 453,103,562 60 2007 704,769,824 662,589,006 94 2008 498,461,597 310,435,711 62
Source: GPCT and Roads Department.

165
2006 (actual exp. 450 m), LD 700 m in 2007 (actual exp. 660 m) and LD 500 m in 2008 (actual exp. 310 m) compared to LYD 130 m in 2004 and 2005 of which only half was actually spent. 8.34 The implementation status of road investment is unclear. Table 8.4 above shows a small concentration of investments (ongoing) planned to be disbursed during the first two years of the 2008-12 program period (2.7 billion). In addition comes more than one billion of new roads and road rehabilitation. This is partly due to the large backlog of road rehabilitation works, caused by neglect of regular routine and periodic maintenance for many years. The Roads Department and GPCT staff has confirmed that contracts for already ongoing projects amount to 4.5 billion in the investment program leaving only 3.7 billion to be contracted (see the list of contracted works in Annex 8, Volume III). There is therefore little room in the short term to medium term (next five years) to make desirable changes to the road budget. 8.35 The following are among the main priorities of the development program:
• Reduction of outstanding contractual obligations on roads and bridge projects under implementation.
• Address the backlog of works caused by past neglect of periodic and emergency maintenance of existing roads. To start with the most important and the most seriously affected roads in terms of construction and functionality and the provision of the necessary equipment for safety and to control the loads passing through (new weighbridges).
• Carry out necessary widening of existing roads with congestion and road crashes to improve the performance level and to prolong the lifespan of the roads.
• Conduct the necessary studies and develop designs and tender documents.
• Construct agricultural and secondary roads to link population centers and productive areas and improve connections to the current road network.
8.36 The appropriateness of technical standards used and economic feasibility are at risk. All new highway investments are subjected to an economic evaluation carried out by consulting firms. Although very little information is available, there are reasons for concern, because consultants undertaking feasibility studies are often retained to prepare the detailed design and carry out the supervision of works. This lack of independence and objectivity at the feasibility stage may cause conflicts of interest and affect the study results. That could lead to higher-than-necessary technical standards and unrealistic traffic projections, especially when the consultant’s fee is a percentage of the project costs. The current pressure on the RBD to disburse budgeted road funds on already awarded contracts over a relatively short period may also entail a relaxation of the normal requirements for analysis of viability and quality assurance arrangements during construction. 8.37 The appropriate level of budget spending on roads is to be determined. In an attempt to assess the appropriateness of the current annual level of expenditures for roads (investments and maintenance), we carried out a short analysis using a simple methodology based on comparator countries, which is considered to be a reasonable approach to get approximate financial requirements (Box 8.5). The premise of this methodology is to examine countries with similar characteristics, such as GDP per capita, length of road network, road network per capita, and/or population levels. For the preliminary review, we selected countries having a GDP per capita in the US$8,000 to US$12,000 range.

166
Box 8.5. Defining an Appropriate Level of Spending for the Libyan Road Sector
A simple methodology using comparator countries, which is considered to be a reasonable approach, is often selected to approximate financial requirements. The premise of this methodology is to examine countries with similar characteristics, such as GDP per capita, length of road network, road network per capita, and/or population levels. For this preliminary review, a comparison of GDP per capita was selected. This assessment provides only a rough estimate of financing needs in the sector, and investment and/or budget decisions should not be based solely on the estimates contained herein. The purpose is to provide an order of magnitude of financial needs in the sector until a more detailed assessment can be conducted.
Comparator Countries
8.38 According to World Bank guidelines, Libya can be classified as an Upper-Middle-Income Country, because it is slightly above the upper limit for a Middle-Income Country, with US$12,000 in GDP per capita.95 Within this category, countries with reliable figures on past spending in the road sector were identified. As a result, 12 countries were selected as comparators to Libya. Table 8.6 shows that, on average, the Upper-Middle-Income Countries included in this assessment spent around 0.7 percent of GDP on new road construction (investments), and about 0.5 percent of GDP to maintain existing road assets.
Table 8.6: Road Sector Expenditure in Selected Middle-Income Countries (as a % of GDP)
Countries
GDP (Million current
US$)
GDP per Capita
(Current US$)
New Construction
(Million current US$)
Maintenance (Million
current US$)
Exp. on New Construction (% of GDP)
Exp. on Maintenance (% of GDP)
Lithuania (2001) 12,146 3,498 52.2 59.3 0.43 0.49 Latvia (2006) 20,116 5,681 179.2 125.3 0.89 0.62 Poland (2003) 216,545 4,783 1001.3 1189.3 0.46 0.55 Bulgaria (2003) 19,986 1,840 54.2 46.5 0.27 0.23 South Africa (2004) 216,443 3,301 1389.7 2496.3 0.64 1.15 Czech Republic (2000)
56,721 5,521 1033.2 1043.6 1.82 1.84
Estonia (2005) 13,748 6,211 119.8 52.4 0.87 0.38 Hungary (2002) 66,621 5,126 20.4 54.4 0.03 0.08 Peru (2004) 69,686 2,277 226.6 111.1 0.33 0.16 Slovakia (2004) 42,017 4,467 337.6 90.7 0.80 0.22 Turkey (2005) 363,370 3,425 2942.1 299.1 0.81 0.08 Ukraine (2005) 86,142 962 589.6 219.9 0.68 0.26 Total Average 98,628 3,924 0.67 0.51 Libya (2006) 50,320 11,622 670.0 (over the last 5 years) 0.37
Source: International Road Federation Database, May 2005. 8.39 It should be remembered that most of the countries included in Table 8.6 have established consistent records of sustained investment in new roads and spending on maintenance activities. As a result, the average rates listed may be on the low side for Libya, particularly the amount for maintenance, which has been well below the overall average for years. Estimated Levels of Spending for the Libyan Road Sector 8.40 In seeking to establish appropriate spending ranges for new roads and maintenance activities, a number of factors will affect the amounts needed. For instance, spending for new road construction is influenced by:(a) missing road and bridge links that are considered essential; (b) capacity bottlenecks on heavily traveled sections of the network; and (c) the need to improve connectivity
95 The income range for Middle-Income Countries, as defined by the World Bank, is between US$766 and US$12,000 (2007).

167
throughout the country, and especially access to rural areas. Road maintenance needs are affected by: (a) current road conditions, (b) the backlog of maintenance works, (c) existing and expected traffic levels, and (d) truck overloading. 8.41 Libya’s GDP is estimated to be about US$50 billion for 2007 (IMF 2005). In fiscal year 2007, Libyan authorities spent a total of US$270 million96 on the arterial road network, including US$200 million, or 75 percent of the road budget, on capital expenditures, and US$70 million, or 25 percent of the road budget, on what can reasonably be called maintenance activities.97 Assuming an evolution in line with GDP, spending on secondary and rural roads (new construction) would amount to US$40 million (about 15 percent of total expenditures on arterial roads), which brings road sector expenditures to US$310 million. 8.42 Using the average spending figures from Table 8.7 and applying them to Libya’s GDP in 2007, spending on road sector assets would be elevated to around US$350 million per year for road network development and upgrading (7 percent), and about US$250 million per year for preventive maintenance (routine and periodic) of existing assets to keep the network in a steady state with no annual loss of assets (Table 8.8). 8.43 From this initial assessment, it appears that spending to develop and/or upgrade the road network in previous years was on the low side, but for subsequent years (the pipeline), the spending seems excessive and unbalanced for the five-year period. It is also clear that spending to maintain existing road assets has been well below what is needed to preserve a network of the size of Libya’s. 8.44 The 2008-2012 Program seems to underestimate funding needs for maintenance. The subdivision of the road investments program into various components, as illustrated in Table 8.8, and in Annex E in more detail, highlights that the program focuses on highly capital-intensive programs for new highways. Indeed, the components related to maintenance and rehabilitation expenditures do not seem to exceed 10 percent of planned expenditures for the upcoming 2008–12 period; this low level could lead to a further degradation of road pavements and the loss of existing road assets. 8.45 The program seems to underestimate funding needs for regular maintenance. The subdivision of the road investments program in various components, as illustrated in Table 5 above, and in Annex 8 in more detail, highlights that the program focuses on highly capital intensive program for new highways and widening of existing roads. However, the 5 year program does include the backlog of deferred maintenance works that now must be addressed as road rehabilitation and pavement reconstruction. Indeed, the components related to rehabilitation and reconstruction expenditures amount
96 Using an exchange rate of US$1 = LD1.19. 97 World Bank estimate.
Table 8.7: Expenditures in the Libyan Road Sector (in US$ million)Network Development and/or Upgrading
Maintenance Activities
Current Allocations (in 2007)
US$240 million US$70 million
Estimated Needs (annual) US$350 million US$250 million
Source: GPCP.
Table 8.8. Planned Road Sector Development Program Length (km)
Road Type 2007 2012 Growth Rate (%) Primary roads 15,762 24,000 52% Secondary roads 9,500 15,000 58% Other rural roads 4,750 6,500 37% Total 30,012 45,500 52% Source: GPCT – RBA.

168
to 36 percent of planned expenditures for the 2008 – 2012 period. However, expenditures for regular maintenance of the roads not included in the program seem to be missing. 8.46 Assuming about US$ 7,000 per km should be spent every year to maintain paved roads, the annual budget for routine and periodic maintenance should reach US$ 300 million a year at the end of the 5 year Program (about 0.5 percent of 2008 GDP). This corresponds reasonable well to the road user charges collected annually (US$ 180 m covering the short run marginal costs of the network) but the allocations (and preferably RUC) would have to increase to 300 million over 5 years. 8.47 Key unit rates per km for road works compare well with other countries in the region. The cost of construction, rehabilitation and maintenance works is high in desert and mountainous areas but does not seem excessive when compared with cost levels in many other Middle Eastern countries. The average rates provided by the Department are available in Annex 6. This annex shows a wide spread of the cost of new roads per km. The cost tables also show that the cost of periodic maintenance and reconstruction of road pavements reported by the Department are about the same. This may be a misunderstanding. No information is available on the costs per km of pavement resurfacing and other typical maintenance related expenditures. A table of unit rates from different countries/regions has also been added for further development..
V. Searching for Quality: The Efficiency of the Roads Sector 8.48 The sector cost recovery ratio is low. Road users are generally paying for road network access and usage through road tolls, license fees, import duties on vehicles and spare parts, and earmarked fuel surcharges on petroleum products. Tolling of road traffic to recover part of the road investment is not used in Libya.98 License fees are paid every two years for commercial vehicles and every three years for private vehicles. The fees are equivalent to LD18.5 and LD37.5 for, respectively, light and heavy commercial vehicles, and LD16.8 for private cars (annual fees). Customs duties on imported merchandise, which were 35 percent, were abolished on August 1, 2005 and replaced by a 4 percent “port services charge” that must be paid by importers for all products. For motor vehicles (among others) a 2 percent “production tax” and a 25 percent or 50 percent “consumption tax” is also charged, depending on the type of vehicle and the engine size. The consumption tax on imported vehicles can be considered a “road user charge,” because it is considerably higher than the general level of taxation on imports. However, cars, vans, taxis, and pickup trucks with less than 2-liter engines are not supposed to pay more than the 4 percent port charge, which cannot be considered a road user charge. The collection rate and income from these sources are not available, but the consumption tax should significantly contribute to cost recovery from users if it were fully collected. Relevant departments were not able to provide accounts of user charges collected on an annual basis. Estimates provided below for 2005 are based on unit rates, the size of the vehicle fleet, data provided by the customs department, and fuel consumption obtained from the statistics of the General Authority of Information and Telecommunications. Fuel consumption was broken down into 80 percent gasoline (gasoline 98 octane and 95 octane) and 20 percent diesel. The average life of the vehicle fleet has been conservatively estimated at 10 years. It should be noted that the road sector does not receive any of the road use related surcharges or taxes directly or indirectly through some kind of earmarking (Road Fund).
S W B
98 A pilot toll road project is proposed for the main road Ajtabia–Tobrouk (around 380 km) in the Djebel Alakhdar region in the eastern section of the country.
Table 8.9: Comparison of Fuel Prices in Selected Countries (US$/liter)
Destination Libya Algeria Tunisia Morocco
Premium gasoline 98 0.131 0.332 0.992 1.365
Diesel oil 0.123 0.201 0.694 1.222
169
8.49 Gasoline and diesel used in transport are heavily subsidized. Prices of petroleum products were increased in 2007 to 160 dirham99 for premium gasoline and 150 dirham for diesel. These rates are very low compared to neighboring countries (Table 8.9) and the border prices. It means that road users are subsidized, since they are not paying the international market price of energy. In addition, there are no real taxes on petroleum products, because the road users are not paying the real cost of energy at the gas station. But the earmarked surcharges on the price of gasoline in 2005 reached US$80 million, evaluated on the basis of unit consumption (liters per kilometer [l/km]) and of average annual distances (in km) by vehicle type. This represents 0.13 percent of GDP (estimated at US$60 billion at current prices). There is no surcharge on diesel fuel. 8.50 Other road user charges exceed surcharges on fuel.
• Vehicle license feeswere estimated at about US$50 million, of which one-third originates from car users.
• Taxes on vehicle importswere estimated at US$50 million (0.08 percent of GDP) for 2005, based on a cost of imports of US$442 million, an average tax of 11.3 percent per vehicle.100
• About 50 percent of imported cars pay 4 percent (port charges) only. This amount represented 10 percent of the total taxes on foreign trade despite its importance in Libyan imports. The number of annual license fees paid indicates that many acquire new vehicles and trade in old ones for resale. See Annex E in Volume III for details.
8.51 The recovery of short-term marginal costs from users seems adequate. In 2005, Libyan road users paid only about US$180 million in charges for access to and use of the Libyan road network. This compares well with the short-term marginal costs of maintaining a 30,000-km paved road network if one assumes an average maintenance cost of US$6,000 per km per year (see Box 8.4) provided that the funds are actually used on maintenance. However, since there is no surcharge on diesel fuel, the trucking industry, which causes the main damage to road pavement, seems to be cross-subsidized by lighter vehicles. Compared with the LD8.2 billion proposed investment program for new roads and road rehabilitation (2008–12) and other requirements created by the backlog of maintenance works, the level of cost recovery from road users is relatively small. 8.52 The value of road assets is declining. The failure to maintain roads is tantamount to an act of disinvestment, because it implies the sacrifice of past investments in roads. Over the past decades, million of dollars worth of road infrastructure may have been lost in Libya due to inadequate maintenance. Such loss could have been averted with preventive maintenance costing much less than the amount saved on neglecting maintenance. 8.53 Consequently, transport costs are higher. The loss of physical infrastructure is only part of the picture. Roads in bad condition seldom deter users or curb the volume of traffic. Instead, they raise the cost of road transport, the dominant mode of transport for both people and freight. A one dollar reduction in road maintenance expenditures can increase the cost of vehicle operation by two to three dollars. Insufficient spending for maintenance thus exacts hidden costs amounting to several times the cost of maintaining and restoring roads. Road users and ultimately the consumer bear the brunt of these additional costs, which dwarf the savings a road agency can make from deferring or neglecting maintenance (World Bank 1989). Much of the problem of road maintenance in Libya seems to be rooted in institutional traditions, possibly inadequate incentives, and weak accountability, although this needs to be confirmed.
99 1,000 dirham = 1 Libyan dinar. 100 Source: Customs Services.

170
VI. Policy Recommendations 8.54 Increase road budgets significantly in the medium term. In the absence of a road asset management system to determine road budget needs, a comparison with comparator countries was made showing that Libya in the past spent about 0.6-0.8 percent of its GDP less on roads than a modeling approach would recommend (Annex 7). Increasing annual road budgets to between US$ 500 to US$ 600 million after the current investment program is finished would put Libya in line with other countries expenditures on roads. Additional funds could be mobilized through a combination of: reduction and eventually removal of the fuel subsidies; increases in road user charges; reallocation of budget resources from investments to maintenance; and private sector financing. 8.55 Give priority to maintaining and rehabilitating assets. The road budget should give first priority to regular (routine and periodic) maintenance to avoid development of a backlog of rehabilitation works and significantly increases in transport costs for road users. Assuming a future annual maintenance cost of US$ 7,000 per km on classified roads, about US$ 200 m as a minimum should be allocated to routine and periodic maintenance to preserve road asset value and this amount would have to increase gradually as the road network is expanded. This corresponds well to the rough estimates made in Annex 7 using GDP and comparator countries. 8.56 In this respect consideration should be given to the feasibility and desirability of setting up a Road Maintenance Fund for Libya. Many factors need to be assessed in this respect, but a RMF should be considered in the following cases:
• When the road administration is unable to give priority to regular maintenance before new construction.
• When there is a need to mobilize resources and stabilize and safeguard funding for regular maintenance outside the road budget.
• To achieve cost recovery without affecting budgets. 8.57 Several requirements have to be complied with to establish a well functioning RMF. As a first step one should consider undertaking a study to look at all aspects and determine if this is a way forward to give priority to regular maintenance. 8.58 Implement an effective Road Asset Management system. Reliable information on the condition of the network, efficient decision processes based on respective priorities, and prioritization of investments are essential to improve the management of road assets and optimize the usage of funds. This can be achieved through institutional strengthening, outsourcing services, provision of equipment, appropriate technical standards and specifications, and capacity building. The Department has already engaged international consulting firms to assist in setting up a pavement management system for the paved road network in Libya as a first step in implementing such a system. The PMS should also better define the roles of all agencies involved, the degree of decentralization to the eight regional offices, technically appropriate performance standards, equipment needs and the level of involvement of the private sector in operating the PMS and in contract maintenance. 8.59 Prepare a road master plan to guide investment decisions. Road investments should be made according to a master plan with a 10 to 15 years horizon and be regularly updated to take into account trade needs, traffic trends and geographical distribution of population and activities. This plan is critical to harmonize land use planning, capacity investments and transport modes. The first priority would be to: (i)
171
assess the capacity of the arterial network at completion of ongoing investments, (ii) determine possible bottlenecks, and (iii) establish broad priorities to meet transport needs. 8.60 Undertake road investments to improve capacity according to the outcome of technical and economic feasibility studies, realistic traffic projections and projected cost savings to road users.Feasibility studies of each planned investment should include an economic evaluation based on realistic traffic projections and estimated benefits to users and the economy at large, safety gains and environmental externalities. 8.61 Review legislation on and enforcement of axle load limits. Overloaded trucks disproportionately damage road pavement and are the main cause of early degradation of road assets. In addition to revising the structure of fines to impose deterrent penalties on controlled trucks in breach of regulations, new legislation should also allow legal proceedings against truck owners, strengthen enforcement arrangements, and foster a larger awareness of the trucking community on the truck overloading issue. The GPCT and the Roads Department has proposed to amend the Road Law (46) of 1970 to address this. The importance of adopting a modern road law cannot be overemphasized. Key aspects under consideration are:
• functional reclassification of the road network • land acquisition and resettlement • enforcement of axle load limits and new appropriate structure of fines for overloading • user fee collection on major highways • road access regulations for private properties • the limits of the road right-of-way and how to address encroachments
8.62 Mobilize the private sector by piloting private-public partnerships (PPPs) to, for example, operate and maintain tolled highways and to finance part of the backlog of rehabilitation works and maintenance through multiyear performance-based maintenance contracts. So far only a pilot contract has been signed with a highway service company to operate and complete the Aidabia – Tobruk road. Given the limited public maintenance workforce, equipment pools, and conventional maintenance traditions, and the weak institutional capacity, the private sector participation option should be explored urgently for road maintenance through management contracts, and eventually for operation and maintenance concessions of tolled highways. This would address multiple issues such as the constant depreciation of existing road assets and high road user costs due to road deterioration, and would free up human resources in road agencies to better address development of the network. A strategy with a plan of action for the road sector should be developed as a good starting point. 8.63 Carry out a comprehensive organizational review and simplify institutional arrangements. The development of institutional capacity is a long-term effort that requires stability of institutional arrangements and good national coordination. The government should carry out a comprehensive organizational review before making further adjustments to sector institutions aiming to address overlap and gaps in roles and responsibilities and to propose any changes. This is a matter of urgency, and the review should also address various ways of providing better remuneration to technical staff comparable to the private sector, including the possibility of making the road agency more autonomous from the civil service while keeping it under public control. 8.64 The following matrix provides a summary of policy recommendations for the roads sector. Each of the issues identified in the matrix will give top priority to produce as main output an "Action Plan." The action plans together will form a “Manual” for the sector and serve as a monitoring tool on each individual policy action to be jointly selected and agreed upon. This is the next stage and should be pursued vigorously on a sectoral basis.

172
Table 8.11: Road Sector. Matrix Of Policy Recommendations
Issues Action Plan for the Short Term Recommendations for the Medium TermResponsible InstitutionalEntities
Underfunding of preventive roadmaintenance for years.
Next budget to includespecific priority allocations for routineand periodic maintenance.
General Peoples Committee forPlanning and Finance (GPCPF)and General Peoples Committeefor Transport (GPCT), Roadsand BridgeAuthority (RBA)
Maintenancebacklog largebutundefined. Consequently, roaduser operating costs higher thannecessary.
Defineand adopt amorecomprehensive road assetmanagement policy for Libya.
Implement an effective road asset managementsystem.
RBA
Current investment programoverambitious while,historically, road investments toolow.
(i) Prepareaplanning and budgeting framework.(ii) Carry out a technical assessment of ongoing road contractsto determinequality of works and supervision arrangements.(iii) Preparemanuals and guidelines for project management.
Multiyear planning, programming, and budgeting ofroad expenditures based on an MTEF.
(i) GPCPF and GPCT(ii) RBA(iii) RBA
Investments not prioritized basedon traffic justifications andeconomic returns.
PrepareaRoad Master Plan to guide investment decisions.Prepare terms of referenceand request proposals frominternational consulting industry.
RBA
RBA implementation capacitylow and management oftechnical assistance lacking.
(i) Capacity-building program to improve road management.(ii) Carry out acomprehensiveorganizational review andtraining needs assessment.
MakeRBA moreautonomous.(i) RBA(ii) GPCT with RBA
Urban road managementdistorted.
Review and streamlinearrangements for development andmaintenanceof urban streets.
Housing and InfrastructureBoard
Privatesector participation (PSP)in road sector low.
(i) Review capacities of local contracting and consultingindustries.(ii) Develop astrategy/framework document for PSP in theroad sector.(iii) Develop and implement apilot application ofperformance-based road maintenancecontracting.
Involve theprivatesector moreactively in roadmanagement.
(i) GPCT with RBA(ii) GPCT with RBA(iii) RBA
Relaxed control of axle loadlimits.
(i) Set up axle load control stations in the road network andenforce legislation.
(ii) Review current legislation and enforcementarrangements. Prepare recommendations to strengthenenforcement with revisions to laws and regulations.
(i) RBA with Police(ii) GPCT with Ministry ofInterior
Road User Charges (RUC):Collection rateand income fromthesesources arenot availableand expected to be too low.
Preparean RUC and cost recovery study for Libya includingthe review of various earmarking mechanisms such as a roadfund. Develop terms of reference and an RFP package.
Conduct study and implement agreedrecommendations to get astablesourceof funding formaintenance less dependent on annual road budgets.
GPCPF and RBA jointly.
Traffic accident rates high.
(i) Carry out a road safety management capacity assessment;(ii) Prepareand adopt anational strategy to strengthenmanagement capacity to reduce road traffic accidents throughimprovements in driver education, an awareness program, andremoval of “black spots” (dangerous locations with anaccumulation of accidents) in the road network.
Set up/engage a higher committee for road safety to beresponsible for all traffic safety measures of thestrategy.
GPCT and RBA.

173
Chapter 9: Making Water Use Efficient and Sustainable
Libya’s water infrastructure is at the beginning of a transformation. The sector is emerging from a period characterized by low performance in urban service delivery, poor quality, and limited ability to valorize the large Great Man Made River (GMMR) investment that was intended for irrigation. Utility revenues are low owing to low tariffs, poor collection, and high operating costs. Losses are increasing because of inefficient management and poor demand management. The water sector absorbed approximately 1.4 percent of GDP in subsidies in 2006. About 90 percent of these subsidies went to urban water supply and sanitation. These subsidies are likely to expand as access to urban water and sanitation grows and as substantially more water is made available to farmers. A comprehensive strategy and action plan is needed for irrigation, water supply and sanitation, and water management.
I. Introduction
9.1 Libya’s economic well-being and quality of life depend on safe and reliable public infrastructure in water. Irrigation networks, water pipelines, desalination plants, distribution networks, and related public investment are instrumental in boosting Libya’s productivity, diversification away from oil, and its global economic competitiveness. Facilities that manage water and wastewater are fundamental to sustaining the quality of Libya’s life and health. 9.2 This review takes previous Libyan strategic policy choices as given. The review does not try to address the prior question the economic, social, and environmental soundness of the investment in the Great Man-Made River, nor does it focus on the question of whether the transfer of water from the Nubian Sandstone Aquifer system is more or less viable than desalination. Although these issues should be addressed in a sectoral strategy study, we take the current positions as given and focus the review on the infrastructure policy and institutional framework that is needed to improve the efficiency and effectiveness of spending in the water sector. 9.3 The chapter is organized as follows. The next section reviews Libya’s overall performance in the water sector, including renewable and nonrenewable sources, water for domestic consumption, wastewater and sanitation issues, and the needs of agriculture. The third section considers the fact and consequences of continual institutional change in the water sector, and the need for a sound comprehensive strategy and action plan. The fourth section reviews trends in spending, including the government’s ambitious development program for 2008–12. Looking ahead, the costs of irrigation are considered taking into account the Government’s commitment to increase its production of cereals. The fifth section takes a closer look at the cost of water—in particular, the questions of subsidies and cost recovery. The final section summarizes conclusions and provides key recommendations in the areas of urban water and sanitation, irrigation, and water management. Annexes F and G provide greater detail and provide technical detail on estimation methodology (see Volume III).
II. The Performance of the Water Sector
9.4 Libya is a water-stressed country. With no perennial rivers, it is among the driest and most water scarce regions in the world. Overall, the country obtains its water from four sources—surface water that flows intermittently along wadis, groundwater from shallow deposits, groundwater from deep aquifers, and desalinated seawater. The first two of these sources yield about 600 million cubic meters
174
(MCM) of renewable water out of 5 billion cubic meters overall. By far the largest share is nonrenewable groundwater from ancient aquifers, with virtually no recharge taking place. Groundwater resources along the coast are going down by one to two meters per year. 9.5 Increasing domestic and industrial demand for water has given rise to major investments since the early 1980s. The Great Man-Made River (GMMR) Project has been designed to deliver fossil groundwater from areas of abundance in the south to areas in need in the north. Water pumped from the deep reserves in the Sahara and made available through GMMR is the largest and most exploited source (around 53 percent of total supply); however, Libya’s groundwater resources, like petroleum, cannot be replenished. Desalination now accounts for less than 1 percent of water supply. An additional 600 MCM of wastewater is available annually of which only 40 MCM are being presently treated for reuse on fodder crops, ornamental trees, and lawns. Although all wastewater could be recycled, it would require considerable investments in treatment plants and designated distribution systems. 9.6 Water tables in coastal areas have continuously dropped, and seawater intrusion has increased. The resulting increasing deficits led the Libyan authorities to construct GMMR and to transfer abundant groundwater from the south to the north. Table 1 shows the availability of sustainable resources by water region (as defined by the General Water Authority, GWA), the demand by type of users, and the water balance for the year 2005. Overall, it is estimated that 4,411 million cubic meters (MCM) per year can be withdrawn sustainably. This includes 3,700 MCM of nonrenewable groundwater (primarily from the Southern region and in Al Kafra-Sarir), and 711 MCM of renewable groundwater (about 650 MCM, primarily from the Western and Eastern regions, and 61 MCM of surface water collected in small dams). Thus, total renewable resources amount to only about 104 cubic meters per capita per year, rising to about 775 cubic meters per capita if sustainable nonrenewable groundwater is also included. 9.7 Total water use has risen rapidly in recent years— by more than 1,000 MCM from 1998 to 2005, with domestic use increasing by more than 150 MCM during this period. As shown in Table 1, total water use is high—an estimated 4,922 MCM (2005). Of this amount, 79 percent is used for local agriculture, 14.9 percent is for local domestic and industrial use, and 6.1 percent is used for GMMR transfer to the Eastern and Western regions. 9.8 As shown in Table 9.1, all regions other than Al Kafra-Sarir faced significant water deficits in 2005. The Western region had the greatest deficit, more than 580 MCM per year. Taking into account the offsetting surplus of 831.5 MCM from Al Kafra-Sarir, the overall deficit for 2005 was511 MCM. As a result, Libya will face increasingly severe shortages if the pace of water withdrawal continues at the current pace and no effort is made to reduce demand.
9.9 The seriousness of Libya’s worsening water deficit is shown in comparative perspective in Figure 9.1. Compared with other countries in the Middle East and North Africa, Libya is among the least water-endowed countries of the region, and renewable water resources are expected to drop from about 104 cubic meters per person in 2005 to about 90 cubic meters per person in just 10 years. 9.10 It is important to stress that water demand is only roughly estimated. Information is uncertain because of limited record keeping, lack of evaluation studies, and unstable institutional framework in water resource management and service delivery. Trends in water use have been extrapolated in several surveys. According to GWA (2006), water use in 2005 was estimated at close to 5 BCM, and it grew by 3.3 to 3.5 percent annually from 1975 to 2005.

175
Table 9.1. Water Resources and Use by Water Region, 2005 (in million cubic meters-MCM)
Western region
Central region
Eastern region
Southern region
El Kafra-Serir
Total Share of resources
(%) Available resources-Supply Renewable 475.5 19.5 216.0 711 16.1
Groundwater 450.0 200.0 650 14.7 Surface water 25.5 19.5 16.0 61 1.4
Nonrenewable (groundwater)
50.0 50.0 1,800 1,800 3,700 83.9
Total 525.5 19.5 266 1,800 1,800 4,411 100.0
Use-Demand Share of use (%)
Agriculture 940.0 19.5 306.7 1,913.1 709.0 3,888.3 79.0 Local domestic and industrial use
168.1 282.0 79.5 58.6 145.5 733.7 14.9
GMMR 186.0 114.0 300.0 6.1 Total 1,108.1 301.5 386.2 2,157.7 968.5 4,922.0 100.0
Surplus -582.6 -282 -120.2 -357.7 831.5 -511.0 Sources: GWA, “The Water Situation in the Jamahiriya,” 2006; General People’s Committee, Study of the Water Situation in the Jamahiriya and the Water Resource Management National Strategy (2000-2025), 1999. Desalination not included.
Figure 9.1: International Comparisons of Renewable Water Resources
Expected Renewable Water Resources (2015) (m3/per capita/year)
2,9902,263
1,8081,159
1,035767
641451
391245
158141125128
95
7668
90
TurkeyIraqIran
SyriaLebanonMorocco
EgyptTunisiaAlgeriaOman
PalestineYemenJordan
BahrainQatarLibyaKSAUAE
Source: GPCWEG (2007) based on WaterMarket Middle East and Aquastat information. 9.11 As shown in Table 9.2, water use is dominated by irrigation, which accounts for 78 percent of the consumption. Household water supply accounts for 12 percent of total use, while industrial and other uses represent the remaining 10 percent. Domestic use in the household sector is estimated to be around 600 MCM, with 48 percent coming from GMMR, 48 percent from local groundwater, and 4 percent from desalination. It is increasing at the rapid rate of 4-5 percent annually due to population growth, expanding economic activities, and increasing population coverage by the supply networks. Industrial use is estimated at 500 MCM for 2005. The bulk of this use is by the oil industry—375 of 505 MCM, and is increasing rapidly at more than 8 percent annually. As shown in Table 2, groundwater is the
Renewable Water Resources
(2005) (m 3/capital/year)
32922892
20221426
1150886
752496
440333
213198156145116
9178
104
TurkeyIraqIran
SyriaLebanonMorocco
EgyptTunisiaAlgeriaOman
PalestineYemenJordan
BahrainQatarLibyaKSAUAE

176
main source of supply, accounting for more than 98 percent of total water use, GMMR still accounts for only 389 MCM (less than 8 percent) of total groundwater.101
Table 9.2: Water Resources and Use in Libya, 2005 (MCM/year)
Water Source Agriculture Urban Industry Total Groundwater (Local wells) 3,708 282 505 4,495 Groundwater GMMR 105 284 389 Surface water 61 61 Desalination 27 27
Total (MCM) 3,874 593 505 4,972
Percent of total (%) 77.7 12.1 10.1 100 Source: GWA, “The Water Situation in the Jamahiriya,” 2006; GMMRA, “2008-2012 Investment Program,” 2007; GPCEWG 2007. Note: Because totals in Table 1 are aggregated across regions, they slightly differ from the figures provided here. 9.12 To date, GMMR water has been allocated primarily for urban domestic use. In 2005, the latter use accounted for about 75 percent of the total volume delivered by the two systems already under operation while agriculture consumed the remaining 25 percent, which was far less than the initial objective of making agriculture the major user of GMMR water (80 percent of total GMMR water against 12 percent for the domestic sector and 5 percent for industry). The deviation from the initial objectives is due to the higher priority given to potable water rather than to irrigation, as well as to lagging construction of irrigation networks. 9.13 The agricultural sector relies on both rainfed farming and irrigation for domestic food production. Although Libya is vast in area, less than 2 percent is arable. Limited rainfed agricultural is viable only in the north, where about 1.5 million hectares are used for tree crops (olive, almond, and palm trees), grapes, and some cereals (mainly barley). Irrigated agriculture covers about 309,000 hectares, distributed between 259,000 hectares from private farms and 50,000 hectares from state agricultural projects. As shown in Table 9.3, most private farms are located in the north, while state farms are concentrated in the south. Since the contribution of GMMR water is still very small, these areas are currently irrigated mainly through local wells. Given climate conditions, cheap energy, poor water quality, and inadequate well monitoring, irrigation is inefficient. The average for the entire country exceeds 10,000 cubic meters per hectare per year. In the south, where water requirements are much higher, the ratio exceeds 20,000 cubic meters per year in some areas (FAO, 2005).
Table 9.3: Irrigated Areas by Region (in thousands of hectares)--2005
Area Region Private Public Total Jifarah Northwest 142 0 142 Murzuq Southwest 67 18 Hamada El Hamra North 17 13 30 Al-Kufrah-As-Sarir Southeast 9 19 28 Al Jabal Al-Akdhar Northeast 24 0 24
Total 259 50 309 Sources: FAO, “Libyan Agricultural Competitiveness Assessment,” 2005 (Draft report).
101 However, when GMMR reaches its full capacity in the future—that is, once the five systems are completed and fully utilized—the volume of GMMR water is expected to
reach almost 2,300 MCM per year. According to GMMR Authority planning, total volume extracted and transferred volume is expected to reach over 1,460 MCM by the year
2012.

177
9.14 Water use in the agricultural sector is characterized by loose control over extraction for use in private farming, inefficient irrigation, and allocation of scarce water to crops such cereals that are low value-added as well as water-intensive. The irrigation sector was developed by the private sector, assisted financially through various incentives schemes. The program that began in the early 1980s aimed at boosting agricultural production. As a result, Libya today has between 350,000 and 450,000 hectares under irrigation out of a total 2.2 million hectares of arable land. Irrigated areas are under permanent crops (citrus, fruits trees, fodder, and olives) on 53 percent of the land; under winter crops (pulses, potatoes, vegetables, and cereals) on 35 percent; and the remaining 12 percent are under summer crops (groundnuts, tobacco, and vegetables) using mostly nonrenewable water resources. Publically managed irrigation schemes cover about 50,000 hectares. In addition, new schemes are planned in three areas in the North, which will extend over 117,000 hectares, and eventually expand to 142,000 hectares. Of these areas, which will be all allocated to cereals,109,000 hectares are to be organized in small farms, and 21,000 in large farms. 9.15 The role of agriculture has evolved over the past three decades in a country highly dependent on imports. While the sector contributed about a quarter of GDP in the 1960s, it accounts today for only 5 percent of GDP and 15 to 20 percent of employment. The sector received generous support in the past, including substantial incentives for irrigation equipment, fertilizers, chemicals, seeds, and machinery. The irrigation sector provides about 7 percent of Libya’s food supply, against 18 percent for the rainfed sector. The remainder of food supply, about 75 percent, is imported. Libya imports 90 percent of its cereals, 35 percent of its vegetables, 15 percent of its oil crops, and 5 percent of its fruits (FAO, 2005). 9.16 More than one third of the irrigation infrastructure is not currently in operation. The state supported the development of several major irrigation projects in the 1970s. In its efforts to expand irrigation through increased utilization of groundwater, the government supported the development of more than 50,000 irrigated hectares under publicly funded projects. In addition, the private sector has been investing in small-scale irrigation, covering around 260,000 hectares. Of the 470,000 hectares equipped with irrigation facilities, about 160,000 hectares are not operational for technical, water supply, or other reasons. 9.17 By regional standards, yields of 2.5 tons per hectares in Libya are low. Yields of irrigated wheat and barley in Egypt and Morocco are each about 3.5 and 4 tons per hectare. 9.18 The water infrastructure in Libya is in a critical state. This is due to age, massive leakage in all parts of the system, illegal connections, unstable supply patterns, uncontrolled migration to urban areas, and poor maintenance. The percentage of population with access to piped water supply is inaccurate and varies from 70 percent in urban to 50 percent in rural areas. A national weighted average
based on regional demographic patterns was recently estimated at around 63 percent (GPCEWG, 2007)..These ratios remain, however, only rough estimates, reliable documentation being unavailable due to several changes in the institutional and organizational setup. 9.19 Whatever the precise numbers, water services are in fact inadequate, both in coverage and in quality. There are several reasons. First, most drinking water systems are old, corroded, and provide little to no water to consumers. Second, desalination plants have low utilization rates, with the availability of spare parts a persistent problem. Third, aging wells, pumps and storage tanks are not adequately maintained, leading to frequent interruptions and shutdowns. Fourth, transmission and distribution pipes are also old and poorly maintained. Finally, network losses are considered high, though not reliably assessed or well understood (GPCEWG, 2007). Accurate figures are generally not available; and approximations are inevitable.

178
9.20 Quality of water supply is poor, but access must improve, particularly in rural areas.Although close to two thirds of the population is believed to have access to piped water, the quality remains poor. As shown in Table 9.4, urban water supply per capita varies considerably across regions, ranging from 150 liters consumed daily (l/c/d) to 850 l/c/d, due to both non-uniform coverage rates and frequent supply interruptions. Coverage varies across regions (Shaabiats) as Table 4 shows. The northern regions generally have higher connection ratios than the southern regions. Rural coverage with drinking water services is another aspect that merits consideration. Historically, rural areas have received far less attention than urban areas, which resulted in lower quality of service in addition to lower population coverage.
Table 9.4: Urban Water Supply and Population Coverage in the Jamahiriya (2006)
Shaabiats Population estimate in
millions (2006)
Connected population in
millions (2006)
Connection ratio (%)
Supply (MCM/ year)
Per capita supply (l/c/d)
Great Tripoli 1.52 1.00 66,3 164 446 Sahel Benghazi 0.74 0.50 67.2 133 733 Al Wasta 0.98 0.57 57.7 83 402 Ajdibia &Wahat 0.23 0.15 63.8 37 691 Jebel Al Gharbi 0.4 0.24 60.6 30 339 Syrt & Gufra 0.19 0.12 63.0 27 618 Zaouia Nikat Khams 1.52 1.01 66.3 26 204 Jebel Al Akdhar 0.37 0.24 64.9 19 217 Sabha 0.13 0.09 65.7 14 449 Wadi Shati 0.08 0.04 52.7 13 845 Botnan 0.16 0.10 64.3 13 346 Wadi Hayet 0.08 0.05 56.3 12 730 Wadi Ataba 0.08 0.05 56.1 11 672 Marej & Al Abiar 0.12 0.08 65.4 4 140 Ghat 0.02 0.02 78.7 3 522
Total 5.68 3.58 63.1 589 450? Source: GPCEWG, 2007. 9.21 Water demand patterns are not well known. Accurate studies on demand pattern are not available because water is generally not metered and there are no measurements in distribution networks. Without proper metering, the division between domestic and non-domestic demand cannot be determined. While acknowledging their limited scope in geographic coverage and sample size, methods used for the Study on the Urban Water Strategy (GPCEWG, 2007) yielded averages in the range of 230 to 350 l/c/d. Non-domestic consumption has been estimated at 70 l/c/d. With an estimate of 35 percent for Unaccounted for Water (UfW), supply per capita is between 460 and 650 l/c/d, a measure that is too high by international standards. 9.22 Available information suggests extremely high water consumption in urban areas, either by regional or international standards. If the availability of water at the source is expressed in liters per capita in urban areas,102 it is surprising to find that sources of supply would be more than adequate to satisfy minimal water demand. Water availability at the source is 400 to 465 l/c/d. However, leakage and considerable waste means that a substantial part of the water produced does not actually get used. The country has a significant distribution problem, not just a production problem. Reducing waste that occurs at the distribution level would contribute significantly to easing the shortage problem. Indeed, international experience shows that nearly all problems of water scarcity can be mitigated through better
102 Assuming total urban water supply ranging from 520 to 600 MCM, an average coverage rate of 62 percent for a population of around 5.7 millions in 2006.
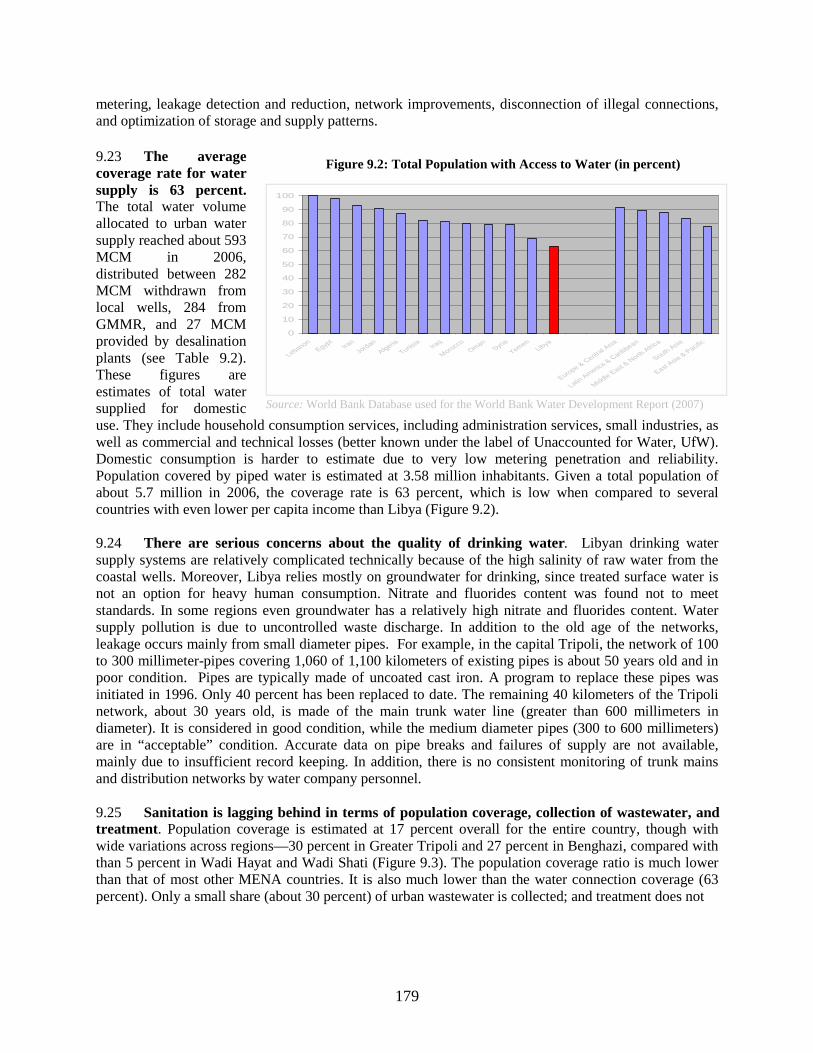
179
metering, leakage detection and reduction, network improvements, disconnection of illegal connections, and optimization of storage and supply patterns. 9.23 The average coverage rate for water supply is 63 percent. The total water volume allocated to urban water supply reached about 593 MCM in 2006, distributed between 282 MCM withdrawn from local wells, 284 from GMMR, and 27 MCM provided by desalination plants (see Table 9.2). These figures are estimates of total water supplied for domestic use. They include household consumption services, including administration services, small industries, as well as commercial and technical losses (better known under the label of Unaccounted for Water, UfW). Domestic consumption is harder to estimate due to very low metering penetration and reliability. Population covered by piped water is estimated at 3.58 million inhabitants. Given a total population of about 5.7 million in 2006, the coverage rate is 63 percent, which is low when compared to several countries with even lower per capita income than Libya (Figure 9.2). 9.24 There are serious concerns about the quality of drinking water. Libyan drinking water supply systems are relatively complicated technically because of the high salinity of raw water from the coastal wells. Moreover, Libya relies mostly on groundwater for drinking, since treated surface water is not an option for heavy human consumption. Nitrate and fluorides content was found not to meet standards. In some regions even groundwater has a relatively high nitrate and fluorides content. Water supply pollution is due to uncontrolled waste discharge. In addition to the old age of the networks, leakage occurs mainly from small diameter pipes. For example, in the capital Tripoli, the network of 100 to 300 millimeter-pipes covering 1,060 of 1,100 kilometers of existing pipes is about 50 years old and in poor condition. Pipes are typically made of uncoated cast iron. A program to replace these pipes was initiated in 1996. Only 40 percent has been replaced to date. The remaining 40 kilometers of the Tripoli network, about 30 years old, is made of the main trunk water line (greater than 600 millimeters in diameter). It is considered in good condition, while the medium diameter pipes (300 to 600 millimeters) are in “acceptable” condition. Accurate data on pipe breaks and failures of supply are not available, mainly due to insufficient record keeping. In addition, there is no consistent monitoring of trunk mains and distribution networks by water company personnel. 9.25 Sanitation is lagging behind in terms of population coverage, collection of wastewater, and treatment. Population coverage is estimated at 17 percent overall for the entire country, though with wide variations across regions—30 percent in Greater Tripoli and 27 percent in Benghazi, compared with than 5 percent in Wadi Hayat and Wadi Shati (Figure 9.3). The population coverage ratio is much lower than that of most other MENA countries. It is also much lower than the water connection coverage (63 percent). Only a small share (about 30 percent) of urban wastewater is collected; and treatment does not
Figure 9.2: Total Population with Access to Water (in percent)
0
10
20
30
40
50
60
70
80
90
100
LebanonEgyp
tIra
nJo
rdanAlgeria
Tunisia Iraq
MoroccoOman
Syria
YemenLibya
Europe & Central A
sia
LatinAmeric
a & Caribbean
MiddleEast
& NorthAfric
a
SouthAsia
EastAsia
& Pacific
Source: World Bank Database used for the World Bank Water Development Report (2007)

180
involve more than 11 percent of the total volume of urban consumption. While treatment design capacity is estimated at 235 MCM (2006), the treated volume does not exceed 44 MCM per year. In other words, the bulk of urban wastewater is not collected; so it ends up discharged untreated in cesspits; or it pollutes groundwater and the sea. This poor state is accounted for by low density of collection networks, old age, and poor maintenance. 9.26 The safety of water supply is a major concern. A study by the National Consulting Bureau analyzed contamination levels in 24 settlements in 2007. The levels of total dissolved solids (TDS) in 18 of the 24 settlements were found to be elevated beyond the established safety standard of 1,000 milligrams per liter. Not surprisingly, areas near the coastline had higher levels of TDS, although many mainland wells were also elevated beyond the accepted safety standard. In addition, 22 out of 24 settlements showed nitrate levels above the standard of 45 milligrams per liter, while 16 showed fluoride levels above the standard of 1.5 milligrams per liter (GPCEWG, 2007). There does not appear to be any systematic filtration or chlorination of well water; and even where chlorination is provided, the process appears to be substandard. Considering the additional contamination risks imposed by poor maintenance of the distribution networks, it is clear that a large number of final consumers are receiving water that is unsafe to drink.
III. The Institutional Framework and its Accountability 9.27 The water sector in Libya is in a state of flux and transformation. Several profound (and sometimes short-lived) institutional changes have taken place over the past five years. Roles, functions, and interrelations have been shaped by Shaabiats involvement in the delivery of services and management of water resources. The main public administration entities in water resources management and irrigation are, first, the General People Committee of Agriculture (GPCA). The Water Resources Department (WRD) is in charge of general policy regarding dams and water resources. It proposes regulations for water usage in irrigation. It prepares water conservation plans and reviews standards for dams operation. Second, the General Water Authority (GWA), which reports to the GPCA, plans groundwater and surface projects. GWA studies ground and surface projects, issues recommendations on groundwater exploitation and allocation, polices licenses, operates wells and drilling, and implements groundwater and surface projects. Third, the General Environment Authority (GEA) is in charge of setting water quality standards. 9.28 Bulk water is provided by two entities. The General Electricity Company of Libya (GECOL) plans, develops, operates, and maintains desalination plants. The Great Man-Made River Authority (GMMRA) develops the bulk water GMMR long-term strategy and supply rates, identifies current and future demand requirements, and sets strategic priorities for investments and water destination. In addition to GMMRA, three related state-owned operation authorities—Benghazi Plain Authority, Central Region Authority, and Jebel Hassaouna Authority—are the operational arms of GMMRA at the regional level.
9.29 The water supply and sanitation sector embarked on an extensive though incomplete institutional reorganization. That included the formation of the General People Committee of
Figure 9.3: Wastewater Population Coverage by Region (2006)
0%
5%
10%
15%
20%
25%
30%
35%
Wadi Shati
WadiAtaba
Wadi Hay
at
Zawiaand Niga
t Khams
Al Jab
al Al Gharbi
Sirte&
GofraSab
ha
Ajdabia
& Wahat
Botnan
Al Jabal A
l Akh
dar
Ghat
Marej &Al Abiar
Al Wusta
Sahel Beng
hazi
Greater Tripoli
Source: GPCEWG (2007).

181
Electricity, Water, and Gas (GPCEWG) in 2005 with the broad mandate to plan water investment and infrastructure, to oversee activities carried by the various providers, and to propose water policies including pricing. There are several major water supply, sanitation services, and infrastructure providers. The Housing and Infrastructure Board (HIB) plans urban water and wastewater service provision, including new connections and new and replacement networks. HIB engages contractors to execute work. It also executes projects related to expansion and refurbishing of distribution networks. The General Service Company (GSC) is paid by HIB to deliver water and wastewater services and to test water quality in the network. GSC operates water and wastewater assets, and bills and manages customers. Ten regional GSCs are in charge of supervising local water and wastewater companies. The regional GSCs cover urban water supply and sanitation as well as a range of other municipals activities, including roads and sidewalk maintenance, solid waste, and public parks. 9.30 The delivery of services in water and wastewater has suffered from the lack of institutional stability. Important changes have occurred over the years in the level of centralization and reporting relationships for water and wastewater (WWW) service delivery companies. In 1999, a national water company (NWC) with regional units reported to the GPC. In 2003, the NWC was split into local companies within the Shaabiats; however, the scope of work of these companies remained limited to water and wastewater. In 2005, the 32 local companies reporting to the Shabiyat were given broader responsibilities including garbage collection and parks maintenance. In 2006, another re-organization took place—local companies became local units within the Shabiyat, reporting to the Housing and Utilities Corporation (HUC). Ongoing changes have depleted institutional memory within the sector. The extent of best practices in leveraging scale across a large territory, the sharing of knowledge among operating units, and the use of homogeneous systems specific to WWW operations could not be capitalized on (GPCEWG, 2007). This cycle of reforms led to the establishment of a new National Water and Wastewater Company (NWWC) in 2008. 9.31 Institutional instability has thus created high uncertainty for the management and planning of the water sector. The frequent restructuring of the sector has also made management less accountable for its performance. Now that urban water and sanitation has been reorganized under the authority of a single Ministry (GPCEWG) it is important to preserve the stability of the new institutional setting and to allow the Ministry and the companies under its authority to plan and manage these activities on a stable basis and to hold them responsible for their performance. 9.32 A water strategy—in the sense of a series of agreed goals and policy components with steps toward the development of a water plan—does not currently exist. A study to create such a strategy was initiated in 1999 with “The Water Situation in the Jamahiriya and a Proposal for a National Strategy for Water Resource Management for 2000-2025” (referred to hereafter as the Water Study and Strategy Proposal, or WSSP-2025 for short). In addition to a core diagnostic and discussion of the main elements of a national water strategy, WSSP-2025 was supposed to provide a vision on desalination, including the need for a company or a public authority to serve as a national desalinated water institution. The WSSP-2025 was discussed and selectively updated in 2006; however, no agreement was reached on the content or form of a comprehensive water strategy. A consolidated action plan for the entire sector did not materialize because divergent views could not be reconciled. 9.33 Nevertheless, a vision is starting to emerge. Stakeholders in Libya have recognized that “water is a national resource that is the base of development and given its strategic nature, water must be conserved and protected”; and in addition, “the current situation is reaching a crisis level incompatible with developmental objective” (National Planning Council, 2003). In the urban water supply and sanitation subsector, the final aim is to “to provide consumers across Libya with access to clean and reliable supplies of water in a cost-effective manner while preserving nonrenewable resources” (NPC, 2003). Given the state of water affairs, the objectives enunciated by the National Planning Council must

182
be aimed at reducing the water deficit—by reducing consumption and stopping water resource degradation. More specifically, the broad directions suggested by the WSSP-2025 are to:
• Reduce the water deficit through a water demand management paradigm
• Develop conventional and nonconventional water resources
• Protect water resources
• Recover the costs of providing water
• Develop human and institutional capacity
• Develop new water legislation
• Develop regional and international technical cooperation in the areas of water resources management and water service delivery.
9.34 A new water strategy must have a set of goals and objectives to achieve. WSSP-2025 suggests a plan aimed at ultimately stopping the deterioration in the quantity and quality of available water. This can be accomplished through efficient, equitable, and sustainable water extraction, allocation, and use. Broadly defined, the plan would address:
• Clear and defined national goals and objectives for water development and service delivery.
• Preservation of water as a scarce resource to be considered a civic duty. Its misuse, waste, or pollution would be defined as a criminal activity subject to stiff penalties.
• Promotion of human and skill development to provide the technical base capable of implementing national strategies for water.
• Desire to have comprehensive subsectoral plans whose implementation would be integrated with all the institutional entities concerned.
• Need to reduce population density per geographical region by developing towns and cities dispersed across the country in order to alleviate urban pressure.
9.35 A consolidated national water strategy and action plan is urgently needed. To meet the challenges and establish a road map to planning and action, Libya needs to form a consensus around the foundations of the strategy and plan. The water strategy must begin with a vision that takes into account the constraints and challenges that the country faces. The basic goals and objectives must be set to that end, and the main direction of necessary changes must be agreed upon before detailed planning and implementation begin. The final water strategy must offer a set of actions that will enable public and private sector institutions to achieve their basic mission. As such, a strategy is qualitative rather than quantitative in nature. It sets out the direction, approach, and policies to be followed. A time-bound program and investment plan should follow soon after.
IV. Overall Public Expenditure Patterns 9.36 There does not appear to be an agreed-upon budgetary planning document. The WSSP-2025 lays out broad objectives and policies, but not medium-term objectives. The latter can be found scattered in program documents variously prepared by GMMRA, HUC, GPCEWG, and other institutions. Three stages are involved in the process: production, transfer, and distribution. 9.37 The Government of Libya plans to raise the water to population coverage ratio from 62 percent (2006) to 72 percent (2012) under its new development plan for water and wastewater
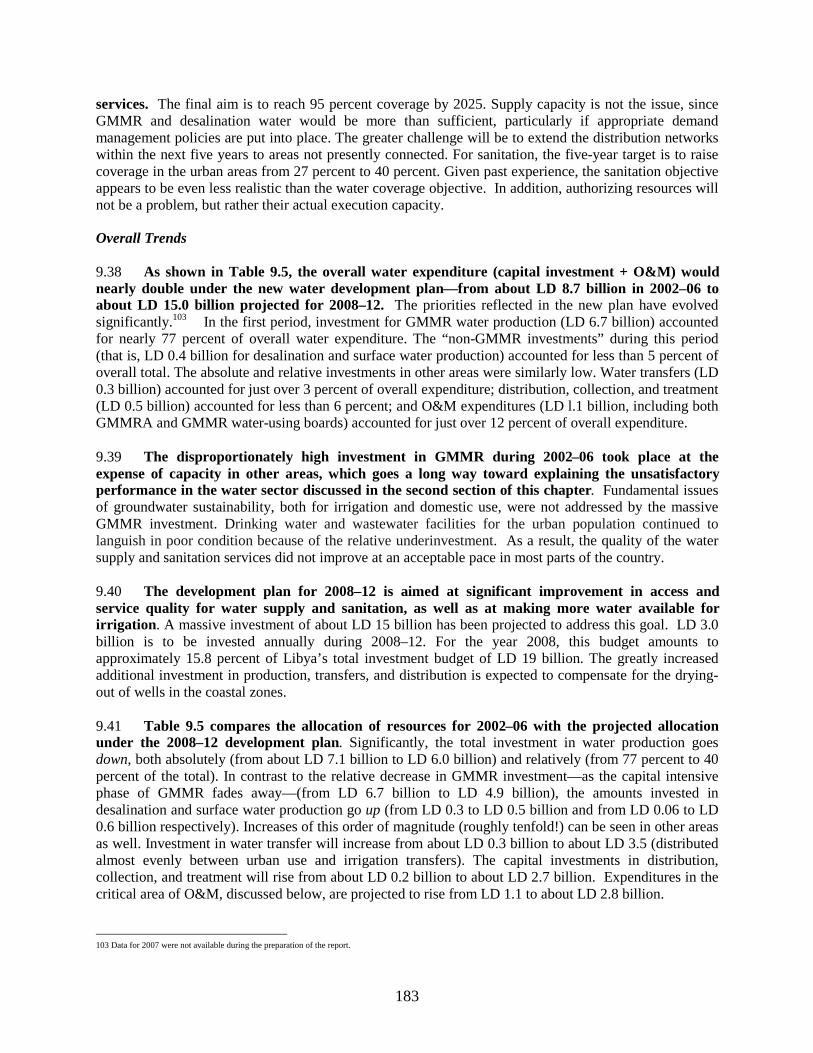
183
services. The final aim is to reach 95 percent coverage by 2025. Supply capacity is not the issue, since GMMR and desalination water would be more than sufficient, particularly if appropriate demand management policies are put into place. The greater challenge will be to extend the distribution networks within the next five years to areas not presently connected. For sanitation, the five-year target is to raise coverage in the urban areas from 27 percent to 40 percent. Given past experience, the sanitation objective appears to be even less realistic than the water coverage objective. In addition, authorizing resources will not be a problem, but rather their actual execution capacity.
Overall Trends 9.38 As shown in Table 9.5, the overall water expenditure (capital investment + O&M) would nearly double under the new water development plan—from about LD 8.7 billion in 2002–06 to about LD 15.0 billion projected for 2008–12. The priorities reflected in the new plan have evolved significantly.103 In the first period, investment for GMMR water production (LD 6.7 billion) accounted for nearly 77 percent of overall water expenditure. The “non-GMMR investments” during this period (that is, LD 0.4 billion for desalination and surface water production) accounted for less than 5 percent of overall total. The absolute and relative investments in other areas were similarly low. Water transfers (LD 0.3 billion) accounted for just over 3 percent of overall expenditure; distribution, collection, and treatment (LD 0.5 billion) accounted for less than 6 percent; and O&M expenditures (LD l.1 billion, including both GMMRA and GMMR water-using boards) accounted for just over 12 percent of overall expenditure. 9.39 The disproportionately high investment in GMMR during 2002–06 took place at the expense of capacity in other areas, which goes a long way toward explaining the unsatisfactory performance in the water sector discussed in the second section of this chapter. Fundamental issues of groundwater sustainability, both for irrigation and domestic use, were not addressed by the massive GMMR investment. Drinking water and wastewater facilities for the urban population continued to languish in poor condition because of the relative underinvestment. As a result, the quality of the water supply and sanitation services did not improve at an acceptable pace in most parts of the country. 9.40 The development plan for 2008–12 is aimed at significant improvement in access and service quality for water supply and sanitation, as well as at making more water available for irrigation. A massive investment of about LD 15 billion has been projected to address this goal. LD 3.0 billion is to be invested annually during 2008–12. For the year 2008, this budget amounts to approximately 15.8 percent of Libya’s total investment budget of LD 19 billion. The greatly increased additional investment in production, transfers, and distribution is expected to compensate for the drying-out of wells in the coastal zones. 9.41 Table 9.5 compares the allocation of resources for 2002–06 with the projected allocation under the 2008–12 development plan. Significantly, the total investment in water production goes down, both absolutely (from about LD 7.1 billion to LD 6.0 billion) and relatively (from 77 percent to 40 percent of the total). In contrast to the relative decrease in GMMR investment—as the capital intensive phase of GMMR fades away—(from LD 6.7 billion to LD 4.9 billion), the amounts invested in desalination and surface water production go up (from LD 0.3 to LD 0.5 billion and from LD 0.06 to LD 0.6 billion respectively). Increases of this order of magnitude (roughly tenfold!) can be seen in other areas as well. Investment in water transfer will increase from about LD 0.3 billion to about LD 3.5 (distributed almost evenly between urban use and irrigation transfers). The capital investments in distribution, collection, and treatment will rise from about LD 0.2 billion to about LD 2.7 billion. Expenditures in the critical area of O&M, discussed below, are projected to rise from LD 1.1 to about LD 2.8 billion.
103 Data for 2007 were not available during the preparation of the report.

184
Table 9.5: Capital and O&M Expenditures on Urban Water, Wastewater, and Irrigation Water, 2002–06 and 2008–12 (in LD millions)
2002-06 2008-12 Average (2008-12)
I. Capital expenditures 7,651.8 12,185.9 2,437.1 I.1 Water production 7,132.3 6,034.7 1,206.9
GMMR 6,729.8 4,929.7 985.9
Desalination 341.2 518.8 103.8
Surface water (GWA) 61.3 586.2 117.2
I.2 Water transfers 312.5 3,489.0 697.8
Water transfer for irrigation (GMMR water-using boards) 312.5 1,779.4 355.9
Water transfer for urban use n.a. 1,709.6 341.9
I. 3 Distribution/collection & treatment 207 2,662.2 532.4
Urban water distribution networks n.a. n.a. n.a.
GPCoEGW projections n.a. 1,500 300.0
GMMRA city networks n.a. 252.2 50.4
Housing & utility board n.a. 125 25.0
Urban wastewater
Wastewater collection networks 207 110 22.0
Wastewater treatment plants n.a. 550 110.0
Housing & utility board n.a. 125 25.0
II. Operation & Maintenance Expenditures 1,078.4 2,783 556.6
II.1 GMMRA & GMMR Water-Using Boards
GMMRA 238.4 252.2 50.4
GMMR water regional boards n.a. 94.8 19.0
II.2 General services companies 0.0
Water 440 1,276 255.2
Wastewater 400 1160 232.0
II.3 Desalination n/a n/a n/a
Total Capital and O&M Expenditures 8,730.2 14,968.9 2,993.8
Sources: GPCEWG, GMMRA, HIB, and HUC. n.a. Non Available.
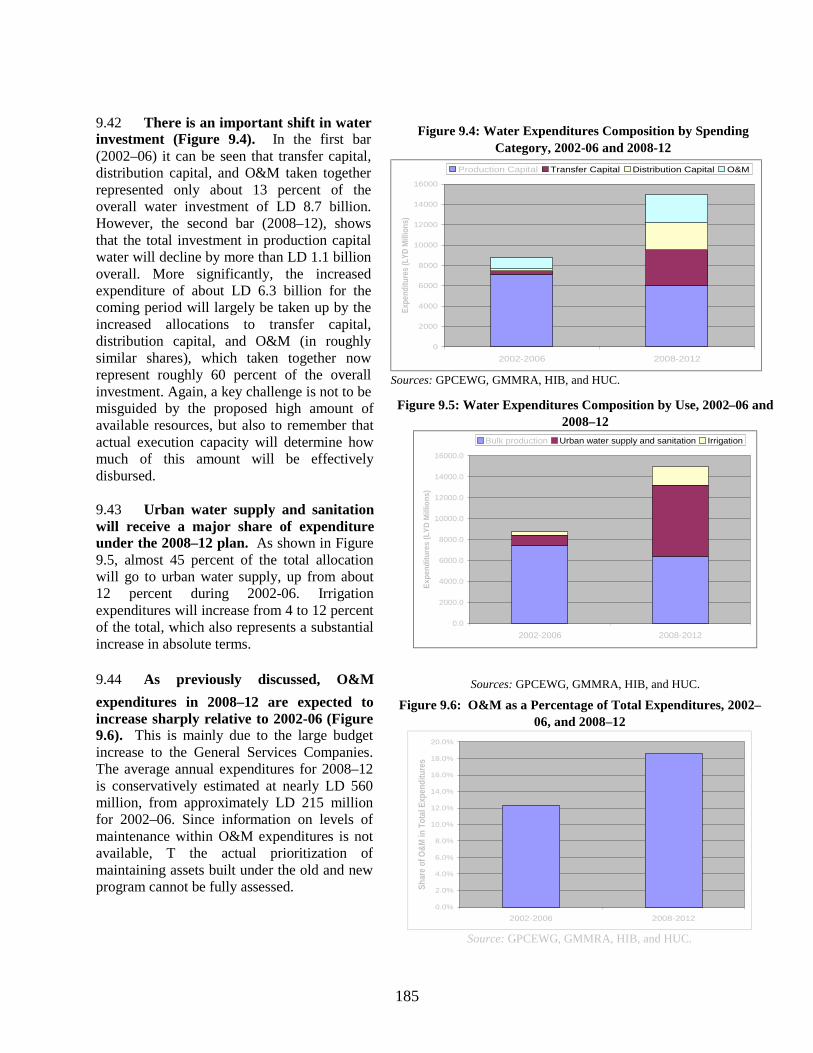
185
9.42 There is an important shift in water investment (Figure 9.4). In the first bar (2002–06) it can be seen that transfer capital, distribution capital, and O&M taken together represented only about 13 percent of the overall water investment of LD 8.7 billion. However, the second bar (2008–12), shows that the total investment in production capital water will decline by more than LD 1.1 billion overall. More significantly, the increased expenditure of about LD 6.3 billion for the coming period will largely be taken up by the increased allocations to transfer capital, distribution capital, and O&M (in roughly similar shares), which taken together now represent roughly 60 percent of the overall investment. Again, a key challenge is not to be misguided by the proposed high amount of available resources, but also to remember that actual execution capacity will determine how much of this amount will be effectively disbursed. 9.43 Urban water supply and sanitation will receive a major share of expenditure under the 2008–12 plan. As shown in Figure 9.5, almost 45 percent of the total allocation will go to urban water supply, up from about 12 percent during 2002-06. Irrigation expenditures will increase from 4 to 12 percent of the total, which also represents a substantial increase in absolute terms. 9.44 As previously discussed, O&M
expenditures in 2008–12 are expected to increase sharply relative to 2002-06 (Figure 9.6). This is mainly due to the large budget increase to the General Services Companies. The average annual expenditures for 2008–12 is conservatively estimated at nearly LD 560 million, from approximately LD 215 million for 2002–06. Since information on levels of maintenance within O&M expenditures is not available, T the actual prioritization of maintaining assets built under the old and new program cannot be fully assessed.
Figure 9.4: Water Expenditures Composition by Spending Category, 2002-06 and 2008-12
0
2000
4000
6000
8000
10000
12000
14000
16000
2002-2006 2008-2012
Expe
nditu
res
(LYD
Mill
ions
)
Production Capital Transfer Capital Distribution Capital O&M
Sources: GPCEWG, GMMRA, HIB, and HUC.
Figure 9.5: Water Expenditures Composition by Use, 2002–06 and 2008–12
0.0
2000.0
4000.0
6000.0
8000.0
10000.0
12000.0
14000.0
16000.0
2002-2006 2008-2012
Exp
endi
ture
s(L
YD
Mill
ions
)
Bulk production Urban water supply and sanitation Irrigation
Sources: GPCEWG, GMMRA, HIB, and HUC.
Figure 9.6: O&M as a Percentage of Total Expenditures, 2002–06, and 2008–12
0.0%
2.0%
4.0%
6.0%
8.0%
10.0%
12.0%
14.0%
16.0%
18.0%
20.0%
2002-2006 2008-2012
Shar
eof
O&
Min
Tota
lExp
endi
ture
s
Source: GPCEWG, GMMRA, HIB, and HUC.
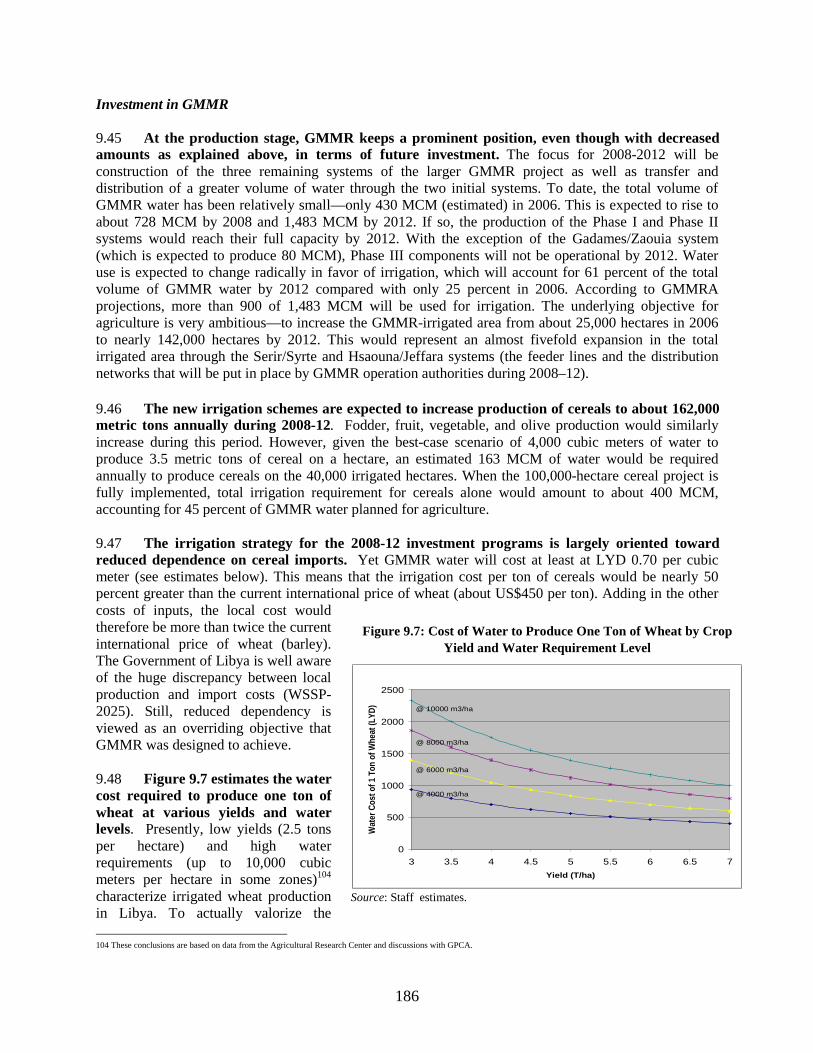
186
Investment in GMMR 9.45 At the production stage, GMMR keeps a prominent position, even though with decreased amounts as explained above, in terms of future investment. The focus for 2008-2012 will be construction of the three remaining systems of the larger GMMR project as well as transfer and distribution of a greater volume of water through the two initial systems. To date, the total volume of GMMR water has been relatively small—only 430 MCM (estimated) in 2006. This is expected to rise to about 728 MCM by 2008 and 1,483 MCM by 2012. If so, the production of the Phase I and Phase II systems would reach their full capacity by 2012. With the exception of the Gadames/Zaouia system (which is expected to produce 80 MCM), Phase III components will not be operational by 2012. Water use is expected to change radically in favor of irrigation, which will account for 61 percent of the total volume of GMMR water by 2012 compared with only 25 percent in 2006. According to GMMRA projections, more than 900 of 1,483 MCM will be used for irrigation. The underlying objective for agriculture is very ambitious—to increase the GMMR-irrigated area from about 25,000 hectares in 2006 to nearly 142,000 hectares by 2012. This would represent an almost fivefold expansion in the total irrigated area through the Serir/Syrte and Hsaouna/Jeffara systems (the feeder lines and the distribution networks that will be put in place by GMMR operation authorities during 2008–12). 9.46 The new irrigation schemes are expected to increase production of cereals to about 162,000 metric tons annually during 2008-12. Fodder, fruit, vegetable, and olive production would similarly increase during this period. However, given the best-case scenario of 4,000 cubic meters of water to produce 3.5 metric tons of cereal on a hectare, an estimated 163 MCM of water would be required annually to produce cereals on the 40,000 irrigated hectares. When the 100,000-hectare cereal project is fully implemented, total irrigation requirement for cereals alone would amount to about 400 MCM, accounting for 45 percent of GMMR water planned for agriculture. 9.47 The irrigation strategy for the 2008-12 investment programs is largely oriented toward reduced dependence on cereal imports. Yet GMMR water will cost at least at LYD 0.70 per cubic meter (see estimates below). This means that the irrigation cost per ton of cereals would be nearly 50 percent greater than the current international price of wheat (about US$450 per ton). Adding in the other costs of inputs, the local cost would therefore be more than twice the current international price of wheat (barley). The Government of Libya is well aware of the huge discrepancy between local production and import costs (WSSP-2025). Still, reduced dependency is viewed as an overriding objective that GMMR was designed to achieve. 9.48 Figure 9.7 estimates the water cost required to produce one ton of wheat at various yields and water levels. Presently, low yields (2.5 tons per hectare) and high water requirements (up to 10,000 cubic meters per hectare in some zones)104 characterize irrigated wheat production in Libya. To actually valorize the
104 These conclusions are based on data from the Agricultural Research Center and discussions with GPCA.
Figure 9.7: Cost of Water to Produce One Ton of Wheat by Crop Yield and Water Requirement Level
0
500
1000
1500
2000
2500
3 3.5 4 4.5 5 5.5 6 6.5 7
Yield (T/ha)
Wat
erC
osto
f1To
nof
Whe
at(L
YD)
@ 4000 m3/ha
@ 10000 m3/ha
@ 8000 m3/ha
@ 6000 m3/ha
Source: Staff estimates.
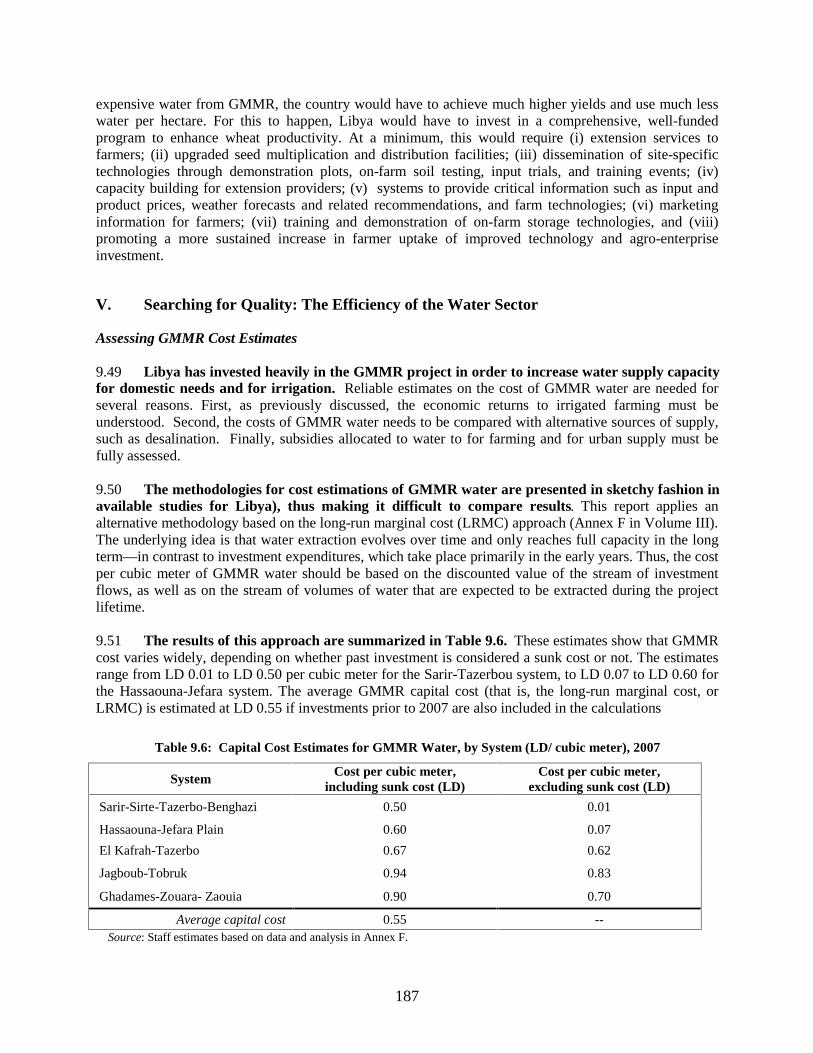
187
expensive water from GMMR, the country would have to achieve much higher yields and use much less water per hectare. For this to happen, Libya would have to invest in a comprehensive, well-funded program to enhance wheat productivity. At a minimum, this would require (i) extension services to farmers; (ii) upgraded seed multiplication and distribution facilities; (iii) dissemination of site-specific technologies through demonstration plots, on-farm soil testing, input trials, and training events; (iv) capacity building for extension providers; (v) systems to provide critical information such as input and product prices, weather forecasts and related recommendations, and farm technologies; (vi) marketing information for farmers; (vii) training and demonstration of on-farm storage technologies, and (viii) promoting a more sustained increase in farmer uptake of improved technology and agro-enterprise investment.
V. Searching for Quality: The Efficiency of the Water Sector
Assessing GMMR Cost Estimates 9.49 Libya has invested heavily in the GMMR project in order to increase water supply capacity for domestic needs and for irrigation. Reliable estimates on the cost of GMMR water are needed for several reasons. First, as previously discussed, the economic returns to irrigated farming must be understood. Second, the costs of GMMR water needs to be compared with alternative sources of supply, such as desalination. Finally, subsidies allocated to water to for farming and for urban supply must be fully assessed. 9.50 The methodologies for cost estimations of GMMR water are presented in sketchy fashion in available studies for Libya), thus making it difficult to compare results. This report applies an alternative methodology based on the long-run marginal cost (LRMC) approach (Annex F in Volume III). The underlying idea is that water extraction evolves over time and only reaches full capacity in the long term—in contrast to investment expenditures, which take place primarily in the early years. Thus, the cost per cubic meter of GMMR water should be based on the discounted value of the stream of investment flows, as well as on the stream of volumes of water that are expected to be extracted during the project lifetime. 9.51 The results of this approach are summarized in Table 9.6. These estimates show that GMMR cost varies widely, depending on whether past investment is considered a sunk cost or not. The estimates range from LD 0.01 to LD 0.50 per cubic meter for the Sarir-Tazerbou system, to LD 0.07 to LD 0.60 for the Hassaouna-Jefara system. The average GMMR capital cost (that is, the long-run marginal cost, or LRMC) is estimated at LD 0.55 if investments prior to 2007 are also included in the calculations
Table 9.6: Capital Cost Estimates for GMMR Water, by System (LD/ cubic meter), 2007
System Cost per cubic meter,
including sunk cost (LD) Cost per cubic meter,
excluding sunk cost (LD)
Sarir-Sirte-Tazerbo-Benghazi 0.50 0.01
Hassaouna-Jefara Plain 0.60 0.07
El Kafrah-Tazerbo 0.67 0.62
Jagboub-Tobruk 0.94 0.83
Ghadames-Zouara- Zaouia 0.90 0.70
Average capital cost 0.55 -- Source: Staff estimates based on data and analysis in Annex F.

188
9.52 When this approach is applied to desalination based on the new plants scheduled under GPCEWG, the capital cost (LRMC) is estimated at about LYD 0.82 per cubic meter; and this cost turns out to be lower for co-generation plants than for pure desalination plants. Thus, the capital cost of GMMR water is lower than for desalination water, a result that needs to be taken into account in the optimization of investment. This raises tradeoffs which need to be resolved through a unified investment program for both GMMR and desalination. Closer coordination between GMMRA and GPCEWG should be encouraged. Policy should be based on reliable projections of future demand and optimized sources of supply for each region. Assessing Subsidies in the Water Sector 9.53 Large subsidies to the water sector (LD 935 million) accounted for approximately 1.4 percent of Libyan GDP in 2006. Public financing is likely to continue well in the future as the source of funding for water sector and sanitation, and for irrigation services as well. As shown in Table 9.7, and based on about 700 MCM (593 MCM in urban water and 105 MCM in irrigation) of urban water supplied and irrigation, revenues collected represent only a very small portion of the cost of providing water and sanitation services to households (4 percent) and farmers (8 percent). Given the relatively small amount of subsidies that have gone to irrigation from GMMR (98 LD million out of 934 LD millions), the bulk of water subsidies (90 percent) has actually benefitted to urban water supply and sanitation. Table 9.7 uses various estimations of water production and distribution costs for water supply, sanitation, and irrigation. Annex G (see Volume III) provides more details about estimation methods and the assumptions used in the analysis. 9.54 Projecting cost recovery based upon current bill metering and average tariffs, Table 7 shows that subsidies to water could reach LD 1.9 billons by 2012. This assumes a higher share of GMMR water diverted to irrigation and completion of the irrigation schemes that are now planned. Nevertheless, urban water supply and sanitation will continue to be the major recipient of water-related subsidies (58 percent) compared to irrigation (42 percent) in 2012. The increase in the subsidy from LD 836 million to LD 1.1 billion is due to the increase in demand in urban water, from 593 MCM to 685 MCM in 2012; as well as to increased cost of water production as more wells are replaced by the more expensive GMMR water and desalination.
9.55 As shown in the final column of Table 9.7 below, increasing billing and collection in urban water supply and sanitation could help reduce the subsidy from approximately LD 1.91 billion to about LD 1.79 billion by 2012, a significant reduction of about 7 percent. The newly established National Water and Wastewater Company (NWWC) will need a dramatic effort to both contain costs and increase revenues. This would require not only increased billing and collection but reduced per unit costs, and even more importantly, adjustments in tariffs.
9.56 Utilities around the world frequently charge for water supply and sanitation (WSS) services below cost. Full cost recovery—investment costs as well as operation and maintenance—is a worthy goal, as financially autonomous service providers can ultimately provide better services. However, in the context of Libya this may not be realistic in the near future. Given the high cost of providing water to households and farmers, the more immediate and necessary step will be to avoid wastage of the precious resource. Cost recovery for WSS services should be kept as a long-term goal, but flexibility is needed in thinking about when. In the near term, Libya should aim at generating revenues from users that would at least cover NWSC operations and maintenance costs. These costs, which are calculated in Annex G, should provide a basis for engaging on a program of reform to improve the incentives for efficient provision in water.

189
Table 9.7: Subsidies in Urban Water Supply, Sanitation, and Irrigation
2012 (Proj.)
Units
2006Current metering and bill
collection
100% metering and bill
collection
Volume of urban water supplied (1) MCM 593 685 685
Volume of irrigation water (2) MCM 105 944 944
Cost of urban water (3) LD/m3 1.15 1.39 1.39
Cost of irrigation water (4) LD/m3 1.01 0.93 0.93
Implicit unit revenue for urban water supply
(5) LD/m3 0.04 0.04 0.219
Water charges for irrigation (6) LD/m3 0.08 0.08 0.08
Cost of urban water supply provision (7) = (1)*(3) LD millions 682 952 952
Cost of wastewater services (8) LD millions 180 180 180
Revenues from water and wastewater services
(9)=(1)*(5) LD millions 26 30 150
Subsidy for urban water and wastewater
(10)=(7)-(9) LD millions 836 1,102 982
Cost of water supply to irrigation (11)=(2)*(4) LD millions 106 878 878
Revenues from water sales to irrigation (12)=(2)*(6) LD millions 8 76 76
Subsidy for irrigation water (13)=(11)-(12) LD millions 98 802 802
Total subsidy (14)=(10)+(13) LD millions 934 1,905 1,785
Nominal GDP (15) LD billions 65.2
Subsidy (% of GDP) (14)/(15) Percent 1.43%
Source: Staff computations based on data and analysis in Annex G. 9.57 As more water becomes available to irrigation, thereby increasing the volume of subsidies, higher water fees for farmers will need to be considered. The first reason is to cover the O&M cost, so that irrigation projects will be financially sustainable. Fees will also need to include a charge for the cost of GMMR capital. The second reason involves pricing that will either encourage farmers to use less water per unit of output or produce greater net economic returns per unit of water, or both. The first objective is paramount; but as water scarcity increases, the efficiency objective must assume higher priority. 9.58 Cost recovery is also important for farmers. International experience clearly shows that a culture of “free” water is often associated with poor water delivery service (timing, duration, or quantity) and no penalties for managers or irrigation personnel who provide the poor service. As Libya is preparing to implement a major irrigation endeavor, it must consider cost recovery at least partly as an assurance problem—assurance regarding what water users, managers, and staff will actually do, as opposed to what they say they will do with a resource costing more than .90 LD (US$0.78 per cubic meter). It is crucial,

190
first, to design an effective pricing mechanism based on local conditions105 and second, to develop a strategy to achieve high rates of collection.
9.59 Affordability analysis confirms ample room for increases in residential water tariffs. Table 9.8 shows the impact of various increases in water tariffs by income group. International practice generally considers water and sanitation expenses to be acceptable at levels of up to 5 percent of household income. To mitigate the risk of tariffs exceeding this affordability limit (which is likely, given the high cost of water production in Libya), “lifeline” tariffs (that is, tariffs at an affordable level or fee) can be used to directly subsidize poor customers. As shown in Table 8, the average household “in principle” pays water tariffs of about 1.3 percent of household income. If these tariffs were raised to recover O&M and some of the investment costs—say, at LD 0.65 per cubic meter—this would raise the cost for the average household to 3.4 percent and to 5 percent for the low-income group. Poor households currently pay about 2 percent of their income, which would rise to nearly 11 percent if full cost recovery tariffs were charged (with no lifeline tariffs in place).
Table 9.8: Impact of Tariff Increases (% of Monthly Household Income)
Tariff ( LD/m3)
Low income (%)
Medium income (%)
High income (%)
Current average residential tariff 0.25 1.9 1.3 0.7
O&M costs recovery tariff 0.34 2.6 1.8 0.9
O&M cost + a portion of investment cost 0.65 5.0 3.4 1.8
Full recovery with current production structure
1.15 8.9 6.0 3.1
Full recovery with higher GMMR/desalination emphasis
1.4 10.8 7.3 3.8
Note: Analysis is based on 250 l/c/d average consumption for the three income groups—an average income proxy of LD 565 per month for low income, LD 969 for medium income, and LD 1,858 for high income. Average household size is 5.8 for low income and 6.7 for high and medium income (2002-03 Libya Household Survey).
9.60 Tariff increases are affordable; however, some targeted transfers for the low-income groups might be considered. To mitigate the impact of tariff increases on the poor, the government should replace the current “universal” subsidy with a targeted mechanism. If increased tariffs are unaffordable for poor consumers, direct subsidies to the poor through lifeline tariffs might be preferable to indirect subsidies to the water utility. A program of lifeline tariffs through—for example, a system of Increasing Block Tariffs (IBTs)—could also be considered. IBTs set the lowest consumption block (at some minimum supply level, such as 50 l/c/d) at a lifeline tariff. Other consumption subsidies schemes include: geographically differentiated tariffs, “social tariffs” (to customers classified as poor), direct cash transfers to poor customers whose bill exceeds a certain limit, and connection subsidies where high connection costs are a deterrent.
105 Conditions in the southern zones are very different from those prevailing in the coastal areas.

191
Source: World Bank, “Re-engaging in Agricultural Water Management”, 2006.
VI. Policy Recommendations 9.61 Libya’s water sector is in a state of substantial transformation. It is emerging from a period characterized by low performance in urban service delivery, poor quality, and limited ability to valorize the large GMMR investment that was intended for irrigation. Utility revenues are low owing to low tariffs, poor collection, and high costs. Losses are increasing because of inefficient management and poor demand management. Utilities do not recover the high costs they incur, and with consumers paying minimal amounts, utilities are totally dependent on public funds.
Box 1: Policy and institutional options: The international experience in irrigation cost recovery
In designing a system of irrigation service charges, there is first a need to be clear about the objectives. Usually these would be to ensure cost recovery adequate to sustain operations and maintenance (a financial objective). Less frequently, service charges are designed to maintain and sharpen incentives to water productivity (the efficiency objective). In deciding who pays for water service, all cost recovery programs have to relate to the basic facts—the sustainability of irrigation systems rests on the twin pillars of demand-responsive service and cost recovery adequate to the system needs. If systems are to deliver quality service, somebody has to pay for it. Neither government, nor irrigation agency, nor irrigator has an interest in a system that cannot deliver, and there has to be clarity and commitment about who is to pay for the service. Typically, the irrigator should pay a fair share on the “user pays” principle that individuals who benefit from public investment and scarce resources should pay. The advantage of the irrigator paying is double, because water charges not only bring in revenue but signal opportunity cost. However, if constraints mean that a full cost-recovery policy cannot be introduced, the alternative needs to be made clear. If irrigators cannot pay, then government must. There has to be a decision on what costs should be recovered from whom, and why. A cost recovery policy should start with an analysis of the full range of services and benefits produced and allocate project costs among all beneficiaries, and then assign costs accordingly. Typically, upstream works such as headworks and primary canals have public-good elements that justify government funding, while downstream works at the tertiary and quaternary level deliver entirely private benefits that justify the irrigator paying. For the secondary canal level, sharing of the costs may be appropriate. Consideration should be given to whether to recover all costs—initial capital costs, replacements, and operation and maintenance costs—or only a portion. Typically, recovery might be based on replacement cost and operation and maintenance cost only. The analysis should also look at the ability to pay, which is likely to range from about 5 percent to 30 percent of net farm income, depending on quality of the service.
One study of 26 irrigation systems in six countries in Asia by ADB and IWMI in 2004 found that “reasonable” charges for water did not handicap poor farmers because systems that were financially sustainable worked better with regard to delivering water equitably. The study found that annual charges for irrigation water varied greatly, from under US$5/ha to US$67/ha. Charges were considerably lower in South Asia than in Southeast and East Asia. According to the study, South Asia’s low water charges trigger a cycle of poor irrigation performance, leading to low agricultural productivity and the perpetuation of poverty. Fees in this region tend to disappear into central government coffers and are not earmarked for recycling to irrigation managers for investment in improved system performance. Where fees were higher and a decentralized management system was in place, water delivery was considerably more equitable. High rates of fee collection in the systems studied (for example, 95 percent in Indonesia) suggested that water fees are accepted by users. The choice of charging mechanisms is dictated partly by objectives of scheme financial sustainability and efficient water use and partly by practical considerations of whether the mechanisms can be implemented. If cost recovery is the overriding objective, there is a range of mechanisms. If water is scarce and reducing water use is an objective, a volumetric charge is in principle more appropriate, but only where it is physically possible and not too expensive to implement. In practice, different mechanisms may achieve similar results—and often implementation (that is, maximizing collection) is the key consideration.
192
9.62 The country has an ambitious investment program planned for 2008–12, nearly LD 15 billion. This investment will help to improve access and service quality for water supply and sanitation, and it will make more water available for irrigation. The additional investment in production and transfer should help to offset the drying out of wells in the coastal zones. 9.63 GMMR water destined for irrigation expansion must be well valorized to compensate for its high production cost. Since cereal expansion is the objective in agriculture, the Government of Libya will need to put a major crop-productivity enhancement program in place to increase yields. In addition, high-value-added products with a good export potential should be sought, such as fruits and vegetables that could be exported to the EU under the Free Trade Agreement with the EU. If this does not materialize, the necessary subsidies allocated to water usage—estimated to reach LD 800 million by the end of the development program—would not constitute an efficient use of public resources.
9.64 Given the scarcity of water resources and the much higher value of water in domestic use than in agriculture, the priority should go to meeting the needs for potable water for the whole population, Libya cannot reach food self-sufficiency in the foreseeable future and the pursuit of this objective will only result in increasing waste of valuable resources. While food security is a legitimate and important objective, including a minimum reliance on domestic production, maximizing self-sufficiency is a very costly objective.
9.65 If the priority of GMMR water is for domestic use, then the strategy of building a large desalination capacity should be revisited. The huge investment in GMMR should be valorized. Even if past investment is included, the above estimates indicate that the cost per cubic meter of GMMR water is still lower than for desalination. The cost comparison should be done by region, which could make desalination cheaper for some coastal areas than GMMR water, but the supply of potable water shouldn’t be biased towards desalination and, clearly, the right balance should be reached.
9.66 Based on the diagnostic above, other priority actions are recommended, which would improve performance and reduce dependence on public funds. The following matrix provides a summary of policy recommendations for the water sector.
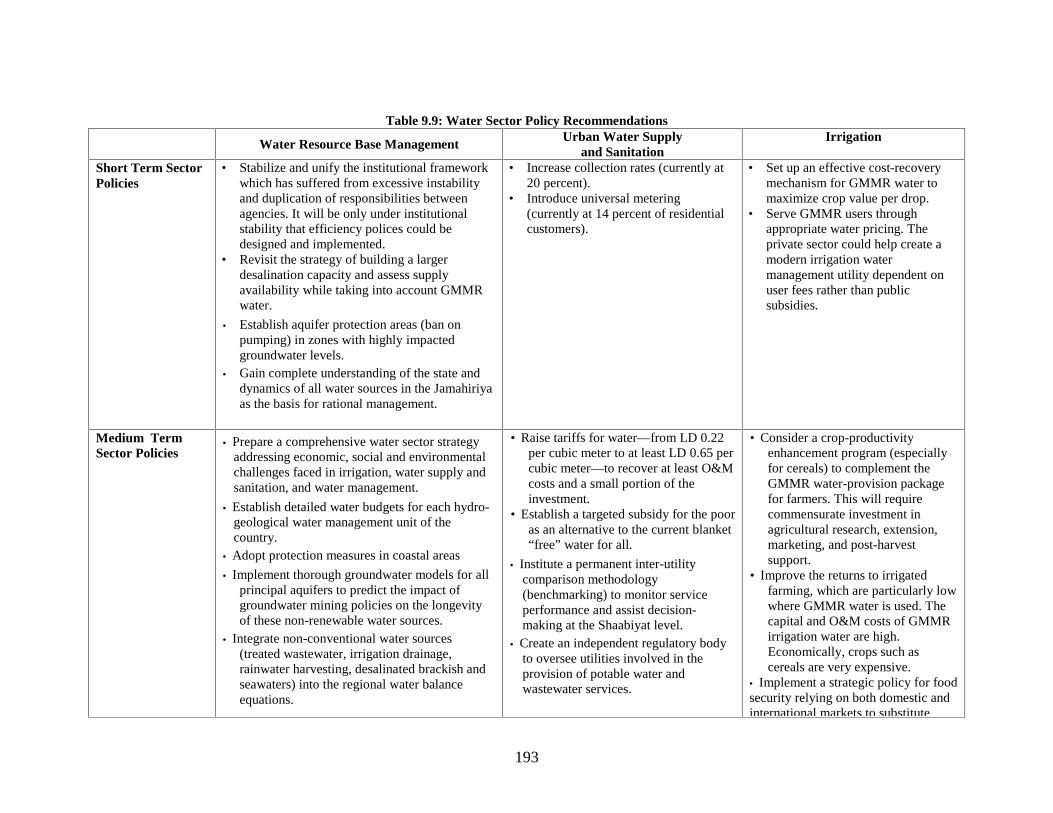
193
Table 9.9: Water Sector Policy Recommendations
Water Resource Base ManagementUrban Water Supply
and SanitationIrrigation
Short Term SectorPolicies
• Stabilize and unify the institutional frameworkwhich has suffered from excessive instabilityand duplication of responsibilities betweenagencies. It will be only under institutionalstability that efficiency polices could bedesigned and implemented.
• Revisit the strategy of building a largerdesalination capacity and assess supplyavailability while taking into account GMMRwater.
• Establish aquifer protection areas (ban onpumping) in zones with highly impactedgroundwater levels.
• Gain complete understanding of the state anddynamics of all water sources in the Jamahiriyaas the basis for rational management.
• Increase collection rates (currently at20 percent).
• Introduce universal metering(currently at 14 percent of residentialcustomers).
• Set up an effective cost-recoverymechanism for GMMR water tomaximize crop value per drop.
• Serve GMMR users throughappropriate water pricing. Theprivate sector could help create amodern irrigation watermanagement utility dependent onuser fees rather than publicsubsidies.
Medium TermSector Policies
• Prepare a comprehensive water sector strategyaddressing economic, social and environmentalchallenges faced in irrigation, water supply andsanitation, and water management.
• Establish detailed water budgets for each hydro-geological water management unit of thecountry.
• Adopt protection measures in coastal areas
• Implement thorough groundwater models for allprincipal aquifers to predict the impact ofgroundwater mining policies on the longevityof these non-renewable water sources.
• Integrate non-conventional water sources(treated wastewater, irrigation drainage,rainwater harvesting, desalinated brackish andseawaters) into the regional water balanceequations.
• Raise tariffs for water—from LD 0.22per cubic meter to at least LD 0.65 percubic meter—to recover at least O&Mcosts and a small portion of theinvestment.
• Establish a targeted subsidy for the pooras an alternative to the current blanket“free” water for all.
• Institute a permanent inter-utilitycomparison methodology(benchmarking) to monitor serviceperformance and assist decision-making at the Shaabiyat level.
• Create an independent regulatory bodyto oversee utilities involved in theprovision of potable water andwastewater services.
• Consider a crop-productivityenhancement program (especiallyfor cereals) to complement theGMMR water-provision packagefor farmers. This will requirecommensurate investment inagricultural research, extension,marketing, and post-harvestsupport.
• Improve the returns to irrigatedfarming, which are particularly lowwhere GMMR water is used. Thecapital and O&M costs of GMMRirrigation water are high.Economically, crops such ascereals are very expensive.
• Implement a strategic policy for foodsecurity relying on both domestic andinternational markets to substitute
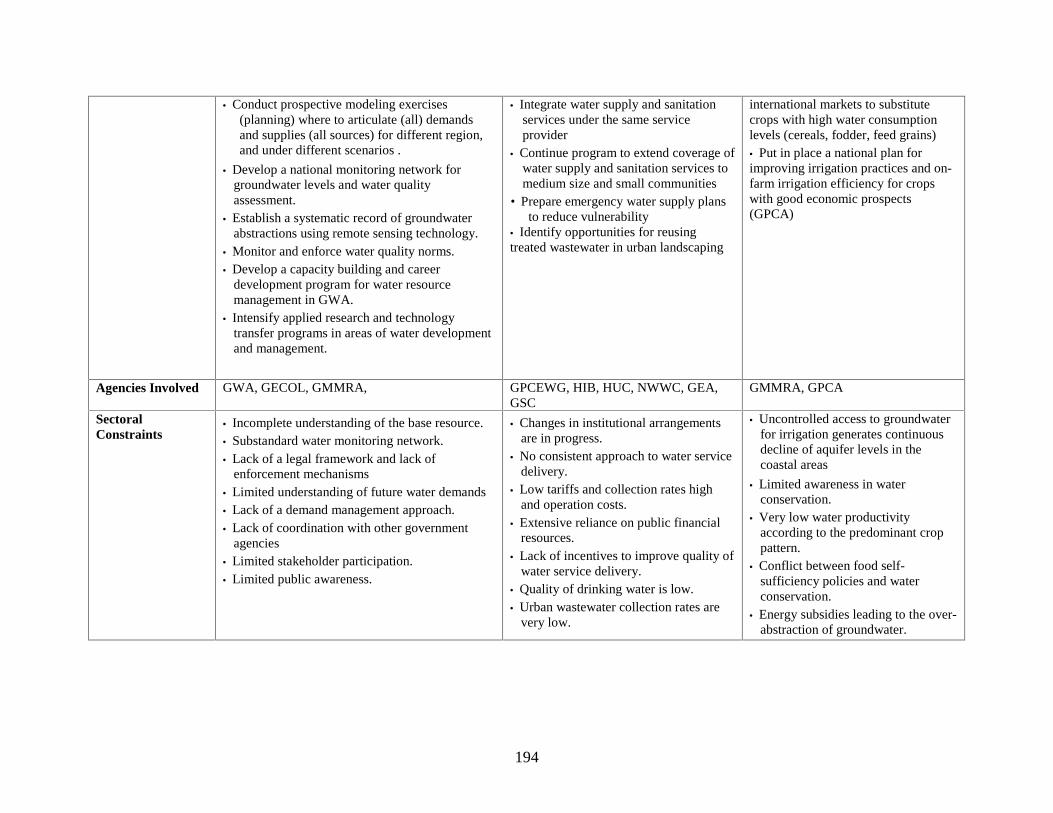
194
• Conduct prospective modeling exercises(planning) where to articulate (all) demandsand supplies (all sources) for different region,and under different scenarios .
• Develop a national monitoring network forgroundwater levelsand water qualityassessment.
• Establish a systematic record of groundwaterabstractions using remote sensing technology.
• Monitor and enforce water quality norms.• Develop a capacity building and career
development program for water resourcemanagement in GWA.
• Intensify applied research and technologytransfer programs in areasof water developmentand management.
• Integrate water supply and sanitationservices under the same serviceprovider
• Continue program to extend coverage ofwater supply and sanitation services tomedium size and small communities
• Prepare emergency water supply plansto reduce vulnerability
• Identify opportunities for reusingtreated wastewater in urban landscaping
international markets to substitutecrops with high water consumptionlevels (cereals, fodder, feed grains)• Put in place a national plan forimproving irrigation practices and on-farm irrigation efficiency for cropswith good economic prospects(GPCA)
Agencies Involved GWA, GECOL, GMMRA, GPCEWG, HIB, HUC, NWWC, GEA,GSC
GMMRA, GPCA
SectoralConstraints
• Incomplete understanding of the base resource.• Substandard water monitoring network.• Lack of a legal framework and lack of
enforcement mechanisms• Limited understanding of future water demands• Lack of a demand management approach.• Lack of coordination with other government
agencies• Limited stakeholder participation.• Limited public awareness.
• Changes in institutional arrangementsare in progress.
• No consistent approach to water servicedelivery.
• Low tariffs and collection rates highand operation costs.
• Extensive reliance on public financialresources.
• Lack of incentives to improve quality ofwater service delivery.
• Quality of drinking water is low.• Urban wastewater collection rates are
very low.
• Uncontrolled access to groundwaterfor irrigation generates continuousdecline of aquifer levels in thecoastal areas
• Limited awareness in waterconservation.
• Very low water productivityaccording to the predominant croppattern.
• Conflict between food self-sufficiency policies and waterconservation.
• Energy subsidies leading to the over-abstraction of groundwater.

Chapter 10. Setting Priorities in the 2008–12 Public Investment Plan: The Shift of Public Investment toward Productive Activities
Libya’s 2008–12 Public Investment Plan (PIP) already contains a significant bias toward productive activities. Resources allocated already give high priority to investments in basic infrastructure. In addition, at the macro level, a selectivity bias toward pro-productive activities requires that the pipeline of projects be framed by the available and sustainable budget, the link of resources to the country’s strategies and the implementation capacity of the executing units. And at the micro level, selectivity requires sound technical individual projects, followed by well mastered complementary methodologies of intrasectoral and intersectoral prioritization. Whereas intersectoral prioritization often intervenes in countries suffering severe fiscal constraints, intrasectoral prioritization often takes place in governments featuring strong ministerial entities, but with little interministerial coordination. At the present stage, the use of methodologies of project prioritization can only be applied to a minority share of the 2008–12 PIP, as it already gives priority to ongoing projects representing a majority of the pipeline.
I. Introduction 10.1 Libya has carefully designed its biggest and most ambitious Public Investment Plan (PIP) in many decades. The first draft of the 2008–12 PIP was submitted to the first ordinary session of the National Planning Council held on October 16–17, 2007. The preparation of the draft followed a nine-month participatory process that involved Congress’s grassroots organizations in the elaboration of sectoral programs. The investment estimates proposed under the draft were considered as indicative, since the meeting decided that they should be reviewed in detail and audited in detail to determine the real cost of projects based on standard prices, and subject to the availability of financial resources during the period of implementation of the development program (GPCP 2008a). 10.2 The PIP identifies five main shortcomings inherited from 1970–2007: (a) the dominance of oil as the main source of income and economic activity, (b) little progress in diversifying the composition of exports, (c) increased exposure of Libya’s economy to the outside world (the trade openness ratio increased from 85 in 1970 to 94 percent in 2007), (d) many institutional shortcoming preventing swift execution of public projects, and (e) the absence of a clear development path and a well-defined vision and policies to meet the needs of present and future generations (intergenerational equity). 10.3 In response, the PIP aims to achieve a two-pronged strategy with a central focus on supporting productive activities through massive investments in basic infrastructure, supported by more efficient delivery of public services. More specifically, the PIP calls for: (a) creating the economic, social, and institutional conditions conducive to targeted economic diversification beyond the oil sector; and (b) making more efficient use of existing assets and human, organizational, and administrative capacities, and of existing and new institutions. As a result, the strategy defines 12 broad macro goals; the first six directly address productive-related needs, and the second deal with six institution-related social and environmental needs. The goals are:
a. High annual economic growth rate (above 8.2 percent).
b. Improvement of existing production capacities and productivity.
c. Diversification of hard currency sources.
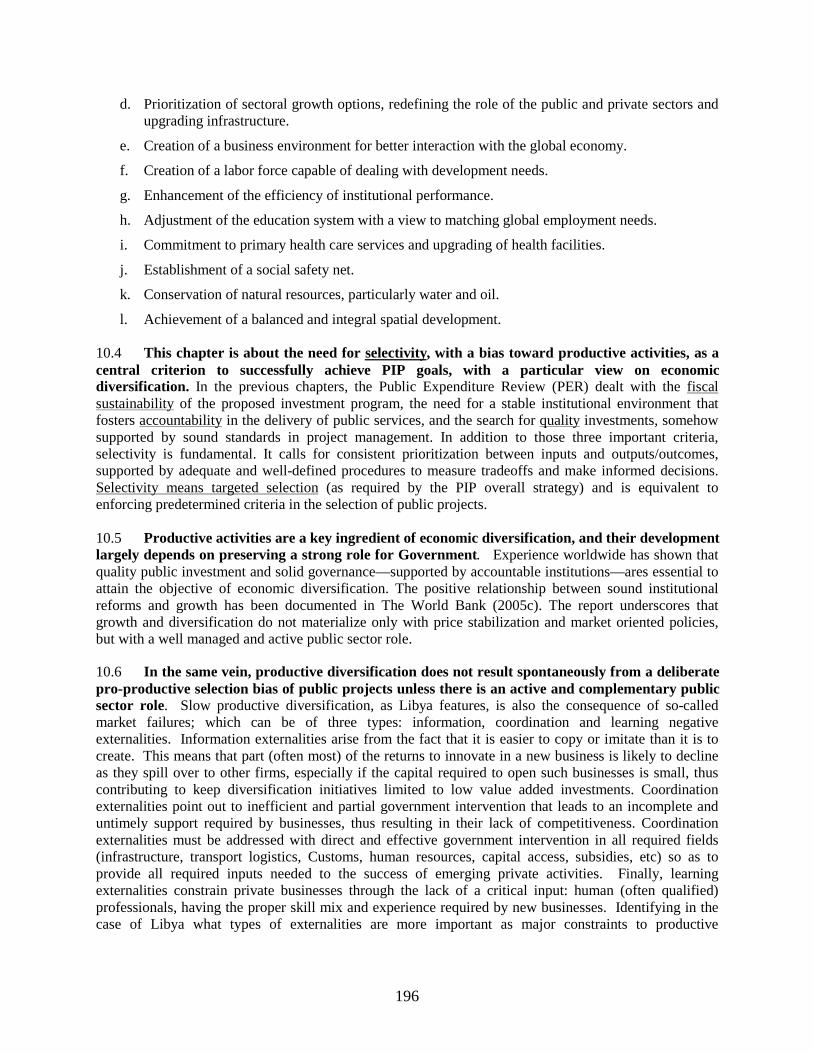
196
d. Prioritization of sectoral growth options, redefining the role of the public and private sectors and upgrading infrastructure.
e. Creation of a business environment for better interaction with the global economy.
f. Creation of a labor force capable of dealing with development needs.
g. Enhancement of the efficiency of institutional performance.
h. Adjustment of the education system with a view to matching global employment needs.
i. Commitment to primary health care services and upgrading of health facilities.
j. Establishment of a social safety net.
k. Conservation of natural resources, particularly water and oil.
l. Achievement of a balanced and integral spatial development. 10.4 This chapter is about the need for selectivity, with a bias toward productive activities, as a central criterion to successfully achieve PIP goals, with a particular view on economic diversification. In the previous chapters, the Public Expenditure Review (PER) dealt with the fiscal sustainabilityof the proposed investment program, the need for a stable institutional environment that fosters accountabilityin the delivery of public services, and the search for qualityinvestments, somehow supported by sound standards in project management. In addition to those three important criteria, selectivity is fundamental. It calls for consistent prioritization between inputs and outputs/outcomes, supported by adequate and well-defined procedures to measure tradeoffs and make informed decisions. Selectivity means targeted selection(as required by the PIP overall strategy) and is equivalent to enforcing predetermined criteria in the selection of public projects. 10.5 Productive activities are a key ingredient of economic diversification, and their development largely depends on preserving a strong role for Government. Experience worldwide has shown that quality public investment and solid governance—supported by accountable institutions—ares essential to attain the objective of economic diversification. The positive relationship between sound institutional reforms and growth has been documented in The World Bank (2005c). The report underscores that growth and diversification do not materialize only with price stabilization and market oriented policies, but with a well managed and active public sector role.
10.6 In the same vein, productive diversification does not result spontaneously from a deliberate pro-productive selection bias of public projects unless there is an active and complementary public sector role. Slow productive diversification, as Libya features, is also the consequence of so-called market failures; which can be of three types: information, coordination and learning negative externalities. Information externalities arise from the fact that it is easier to copy or imitate than it is to create. This means that part (often most) of the returns to innovate in a new business is likely to decline as they spill over to other firms, especially if the capital required to open such businesses is small, thus contributing to keep diversification initiatives limited to low value added investments. Coordination externalities point out to inefficient and partial government intervention that leads to an incomplete and untimely support required by businesses, thus resulting in their lack of competitiveness. Coordination externalities must be addressed with direct and effective government intervention in all required fields (infrastructure, transport logistics, Customs, human resources, capital access, subsidies, etc) so as to provide all required inputs needed to the success of emerging private activities. Finally, learning externalities constrain private businesses through the lack of a critical input: human (often qualified) professionals, having the proper skill mix and experience required by new businesses. Identifying in the case of Libya what types of externalities are more important as major constraints to productive

197
diversification would require a particular analysis that is beyond the purpose of the present report.106
10.7 This chapter, however, introduces a methodology to prioritize basic infrastructure over social projects in the PIP. Basic infrastructure is akin to productive activities. In the past, Libya has heavily invested in the social sectors, which is clearly reflected in its remarkable social gains achieved during many decades (see Chapter 1). However, the embargo years have left a significant backlog of infrastructure needs, which is what the PIP mainly addresses. The methodology is timely because, on the one hand, a significant number of PIP projects are still under study, and, on the other hand, its use can persist in the medium term as a useful tool for public investment management. 10.8 This chapter is divided into seven sections. Section II briefly restates the main shortcomings of the pipeline of public projects and underscores why selectivity is so important. Section III describes the key features of the 2008–12 PIP and explains how it already contains an important shift toward investments in basic infrastructure in support of productive activities. Section IV explains how important is cost-benefit analysis for introducing a selection bias toward high-return productive investments. Section V introduces sector-specific methodologies of intrasectoral prioritization of projects, with concrete practical examples on how to apply them. Section VI introduces a methodology for intersectoral prioritization, and section VII offers a few policy recommendations.
II. The Status of the Pipeline of Public Projects at the End of 2007 10.9 Until 2007, progress in the pipeline of public projects for selected sectors showed a few improvements. At the end of 2007,107 the Central Government managed 17,227 projects (contracts) worth LD18.5 billion (see Table 1.5 in Chapter 1).
• Among these projects, only about a third were completed (5,448) and almost half were ongoing (7,951), compared to 31 percent and 38 percent, respectively, in 2006.
• As a result, the combined share of projects stopped (2,193) or not started (1,635) had decreased to about 22 percent, less than 3 out of 10 in 2006. This ratio, however, still represents a waste of public resources in a significant share of low-quality projects adopted.108
• Among PER sectors, those that have the best performance in terms of projects completed are health (56 percent), higher education (51 percent), and roads (47 percent.
• The power and water sectors show a significant share of ongoing projects (84 percent), perhaps a normal feature for a sector whose project size is big and should take several years to complete.
• In contrast, the sector having the worst performance in terms of projects stopped or not started is general education (25 percent).
10.10 However, the Government of Libya has acknowledged that the execution of the PIP faces numerous difficulties and challenges that affect the overall level and quality of public spending (GPCP 2008d), notably:
• The weakness of technical capabilities and expertise of domestic execution bodies.
• Lack of administrative stability at some agencies and sectors.
106 For a detailed analysis of the role of such externalities in the case of Morocco, refer to World Bank (2006), Fostering Higher Growth and Employment in the Kingdom of Morocco, Washington D.C. 107 As of August 2008, the review of the implementation of the 2007 project pipeline had not been achieved. 108 Such share (30 percent) is even higher than the equivalent share of projects stopped or not started by the Shaabiat (25 percent), the poor quality of which is widely
acknowledged (see Annex A).

198
• Excessive focus on the quantitative side of the investment (input) rather than on its qualitative side (output), especially on education and health projects.
• Low level and quality of training and high dropout of trainees.
• A disconnect between education (and training) outputs and labor market requirements.
• Disorganization of the hiring and employment program of foreign workers.
• No maintenance program for physical assets, and deviation of earmarked resources to other needs.
• High amount of outstanding resources for halted projects, and contracted but not launched projects.
• Low level of supervision of project implementation and management.
• Delays in contracting procedures and approval of development projects.
• Lengthy procedures for obtaining productive and services loans.
• Delays in completing housing and tourism projects due to unsuitable locations.
• Low quality and quantity of data and follow-up reports.
• Inadequate level of coordination among sectors regarding project implementation and the provision of utility services.
• Steep increase in the price of building materials, lands, and real estate properties.
• Delays in preparing social and economic feasibility studies for many projects.
• Delays in the payment of contracts of national execution agencies due to lengthy and complex procedures.
10.11 Among existing difficulties, delays in preparing feasibility studies for many projects remains a major shortcoming, and when combined with poor data, their quality might be low. Chapter 4 provided a detailed analysis of most shortcomings indicated in the public investment system. It highlighted the abysmal lack of sound feasibility studies in public projects. In fact, until 2006, and with few exceptions, no single project (of which there were more than 23,000) implemented by Shaabiat (and the Central Government) during the decentralization period was supported by a feasibility study. And at the central level, the quality of feasibility studies was, according to the authorities, very poor. Indeed, the practice of having projects approved with barely the submission of a simple “sheet of paper” describing generalities of the project, was widespread. Only since late 2006, has the re-created Ministry of Planning introduced highly valuable initial forms with which to prepare project requests, based on simple guidelines. Exceptions remain, however.
10.12 The existence of sound feasibility studies is a prerequisite for selectivity. They require the elaboration of a series of quantitative indicators that allow the measurement of certain key project variables, like costs, benefits, and so forth. Thus, the application of any selection criteria to public investment involves prior parametrization. And the indicators chosen, as seen below, are often standard when it comes to public projects, but depending on the type of project involved, tailored to the sector’s needs.

199
III. The Move toward Productive Activities: Key Features of the 2008–12 PIP Overview 10.13 Libya’s Public Investment Plan (PIP) is a five-year, multisector investment plan composed of numerous projects. It reflects the country’s social and basic infrastructure needs at the national and district level, and contains basic strategic guidelines and broad objectives and outputs. The 2008–12 PIP totals about LD150 billion. If divided proportionally, at 2008 nominal gross domestic product (GDP) prices, such sum would average 20 percent of GDP every year. The PIP has been used as an instrument for programming resources under a multiyear approach. 10.14 The PIP inherits a pipeline of public projects with certain characteristics that already represent a shift toward productive activities, supported by investments in basic infrastructure. At the end of 2007, the following features merit particular attention (see Table 1.4 in Chapter 1:
• High concentration of projects in three sectors of basic infrastructure. These three sectors combined—housing (29.9 percent), power (8.4 percent), and communications and transport (9.3 percent)—add close to half of the total value of the budgeted capital expenditure for 2007.
• Large disparity in the complexity and number of projects managed per ministry. The number of projects (contracts) per sector varies from 7,046 for housing and 4,338 in general education, to 137 for electricity, gas, and water. As a result, the size and complexity of the projects and ensuing institutional capacity required to manage the pipeline in each of those sectors vary per ministry. In 2006, the average value of a project on general education was LD0.5 million, while in electricity it was LD85 million (see Table A.2.12 in Volume III).
10.15 The PIP further deepens the bias toward productive investments, i.e. investments devoted to basic infrastructure. Indeed, investments in the same basic infrastructure sectors receive an increased largest allocation of resources: housing (36 percent), electricity, gas, and water (19 percent), and railways and roads (7 percent)—represent about two-thirds of the resources allocated, well above close to half budgeted in 2007. According to the Authorities, “the large volume of infrastructure allocations is designed to meet accumulated and pressing needs in the sector (GPCP 2008a). In contrast, social projects devoted to education (6 percent), and health and environment (1 percent), barely represent 7 percent (Figure 10.1).
Figure 10.1: Overview of Planned Investments by Sector, 2008–12
In million of LD
Education 8,476 Health and Environment 1,107 Electricity, Gas and Water 26,854 Railways and Roads 10,248 Housing and Utilities 51,707 Others 46,753 Total 145,143
Others32%
Electricity, Gas and Water
19%
Health and Environment
1%
Railw ays and Roads
7%
Education6%
Housing and Utilities36%
Source: The General People’s Committee for Planning.
Status of Execution of PIP Expenditures per Sector by the End of 2008 10.16 The PIP compiles projects in four categories as follows: (a) contracted—with financial allocations approved for being disbursed through several years, and divided into completed, and contracted (undisbursed) but not launched yet; (b) new planned projects under study—for which no
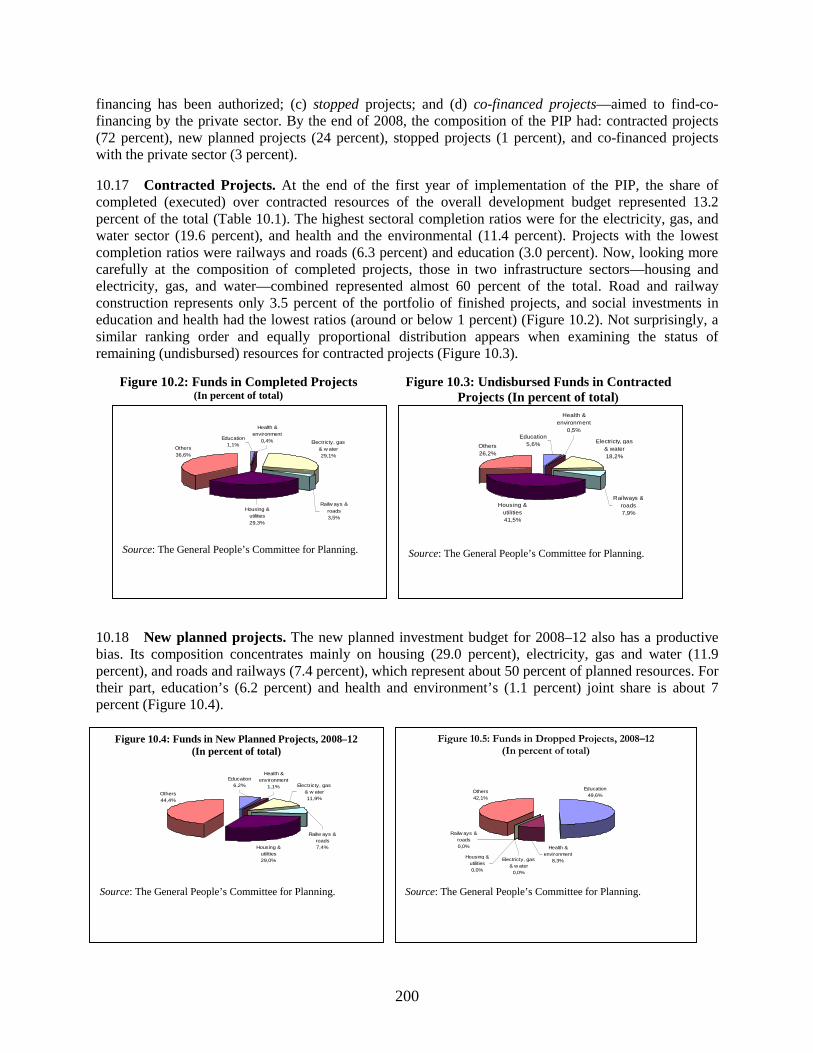
200
financing has been authorized; (c) stopped projects; and (d) co-financed projects—aimed to find-co-financing by the private sector. By the end of 2008, the composition of the PIP had: contracted projects (72 percent), new planned projects (24 percent), stopped projects (1 percent), and co-financed projects with the private sector (3 percent). 10.17 Contracted Projects. At the end of the first year of implementation of the PIP, the share of completed (executed) over contracted resources of the overall development budget represented 13.2 percent of the total (Table 10.1). The highest sectoral completion ratios were for the electricity, gas, and water sector (19.6 percent), and health and the environmental (11.4 percent). Projects with the lowest completion ratios were railways and roads (6.3 percent) and education (3.0 percent). Now, looking more carefully at the composition of completed projects, those in two infrastructure sectors—housing and electricity, gas, and water—combined represented almost 60 percent of the total. Road and railway construction represents only 3.5 percent of the portfolio of finished projects, and social investments in education and health had the lowest ratios (around or below 1 percent) (Figure 10.2). Not surprisingly, a similar ranking order and equally proportional distribution appears when examining the status of remaining (undisbursed) resources for contracted projects (Figure 10.3).
Figure 10.2: Funds in Completed Projects (In percent of total)
Figure 10.3: Undisbursed Funds in Contracted Projects (In percent of total)
10.18 New planned projects. The new planned investment budget for 2008–12 also has a productive bias. Its composition concentrates mainly on housing (29.0 percent), electricity, gas and water (11.9 percent), and roads and railways (7.4 percent), which represent about 50 percent of planned resources. For their part, education’s (6.2 percent) and health and environment’s (1.1 percent) joint share is about 7 percent (Figure 10.4).
Others36,6%
Housing & utilities29,3%
Health & environment
0,4%Education1,1%
Railw ays & roads3,5%
Electricty, gas & w ater29,1%
Source: The General People’s Committee for Planning.
Electricty, gas & water18,2%
Railways & roads7,9%
Education5,6%
Health & environment
0,5%
Housing & utilities41,5%
Others26,2%
Source: The General People’s Committee for Planning.
Figure 10.4: Funds in New Planned Projects, 2008–12 (In percent of total)
Electricty, gas & w ater11,9%
Railw ays & roads7,4%
Education6,2%
Health & environment
1,1%
Housing & utilities29,0%
Others44,4%
Source: The General People’s Committee for Planning.
Figure 10.5: Funds in Dropped Projects, 2008–12 (In percent of total)
Others42,1%
Housing & utilities0,0%
Health & environment
8,3%
Education49,6%
Railw ays & roads0,0%
Electricty, gas & w ater
0,0%
Source: The General People’s Committee for Planning.
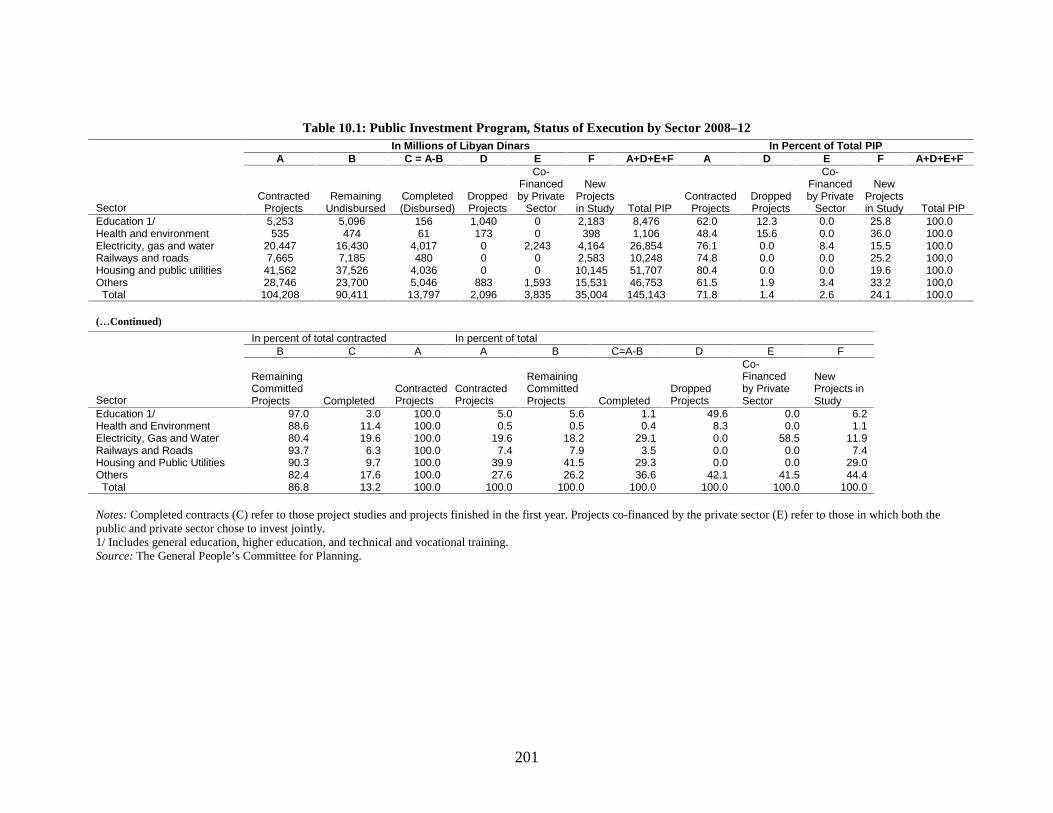
201
Table 10.1: Public Investment Program, Status of Execution by Sector 2008–12In Millions of Libyan Dinars In Percent of Total PIP
A B C = A-B D E F A+D+E+F A D E F A+D+E+F
SectorContracted
ProjectsRemaining
UndisbursedCompleted(Disbursed)
DroppedProjects
Co-Financedby Private
Sector
NewProjectsin Study Total PIP
ContractedProjects
DroppedProjects
Co-Financedby Private
Sector
NewProjectsin Study Total PIP
Education 1/ 5,253 5,096 156 1,040 0 2,183 8,476 62.0 12.3 0.0 25.8 100.0Health and environment 535 474 61 173 0 398 1,106 48.4 15.6 0.0 36.0 100.0Electricity, gas and water 20,447 16,430 4,017 0 2,243 4,164 26,854 76.1 0.0 8.4 15.5 100.0Railways and roads 7,665 7,185 480 0 0 2,583 10,248 74.8 0.0 0.0 25.2 100,0Housing and public utilities 41,562 37,526 4,036 0 0 10,145 51,707 80.4 0.0 0.0 19.6 100.0Others 28,746 23,700 5,046 883 1,593 15,531 46,753 61.5 1.9 3.4 33.2 100,0
Total 104,208 90,411 13,797 2,096 3,835 35,004 145,143 71.8 1.4 2.6 24.1 100.0
(…Continued)
In percent of total contracted In percent of totalB C A A B C=A-B D E F
Sector
RemainingCommittedProjects Completed
ContractedProjects
ContractedProjects
RemainingCommittedProjects Completed
DroppedProjects
Co-Financedby PrivateSector
NewProjects inStudy
Education 1/ 97.0 3.0 100.0 5.0 5.6 1.1 49.6 0.0 6.2Health and Environment 88.6 11.4 100.0 0.5 0.5 0.4 8.3 0.0 1.1Electricity, Gas and Water 80.4 19.6 100.0 19.6 18.2 29.1 0.0 58.5 11.9Railways and Roads 93.7 6.3 100.0 7.4 7.9 3.5 0.0 0.0 7.4Housing and Public Utilities 90.3 9.7 100.0 39.9 41.5 29.3 0.0 0.0 29.0Others 82.4 17.6 100.0 27.6 26.2 36.6 42.1 41.5 44.4
Total 86.8 13.2 100.0 100.0 100.0 100.0 100.0 100.0 100.0
Notes: Completed contracts (C) refer to thoseproject studies and projects finished in the first year. Projects co-financed by theprivatesector (E) refer to those in which both thepublic and privatesector chose to invest jointly.1/ Includes general education, higher education, and technical and vocational training.Source: The General People’s Committee for Planning.
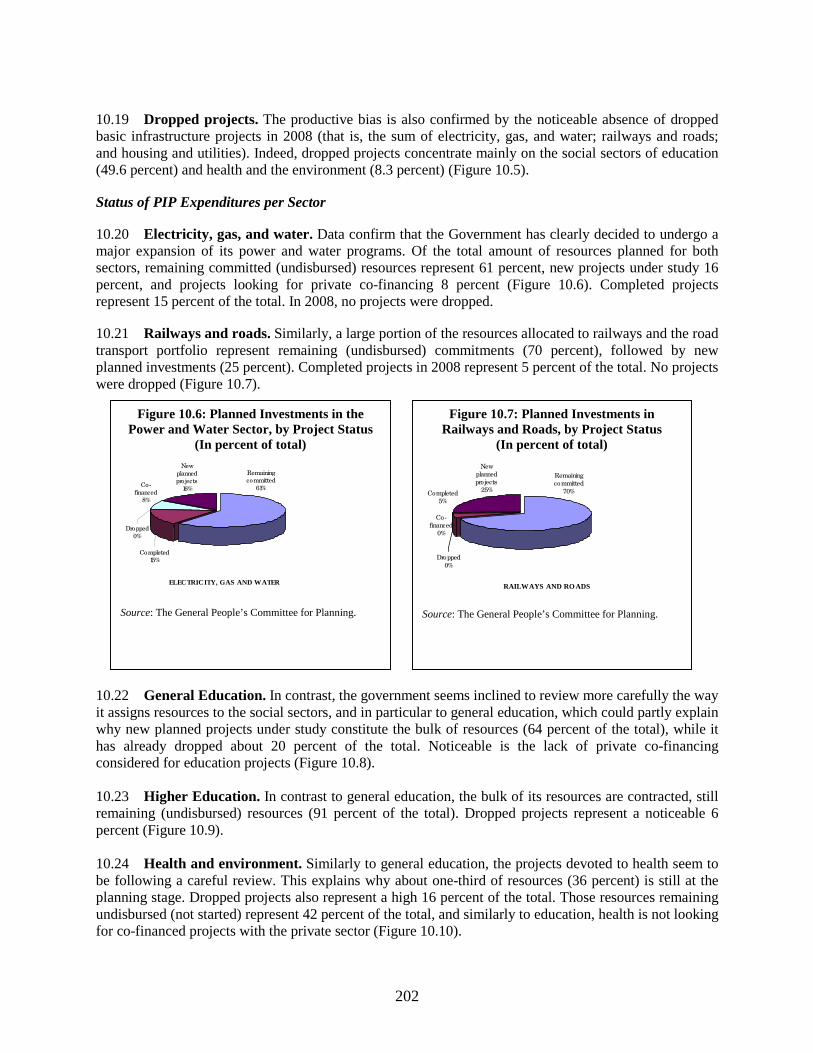
202
10.19 Dropped projects. The productive bias is also confirmed by the noticeable absence of dropped basic infrastructure projects in 2008 (that is, the sum of electricity, gas, and water; railways and roads; and housing and utilities). Indeed, dropped projects concentrate mainly on the social sectors of education (49.6 percent) and health and the environment (8.3 percent) (Figure 10.5). Status of PIP Expenditures per Sector 10.20 Electricity, gas, and water. Data confirm that the Government has clearly decided to undergo a major expansion of its power and water programs. Of the total amount of resources planned for both sectors, remaining committed (undisbursed) resources represent 61 percent, new projects under study 16 percent, and projects looking for private co-financing 8 percent (Figure 10.6). Completed projects represent 15 percent of the total. In 2008, no projects were dropped. 10.21 Railways and roads. Similarly, a large portion of the resources allocated to railways and the road transport portfolio represent remaining (undisbursed) commitments (70 percent), followed by new planned investments (25 percent). Completed projects in 2008 represent 5 percent of the total. No projects were dropped (Figure 10.7).
10.22 General Education. In contrast, the government seems inclined to review more carefully the way it assigns resources to the social sectors, and in particular to general education, which could partly explain why new planned projects under study constitute the bulk of resources (64 percent of the total), while it has already dropped about 20 percent of the total. Noticeable is the lack of private co-financing considered for education projects (Figure 10.8). 10.23 Higher Education. In contrast to general education, the bulk of its resources are contracted, still remaining (undisbursed) resources (91 percent of the total). Dropped projects represent a noticeable 6 percent (Figure 10.9). 10.24 Health and environment. Similarly to general education, the projects devoted to health seem to be following a careful review. This explains why about one-third of resources (36 percent) is still at the planning stage. Dropped projects also represent a high 16 percent of the total. Those resources remaining undisbursed (not started) represent 42 percent of the total, and similarly to education, health is not looking for co-financed projects with the private sector (Figure 10.10).
Figure 10.6: Planned Investments in the Power and Water Sector, by Project Status
(In percent of total)
New planned projects
16%
Dropped0%
Co-financed
8%
Completed15%
Remaining committed
61%
ELECTRICITY, GAS AND WATER
Source: The General People’s Committee for Planning.
Figure 10.7: Planned Investments in Railways and Roads, by Project Status
(In percent of total)
Remaining committed
70%Completed5%
Co-financed
0%
Dropped0%
New planned projects
25%
RAILWAYS AND RO ADS
Source: The General People’s Committee for Planning.

203
The Perhaps Excessive Focus of the PIP on Raising Quantity rather than Quality 10.25 While the Government acknowledges that its public investment policy has an excessive focus on the quantitative side of investment (inputs) rather than on the qualitative side (outputs/outcomes), especially on social—education and health—projects, it is also raising a selectivity issue. In looking more carefully at the detailed composition of the PIP per sector, this issue deserves more attention (Table 10.2). Two examples follow: • In general education, about three-quarters of total
planned expenditures go to school construction (42 percent), the expansion of education facilities (19 percent), and maintenance (13 percent). In higher education and vocational training, construction of universities and training centers represent about two-thirds and one-half, respectively, of their total investment planned. This is also the case for health, which plans to devote 47 percent of its total envelope to new hospital facilities and infrastructure development.
• In contrast, important qualitative components of education—student assessment, developments in support of quality, and human resources development—represent less than 10 percent of total planned spending. Health faces a similar situation, with a very small amount devoted to the sector’s organization (one of its key constraints) and top priority (primary health care development).
IV. Main Factors Strengthening the Technical Efficiency of Public Investments 10.24 In Chapter 4, nine essential components of a modern public investment management system were defined. Not surprisingly, seven of the nine components underscore the importance of complementary mechanisms that frame a sound prioritization in project selection, while the last two address the environment that frames monitoring and evaluation. These components are:
Figure 10.8: Planned Investments in General Education, by Project Status
(In percent of total) New
planned projects
64%
Dropped20%Co-
financed0%
Completed0%
Remaining committed
16%
GENERAL EDUCATIO N
Source: The General People’s Committee for Planning.
Figure 10.9: Planned Investments in Higher Education, by Project Status
(In percent of total)
New planned projects
0%
Dropped6% Co-
financed0%
Completed3%
Remaining committed
91%
HIGHER EDUCATIO N
Source: The General People’s Committee for Planning.
Figure 10.11: Planned Investments in Public Health, by Project Status
(In percent of total)
Remaining committed
42%
Completed6%
Co-financed
0% Dropped16%
New planned projects
36%
HEALTH AND ENVIRO NMENT
Source: The General People’s Committee for Planning.

204
a. Broad and credible strategic guidance to anchor government decisions, derived from a national plan;
b. Proper linkage of the project evaluation process to the budget preparation cycle, with the setting of explicit global and sectoral sustainable envelopes for public investment;
c. A first-level quality at entry screening of all project proposals to ensure they meet the minimum criteria of consistency with the strategic goals;
d. Cost-benefit (or cost-effectiveness) analysis of all projects (see below);
e. Support from a central unit for special and more complex projects and independent peer reviewing of their evaluations;
f. Continuous staff training in project evaluation techniques;
g. Adjustment of the proposed time frame of projects by executing units, so as to make sure implementation capacity fit to their procurement capacity and organizational management constraints (especially on large projects);
h. Regular reporting to guarantee close project monitoring; and
i. Ex post project evaluation, based on output/outcome indicators built ex ante. The Need for Cost-benefit Analysis 10.25. The starting point for sound selectivity is the individual assessment of each public project. Indeed, the most important criterion for distinguishing a good from a bad project is its economic (and social) opportunity cost, measured by the net present value (NPV) of its costs and benefits. The economic rate of return (ERR) of a project is the remuneration to investment stated as a proportion or percentage, often measured by the internal rate of return (IRR), or the discount rate that is needed to make the NPV of an income stream between benefits (B) and costs (C) of a project equal to zero. Thus, the IRR is equivalent to the discount rate r that satisfies the following relationship:
NPV= Nt=1(Bt-Ct)/(1+r)t = 0.

205
Table 10.2: Selected Sectors of the PER: Development Expenditures of the PIP 2008–12 (In millions LD)
G E H R D D A C D D A M M S S H E O M N ICT C CQA H C U H E I P T S S R V T E O T C D S ITC T C T R C P T E W S H H S O D C P F I D P H C D H R D N H E P
P E
G T D R R O P M R P O N R P N R S R R A S R P O P A M U W W I W C E W GMMR D S W W W W D GPC EGW GMMRA H W W W H O M E GMMRA GMMR W U B GMMRA GMMR G S W W D

206
10.26 The PER does not get into a detailed presentation of the economic analysis of investment operations. This task would require a full textbook and ensuing training, and there is already an abundant literature devoted to it (Belli and others 2001). As a practical example, however, Box 10.1 presents a concrete example of the estimation of the NPV of a higher education project.
V. Guidelines for the Intrasectoral Selection of Public Projects 10.27 The previous section focused on the basic requirement any public project should fulfill to be part of the pipeline. In practice, however, the pipeline may have a higher number of projects than the country can actually implement due to financial, human resources, or timing constraints. In addition, even though many projects pass the cost-benefit analysis, their contribution to the sectoral or national strategy varies, either within the sector itself or among all sectors combined. This calls for intra- and intersectoral prioritization. Whereas the next section deals with intersectoral prioritization, this section develops a methodology for intrasectoral prioritization. Despite having many common features across all sectors, intrasectoral prioritization still makes use of specific technical details per sector.
Box 10.1: Mauritius Higher Education Project The projects’ main objective was to increase the productivity of the labor force by graduating more and better students from Mauritian institutions of higher education. The table shows the present value of the project’s costs and benefits and their distribution:
Mauritius Higher Education Project: Net Present Value (In millions of Mauritian rupees)
Benefits/Costs No. of Students Ed. Institutions Government Society Benefits Income gained 2,204 0 945 3,149 Costs Income lost (910) 0 (271) (1,181) Tuition and fees (259) 259 0 0 Investment costs 0 (343) (10) (353) Recurrent costs 0 (144) 0 (144) Transfers – gov’t 0 487 (487) 0 Total costs (1,169) 259 (767) (1,678) Net benefits (1,035) 259 177 1471
Each column shows the costs and benefits from a stakeholder’s point of view and each row shows their distribution among various groups. For instance, from the students’ point of view, the project increases their lifetime earnings by 2.2 billion Mauritian rupees. After deducting tuition fees and the value of lost income while attending school, the net present value amounts to 1 billion rupees. The third column presents the Government’s point of view, that is, the fiscal impact of the project over its lifetime. Of the total incremental income generated by students, taxpayers transferred 945 million rupees to the government via income taxes, while the Government loses 271 million rupees in income taxes, because students do not work while in school. The Government also forgoes 10 million rupees in taxes and transfers 487 million rupees to universities to subsidize the project. The final column is the algebraic sum of the totals. In sum, the analysis integrates the fiscal, economic, and financial analyses and sheds light on important questions like how much subsidy is needed, will institutions of higher education benefit, and under what assumed income will students be better off? Source: World Bank 2001.
207
Methodology to Prioritize Projects in the Health (and Education) Sector 10.28 The methodology of project prioritization in the social sectors has many common features.109 Since most health systems worldwide face time, personnel, and financial constraints, a system of prioritization of investment plans in the sector is highly recommended for rational decisionmaking that has the highest likelihood of improving overall health status. Furthermore, health policy, planning, and financing require a well-thought-out framework and predefined criteria for determining how best to invest in the health sector. Based on Yazbeck (2002), an evaluation of four sequential criteria is proposed to determine the best mix for appropriateness and likelihood of success of the health PIP. These include: (a) population health care needs; (b) the overall health policy objectives; (c) the way in which the projects address key policy objectives, that is, their effectiveness; and (d) their cost-effectiveness per Libyan dinar spent. The criteria follow.
a) Determine priority public health needs: What are the public health problems and the size and demographics of the population affected? To determine the type of investment projects required, it is recommended that public health needs be clearly articulated in terms of the national and subnational—Shaabia-level—needs. Useful indicators often include prevalence rates, demographics, and, where possible, the social, health care, and economic determinants of public health indicators.
b) Define health policy objectives: What is the policy objective associated with each health need? The rationale and strategy for addressing each need should be clearly articulated. For example, if the overall infant mortality rate is high, but higher in certain areas than in others, the policy objective may be to decrease the overall infant mortality rate, with a focus on those areas most affected, which would improve equity in health outcomes.
c) Assess the effectiveness of public projects in linking inputs and outputs/outcomes: What are the expected outcomes of each project in terms of health system performance? Outputs and outcomes vary for projects related to infrastructure, capacity building, public health programs, and so forth. For each project, it is necessary to show the expected effectiveness or impact on health system performance such as: (a) health status improvement, (b) equity, (c) efficiency, or (d) quality of care.
d) Compare the cost-effectiveness of alternative public projects: What is the cost associated to each program in fulfilling the associated public health need(s), that is, what is its return on investment, which is defined as the expected public health gain for each Libyan dinar invested. The gains may be measured in (a) monetary terms (cost-benefit analysis), or (b) in terms of outcomes per dinar (cost-effectiveness analysis). There can also be expected gains in (c) health status, or (d) improvements in efficiency such as bed occupancy rates (percent). Tools available to measure this often include “technology assessments.” A particular “technology” applies to public health programs, infrastructure projects, pharmaceutical procurement, and medical devices. These assessments originated from and are commonly practiced in countries such as Argentina, Canada, Mexico, Sweden, and the United Kingdom.
Table 10.3 summarizes the decision-making process for ranking and selecting public health investment projects in a sequential and transparent way.
109 The methodology for education is similar than the one described for health. Notice that Annexes B and D develop a very detailed analysis of the 2008-12 project pipelines in the education and health Sectors.

208
Table 10.3: Overview of the Investment Prioritization Method in Health 1. Needs
Assessment 2. Policy Objective
3. Investment Program
4. Effectiveness of Project
5. Cost-effectiveness of Project
What are the priority public health needs?
What is the policy objective associated with each health need?
Which project (or program) is associated with each policy objective?
What are the expected outcomes of each project in terms of the performance of the health system?
How efficient is each project expected to be or what is the return on investment?
Project Priority Level 1 (Highest)
To be determined (TBD)
TBD TBD TBD
Level 2 TBD TBD TBD TBD Level 3 TBD TBD TBD TBD
Methodology to Prioritize Projects in the Power Sector 10.29 In general, power systems feature the following characteristics:
• Electricity cannot be stored and demand for electricity is highly volatile.
• Electricity assets (power plants, transmission links, and distribution networks) take time to develop—on average two to seven years. Once commissioned, they have a long life span (20 to 50 years).
• Because electricity demand is highly volatile, most electricity assets are sized to accommodate peak-load demand. Thus, electricity assets do not operate at full capacity.
• To be effective and efficient in servicing such a volatile demand, technology mix is important to minimize total costs. For instance, low-cost technology should be mobilized to service base and intermediate load, and the high-cost technology should be mobilized for the peak load.
• Efficiency requirements also imply locating generation plants as near as possible to the consuming centers. Doing so minimizes transmission costs and losses.
10.30 Selecting investment projects in the power sector consequently boils down to the identification of those electricity assets which, combined, will deliver the lowest delivery cost of electricity to consumers. Electricity demand is indirect by nature and implies that the energy generated by power plants (generation) be wheeled through transmission networks to consuming centers so it can be used for productive purposes. It is therefore implicit that appraising a generation project should include an examination of the capacity of the transmission and distribution networks to accommodate the new energy that will be generated. 10.31 In addition, the ability to forecast long-term demand is a fundamental prerequisite for the development of a secure and economical power system.110 Therefore, the first and most important step is to prepare a generation expansion strategy. A generation expansion strategy reviews different fuel sourcing options and appraises risks associated to availability and price volatility (Table 10.4). Overall, the abundance of carbon fuel resources in Libya considerably lowers availability and price risks for electricity generation projects. Current programs aiming at expanding a gas distribution network across
110 In Libya, the Ministry of Electricity, Water and Gas (MWEG), in association with the Korean firm KEPCO, has conducted a thorough load forecasting study for 2008–25. This study updates and complements previous studies prepared by the General Electricity Company of Libya (GECOL) with the support of Hydro Quebec International. The long-term load forecasting therefore provides the baseline for individual project selection or prioritization.
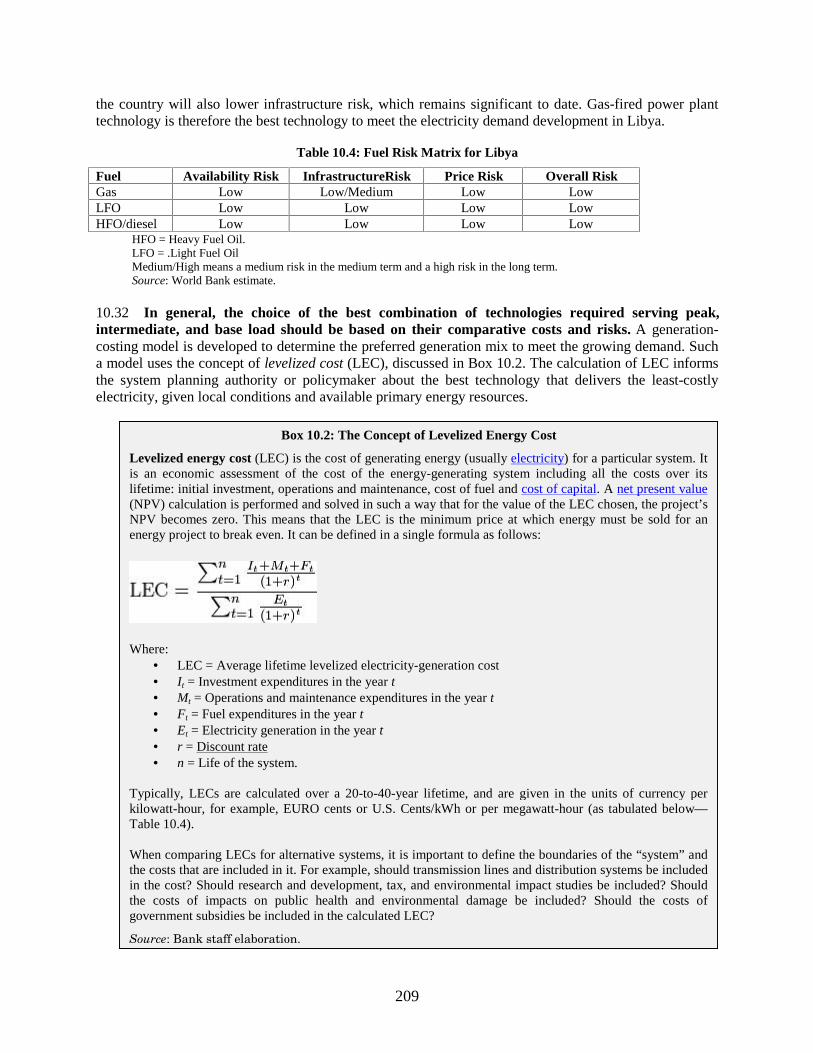
209
the country will also lower infrastructure risk, which remains significant to date. Gas-fired power plant technology is therefore the best technology to meet the electricity demand development in Libya.
Table 10.4: Fuel Risk Matrix for Libya
Fuel Availability Risk InfrastructureRisk Price Risk Overall Risk Gas Low Low/Medium Low Low LFO Low Low Low Low HFO/diesel Low Low Low Low
HFO = Heavy Fuel Oil. LFO = .Light Fuel Oil Medium/High means a medium risk in the medium term and a high risk in the long term. Source: World Bank estimate.
10.32 In general, the choice of the best combination of technologies required serving peak, intermediate, and base load should be based on their comparative costs and risks. A generation-costing model is developed to determine the preferred generation mix to meet the growing demand. Such a model uses the concept of levelized cost (LEC), discussed in Box 10.2. The calculation of LEC informs the system planning authority or policymaker about the best technology that delivers the least-costly electricity, given local conditions and available primary energy resources.
Box 10.2: The Concept of Levelized Energy Cost
Levelized energy cost (LEC) is the cost of generating energy (usually electricity) for a particular system. It is an economic assessment of the cost of the energy-generating system including all the costs over its lifetime: initial investment, operations and maintenance, cost of fuel and cost of capital. A net present value(NPV) calculation is performed and solved in such a way that for the value of the LEC chosen, the project’s NPV becomes zero. This means that the LEC is the minimum price at which energy must be sold for an energy project to break even. It can be defined in a single formula as follows:
Where: • LEC = Average lifetime levelized electricity-generation cost • It = Investment expenditures in the year t• Mt = Operations and maintenance expenditures in the year t• Ft = Fuel expenditures in the year t• Et = Electricity generation in the year t • r = Discount rate• n = Life of the system.
Typically, LECs are calculated over a 20-to-40-year lifetime, and are given in the units of currency per kilowatt-hour, for example, EURO cents or U.S. Cents/kWh or per megawatt-hour (as tabulated below—Table 10.4).
When comparing LECs for alternative systems, it is important to define the boundaries of the “system” and the costs that are included in it. For example, should transmission lines and distribution systems be included in the cost? Should research and development, tax, and environmental impact studies be included? Should the costs of impacts on public health and environmental damage be included? Should the costs of government subsidies be included in the calculated LEC?
Source: Bank staff elaboration.

210
The following tables give a selection of levelized costs from a World Bank report prepared for a fictitious country. Note that these LECs do not include any cost for the greenhouse gasemissions (such as under carbon taxor emissions trading scenarios) associated with the different technologies.
10.33 The comparative cost of the various options considered in this fictitious country (Tables 10.5 and 10.6) shows that:
• For peak load and units running at a load factor of 35 percent or less, the preferred option is gas or HFO.
• For base load, the least-cost option is gas-fired CCGTs. Gas CCGTs also have a significant environmental advantage.
Using a similar analysis, the Ministry of Electricity, Water and Gas (MWEG) in collaboration with the Korean firm, KEPCO, has prepared a generation expansion plan for Libya.111 Their analysis shows in the base scenario that:
• Four 1000 MW CCGTs should be built on or before 2012 • Four 280 MW CCGTs should be built on or before 2012 • One ST 500 MW by 2014 • One 800 MW CCGT by 2015.
10.34 As with the calculation of levelized costs for generation, transmission and distribution costs can also be converted into levelized costs. The calculation is similar with one major difference, which is the non-inclusion of fuel costs. Using the same formula described in Box 10.2, the calculation accounts for: (a) transmission and distribution capital costs, and (b) transmission and distribution operation and maintenance costs. These costs are discounted and divided by the discounted value of the volume of energy (minus losses) wheeled over the network. 10.35 In sum, the load forecast is the basic indicator for selecting investment projects in the sector. Then, individual power projects should also be appraised with respect to their consistency with the long-term plan. To cope with electricity demand development, new investments are needed in generation, transmission, and distribution. Consequently, most generation projects are dependent on complementary projects in transmission and distribution to deliver the maximum impact. While investments in distribution are driven by the location of consumers, investments in transmission depend on the need to wheel the power from generation plants to consuming centers. As a result, generation plants are usually
111 “Planning Electrical Power System Studies for Libya,” MWEG, September 2008, pp. 148–83.
Table 10.5: Levelized Generation Cost – Peak Load Plant (U.S. Cents/kWh)
Public Financing Load Factor Peak Generation
Fuel Typical Size
(MW) 25% 35% Gas turbine Gas 150 11.2 9.9 Gas turbine HFO 150 28.7 27.2 Gas turbine Diesel 150 25.9 24.5 Diesel engine Gas 80 10.5 9.1 Diesel engine HFO 80 10.4 9.0 Diesel engine Diesel 80 22.4 21.0
Source: Bank staff estimates, 2009. Table 10.6: Levelized Generation Cost – Base Load Plant
(US Cents/kWh)
CCGT = Combined Cycle Gas Turbine. Source: Bank staff estimates, 2009.
Public Financing Load Factor Base Generation
Fuel Size (MW)
65% 75% 85% Large CCGT Gas 450 7.5 7.2 7.0 Large CCGT HFO 450 14.7 Large CCGT diesel 450 19.2 18.9 18.7 Large steam turbine Gas 450 8.9 8.6 8.3
Large steam turbine HFO 450 8.6 8.2 7.9

211
located as near as possible to consuming centers to minimize transmission costs and losses. Every additional megawatt of generation should have a corresponding transmission and distribution component, thus giving way to a package of projects including generation, transmission, and distribution. This package requires synchronization in resource mobilization, planning, and commissioning. 10.36 Finally, besides the economic and financial considerations, other criteria that should be considered include:
• Requirements to ensure the overall power system reliability, stability, and security.
• Requirements to comply with stringent environmental and social regulations that will impact the location of power plants or transmission lines, and the selection of technology;
• Time to take a project from inception to commissioning. Some plants are more sophisticated than others and require more time for installation: GCCTs are built in phases and early phases may be commissioned in a shorter time. Wind farms require precise measurements and environmental studies in advance.
• Human capacity to process and supervise projects. This relates to power utility in-house capacity to manage the project cycle, and it relates to the capacity of local subcontractors to deliver project components on time and on budget.
Methodology to Prioritize Projects in the Roads Sector 10.37 When comparing the first draft of the 2008–12 PIP for the roads sector with the revised one, there are no big differences except for the number of projects and the increased size of the budget. The projects are grouped in: (a) ongoing, and (b) planned projects, and these two groups are again split into new investments (new roads or widening of existing roads) and road rehabilitation (mostly pavement reconstruction or strengthening by asphalt overlay). No underlying strategy is included, and there is no indication as to what extent upgrading and improvements are included in rehabilitation projects (for example, widening by adding shoulders and wider/deeper drains). In addition:
• All secondary and agricultural access roads are grouped in two projects, one for ongoing and one for planned. Almost US$1 billion of the budget is projected costs of bitumen for all projects (although it is unclear why since these costs should be allocated to the specific projects).
• Recurrent works expenditures such as regular road maintenance are not included in the budget. A condition-responsive maintenance that will keep the roads not included in the budget in good condition over the program period should include recurrent works (such as routine maintenance, drainage works, and patching) and, for example a 40-to-50-millimeter asphalt overlay when the pavement rutting or roughness reaches a certain level (preemptive maintenance).
• The urban road network seems not to be covered in the road budget since municipal roads are the responsibility of and are budgeted by another ministry, even main arteries through urban areas that connect interurban highways. This is significant since the urbanization rate is 87 percent in Libya, where the population lives mainly in a narrow band along the coast.
• There is also no specific mention of road-traffic-safety-related investments in the budget, and there should be, given the significant accident rates in Libya that are high, but based on unreliable data.
• One would also expect that import- and export-related investments are supported by the road budget through investments in access roads to ports and main airports, and in international roads linking Libya to Tunisia and Egypt.

212
The above observations show a project selection process that appears to be embryonic and unfocused, and a mere list of projects. The danger is also that the funding balance among key categories of road expenditures is suboptimal, leading to losses due to inefficiencies in the allocation of funds. 10.38 Selecting projects in the transport sector is generally a sequential decision-making process for choosing among competing project proposals. Planning, programming, and budgeting involve a series of steps that can be grouped as follows:
a) Definition of goals, objectives, and strategies, to agree on overall purpose and the way forward.
b) Definition of categories of projects in accordance with different objectives and strategies (rural accessibility, highway rehabilitation, traffic safety measures, and so forth).
c) Formulation of effectiveness criteria related to the strategies with the purpose of setting standards for evaluation.
d) Compilation of road infrastructure alternatives (projects) for programming and budgeting. This should include only projects determined to be technically and economically feasible.
e) Evaluation of alternative programming of projects/group of projects using agreed effectiveness criteria.
f) Decision on the selection of preferred program of projects/group of projects.
g) Preparation of multiyear budgets under different funding scenarios and expenditure frameworks. 10.39 Political considerations are normally involved in the goal-setting stage (step a) and the stage where the preferred options or groups of options are selected (step f). This is critical since the politicians and their constituencies represent those with vested interests in the sector. The 2008–12 PIP for roads has no explicit objectives and no budget strategy linked to the pipeline. 10.40 The evaluation stage is the most critical. It uses a widespread approach called multicriteria evaluations to consider a range of decision criteria—environmental, social, political, and economic—with assessments in many forms, both monetary and non-monetary. The prioritization of different highway projects listed within a country or region involves two assessments of particular importance to the overall approval budgeting process:
• An economic evaluation (cost-benefit analysis) calculates the internal economic rate of return. The software program HDM-4 is used for the economic assessment of highway projects and allows determining the priority to be assigned to a specific project.
• An environmental and social evaluation, generally termed an environmental and social impact assessment (ESIA).
For new road projects, a public consultation or participation process is often essential to give decisionmakers some reassurance that the views of all those affected by the road developments have been properly taken into account before the project enters the budget. 10.41 A Road or Transport Sector Master Plan involving public consultations is a very useful planning tool in the preparation and development of a road program or multiyear road budget. Such a plan would normally include all feasible projects, whether affordable or not, and is normally a prior requirement for programming and budgeting.
• Under constrained resources, such a plan would normally give first priority to regular (preemptive) road maintenance (recurrent) expenditures to avoid an erosion of the road asset value and prevent high vehicle operating costs. The highest-priority projects would be

213
those that are not programmed for rehabilitation and/or reconstruction elsewhere in the program. Regular road condition assessments are the basis for ranking of such projects to maximize returns. The focus should be to provide adequate budget allocations to protect past investments and avoid continuing the process of building up a backlog of deferred maintenance works. Determine through simple calculations what the budget should be for recurrent works such as routine maintenance, drainage works, sealing of cracks, pothole patching, and asphalt resurfacing at regular intervals. Allocate these funds separately and use them to keep the roads that are not in the five-year program in stable, long-term condition. The allocations would have to be split into primary, secondary, and rural access road maintenance including gravel roads.
• Reducing any backlog of road rehabilitation caused by past neglect of regular maintenance would normally be a second priority. This could be done over a reasonable number of years to arrive at a “steady state” situation with no additional erosion of road assets annually. The HDM-4 computer model can be used to analyze and rank/prioritize a large selection of road rehabilitation projects to determine the present value of costs to the road agency, road users, and society as a whole and the present value of the losses to society resulting from budget constraints. The pipeline in Libya includes a large group of road rehabilitation projects termed as maintenance, but it is not possible to determine how comprehensive this is.
• Road safety interventions. Projects addressing sections of the road network with an accumulation of fatal or serious traffic accidents (“black spots”) would normally have high priority, especially because these interventions are often inexpensive and yield very high rates of return (up to 100%). This would include improvements to horizontal and vertical alignment of an existing highway to improve sight distance; make a safer and more forgiving roadside; and improvements to intersection designs, street lighting, barriers, and road markings and signing.
• Projects that are preparing future agreed and prioritized projects for implementation are also high priority. Examples are feasibility studies, detailed design, and preparation of tender documents. Another important category of high-priority projects is the one that includes institutional strengthening and capacity-building projects to improve and sustain project implementation of high quality. Also, construction supervision technical assistance is essential to secure good quality of works and high efficiency of funds spent.
10.42 Investments in new roads or road capacity enhancements whether secondary or primary, rural or urban, would normally be categorized and prioritized using the above process in some form. Essential in this respect is the agreement on objectives and strategies, the evaluation and ranking process, and the expenditure framework. In each category of projects, one would group and possibly combine projects with the same objective or outcome, just as road maintenance and road rehabilitation, and so forth, have been singled out above. This would make it easier to assess which type (category) of projects would have higher priority on available budget funds. One example is urban congestion projects where the focus is on improving the service level and reducing emissions, such as urban bypass or ring/orbital expressways. Another example would be international corridors and projects related to trade facilitation, such as access to ports and airports. A third example is projects improving rural accessibility. 10.43 After project alternatives have been categorized, the evaluation and ranking criteria need to be agreed upon based on the objectives and outcomes expected. Some examples of evaluation criteria are: (a) number of beneficiaries affected, (b) regional development and/or rural/urban migration impact, (c) contribution to economic growth, (d) social and environmental impact (land acquisition, resettlement), (e) internal economic rate of return, (f) agriculture and rural accessibility impact, (g) public-private partnership impact, and (h) urgency of project implementation. These are just examples of possible evaluation criteria for road programming and budgeting. The projects in each category would be assessed and ranked using a previously agreed set of criteria. In addition, all projects in each category would be
214
assessed against projects in other categories in the same way, whereby the evaluation criteria can be given different weight depending on political and other considerations (like the need to support productive activities in certain areas). Methodology to Prioritize Projects in the Water Sector 10.44 Libya infrastructure projects in the water sector include opening desalination plants, laying integrated water distribution networks, setting up pumping stations, and constructing new ponds and reservoirs. One of the challenges Libya faces is their prioritization. With scarce resources, it is essential to devise a method to facilitate project selection that gives the best social return for investments. For a large number of projects, this is a formidable task, requiring both time and expertise. This section suggests a method. 10.45 Increased use of nonrenewable—deep aquifer—underground water is not in the long-term interest of Libya.112 Such extractions, if they are to occur, are preferable from areas that are already inhospitable and where marginal effects of depletion will be low. Hence, deep aquifer withdrawal from the Sahara Desert with transfer through the Great Man Made River (GMMR) to the north is a better option than deep aquifer withdrawal in northern areas. Furthermore, the use of surface water, renewable groundwater, and desalination should be encouraged compared to nonrenewable fossil water. 10.46 Water is used primarily in agriculture and for urban and industrial purposes. The agriculture policy of the Government is to encourage cereal production within the country to reduce dependence on imports. Approximately 160,000 hectare of agricultural land can be irrigated if infrastructure is renovated and expanded. In urban areas, the Government intends to expand urban household coverage from 63 percent to 72 percent by 2012. Per capita supply is very high at 450 liters per capita per day, indicating wasteful use, which is unsustainable in a country with low water availability. Industrial use is due mostly to the oil industry, which consumes 375 million cubic meters (MCM) per year, and its needs are growing at 8 percent per year. Since the oil industry is the backbone of the Libyan economy, its water requirements are important from a national economic perspective. Sanitation coverage is poor: 30 percent of wastewater is collected and 11 percent treated. Thus, much of the wastewater is discharged into the environment untreated (44 MCM per year). 10.47 A simple methodology of project selection that goes beyond standard cost-benefit analysis is proposed. First, the opportunity cost of each project is identified. Although absolute dollar (or cardinal) value of the cost is known from engineering estimates, this is not a meaningful comparison because only an ordinal determination of benefits is possible. Hence, there is a need to convert the absolute value of the cost into the number of people benefiting per thousand-dollar investment. The implicit assumption is that the greater the number of people benefitting for each dollar invested, the better is the project. All projects are ranked from high to low. This measure of the cost is given equal weight since the benefits are independently ranked from high to low, as described below. The average rankings of the costs and benefits is then computed and the projects re-ranked using this average, thus giving the final order of project preference.
10.48 An example of cost ranking is given next. Suppose two projects are compared:
(i) Desalination Plant Project at Al Marag. Cost: US$123,140 thousand; Benefit: 1 million people.
112 Libya is highly dependent on groundwater. In all, about 5,000 million cubic meters (MCM) are consumed per year (2005 figures). Local wells extract 4,495 MCM per year of which 650 MCM per year are renewable. In addition, GMMR transports 389 MCM per year of nonrenewable groundwater from the southern region of Libya to the northern. Surface water accounts for 61 MCM per year and desalination 27 MCM per year.

215
(ii) Water Distribution Project at Al Batnan. Cost: US$179,133 thousand; Benefit: 850,000 people.
The number of people benefiting per thousanddollars invested is as follows:
• Desalination Plant at Al Marag = 8.12 (Rank 1) • Water Distribution Plant at Al Batnan = 4.74 (Rank 2).
Hence, the desalination project at Al Marag is ranked 1 in terms of costs and the water distribution project is ranked 2. If the benefit ranking of the desalination project at Al Marag is 8 (the method for benefit ranking is explained below) and of the water distribution project at Al Batnam is 13, then the net ranking of the two is determined by the average of the costs and benefits as follows:
• Desalination Plan at Al Marag = (1+8/2 = 9/2 = 4.5 (Final Rank = 1) • Water Distribution Plant at Al Batnan = (2+13)/2 = 15/2 = 7.5 (Final Rank = 2).
In this case, the final ranking of the two projects remains the same. 10.49 The method for ranking benefits is a bit more complex. Benefits derive from three aspects: first is the water source, which is linked to environmental benefits; second is water use application, which is linked to social and economic benefits; and third is sustainability, which is linked to demand management and financial returns. These aspects are assigned ordinal values and the multiplicative number of the three values is the ordinal value of project benefit, used for ranking from high to low. Details follow. 10.50 Water source:For any given project, five types of water source access are possible in Libya: (a) shallow underground, (b) local deep underground, (c) deep underground transferred by the GMMR from south to north, (d) surface water, and (e) desalination. The policy objective is to discourage extraction of fossil water and enhance use of renewable water. Therefore, the following ordinal valuation on a two-point scale, is assigned for each category of water source:
Water Source Ordinal Value Assigned • Underground (shallow) 2 • Underground (deep, local) 1 • Underground (deep, GMMR) 2 • Surface 2 • Desalination 2
The underground (deep, GMMR) water source is given a value of 2, equal to renewable resources, even though it is not renewable, because of the committed policy objective of the Libyan government to transfer water from the less-inhabited southern region to the more-populated northern region. Moreover, land in the southern region is already environmentally degraded, and extraction of fossil water is likely to have low marginal environmental impact. 10.51 Water application:A project will result in water application in agriculture, urban, or industrial use following the schematic diagram presented in Figure 10.12. The project will draw water from one of the sources in column A and apply it to column B(i). Urban use of water has the highest priority, as water supply to households is considered more important than any other use of water. Second in priority is industrial use, particularly because of its use by the oil industry. The third priority is agriculture. The ordinal valuation is proposed on a two-point scale. Hence, both urban use and industrial use are given the value 2 and agriculture the value of 1. Column B (ii) further analyzes the use of water. In the case of the

216
agricultural sector, the project may be aimed for water use in cereal production or any other crop production. Since self-sufficiency in cereal production is the policy objective of the Libyan Government, projects expanding cereal production are given the ordinal value of 2 while projects aimed at any other projects are given the ordinal value of 1. In the case of urban water use, the project objective could be reduction in unaccounted for water (UfW), bulk transfer, distribution, or wastewater treatment or production. Technically, the high per capita water supply indicates an unsustainable level of production. Coverage can be expanded if UFW is reduced and conserved water distributed. A project intending to reduce UFW is given the ordinal value of 2. Bulk transfer from other regions through the GMRR project is a viable option compared to fresh production locally. This is given an ordinal value of 1.5. Once water is available, the distribution network becomes essential for expanding coverage. Wastewater treatment infrastructure is also important for public health reasons. Both projects are given an ordinal value of 1. Finally, projects may support production. Although not desirable, this may be the only solution for some of the regions. This is given the ordinal value of 0.5. In the case of industry, the project may use water for oil production, in which case it will have an ordinal value of 2. Otherwise, it will have an ordinal value of 1.
Figure 10.12: Project Decision Tree in Water
Water Source Water Application Sustaina- Ordinal (i)Sector (ii)Purpose bility Benefit value
A B(i) B(ii) C D
GMMR = Great Man Made River. UG = Underground.
10.52 Water sustainability:Column C assigns ordinal values for sustainability. Both agricultural water and urban water are highly subsidized, with low cost recovery and wasteful use. Hence, they are given an ordinal value of 1. In the case of industry, water charges are higher and the economic benefits higher, particularly in the case of oil production, which consumes substantial water. Hence, it is assigned the ordinal value of 1.
Water SourceUG (Shallow) - 2 UG (deep) - 1 UG (GMR) - 2 Surface - 2 Desalination - 2
Project
Agri (1)
Urban (2)
Industry (2)
Cereal (2)
Others (1)
Transfer (1.5)
Dist/Sanit(1)
Productn(0.5)
UFW redn(2)
Oil (2)
Others (1)
1
1
2
D =A*B(i)* B(ii)*C
D =A*B(i)* B(ii)*C
D =A*B(i)* B(ii)*C
217
10.53 Computing the ordinal benefits:Column D computes the ordinal value of benefits from a project by multiplying the ordinal values in A, B(i), B(ii), and C. Computed values are used for ranking projects in terms of benefits. The example follows:
• A project for a distribution network in the case of a UG (deep)-type of source: Ordinal Benefit Value = 1*2*1*1 = 2
• A project for cereal production expansion in case of UG (deep)-GMMR-type of source: Ordinal Benefit Value = 2*1*2*1 = 4
• A project for UFW reduction in the case of UG (shallow)-type of source: Ordinal Benefit Value = 2*2*2*1 = 8.
Thus, the methodology suggests the following prioritization in terms of benefits:
• Rank 1: Project for UFW reduction in case of UG (shallow)-type of source • Rank 2: Project for cereal production expansion in case of UG (deep)-GMMR-type of source • Rank 3: Project for distribution network in case of UG (deep)-type of source.
10.54. The final ranking of projects will have to take into account both the benefits and the costs. While the preceding example considered only the benefits, the project ranked 1 may be the most expensive, and hence not preferable. The methodology proposes averaging the benefits ranking and cost ranking of each project to get a final ordinal rank value. The projects can then be rearranged from low to high. The lower final ordinal rank will imply projects that should receive higher priority.
VI. Guidelines for Intersectoral Prioritization of Public Projects
10.55 If intrasectoral prioritization is already a difficult task, inter-sectoral prioritization is technically and politically a more daunting task, especially in the Libyan context, with limited data and analytical capacity and enormous needs. However, prioritizing is important technically (not all projects will have the same economic and social impact and some projects require other projects to be completed first), fiscally (unrealistic budgets either produce large fiscal imbalances, or, not being implemented, make the budget an irrelevant tool), and politically (poorly prioritized budgets raise expectations, leading to disenchantment). 10.56 All methodologies designed and applied (with active support from the World Bank) have a common feature. They consist at the pre-definition of weighted criteria. At one extreme, there are those methodologies that simplify the number of criteria chosen. For instance, in the cases of Afghanistan and the Maldive Islands (Box 10.3), barely four criteria are used. And in both cases, a requisite filter for integrating the list is that each project should contribute to the national development strategy objectives and be part of the sector’s master plan. The predetermined weights reflect their contribution to the objectives of the strategy, and beyond this simple filter, projects were ranked based on four simple criteria:
• Rationale (weight 15 percent): Should this be done by the public sector or can the private sector adequately undertake the activity? Does the project target the poor?
• Cost-effectiveness (weight 15 percent): For the output of the project, has the least-cost alternative been identified? Are multiyear implications laid out, and is the project likely to be self-financing after completion?

218
• Benefit-cost (including identification of beneficiaries) (weight 50 percent): Have benefits (for example, social, financial) been quantified? Do benefits exceed costs—IRR, Economic Rate of Return (ERR), NPV, and so forth.
• Risk and mitigation (weight 20 percent): Is the project likely to be completed on time? Have allowances been made to address potential physical and financial contingencies? Are there institutional/managerial/technical constraints in carrying out the project? Are there any environmental risks?
Box 10.3: Lessons from the Maldive Islands in Introducing Numerical Ranking in PIP Selection
In 2005, the Government of the Maldive Islands decided to introduce a competitive system for selecting the projects in its Public Investment Plan (PIP). Different issues justified its choice: the precedent PIP process was not working well, there was no way to compare projects across and inside sectors, project proposals far exceeded what could be financed, resource allocation was being driven by how much each ministry/agency received the previous year and by political considerations, and there was a consensus in the Cabinet on the need to improve the efficiency of the process of project selection.
In response, the process of project selection was revamped into two steps. In the firststep, a ceiling for the total budget allocation was set, “guidance” (not exactly ceilings) was provided by the Ministry of Planning on total sectoral allocations, resources were first allocated to ongoing projects (58 percent), and the residual amount was allocated to new projects based on fund availability and predetermined criteria (see below).
In the second stage, project selection was based on two factors: (a) whether or not it contributes to the achievement of the national development objectives (sufficient strategic contribution), and (b) four different aspects of project appraisal that receive a numerical rating. The first part is a necessary requirement, submitted to a “yes” or “no” decision, without which the project cannot be considered for funding. Once it meets this requirement, it is then evaluated on four criteria and given numerical ratings (0 = Weak, 1 = Fair, and 2 = Good). Each rating has a weight assigned, and the weighted average of these numerical ratings provide an objective basis for the decision on whether to fund the project. These criteria (and their corresponding weights) are:
• Rationale for the project, or fit into the sectoral strategy (15 percent) • Cost-effectiveness analysis or identification of the least-costly alternative (15 percent) • Benefit-cost analysis including the benefits and identification of beneficiaries (50 percent) • Risks analysis or how well the risks of a failed project are identified and mitigated (20 percent).
This innovative process of project selection was adopted and continues to be further improved over time.
Source: World Bank 2005.
Based on this ranking, the top-priority projects can be included in the budget up to the sector resource envelope. A framework along the lines put forward above would need to be flexible in accordance with sector-specific circumstances. For example, some sectors like security are not expected to be self-financing, so the point in the second criterion about a project being self-financing after completion would not apply.
10.57 At the other extreme, Moldovia’s list of criteria is extensive and contains an innovative focus on participation and gender and social impact (Box 10.4). The multiplicity of criteria applied certainly adds to the difficulty of being selective. In any case, Moldovia’s list of criteria is grouped in five categories as follows: (a) social, (b) institutional, (c) economic, (d) technical, and (e) environmental.

219
Box 10.4: Moldovia’s Criteria in Selecting Public Projectsi. Social Criteriaa) Community Participation• The percentage of the adult population of the community who attended the general community meeting (GCM) and supported the selection of project is not less than 30%;• Thepercentageof theadult population of thecommunity who supported theproject through petition is not less than 50 percent;• No more than two villagecouncil officialsarepresent on elected Project Committee (MC); has theMC adhered to deadlines in preparation of theproject?• Size and sources of the community contribution are acceptable for the Ministry of Finance (MSIF); is the community willing to participate in the implementation of programs to
improveservices; and is thereasound plan by thecommunity to supervise theproject implementation?b) Social Impact• The labor cost of theproject isat least 20% of total cost; does theproject createa number of temporary jobs for community (no. of person-days of employment created)?• Therationale/need/urgency of works to besupported by theproject is evident; is theproject targeted to impact women, children, poor, and vulnerable?c) Gender Impact• The project has a direct beneficial impact on women and children; if not, appropriate measures are incorporated into project design to ensure women/children beneficiaries; at least
40% of theattendees of GCM arewomen; at least two elected members of theMC arewomen.ii. Institutional Criteriaa) Ministry or Community (implementing agency) Organizational Capacity• The capacity of the implementing agency (IA) to do the project; existence of community organizations or other agencies that can act in that capacity, when such a capacity is
lacking within thebenefiting community;• Theexistenceof other organizations with the necessary expertise, e.g., contractors, consultants, NGOs, etc.; assess the mayor’s (primaria) cooperation/participation;• The existence of an organization to undertake the operations and maintenance and/or ability/capacity of MC to remain as entity to undertake operation and maintenance;• Community capacity to make any in-kind and financial contributions to project and for its further O&M;• Determine the need for training/technical assistance and make the necessary arrangement to satisfy the needs; assess the soundness of the sustainability plan, budget, and schedule
for O&M; the history of the community in mobilizing for infrastructure repair, maintenance, and operation in the last two years.b) Implementing Agency Capacity• What is the status of the organization? Is it properly registered? Can it be/does it want to be registered?• Does it have the requisite technical and organizational experience? Does it have credibility with the beneficiary groups it intends to work with in implementing the project?• Does it have a competent and motivated staff? Does it have an adequate administrative and organizational capacity to enable it to meet the operational and reporting requirements of
the EO? Does it have a satisfactory accounting systems? Does it have the ability to supervise and assist the beneficiaries to make a success of the project?c) Approvals and Agreements• The project has obtained the agreement of the local government and/or central government where required by Moldavian law;• The facility is owned by the local village council; is there a Memorandum of Understanding for facility maintenance and operation signed with the local village council?d) Sustainability• Existence of organizations that would pay for the recurrent costs and maintenance after withdrawal of donor resources;• Creation of Beneficiary/Users’ Association or possibility of the IA to continue involvement in management of facility; has a “sustainability fund” been created?iii. Economic Criteria• The cost of the project is not more than S75,000 (in case of school consolidation S100,000); is the project financially feasible?• The costs are realistic and take into account all potential items of expenditure; is community contribution at least 15% of project cost out of which at least 3% is in cash (for
economic infrastructure at least 7.5% cash)? for economic infrastructure, tariffs should be calculated, maintenance costs are incorporated into tariff, and fees will be paid; what arethe disbursement and procurement conditions? Are cost-benefit analyses of project, such as cost per beneficiary, and cost per unit, within the limits acceptable?
• What is the capacity of the infrastructure facility vis-à-vis the actual and expected demand?iv. Technical Criteria• Ensure that the necessary studies such as a feasibility study, geological, technical, and other expertise, additional supervision, etc., are completed and results/necessary measures are
incorporated into the project design and cost;• Ensure the compliance of design with the national and the MSIF-adopted construction norms and standards.v. Environmental Criteria• The project has been screened and there are no adverse impacts on the environment, and if there are, suitable mitigating measures are taken; are they incorporated into project
design?• Compliance with the environmental impact checklist as per type of the project.vi. Gender Impact Criteria• Does theproject haveadirect beneficial impact on women and children? If not, appropriatemeasures are taken to cover women and children in design.
Source: Bank staff’s elaboration.
220
10.58 Finally, an intermediary case, in terms of a limited number of intersectoral selection criteria, is Armenia. Projects are scored based on indicators with the following underlying principles:
• Ensuring uniform approaches
• Preventing the possibility of any preference
• Matching the economic frameworks to the maximum extent
• Use of publicly accessible methods
• Ensuring assessment of the long-term impact to the extent possible
• Ensuring maximum comparability
• Providing scope for current monitoring, post-project analysis, and accountability processes. 10.59 The assessment used only official statistical data. Where the annual data from the previous year did not exist, the respective average value of the indicator for the previous three years was taken. The Ministry of Economy coordinated and implemented the assessment activities with the involvement of representatives of the relevant ministries and World Bank experts. 10.60. The project rating is assigned based on the following eight indicators:
1. Beneficiaries: The number of potential immediate users of the project implementation outcomes underlies the calculation of the indicator. The rating is assigned in proportion to the percentage of the users (beneficiaries) in the population of the Republic. For instance, if it targets the whole population, it is rated 10.
2. Government priority: This is assessed on whether it aligns with the target policies in the Government Program, the Poverty Reduction Strategy Paper (PRSC), and the National Security Strategy, with a 4:4:2 ratio, respectively.
3. Contribution to economic growth: The value of the indicator is determined in proportion to the contribution of a particular sector to GDP growth.
4. Substitution by domestic capacities: This is scored based on the degree of financing to be implemented from domestic, rather than domestic resources. It is scored on a scale of 1–6: 2 (“fully substitutable”), 4 (“partly substitutable”), and 6 (“not substitutable”).
5. Social impact: This indicator is scored 1 (“contributes to maintaining the employment level”) or 2 (“contributes to increasing the employment level”). Each 30 percent increase in the employment level (regional) is given an additional score of 1.
6. Public-private partnership: Shows the potential for maximum private sector involvement in project implementation. The basis is whether there are specific projects with private sector involvement. The indicator is scored on a scale of 1–5, where 5 is the best score.
7. Alternative solution to the problem: This is scored based on the absence of an alternative for addressing the problem. The objective possibility of addressing the problem through alternative ways is viewed as an alternative. It is scored on a scale of 1–5: 1 (“there is an alternative”), 3 (“there is a partial alternative”), and 5 (“there is no alternative”).
8. Urgency of project implementation: Rates the risk of not implementing or postponing the project implementation in this period. This is scored on a scale of 1–10: 3 (“no risk”), 6 (“medium risk”), and 10 (“high risk’).
9. Level of capitalization: This indicator is calculated as the ratio of the total capital to total assets determined by dividing the sum of core capital and supplementary capital by the total

221
average assets. On a scale of 1–10 the scores are assigned in proportion to the level of capitalization.
The technical details on each of those indicators are as follows: Notes: a. The rating is the arithmetic mean of individual indicators. b. Shows the number of users of project outcomes and scores on
ascale of 1–10, where 10 is the best score. c. Assessed based on whether it matches the priority targets in
the strategic documents of the ROA Government on a scale of 1–10, where 10 is the highest score.
d. Measured by the average productivity in the target sector or value added per unit cost on a scale of 1–10, where 10 is the highest score.
e. Assessed based on the degree of inexpediency of being implemented by domestic resources on a scale of 1–6, where 6 is the best score.
f. Shows the possibility of new job openings in the region and is scored on a scale of 1–5, where 5 is the best score.
g. Shows the possibility for the highest private sector involvement in project implementation and is scored on a scale of 1–5, where 5 is the best score.
h. Scored based on the absence of an alternative for solving the problem on a scale of 1–5, where 5 is the best score. i. Assesses the risk of not implementing the project in this period or postponing it and is scored on a scale of 1–10, where 10 is
the best score. j. Shows the appraisal of the property value through estimating the expected revenues in the full period of its implied use or
the attribution of expenditures made in a particular period to long-term assets or reinvestment of earned profit. It is scored on scale of 1–10, where 10 is the best score.
VII. Policy Recommendations 10.61 At the macro level, Libya’s 2008–12 Public Investment Plan (PIP) already contains a significant bias toward productive activities. On the one hand, resources allocated already give high priority to investments in basic infrastructure. On the other hand, projects in the social sectors seem to be receiving a lower proportion of resources and closer scrutiny than in the past, as reflected by the significant number (and share in the overall total) of education and health projects dropped in the past two years with available information on executed expenditure (2006 and 2007). 10.62 At the present stage, the application of the methodology of project prioritization with a productive bias can, perhaps, only be applied to a minority share of the 2008–12 PIP. On the one hand, the PIP gives priority to ongoing projects. On the other hand, barely one-quarter of the total pipeline remained available as “new projects under study” by end-2008. All other ongoing projects have been contracted and remained undisbursed by such date. 10.63 Always at the macro level, selectivity requires that the pipeline of projects be framed. Three factors delineate the framework for selectivity: (a) the amount of available resources, determined by the size (ceiling) of the sectoral and overall expenditure envelope; (b) the link between the project’s objectives and the broader sectoral and national strategy (if any); and (c) the objective assessment (reality check) of the implementation capacity of the executing units. 10.64 At the micro level, a selectivity bias toward pro-productive activities requires first and foremost sound technical projects. This is critical, especially in basic infrastructure projects, supported by sound feasibility studies that guarantee the achievement of high economic rates of return. Furthermore, large and more complex projects might require the support of a specialized agency (see Chapter 4).
Name of the Project Overall ratinga
Beneficiariesb
Government priorityc
Contribution to economic growthd
Substitution bydomestic financinge
Social impactf
Public-private partnershipg
Alternative solution to the problemh
Urgency of project implementationi
Level of capitalizationj

222
10.65 Then, intrasectoral prioritization is needed in second place. There is no unique methodology for intrasectoral project prioritization, despite a significant number of common features. Common features are: (a) the policy objective, (b) the effectiveness potential, (c) linking measurable inputs to outputs/outcomes, and (d) the cost-effectiveness analysis that uses cost-benefit analysis only as its starting point. The number and mix of sector-specific intrasectoral criteria vary per sector. They range from one central criterion, like the “levelized energy cost” in the power sector, to a broader range of multiple criteria, like in water. 10.66 Third, intersectoral prioritization can also contribute to introduce a productive bias as a complement to intrasectoral prioritization. In a similar vein, there is no unique methodology for intersectoral project prioritization, but in this case, all approaches available have a single common feature: they rely on the pre-definition of weighted criteria. The number of criteria can be small (below 5), which is the case of countries having scarce and poor-quality data, or large. Criteria chosen can also represent a mix of technical and political considerations. Often, an information technology (IT) system is used to minimize the influence of political considerations and make the selection process more objective. 10.67 Intra- and intersectoral prioritization can be complementary and not necessarily mutually exclusive. Intersectoral prioritization often intervenes in countries suffering severe fiscal constraints. Intrasectoral prioritization often takes place in governments featuring strong ministerial entities, with little interministerial coordination.

223
References
Adam Smith International (2006). “Libya Public Administration Development Program, Education Sector Preliminary Report”. Monitor Report.
Aho, Gilbert, Sylvain Larivière and Frederic Martin (1997). Manuel d’Analyse de la Pauvreté. UNDP. Université de Laval.
Alberto Chong and Martín Rama (2000). "Do Separation Packages Need to Be That Generous?" Simulations for Government Employees in Guinea-Bissau. The World Bank.
Alesina, Alberto, Noriel Roubini and Gerald Cohen (1997). Political Cycles and the Macroeconomy. The MIT Press
Annual Reports of the GPC of Education, 2006-2007.
Annual Reports of the GPC of Finance, 2003-2007.
Annual Reports of the GPC of Health, 2006-2007.
Annual Reports of the GPC of Manpower, 2006-2007.
Annual Reports of the GPC of Planning, 2005 and 2006.
Annual reports of the GPC, 2002-2007.
Annual Reports of the Libyan Central Bank, 2005-2007.
Baiou, Mustapha Abdullah “Some historical features on Libya”, Benghazi: El Ahlia press.
Barnett, S., and R. Ossowski, 2003, "Operational Aspects of Fiscal Policy in Oil-Producing Countries"in Fiscal Policy Formulation and Implementation in Oil-Producing Countries, ed. by J. M. Davis, R. Ossowski, and A. Fedelino (Washington, IMF).
Belli Pedro, Jock Anderson, Howard Barnunm, John Dixon and Jee-Peng Tan (2001). “Economic Analysis of Investment Operations.” WBI Development Studies. Washington DC
Booz Allen Hamilton (December 2006a), GECOL “Strategic plan – integrated financial analysis.”
Booz Allen Hamilton (December 2006b), GECOL “Strategic plan 1st deliverable.”
Booz Allen Hamilton (December 2006c), GECOL “Strategic plan, second deliverable.”
Brimelow, Peter (1993). “Why the deficit is Wrong Number”. Forbes Magazine, March 2005.
Burki, Shahid Javed and Guillermo perry (1998), “Beyond the Washington Consensus, Institutions Matter.” The World Bank. Washington DC
Business Monitor (2007), “Libya Infrastructure Report.”
CERA (2006), “Analysis of the oil, gas and power sector in Libya, Appendix A.”
Collier, Paul and B. Goderis (2008), “Commodity Prices, Growth ans the Natural Resource Curse: reconciling a Conundrum, mimeo, Centre for the Study of African Economies. University of Oxford. Oxford.
Collier, Paul and Anthony Venables (2008), “Managing Oil Resources: Lessons for Low Income Countries.” Mimeo. University of Oxford. Oxford.
Congress (2005), “Draft bill on establishment and organization of a financial audit.” Tripoli

224
Congress (2007a), “Budget Law No 1 for 2008.”
Congress (2007b), “Law no.2 (1375/2007) related to the organization of auditing.”
Congress (2007c), “Law no. 13 enacted in 1430 related to Planning.”
Congress “Bill on inspection and popular control.” Tripoli
Cf. Monitor Group (2006) “National Economic Survey”.
David Sewel (2006), “Implicit oil subsidies in Libya, note”. Mimeo.
David L. Lindauer, 1988. "Government Pay and Employment Policies and Government Performance in Developing Economies". Working Papers. World Development Report 1988.
Decrees and Ordinances and application texts related to the organization, functioning, and restructuring of the Libyan Public Administration.
Desmond Bermingham, 2006. "The Education For All, Fast-Track Initiative (EFA-FTI)". OECD-DAC Paris December 2006.
Diego F. Angel-Urdinola and Quentin Wodon, 2006, “Do Utility Subsidies Reach the Poor?” Framework and Evidence for Cape Verde, Sao Tome, and Rwanda, world bank policy working paper, September
Domestic Security Organism (2007), “Expenses and Monthly Accounts Report.” Tripoli.
Ebinger, Jane O. (2007), “Measuring financial performance in infrastructure: an application to Europe and Central Asia.” World Bank Policy Working Paper series No 3992.
El Fellah, Majda (2006), “Road Traffic Injuries in Tripoli, 1994-2004.”British Medical Journal, October.
El-Fituri AA et al (2006), “Health education in the Libyan Arab Jamahiriya: assessment of future needs.” Eastern Mediterranean Health Journal 12(Suppl 2):147-56.
El Geriani, A.; M. O. Essamin; P. J. A. Gijsberg; and D. P. Loucks (1998), “Cost-Effectiveness Analyses of Libya’s Water Supply System.” Journal of Water Resources Planning and Management. November/December 1998.
Elhassadi Abdulmonem (2007), “Libyan National Plan to Resolve Water Shortage Problem”. Part 1-A: Great Man-Made River (GMMR) Project—Capital Costs as Sunk Value.” In Desalination, Volume 203, Issues 1-3. February 2007. Pages 47-55.
Elhassadi Abdulmonem (2008), “Views on Libyan National Plan (LNP) to Resolve Water Shortage Problem (WSP)”. Part 1-B. Great Man-Made River (GMMR) Project—Capital Cost with Interest Rates.” In Desalination Volume 220. Issues 1-3. March 2008. Pages 184–88.
FAO (2005), “Libyan Agricultural Competitiveness Assessment (draft report).”
Fay and Ypes. 2002. “Study on the Transport Infrastructure’s Needs.”
GAI (2002-2003), “Libya Household Survey 2002-2003 Guide to Respondents.”
GAI (2002-2003), “Libya Household Survey 2002-2003 Questionnaire Index.”
GAI (2002-2003), “Libya Household Survey 2002-2003 Questionnaire.”
GAI (2002-2003), “The Economic and Social Survey.”
GAI (2005), “Statistical book 2005.”Tripoli.
GECOL (2002, 2003, 2004, 2005, 2006, 2007) “Annual reports.”
GECOL, “Annual statistics reports”.
225
General Information Authority; Most of its publications.
GMMR Development Program 2008-2012. Unpublished document. In Arabic.
GPC General Education, World Population Prospects, the 2006 Revision Population Database, United Nations, Population Division, General Authority for Information and our calculation.
GPC “Higher Education, yearbook 2006-2007”.
GPC (2007a), “Budget law implementation for FY 2007.”
GPC (2007b), “Public procurement code.” Tripoli.
GPC (2007c), “Public procurement code reform.” Tripoli.
GPCF (2005a), “Recurrent budget details for 2005.”
GPCF (2005b), “Investment budget execution from 01/01 to 12/31/2005.”
GPCF (2005c), “Implementation Report of the recurrent budget including Defense for 2005.”
GPCF (2005d), “Implementation Report of the recurrent budget including Defense for 2006.”
GPCF (2006a), “Recurrent budget details for 2006 – Sectors.”
GPCF (2006b), “Recurrent budget details for 2006 – Shaabiats.”
GPCF (2006c), “The Follow-Up Report on the Implementation of the Management Budget and the Defense and Support Budget 2006.”
GPCF (2007a), “Activity of the finance sector during the period from 01/01 to 09/30/2007.”
GPCF (2007b), “General budget follow up from 01/01 to 09/30/2007 - Wages and recurrent expenditures.”
GPCF “Organic budget law.” Tripoli.
GPCHE (2005a), “Annual Health Statistics Report.”
GPCHE (2005b), “Development Program for Health and Environment 2008-2012.”
GPCM (October 2007a), “Monthly report 2007.” Tripoli
GPCM (August 2007b), “Bi-annual financial report, follow up of financial law implementation till 06/30/2007.” Tripoli.
GPCP (2004a), “Decision no 3 on the Popular Planning Committee aiming at revising the statutes of the administrative body of the General Executive Planning Board.”
GPCP (2004b), “Follow up on budget implementation for FY 2004, part II - Sectors.” Tripoli.
GPCP (2004c), “Development budget follow up report for 2004.”
GPCP (2005a), “Follow up on budget implementation for FY 2005 Part 1- General Evaluation – Sectors.”
GPCP (2005b), “Follow up on budget implementation for FY 2005 Part 2- Shaabiats.”
GPCP (2005c), “Report on the development budget for 2005.”
GPCP (2005d), “Explanatory note on budget for 2005 – draft.” Tripoli.
GPCP (2005e), “Note on the general budget for 2006– draft.” Tripoli.
GPCP (2006a), “Budget implementation.” Tripoli.

226
GPCP (2006b), “Status of the shift budget implementation for 2006.”
GPCP (2006c), “Follow up on budget implementation for FY 2006.” Tripoli.
GPCP (2006d), “Development budget follow up report for 2006.”
GPCP (2007a), “Report on the development budget for 2007.”
GPCP (2007b), “Proposed actions for management, offices and various departments.” Tripoli.
GPCP (February 2007c), “Procedure of the execution of the financial bill 2007.” Tripoli.
GPCP (February 2007d), “Budget implementation bill for 2007.” Tripoli.
GPCP (February 2007e), “Implementation process of development plans.” Tripoli.
GPCP (June 2007f), “Request of financial authorization.” Marine Research Center. Tripoli.
GPCP (June 2007g), “Request of financial authorization.” Medical Specialist Council. Tripoli.
GPCP (November 2007h), “Request of financial authorization.” Development Organism. Ghdames.
GPCP (November 2007i), “Financial authorization – Disbursement.” Tripoli.
GPCP (November 2007j), “Development Program Report.”
GPCP (October 2007k), “Project Development program for 2008-2012, Part I.”
GPCP (October 2007l), “Contracts and commitments for sectors and regions until December 31, 2007.”
GPCP (2007m), “Allocated fund from January to November 2007.” General Management for Auditing and Control. Tripoli.
GPCP (2007n), “Allocated funds and development spending according to sectors during the period 1970-2007.” Tripoli.
GPCP (2007o), “Development budget auditing.” Tripoli.
GPCP (2007p), “Note on the general budget project of the fiscal year 2007.”
GPCP (2007q), “Draft Law of the general budget for the fiscal year 2007.”
GPCP (2007r), “Contracts and commitments for sectors and regions as at 12/31/2007.”
GPCP (2007s), “Preparation and implementation of development budget.”
GPCP (2007t), “Follow up on the preparation and implementation of development budget.”
GPCP (2007u), “GPCP development and restructuring program, update of the organizational structure.” Tripoli.
GPCP (2007v), “Proposed organizational structure report.” Tripoli.
GPCP, (2007w),“Guidebook for preparation of the 2008-2012 public investment programs.” Tripoli.
GPCP (2008a), “Potential Developments of the National Economy in Light of the Development Spending program for the Coming Phase.” Tripoli.
GPCP (2008b), “Global Financial and Economic Crisis and its Potential Impacts on the Development program in the Coming Phase.” Tripoli.
GPCP (2008c). “Execution Report on Chapter Three (Development) FY 2007 Budget.” Tripoli
GPCP (2008d). “Execution Report on Chapter Three (Development) FY 2007 Budget—executive Summary.” Tripoli

227
GPCP (2008e). “Draft Implementation Program 2008-2012.” Tripoli.
GPCT (November 2007), “Monthly financial report.” Tripoli.
GPCWEG (2007a), “Urban Water and Wastewater Sector Strategy and Organization: Water Strategy: Baseline.” Report prepared by Booz Allen and Hamilton.
GPCWEG (2007b), “Final Baseline Urban Water and Wastewater Sector Strategy and Organization.” Report prepared by Booz Allen Hamilton, September.
GPCWEG Development Program 2008-2012. Unpublished document. In Arabic.
GWA (2006), “Water Situation in the Great Jamahiriya.” In Arabic.
Heggie, Ian and Rodrigo Archondo-Callao. 1999. “Road User Charges Model.” World Bank, Washington DC.
Human Development Report 2002. United Nations Development Program
IMF Article IV for Libya, 2004-2007.
Independent Evaluation Group (IEG), 2008. "Public Sector Reform: What Works and Why? An IEG Evaluation of World Bank Support.” The World Bank.
Independent Evaluation Group (IEG), 2008. Civil Service and Administrative Reform: Thematic Paper. Draft: March 10, 2008. Public Sector Reform Evaluation Project. The World Bank.
International Energy Agency, “Oil market reports from 2000 to 2007.”
International Monetary Fund (2004), “Public Investment and Fiscal Policy.” Washington DC.
International Monetary Fund (2005), “International Financial Statistics.” Washington DC.
International Monetary Fund (2006), “Libya: Toward Better Public Financial Management: A Strategy of Reforms.” Fiscal Department. Washington DC.
International Monetary Fund (2007a) “Staff Report for the 2006 Article IV Consultation.” Washington DC.
International Monetary Fund (2007b), “World Economic Outlook for April 2007 and October 2007.”Washington DC.
International Monetary Fund (2007c), “Libya country report – statistical appendix.”
International Monetary Fund “Country Report No. 07/148.” Washington DC.
International Monetary Fund (2008), “Article 4 consultations and country report.”
International Monetary Fund (2008), “World Economic Outlook.” 2007 Database
Komives and others. 2005 “Water and Electricity and the Poor: Who Benefits from Utility Subsidies?” World Bank, Washington DC
Komives, K., V. Foster, J. Halpern, and Q. Wodon, with support from R. Abdullah, 2005, Water, Electricity, and the Poor: Who Benefits from Utility Subsidies? The World Bank, Washington, DC.
Larsen, Sven (2007), “The Economic Case for Limited Governement”. Prosperitas Vol VII, Issue III. Washington, D.C
Libya Household Survey 2002-2003, Libya Household Survey 2002-2003 Questionnaire, Libya Household Survey 2002-2003 Guide to Respondents, Libya Household Survey 2002-2003 Questionnaire Index.

228
Libya Arab Jamahiriya 2007. “Development Program for Health and Environment 2008-2012.” General People’s Committee for Health and Environment.
Lienert, Ian (2003). “A Comparison Between Two Public Expenditure Management Systems in Africa.” IMF WP/03/02. IMF. Washington DC.
Jacques van der Gaag, Morton Stelcner, Wim Vijverberg, 1989. "Public-Private Sector Wage Comparisons and Moonlighting in Developing Countries: Evidence from Cote d'Ivoire and Peru". Living Standards Measurement Study. Working Paper No. 52. The World Bank.
John Haltiwanger and Manisha Singh, 1999. "Cross-Country Evidence on Public Sector Retrenchment".The World Bank Economic Review, Vol. 13, No. 1: 23–66.
Lienent, Ian (2003). “A Comparison Between Two Public Expenditure Management Systems in Africa”.IMF, WP/03/2. Washington DC.
Marek et al (2003). “Private Health: Policy and Regulatory Options for Private Participation.” Public Policy for Private Sector Note No. 264. Washington DC, World Bank
Martín Rama and Donna MacIsaac, 1999. "Earnings and Welfare after Downsizing: Central Bank Employees in Ecuador". The World Bank Economic Review Vol. 13, No. 1: 89–116. The World Bank.
Martín Rama, 1997. "Efficient Public Sector Downsizing". Research project on Public Sector Retrenchment and Efficient Compensation Schemes, supported by the Research Committee of the World Bank.
Martín Rama, 1999. "Public Sector Downsizing: An Introduction". The World Bank Economic Review, Vol. 13, No. 1: 1–22.
Merza, A.K. (2008a). “The Model of the Macro Framework of the Development Program 2008-12.”UNDP/Endesa, Tripoli.
__________ (2008b). “Consequences of the International Financial Crisis on Crude Oil Prices and Subsequent Impact on Investment, Growth, Inflation and Standards of Living.” UNDP/Endesa, Tripoli.
Ministry of Economy of Armenia (2008). “On Selection of Projects to be Implemented in Armenia with the World Bank under the Country Assistance Strategy.” Armenia.
Mitchell, Donald. “The Impact of Government Spending on Economic Growth”. The Heritage Foundation No. 183, Washington DC.
Nikolic and Maikisch (2006). “Public-Private Partnerships and Collaboration in the Health Sector: An Overview with Case Studies from Recent European Experience.” Washington DC, World Bank
NPC (2003), “Agricultural Policies.” In Arabic, downloaded from www.npc.gov.ly.
NPC (2005a), “Sectors policy measures, No 74/1 – updated.”
NPC (2005b), “Sectors policy measures, No 74/2 - Complementary policies and execution indicators.”
NPC (2006), “Funds allocation rules and development authorization for social and economic projects.” Tripoli. P. Noumba et al (1998), “Introduction to Engineering Economics, CNET.” Paris (France)
Preker et al (2007), “Public Ends, Private Means: Strategic Purchasing of Health Services.” Wasahington DC, World Bank
Rajaram, A., Tuan Minh Le and Nataliya Biletska (2008). “Public Investment Efficiency: Guidance Note on an Indicators-based Approach.” The World Bank. Washington DC
229
Russo P (2005), “Welfare in the Mediterranean countries: Great Arab Popular Socialist Libyan Jamahiriya.” New York: United Nations Public Administration and Finance and CAIMED.
Sarraf, Feridou (2005). “Integration of Recurrent and Capital “Development” Budgets: Issues, problems, Country Experiences and the Way Forward. Implementation Note. The World Bank, Washington DC
Saavalainen and Joy Ten Berge (2006), “Quasi fiscal deficits and energy conditionality in selected CIS countries.” IMF Working Paper, WP/06/43
Smith Adam (2006) “Public Administration Reform Program” Mimeo
Stevens, Michael (2008). “Merger of Ministries of Finance and Planning.” Mimeo. The World Bank. Washington DC.
Technical Committee for the Study of the Water Situation (TCSWS) (1999), “Study of the Water situation and Strategy for Water Resource Management for 2000-2025.” In Arabic.
“The Follow-up Report on the Implementation of the Management Budget and the Defense and Support Budget for the Year 2006.”
UNESCO Institute of Statistics. UN Statistics Division Common Database
United Nations Development Program (2002), “National Human Development” Libya
United Nations Development Program (2003), “National Human Development” Libya
United Nations Development Program (2005), “Human Development Report.” New York: UNDP.
United Nations Development Program (2007), “Human Development Report.” New York: UNDP.
United Nations Statistical Division (2008), Common Database.
Vandewall, Dirk. 1998. “Libya since Independence; Oil and State Building”. Ithaca, NY: Cornell Univesity Press.
Wagstaff A, van Doorslaer E, O’Donnell O and Lindelow M (2003), “Quantitative techniques for health equity analysis: a series of 20 technical notes.” Washington DC. World Bank.
Wagstaff and Moreno-Serra (2007). Europe and Central Asia’s Great Post-Communist Social Health Insurance Experiment: Impact on Health Sector and Labor Market Outcomes. Policy Research Working Paper 4371. Washington DC. World Bank
Wagstaff et al (2007). Social Health Insurance Reexamined. Policy Research Working Paper 4111. Washington DC. World Bank
Weber, David (2008). “Integrating Current and Development Budgets: A Four Dimensional Process.” Mimeo.
World Bank, 1991. "Mozambique: Public Sector Pay and Employment Review, Volume 1". Report N o. 9815-MOZ.
World Bank, 1989. "Road Deterioration in Developing Countries, Causes and Remedies." Washington DC.
World Bank, 1994. "Malawi: Civil Service Pay and Employment Study, Volume 1". Report No. 13071-MAI.
World Bank (2002), “Democratic and Popular Republic of Algeria Public Expenditure Review of the Social Sector (in two Volumes), Volume II: Annexes. Report No. 22591-AL.” Washington DC.
World Bank (2004), “World Development Report,” Washington DC.
World Bank (2005a), “Road Sector Knowledge-Base.” Washington DC.

230
World Bank (2005b), “Improving Project Appraisal and Selection in the Maldives Island’s Public Sector Investment Program.” Washington DC.
World Bank (2006a), “Republique Tunisienne: Etude du Secteur de la Santé.” Washington DC
World Bank (2006b), “Electricity Sector Public Expenditure Review – Iran.”
World Bank (2006c), “Country Economic Report for Libya. – Libya.” Washington DC: World Bank.
World Bank (2007a), “Electricity Sector Public Expenditure Review – Lebanon.”
World Bank (2007b), “Algeria: Assuring High Quality Public Investment”. A Public Expenditure Review. Report No.36270-DZ. The World Bank. Washington DC.
World Bank (2007c), “Making the Most of Scarcity, MENA Development Report.”
World Bank (2007d) “The road not traveled, Education Reform in the Middle East and North Africa”.
World Bank (2008), “World Development Indicators.” Washington DC: World Bank.
World Health Organization (2000), “World Health Report.” Geneva: World Health Organization.
World Health Organization (2007), “World Health Report.” Geneva: World Health Organization.
World Health Organization (2008a), “World Health Organization Statistical Information System.”
World Health Organization (2008b), “Regional Office for the Eastern Mediterranean (2008),” Regional Database.
Yip and Berman (2001), “Targeted Health Insurance in a Low Income Country and its Impacts on Access and Equity in Access: Egypt’s School Health Insurance.” Health Ecconomics, April 10(3):207-20.