socio-hydrologic drivers of the pendulum swing between ... · food production in the initial stages...
TRANSCRIPT

Hydrol. Earth Syst. Sci., 18, 1027–1041, 2014www.hydrol-earth-syst-sci.net/18/1027/2014/doi:10.5194/hess-18-1027-2014© Author(s) 2014. CC Attribution 3.0 License.
Hydrology and Earth System
SciencesO
pen Access
Socio-hydrologic drivers of the pendulum swing betweenagricultural development and environmental health: a case studyfrom Murrumbidgee River basin, Australia
J. Kandasamy1, D. Sounthararajah1, P. Sivabalan1, A. Chanan2, S. Vigneswaran1, and M. Sivapalan3
1University of Technology Sydney, Sydney, Australia2State Water Corporation of NSW, Sydney, Australia3University of Illinois at Urbana-Champaign, Urbana, IL, USA
Correspondence to:J. Kandasamy ([email protected])
Received: 21 May 2013 – Published in Hydrol. Earth Syst. Sci. Discuss.: 5 June 2013Revised: 21 January 2014 – Accepted: 6 February 2014 – Published: 13 March 2014
Abstract. This paper presents a case study centred on theMurrumbidgee River basin in eastern Australia. It illustratesthe dynamics of the balance between water extraction anduse for food production, and efforts to mitigate and reverseconsequent degradation of the riparian environment. In par-ticular, the paper traces the history of a pendulum swing be-tween an exclusive focus on agricultural development andfood production in the initial stages and its attendant socio-economic benefits, followed by the gradual realization of theadverse environmental impacts, subsequent efforts to miti-gate these with the use of remedial measures, and ultimatelyconcerted efforts and externally imposed solutions to restoreenvironmental health and ecosystem services. The 100-yearhistory of development within the Murrumbidgee is dividedinto four eras, each underpinned by the dominance of dif-ferent values and norms and turning points characterized bytheir changes. The various stages of development can becharacterized by the dominance, in turn, of infrastructure sys-tems, policy frameworks, economic instruments, and techno-logical solutions. The paper argues that, to avoid these costlypendulum swings, management needs to be underpinned bylong-term coupled socio-hydrologic system models that ex-plicitly include the two-way coupling between human andhydrological systems, including the slow evolution of hu-man values and norms relating to water and the environ-ment. Such coupled human–water system models can pro-vide insights into dominant controls of the trajectory of theirco-evolution in a given system, and can also be used to in-terpret patterns of co-evolution of such coupled systems in
different places across gradients of climatic, socio-economicand socio-cultural conditions, and in this way to help developgeneralizable understanding.
1 Introduction
Water resource management decisions we make, be theyinfrastructure- or policy related, produce positive or negativeimpacts that in many cases can last a long time. Therefore,in the emergent Anthropocene, given the growing demandfor water resources to satisfy increasing human populations,there is an urgent need for water resources management de-cisions to be based on predictions over long (decadal to cen-tury) timescales. In order to make predictions of future waterresources, we need reasonable models of how future humansocieties will demand, use and supply water. The difficulty inpredicting this is compounded by the fact that humans do notnormally organize themselves solely to optimize access to orutilize water resources. The reality is that humans often useand/or manage water resources so as to maximize the overallwell-being of members of society. Human well-being can beframed in several ways, depending on local circumstances. Itcould be drinking water supply to cities, or water for food orhydropower production; it could be protection from floods orthe maintenance of water quality or ecosystem health.
Consequently, hydrologic predictions over long timescalescannot escape the twin problem of predicting how human so-cieties evolve with respect to how they perceive water use
Published by Copernicus Publications on behalf of the European Geosciences Union.

1028 J. Kandasamy et al.: A case study from Murrumbidgee River basin, Australia
in its many manifestations. The challenge this poses for pre-diction is clearly illustrated in the case study from Australiapresented in this paper, where hydrology is governed by thephysical (natural and human-induced), socio-economic andinstitutional structures but these are in turn shaped by chang-ing values and norms of the population regarding water andthe environment.
Australia has had a long history of promoting agricul-tural development through harnessing its water resources,making it a defining feature of the country’s social iden-tity. Agricultural development has brought significant eco-nomic benefits to Australian society, contributing to na-tional economic growth, regional development and securefood supplies. However, it is becoming clear that these so-cietal and economic benefits have been achieved at signifi-cant environmental cost, through mounting pressure on, anddegradation of, the riparian environment, impairment of wa-ter quality and reduction of biodiversity. These problemshave been exacerbated by recent prolonged droughts and in-creased demand for water, food and other amenities char-acteristic to a growing population, posing major challengesfor water management.
A vivid example of these water management challengesis the crisis situation that has unfolded in recent timesin the Murray–Darling Basin (MDB) in eastern Australia(Roderick, 2011). The crisis over water use in the MDB re-volved around the competition for water resources betweenhumans and ecosystems. The balance of water utilizationwithin the MDB remained strongly in favour of water usefor irrigated agriculture for 75 years. The degradation of theenvironment resulting from the long period of intensive ir-rigated agriculture, and failure of several efforts to miti-gate their negative environmental impacts contributed to achange of community attitudes, which in the end forced thehand of the government to act in a decisive manner and im-pose a solution to achieve environmental outcomes (MDBA,2010). Consequently, the balance has now decisively shiftedin favour of the environment, evidenced not only by the rel-ative amounts of water allocated for human and environ-mental uses, but also in water infrastructure investments andchanges to human settlement patterns. However, the pro-posed cutbacks to water allocation for irrigation, as part ofthe government-imposed solution to alleviate environmentaldegradation, threaten the economic livelihood of rural Aus-tralia, causing a public and heated debate between farmersand regulators.
Gleick and Palaniappan (2010) describe the situation thatprevails in the MDB in terms of “peak ecological water”,which they define as the “point beyond which the total costsof ecological disruptions and damages exceed the total valueprovided by human use of that water”. In coming decades, ashuman populations and economies grow further, it is likelythat such problems could become increasingly prevalent inother parts of the world as well. Finding the delicate bal-ance between competing water needs of humans and ecosys-
tems in the management of water resources is becoming anurgent need worldwide (Scholz and Stiftel, 2005; Richter,2013; Sivapalan, 2011).
The rapid changes that the water cycle and the environ-ment are likely to experience as a result of natural climaticvariability and increasing anthropogenic changes require thatprediction and management frameworks must account fornot only the effects of climate variability and human inter-ferences on hydrologic variability, but also how hydrologicvariability and associated environmental changes and possi-ble degradation in turn influence the human responses andbehaviour changes. In the past these feedbacks were notincluded in the hydrological predictions that underpinnedtraditional integrated water resource management (IWRM).The impact of human-induced change using IWRM is usu-ally assessed with a scenario-based analysis which typi-cally does not involve feedbacks, co-evolution and result-ing non-stationarity in system behaviour. With the increas-ing severity of human impacts, it is becoming evident thatincorporating two-way feedbacks is essential for a better un-derstanding of coupled human–natural systems (Montanariet al., 2013). Recently, Sivapalan et al. (2012) have pro-posed a socio-hydrologic framework that permits the studyof coupled human–water system dynamics, including inher-ent bi-directional feedbacks between the two sub-systems.Indeed, socio-hydrology accounts for a balancing of eco-nomic and environmental well-being, with consideration forchanging social norms or community attitudes in respect ofthe environment.
This paper will present the history of how the water cri-sis unfolded in the MDB, and a socio-hydrologic interpreta-tion of the co-evolutionary dynamics of the coupled human–water system. In particular, it will chart the history of wa-ter utilization within the MDB, but with a particular focuson the Murrumbidgee, a major sub-catchment of the MDBand the most significantly impacted. The paper will highlightthe dynamics of human–water interactions that resulted ina “pendulum swing” or turn-around in the balance point inwater allocations between humans and ecosystems, and thenatural and societal factors that contributed to this pendulumswing. Understanding the causes of the pendulum swing inthe Murrumbidgee River basin within a quantitative and uni-versal socio-hydrologic framework has potential to provideuseful lessons for other river basins globally that are under-going similar development and tensions between competingstakeholders.
2 Location of study, data and methods
The Murray–Darling Basin (MDB) is Australia’s most iconicriver system and is defined by the catchment areas of theMurray and Darling rivers and their many tributaries (Fig. 1).The MDB extends over one million km2 of south-east Aus-tralia, representing approximately one-seventh of Australia’s
Hydrol. Earth Syst. Sci., 18, 1027–1041, 2014 www.hydrol-earth-syst-sci.net/18/1027/2014/

J. Kandasamy et al.: A case study from Murrumbidgee River basin, Australia 1029
Fig. 1.Murrumbidgee Catchment within the Murray–Darling Basin(adapted from: Frazier and Page, 2006). The Murrumbidgee Irri-gation Area incorporates the the Yanco Irrigation Area, Mirrool Ir-rigation Area, Wah Wah Irrigation District, Benerembah IrrigationDistrict, and Tabbita Irrigation District. In the figure dots or filledcircles refer to towns, filled triangles to dams and bars to weirs.
landmass. The MDB displays a varied landscape, fromsemi-arid ephemeral river systems in the north to highly reg-ulated river systems in the south. It supports a great num-ber of plants, animals and ecosystems that are both nation-ally and internationally significant, including 95 inundation-dependent fauna species, and more than half the nation’s na-tive fish species. The economic success of the MDB is a di-rect result of historical efforts by MDB States (New SouthWales (NSW), Queensland, Victoria and South Australia)and the Commonwealth Government to harness its water re-sources for agriculture. This is exemplified by the fact that itsupplies some 40 % of Australia’s food needs and supports aresident population of 2.1 million people. In 2006 more than920 000 people were employed across the MDB within theagricultural industry, contributing an average of AUD 15 bil-lion per annum to the Australian economy (MDBA, 2010).
The Murrumbidgee River basin, one of the largest sub-basins within MDB (Fig. 1), is located in the south-east ofthe MDB, and has a population of over 540 000. Althoughonly representing approximately 8 % of the MDB’s area,the Murrumbidgee Basin accounts for 22 % of the surfacewater diverted for irrigation and urban use. It contributes25 % of NSW’s fruit and vegetable production, 42 % ofNSW’s grapes and half of Australia’s rice production. Agri-cultural production within the Murrumbidgee is valued atover AUD 1.9 billion annually (Murrumbidgee CMA, 2012,2006) or 0.2 % of Australia’s GDP.
One of the goals of this paper is to trace the history ofthe “pendulum swing”, commencing with an exclusive focuson agricultural development and food production and theirconsequent socio-economic benefits, followed by the gradualrealization of the adverse environmental impacts, efforts tomitigate these with the use of remedial measures, and finallyconcerted efforts and externally imposed solutions to restoreenvironmental health and ecosystem services. This goal is
sought through a critical review of the substantial literaturethat exists in government and consultants’ reports, and addi-tional new quantitative trend analyses of several hydrologicaland social variables that contribute to or reflect the pendulumswing.
The trend analyses reported in this paper were carried outon primary data sourced from several Australian Governmentagencies: NSW State Water Corporation, Australian Bureauof Statistics, and the Australian Department of Sustainabil-ity, Environment, Water, Population and Communities. Thetrends in the data of water use, agricultural production, andenvironmental flows are correlated with the history of de-velopment of agriculture, government policy and investment,social issues, and environment conditions within the Mur-rumbidgee Catchment. The results of the trend analyses areused to support or confirm the narratives presented in previ-ously published (including government) reports. Guided bythese trends and narratives, a secondary goal of the exer-cise is the development of a perceptual model of the coupledsocio-hydrologic system operating within the MurrumbidgeeBasin, framing it in terms of the two-way coupling of socialand hydrologic systems (e.g. Cai et al., 2002). Furthermore, aperceptual model that has wider applicability across climaticand socio-economic gradients is also sought through general-izing the drivers, and interactions and feedbacks, in a mannerthat has wider applicability. This also exploits the similaritiesbased on anecdotal and published evidence between basinsin different parts of the world (e.g. Murrumbidgee vs. Sacra-mento River basin in California, USA, and Tarim Basin inwestern China), while acknowledging the differences that doexist (Srinivasan et al., 2012; Liu et al., 2013).
3 How the pendulum swung in the Murrumbidgee
3.1 Murrumbidgee Basin as human–water system
The Murrumbidgee River basin is a highly human impactedand managed system. Over the past 100 years, the basin hasbeen almost entirely transformed through the introduction ofhuman-built infrastructure (e.g. dams and weirs) to supportexpansion of irrigated agriculture. The irrigation infrastruc-ture as well as irrigation schemes add to or overlie land-scape features associated with natural river basins, such ashillslopes, wetlands, riparian areas and river networks. Thehuman-induced structures have altered the flow dynamicsthat normally result from external climatic drivers (i.e. pre-cipitation). This has caused the diversion of much water thatwould have flowed down the river network to the ocean andperiodically inundated precious wetlands and riparian areas,instead of targeted irrigation areas. In these areas, water isutilized by agricultural crops for increasing crop yield, even-tually returning to the atmosphere via transpiration.
The above description refers only to the hydrologic dy-namics in this human-managed landscape. However, in the
www.hydrol-earth-syst-sci.net/18/1027/2014/ Hydrol. Earth Syst. Sci., 18, 1027–1041, 2014

1030 J. Kandasamy et al.: A case study from Murrumbidgee River basin, Australia
Fig. 2. Conceptual model for catchment-scale competition for wa-ter utilization between agriculture and environment using the socio-hydrology approach.
intermediate term, these dynamics are accompanied by otherslower dynamics relating to human decisions concerning ar-eas to be put under irrigation, types of crops to be grown,and when and how much to irrigate. How much land is putto agriculture and the choice of crops are normally decentral-ized decisions that depend on externalities such as commod-ity prices, availability (i.e. in the dams) and price of waterfor irrigation, as well as the climate itself (which determinesthe demand for irrigation). The volume of water stored indams and their price depend upon the climate over the pre-vious few years, but increasingly also upon how much wa-ter may be allocated to the environment in the form of en-vironmental flows. The allocation of water between agricul-ture and environment is governed by economic benefits ofagriculture and the value placed by society on the environ-ment, including water quality and biodiversity. This compe-tition for water between irrigated agriculture and the envi-ronment is mediated in the political arena, on the basis ofarguments by the rural lobby (acting on behalf of the irriga-tors) and green lobby (acting on behalf of the environment).The relative strengths of the green and rural lobbies influ-ence government decisions to purchase water rights from theirrigators, and to support the environment through construc-tion of specialized infrastructure geared towards protectingor enhancing the environment.
Figure 2 is a schematic describing the organization ofthe coupled human–water system specific to Murrumbidgee,along the lines presented above. Clearly, as seen in Fig. 2, hu-man management of the water system over the last 100 years
has resulted in a system of enormous (apparent) complex-ity, spanning physical infrastructure and the economic, pol-icy and legal frameworks governing water availability, useand pricing. In fact, the system is even more complex than isshown in Fig. 2 due to the fact that the human–water inter-actions and feedbacks occur in a distributed manner withinthe basin at a range of space and timescales. The complexityof the linkages shown in Fig. 2, which is the end result ofa century of human management of the system, is a far cryfrom what might have existed when agriculture first devel-oped within the Murrumbidgee 100 years ago. This systemhad evolved from a simpler agriculture system practiced byAboriginal peoples and then the early settlers (see Sect. 3.1).During these times human impact on the hydrological andeco-environmental system was limited to local water extrac-tion. In Fig. 2 this is depicted by a balance of water usage be-tween agriculture and the environment without nearly any ofthe other influences being relevant. An understanding of howthis complexity grew over time to become what it is todaycan inform the development of models of coupled human–water systems, and will give us the insights and a predictivecapability that may help to avoid similar management crisesfrom developing in river basins in other parts of the world.
3.2 Pendulum swing in water utilization
Published studies have documented how the balance in wa-ter utilization between agriculture and the environment, andassociated infrastructure development, have evolved over thelast 100 years. A synthesis of previously published reportsand the results of new quantitative analyses carried out forthis study resulted in the evolutionary history that is pre-sented schematically in Fig. 3. The data underpinning thetrends depicted schematically in Fig. 3 are presented inFig. 4. Major policies and initiatives that facilitated develop-ments in this period are summarized in Table 1. The historyis framed in terms of the relative emphasis placed on agri-cultural development and environmental health, divided intofour distinct eras:
– Era 1: circa 1900–1980 – development of irrigationand associated infrastructure;
– Era 2: circa 1960–1990 – gradual appearance of envi-ronmental degradation;
– Era 3: circa 1990–2007 – awareness of broader envi-ronmental impacts and a focus on consensus strategiesand policies to achieve sustainable management;
– Era 4: circa 2007 to present – failure of the consensusmodel and emergence of a directed government inter-ventionist strategy to achieve environmentally sustain-able outcomes.
We next present a summary of the results of the synthesis pre-sented in Figs. 3 and 4, followed subsequently by a detailed
Hydrol. Earth Syst. Sci., 18, 1027–1041, 2014 www.hydrol-earth-syst-sci.net/18/1027/2014/

J. Kandasamy et al.: A case study from Murrumbidgee River basin, Australia 1031
Fig. 3. The change in infrastructure, the environment, populationand agriculture production in the Murrumbidgee through four eras:Era 1 (1900–1960) – the development of irrigation and associatedinfrastructure; Era 2 (1960–1990) – agradual appreciation of real-ization of environmental degradation; Era 3 (1990–2007) – aware-ness of broader environmental impacts and a focus on consensusstrategies and policies to achieve integrated and sustainable man-agement; Era 4 (2007–present) – accepting the failure of the consen-sus model, with the emergence of a directed Commonwealth Gov-ernment strategy to achieve environmental sustainable outcomes.Emphasis level used in relation to the vertical axis refers to the de-gree of increase in the parameters described in the figure (agricul-ture, population, infrastructure, and environment).
description of how and why these happened, including sub-stantiation by the results of quantitative analyses.
Era 1 saw rapid growth of agriculture infrastructure. Thegrowth in human population and agricultural production fol-lowed into Era 2. By the end of Era 2 there was increasingawareness of environmental degradation, but these were ad-dressed through ad hoc solutions. Era 3 saw growing appre-ciation of broader environmental impacts, and led to the ex-ploration of a range of strategies aimed at their mitigation. Asenvironmental degradation continued unabated, Era 4 saw amajor switch in emphasis towards environmental health, withboth agricultural production and population growth show-ing sharp reverses, and increased investment in infrastructureaimed at the enhancement of the environment. The switchfrom the earlier emphasis on agricultural development to anew emphasis on environmental health, shown in Fig. 3, isan example of a pendulum swing from era to era. The term“pendulum swing” in this case refers to a shift in the balancein water utilization between agricultural development and en-vironmental health (Fig. 2). An understanding of how thispendulum swing occurred and the factors that contributed toit can assist towards the development of a new coupled socio-
hydrology model that encapsulates a deep understanding ofthese factors and might guide system managers to developpolicies resulting in a more sustainable development trajec-tory (see Sect. 4). In the next few sub-sections, we present amore detailed description of the changes that happened in theMurrumbidgee River basin over the past 100 years.
3.2.1 Era 1 (1900–1980): expansion of agriculture andassociated irrigation infrastructure
It is well documented that Aboriginals lived sustainablyin the Australian landscape for tens of thousands of years(Humphries, 2007). The situation changed with the settlingof Europeans, who displaced the Aboriginals, cleared forestsand native grasses, introduced new grasses, cereal crops, cat-tle and sheep. They built farm dams and introduced irrigationschemes for intensive cultivation and more productive useof lands on the floodplains. These efforts were supported bygovernment investment in irrigation infrastructure and gov-ernment coordination in the sharing of waters.
Government investment in, and coordination of, irrigatedagriculture was motivated by several factors. Firstly, thedevelopment of agriculture was representative of the pre-eminence of agriculture in the Australian economy in theearly to mid-20th century. The Murrumbidgee, along withthe MDB, became Australia’s food bowl, growing and pro-cessing a significant fraction of all fruits and vegetables. Forexample, during the first half of the 20th century, agricul-ture accounted for up to 35 % of the share of the Australianeconomy and 70–80 % of Australia’s exports (ProductivityCommission, 2005). Secondly, there was the official gov-ernment policy of populating the interior. Indeed, increasingthe population in western NSW was one of the objectives ofthe NSW Government expenditure on irrigation (Wilkinson,1997) (Table 1). In keeping with this policy, following WorldWar 1, returning soldiers were settled in the area, with thenumbers being boosted by new immigrants from Britain.However, peopling the interior, as government policy, wasabandoned during the 1950s and 1960s (Wilkinson, 1997).Thirdly, irrigation allowed the expansion of agriculture awayfrom riparian lands where people initially settled to moremarginal lands lying further away from the river. Australiasuffered from frequent severe droughts and irrigation gavemore certainty of water supply to these lands than was pos-sible with rain-fed agriculture. The certainty of water sup-ply through irrigation resulted in more intensive agricultureproduction and cultivation of more profitable crops.
Much of the agricultural expansion commenced in about1902 and continued until about 1980 with significant gov-ernment funding and coordination (Wilkinson, 1997). A se-ries of dams and weirs were built from about 1910 to about1970. Irrigation activity invariably followed, with a signif-icant expansion of the area under irrigation which contin-ued up until about 1980. Expansion of agriculture and irri-gation then led to a substantial growth of population within
www.hydrol-earth-syst-sci.net/18/1027/2014/ Hydrol. Earth Syst. Sci., 18, 1027–1041, 2014

1032 J. Kandasamy et al.: A case study from Murrumbidgee River basin, Australia
Table 1.Summary timeline of major policies and initiatives in the Murray–Darling Basin, State Library of South Australia (2014).
1830–1860 Aboriginal population along Murray–Darling devastated by European-introduced diseases including measles, smallpox and influenza.
1895–1902 Prolonged drought leads to Corowa Water Conference in 1902.
1901 The Commonwealth of Australia inaugurated on 1 January.
1902 Corowa Water Conference.Interstate Royal Commission on waters of River Murray for purpose of irrigation, navigation and water supply.
1915 River Murray Waters Agreement on management and sharing of waters of the River Murray signed by the governments of Australia, NSW, Victoriaand SA, providing for the construction of a number of storages, weirs and locks.Returned Soldiers’ Settlement Act.
1917 The River Murray Commission established to put the River Murray Waters Agreement into effect, particularly to ensure that each state receives itsagreed share of the Murray’s water.
1922 British Empire Settlement Act passed by Commonwealth Government to encourage British immigrants and settle rural lands in Australia.
1934 River Murray Waters Agreement amended; five barrages to be built near Murray mouth to prevent seawater entering river system during periods oflow river flow.
1946–mid-1950s Soldier settlement schemes following World War II
1951 Assisted migration arrangements with Italy, then Germany, Greece and Austria
1982 The River Murray Waters Agreement amended so the River Murray Commission can take environmental problems, including water quality issues,into account.
1985 Murray–Darling Basin Ministerial Council established for providing the policy and direction to implement the Murray–Darling Basin Initiative,when ministers from SA, NSW, Victoria and Commonwealth meet in Adelaide to discuss resource and environmental problems of Murray–DarlingBasin.
1987 Murray–Darling Basin Agreement for management of water, land and natural resources across the basin.
1992 New Murray–Darling Basin Agreement signed. Murray–Darling Basin Commission established to replace the former River Murray Commission.
1994 CoAG (Council of Australian Governments) Water Reform Framework established.
1995 NSW Water Reform Package launched.Murray–Darling Basin Ministerial Council agrees to interim cap on water diversions.Federal and State governments sign Competition Policy Agreement which includes policy on water trading.
1996 Commonwealth AUD 1.5 billion Natural Heritage Trust established in response to water quality crisis. State and Territory governments to matchfederal funding.
1997 Permanent cap on the volume of water which can be diverted from Murray–Darling Basin rivers by SA, NSW and Victoria.
2000 Commonwealth Government AUD 700 million salinity package over 7 years introduced. Funding to state governments dependent on meeting federaltargets for land clearing and water quality.
2004 Federal and South Australian governments announce a package of measures aimed at reducing salinity, improving water quality and protectingbiodiversity in the Murray–Darling region under the National Action Plan for Salinity and Water Quality and National Heritage Trust
2007 AUD 10 billion basin plan - Prime Minister announces plan for Murray–Darling River system seeking support from Victoria, New South Wales,Queensland, South Australian and the ACT governments. Plan requires constitutional changes.Passing of the Water Act (2007) in Federal Parliament.Murray–Darling Basin Authority established - The Authority was established under the Water Act (2007).
2010 The Guide to the Draft Basin Plan is released with proposed water allocation cuts of 4000 billion litres (GL). Rural communities fear their livelihoodswill be threatened by the proposal, and demonstrate against the plan.
2012 Murray–Darling Basin Plan.
the Murrumbidgee, which hit a peak in 1990 and in the caseof rice production was severely influenced by the droughtbetween 2000 and 2010. Agricultural productivity also ex-panded dramatically, hitting a peak around 2000. The expan-sion of irrigated agriculture, associated infrastructure and thesize of the human population, as well as the resulting agri-cultural productivity and measures evidencing the environ-mental degradation over the last 100 years (1910–2010) arepresented in summary form (Fig. 4a–h).
An indication of the nature of growth of agricultural ac-tivity can be obtained from the details presented in Figs. 1and 4a–h. As early as 1843 much of the land along the
Murrumbidgee River had been settled by European colonistswho used the water for grazing stock. Within the Mur-rumbidgee Basin, irrigation activity commenced in 1902 inthe area around Hay (Turral et al., 2009). The overall in-vestment of in-stream infrastructure associated with the stor-age and diversion of water along the Murrumbidgee Riveris in the order of AUD 2800 M (State Water, 2013). Con-struction of the Burrunjuck Dam commenced in 1907, fol-lowed by the construction of diversion weirs and irrigationdelivery canals. The Murrumbidgee Irrigation Area (MIA)commenced in 1912 and quickly expanded (incorporating theYanco Irrigation Area, 1912; Mirrool Irrigation Area, 1924;
Hydrol. Earth Syst. Sci., 18, 1027–1041, 2014 www.hydrol-earth-syst-sci.net/18/1027/2014/

J. Kandasamy et al.: A case study from Murrumbidgee River basin, Australia 1033
Fig. 4. (a)Development of storage in the Murrumbidgee Catchment (data sourced from NSW State Water Corporation).(b) Developmentof irrigation areas in the Murrumbidgee Catchment. See Fig. 1 for locations of irrigation area. Mirrool and Yanco are in the MurrumbidgeeIrrigation Area. Bererembah, Tabbita, Wah Wah and Gumly are districts that adjoin Murrumbidgee Irrigation Area but not shown in Fig. 1,Lowbidgee irrigation area not included. (data sourced from ABS, 2013b).(c) Rice production in the Murrumbidgee, (data sourced fromABS, 2013b).(d) Population growth in the Murrumbidgee. Between 1900 and 1980 the population was estimated from data available inABS year book. From 1980 onward the estimate is for the population of Murrumbidgee less the population of Canberra and Wagga Wagga,(data sourced from ABS 2013a, b).(e) Irrigation flow utilization in the Murrumbidgee Catchment, (data sourced from DWR, 1989; ABS2013a; and State Water Corporation).(f) Ratio of annual flow in the Murrumbidgee at Balranald to the annual flow at Wagga Wagga, seeFig. 1 for locations of Balranald and Wagga, (data sourced from NSW State Water Corporation).(g) Environmental water holdings (waterlicenses) purchased by the Commonwealth Government and available to water sites of significant environmental value (wetlands, etc) in theMurrumbidgee Catchment, (data sourced from DSEWPC, 2013).(h) The contribution of agriculture to the Australian economy expressed asa percent of GDP (ABS, 2005).
Wah Wah Irrigation District, 1930; Benerembah IrrigationDistrict, 1933; and Tabbita Irrigation District, 1933). Con-struction of more dams to increase storage capacity occurredin tandem (e.g. enlargement of Burrinjuck Dam during 1939–1956; Blowering Dam, 1968; Tantangara, 1960; Talbingo,1971). The Lowbidgee Flood Control and Irrigation District(LFCID) was established in 1945. It is located at the down-stream end of the Murrumbidgee River basin, but upstreamof Balranald. The Lowbidgee Floodplain is the largest flood-plain wetland in the Murrumbidgee Valley and is a nationallyimportant wetland. It covers a large area (217 000 ha) and isregionally significant for waterbirds, both as a drought refugeand as breeding habitat. The extent of the Lowbidgee wet-lands has significantly decreased due to the construction of
levee banks to establish the LFCID. The Maude and Redbankweirs facilitated the flooding of the Lowbidgee irrigation areaduring the winter/spring. In addition, the Coleambally Irri-gation Area (CIA) area was established in 1960 (Wilkinson,1997; Lewis, 2012).
The investment in infrastructure facilitated the growth ofthe whole community and the agricultural industry. Agri-cultural production within the Murrumbidgee included rice,wheat, soybeans, canola, citrus, vegetables and vines, as wellas sheep and cattle. The first commercial crop of rice was har-vested in 1924 and subsequently rice production grew rapidly(Lewis, 2012). In the early years rice was a very profitablecrop compared to other grains. For this reason, the rice in-dustry grew significantly over the next three decades, leading
www.hydrol-earth-syst-sci.net/18/1027/2014/ Hydrol. Earth Syst. Sci., 18, 1027–1041, 2014

1034 J. Kandasamy et al.: A case study from Murrumbidgee River basin, Australia
Fig. 5.Schematic of the evolution of the spatial patterns of irrigation(shaded area) in the Murrumbidgee. In the early 20th century irri-gation moved upstream. Recently, the government has started buy-ing water rights from farmers to protect the environment. Bottompanel is a projection based on cutting back irrigation upstream, re-produced with permission from Sivapalan et al. (2012).
to the construction of rice mills in the area around Lee-ton and Yanco, which generated greater employment. Sim-ilar growth also occurred in other sectors, such as the wineindustry, with extensive support and a supply chain form-ing in the local community. Figure 4c shows the growth inrice production, which is used here as a surrogate for overallagriculture production.
However, the agricultural expansion described above didnot happen uniformly across the Murrumbidgee River basin;in fact, there was a spatial aspect to it. Agriculture startedin riparian areas near the outlet of the basin, and then withthe onset of irrigation expanded to areas away from the river(non-riparian lands) and, aided by the construction of damsfurther upstream, migrated to upstream regions. This expan-sion also benefited from the government policy of populatingthe interior. Sivapalan et al. (2012) present a cartoon figurethat illustrates the upward expansion of agricultural develop-ment (in terms of growth of irrigation infrastructure and areaput under irrigation) within the Murrumbidgee, reproducedin Fig. 5.
3.2.2 Era 2 (1960–1990) – Onset of environmentaldegradation and ad hoc solutions
The balance in water utilization in Era 1 favoured agricul-tural development, with heavy government policy supportand investment. Yet, there was no consideration, nor any ap-parent awareness of environmental requirements. This sit-uation changed with the gradual manifestation of severalenvironmental problems.
The first was saltwater intrusion. As water consumptionin the MDB increased and flow in the rivers decreased, theintrusion of seawater was felt up to 250 km upstream fromthe mouth of the River Murray. This impacted landownersand farmers along the lower reaches of the river who stronglyadvocated for the construction of barrages to keep the waterfresh in the lower reaches of the River Murray. Work on thebarrages was completed in 1940 (Table 1).
The second problem was salinization of lands due to irri-gation. As a consequence of agricultural development, deep-rooted native vegetation was replaced by shallow rooted an-nual crops and pastures, which changed the water balanceand raised groundwater levels. For example, prior to the in-troduction of rice, the groundwater table within the Mur-rumbidgee Irrigation Area (MIA) was 20 m below land sur-face. By 2001 the water table for approximately 85 percentof the MIA had risen to within 2 m of the surface. Risingwater tables dissolved salts that were already present in thesoil profile, raising them to the surface (GWG, 1996). Thiswas compounded by the application of irrigation water, re-sulting in both salinization and waterlogging. The damagedue to salinity was widespread, with adverse impacts on theenvironment of rivers and wetlands, built infrastructure, andagricultural productivity. The overall estimated annual dam-age due to salinity in the MDB was substantial: AUD 130million in agricultural costs, AUD 100 million in infrastruc-ture costs, and AUD 40 in environmental costs (ABS, 2013c).
Mitigation measures to tackle salinity were implementedin the Murray–Darling Basin. These included controlling riceproduction, introducing efficient irrigation practices, imple-menting efficient delivery and usage of town water, and ex-panding tree planting. Since 1988, the NSW, Victoria andSouth Australia governments, together with the Common-wealth Government, have funded the construction of salt in-terception schemes (SIS) to reduce salinity in the MurrayRiver. The SISs are large-scale groundwater pumping anddrainage projects that intercept saline groundwater flows anddispose them, usually by evaporation. In the Murray–DarlingBasin, there are currently 18 operational SIS bore-fields andseveral under construction (MDBC, 1999).
Salinity was not the only issue to impact the region. Thesummer of 1991–1992 saw the occurrence (over 1000 km inthe Murray–Darling) of one of the worst blooms of blue-green algae recorded anywhere in the world (MDBMC,1994). Sewage treatment plants were the cause of excessnutrients in the river and significant investment was madeby the governments to upgrade wastewater treatment plantsto reduce the nutrient loads. Irrigation areas were identifiedas having another large impact on nutrient loads and furthermeasures were adopted to decrease nutrient runoff.
Figure 3 does recognize the initiation of infrastructuretargeted towards alleviating salinity and algal blooms (e.g.barrages, SIS schemes and upgrading of sewage treatmentplants). There were also attempts to institute policy changesthat affect the utilization and sharing of waters, through
Hydrol. Earth Syst. Sci., 18, 1027–1041, 2014 www.hydrol-earth-syst-sci.net/18/1027/2014/

J. Kandasamy et al.: A case study from Murrumbidgee River basin, Australia 1035
extending the role of the Murray–Darling Basin Commis-sion (MDBC; MDBC, 2011) (Table 1). These mitigationmeasures, especially those aimed at combating salinity,failed to reverse the degradation, as they did not address thefundamental causes of the rising water tables caused by ir-rigation practices. Despite the emergence of environmentalproblems and some efforts at remediating them, there wascontinued rapid growth of agriculture production and popu-lation (see Fig. 4c, d), and the balance of water utilizationremained with agriculture (see Fig. 3). A holistic catchment-wide approach considering human influences and environ-mental requirements was not yet given proper recognitionuntil the beginning of Era 3.
3.2.3 Era 3 (1990–2007) – establishment of widespreadenvironmental degradation
As seen in Fig. 4a and b, investment in irrigation infrastruc-ture was largely complete by 1970, and growth of irriga-tion areas was largely complete by 1980. However, irriga-tion water utilization continued to increase until 2000 (seeFig. 5a), although this growth was moderated somewhat bythe 2000–2010 drought. The growth of water utilization wasalso mirrored in the growth of agricultural production (e.g.as reflected by growth of rice production, Fig. 4c). The in-crease in agricultural output was achieved by strong produc-tivity growth (per hectare) and a decline in the agriculturalwork force. This was in part a result of a heavy relianceon mechanization, an increase in corporate farming practicesand a movement of labour to other sectors of the economy.The population in the Murrumbidgee grew rapidly until 1990but began to decline post-1990 (see Fig. 4c). The reversal ispartly attributed to the changing profile of agriculture withinthe broader Australian economy. The agricultural share ofthe Australian economy began to decline from the 1950s toits current value of 4 % of Australia’s Gross Domestic Prod-uct (GDP), and Australia’s overall reliance on agriculturalexports declined to about 20 % (Fig. 4h) (Productivity Com-mission, 2005). Economically, this contributed to a reductionof employment in the entire agricultural sector from 1980(ABS, 2013d)
The rapid growth in water utilization for agriculture alsomeant a reduction of residual flow (i.e. environmental flows)in the river. This is illustrated in Fig. 4f, which shows the re-duction in Murrumbidgee river flows that reaches the outletnear Balranald (see Fig. 1 for locations) over the period 1900to 2011, expressed as a fraction of the river flow at WaggaWagga. The flow reduction can be directly attributed to wa-ter utilization for irrigation (see Fig. 4e) sourced from theMurrumbidgee River and utilized mainly in the MIA, CIAand LFCID irrigation areas. By 2011 the fraction of flowreaching Balranald dropped to a low 10 % (on average). Thereduction of flows significantly reduced the frequency andduration of inundation of wetlands in the riparian areas nearthe river, and in this way began to impact ecosystem health
Table 2. Annual trends in waterbird abundance in three wetlandsystems, including the Lowbidgee (1983 to 2001) (Kingsford andThomas, 2004).
Wetland Lowbidgee Fivebough Paroo Overflow
Mean number of waterbird species between:
1983–1986 34 13 201998–2001 27 (−21 %)* 12 (−8 %)* 23 (15 %)*
Mean population of waterbird species between:
1983–1986 139 939 6844 14 2241998–2001 14 170 (−90 %)* 911 (−87 %)* 18 616 (31 %)*
* Change in bird population is also provided in parentheses.
of these riparian environments, including the fauna and florathat depended on these wetlands.
For example, Fivebough Swamp and Tuckerbil Swamp areRamsar-designated wetlands. Both are located near Leeton,within the MIA (Fig. 1). Other significant wetlands in theMurrumbidgee are the Lowbidgee Floodplain, located withinthe LFCID, and the mid-Murrumbidgee Wetlands, which areriparian wetlands between Wagga Wagga and Carrathool,each of which cover significant areas. Changes to the wetlandareas within the Lowbidgee were assessed by Kingsford andThomas (2004), who estimated that between 1902 and 1998some 232 276 ha of wetlands (out of the 303 781 ha that ex-isted in 1902) had been lost or degraded. This has been due toflow regime changes in the regulated Murrumbidgee River,the construction of levee banks to control floodwaters, andthe conversion of wetland floodplains into irrigated cropland.
Trend analyses of the number of species of different wa-terbird groups and their overall abundance were carried outusing annual aerial surveys between 1983 and 2000 acrossthe Lowbidgee floodplain, Fivebough Swamp, and the Paroooverflow lakes (Table 2, taken from Kingsford and Porter,1994). Paroo lakes are located in the north-west of NSW inan area relatively free from agricultural development. Thisanalysis showed a significant reduction in waterbirds in partsof the Murrumbidgee that experienced significant loss ordegradation of wetlands, relative to those that did not (e.g.Paroo lakes). Similar to waterbirds, the native fish commu-nity within the Murrumbidgee Basin has also been severelydepleted. A survey by Gillian (2005) showed that 8 of the21 native fish species were either locally extinct or survive atvery low abundances. In addition to the loss of native species,a large number of invasive fish species have become domi-nant, both in terms of number (71 %) and biomass (90 %).
With the realization of the severity of the environmentaldegradation, which was proceeding unabated, several mea-sures were instituted to control the environmental degrada-tion. These covered the entire spectrum of new infrastruc-ture, policy changes and also economic measures. For ex-ample, no new licenses for water extraction were issued af-ter 1986, even though the proportion of flow allocated to
www.hydrol-earth-syst-sci.net/18/1027/2014/ Hydrol. Earth Syst. Sci., 18, 1027–1041, 2014

1036 J. Kandasamy et al.: A case study from Murrumbidgee River basin, Australia
irrigation continued to expand on the basis of existing li-censes (Turral et al., 2009). In 1993, the MDBC introduceda temporary cap on further expansion of water extraction,which was made permanent in 1997 (MDBMC, 2000) (Ta-ble 1). Another initiative of the NSW state government wasto construct fishways which would allow fish to pass barrierswithin the rivers, which was now required of all significantupgrade or renewal works undertaken in the rivers used for ir-rigation. As a result, since 1985, 27 fishways have been built.As the major irrigation structures in the Murrumbidgee Riverare upgraded, the estimated investment in the construction offish passage is estimated to be AUD 50 to AUD 60 millionover the next 20 to 30 years (State Water, 2013).
The most important changes happened in the policy andeconomic domains. The Council of Australian Governments(COAG, 1994) in 1994 developed a Water Reform Packagewhich, for the first time, recognised that the environment wasa legitimate user of water in its own right (Table 1) (Arthing-ton and Pusey, 2003; Schofield et al., 2003; COAG, 1994).The NSW Government in 1997 followed with reforms cul-minating in the Water Management Act (WMA) of 2000, akey legislation underpinning the protection of environmen-tal flow. Under the WMA Act, Water Sharing Plans (WSPs)were developed that sought a balance between requirementsof industry, agriculture, domestic use and the environment.Other key reforms introduced as part of these legislations in-clude the separation of water titles from land, adoption of wa-ter trading arrangements and establishment of a water mar-ket, full cost recovery and removal of cross subsidies in thesupply of water, and importantly, institutional arrangementsto support these reforms (Schofield et al., 2003).
3.2.4 Era 4 (2007–present) – remediation andemergence of the environmental customer
In spite of the increasing recognition of the water needs ofthe environment and several mitigation measures institutedduring Era 3, these did little to reverse environmental degra-dation. Community concerns consequently grew at the fail-ure to develop viable solutions, notwithstanding the mea-sures developed in Era 3. These concerns were highlightedstrongly by the “green” lobby, which has grown in influencesince the 1990s. This, combined with a strong fiscal eco-nomic position experienced in Australia (owing to the mining“boom”), and the diminishing role of agriculture as a contrib-utor in the Australian economy (Fig. 4h), changed commu-nity attitudes towards the environment and strengthened theCommonwealth Government’s hand.
In 2007 the Commonwealth Government announced aAUD 10 billion national water reform package (Table 1)(later increased to AUD 12.9 billion, Turral et al., 2009). Itcalled for the states covering the MDB to transfer their con-stitutional powers over water management to the Common-wealth so that comprehensive MDB-wide reforms could beintroduced. The main thrust of the AUD A12.9 billion plan
was to reduce the allocated water volume to agriculture inreturn for system and on-farm investments in water conser-vation. This has also added impetus to the need to accountfor surface water and groundwater flows, and to monitor andcontrol the capture of runoff on farms. In all states, the abil-ity to capture runoff in farm dams was restricted through newlicensing requirements. The 2007 Water Act created an inde-pendent Murray–Darling Basin Authority (MDBA). It beganto set sustainable diversion limits that can be taken from sur-face water and groundwater systems within the MDB. It alsoincluded an environmental watering plan to optimize envi-ronmental outcomes. The Act further established an Envi-ronmental Water Holder to protect and restore environmentalassets within the MDB (Fig. 4g).
As part of the Commonwealth Government’s AUD 12.9billion program, significant projects within the Mur-rumbidgee River are now being implemented. These areaimed at upgrading infrastructure and operational processes.They include a suite of infrastructure works designed to min-imize in-stream river losses, either through improved meter-ing of customers or reducing water flowing to places where itis not required. As part of these projects more detailed infor-mation on the cost of delivering water (in terms of evapora-tion and infiltration losses) to different parts of the catchmentare being assembled. This will allow further policy develop-ment, such as purchasing water licenses for the environmentfrom areas that are more costly to deliver water to. Differ-ential water pricing that will allow further efficiencies andtransparency in the use of water is envisaged. Other projectsinclude modification of bridges to allow the passage of waterto flood wetlands, and weirs to divert water to wetlands.
Several other mitigation measures that the government hasintroduced are intended to reverse environmental degrada-tion by reducing water allocation to agriculture in favour offlows to the environment. These are in four main areas: newpolicies (i.e. legislation to impose a solution, creation of theMDBA and the office of the Environmental Water Holder),new economic measures (e.g. massive funding, buying backof water licences, water trading), new technologies (e.g. in-centives to change the type of crops grown, efficient farmirrigation), and new infrastructure.
The consequence of all of these actions was that irriga-tion infrastructure (in terms of area put under irrigation andassociated infrastructure) that was moving upstream for thefirst 75 years of agricultural development is now expected tomove back downstream (Sivapalan et al., 2012). An exampleof this is that over the 2001–2009 drought period rice grow-ers were able to make more money with less risk by sellingtheir water in the water trading market rather than by growingrice. The sale of water by rice growers helped downstreamhorticulturalists to keep their plantings alive, and new hor-ticulturalists moved in to grow highly profitable produce inareas downstream of the Murrumbidgee, e.g. Sunraysia andGoulburn regions of the state of Victoria and Riverland in thestate of South Australia (NWI, 2011, 2010).
Hydrol. Earth Syst. Sci., 18, 1027–1041, 2014 www.hydrol-earth-syst-sci.net/18/1027/2014/

J. Kandasamy et al.: A case study from Murrumbidgee River basin, Australia 1037
The mix of solutions imposed by the government duringEra 4 was in part arbitrated by interactions and feedbackbetween the affected local community and local stakehold-ers, and the increasing political influence of environmentallyaligned political parties and lobby groups. In effect, the gov-ernment was responding to changing community attitudes,even though these normally tend to lag well behind the sys-tem changes. In any case, the net result is that the pendu-lum has now materially “swung” back to the environment.As a result of the massive funding directed at environmen-tal remediation and enhancement, the population within theMurrumbidgee is expected to decline further, and agricul-tural activity is expected to follow.
4 Discussion: lessons learned – need for newsocio-hydrologic prediction frameworks
As we survey what transpired over the past century, it is no-table that in the short term (i.e. during an individual Era),these involved the implementation of IWRM, ostensibly us-ing the best tools available, including hydrologic predic-tion tools. Here, scenario analysis is used to assess the im-pact of prescribed changes, including management plans,and typically feedbacks, co-evolution and non-stationarityin system behaviour are not incorporated (Montanari et al.,2013). However, in the long term, the environmental prob-lems only got worse and reached a crisis situation by the1990s. This was predominantly due to a poor understand-ing or lack of awareness of environmental impacts. Economi-cally, we might assert that the environment was undervalued.By the time the environment began to be valued (owing toscarcity of water for the environment, and resultant threat ofloss in flora and fauna), there were no analysis or predictionframeworks that could account for environmental feedbacksthat impacted on human behaviour in respect of water.
Above all, the Murrumbidgee case study illustrates whatcould happen when the underlying human preferences, i.e.what humans value, change over time and prediction frame-works fail to stay abreast of these altered assumptions. Thevalues and norms relating to water and the environmentchanged over the past century due to several factors: the real-ization of the damage to the environment is the first. Anotheris the growth of the economy overall, and the diminution ofagriculture and food exports as a fraction of the national andregional economy (Fig. 4h). Thirdly, tied to these, was thegeneral growth of environmental awareness and growth ofthe “green” lobby. All of these together created the condi-tions for decisions to reallocate water to the environment. Inother words, changes in norms and values were themselves aresult of human–water system feedbacks.
The net result of all this is that the human–water sys-tem in the Murrumbidgee has witnessed interesting long-term stakeholder interaction dynamics that could not havebeen perceived a century, or even 50 years ago. Temporally,
this manifested as the growth of irrigation and its eventualturnaround (as shown in Figs. 3 and 4a–h): irrigation herestands variously for area under irrigation, amount of waterutilized in irrigation, agricultural productivity, size of hu-man population, and size of irrigation infrastructure. Thereis also a spatial aspect. Figure 5, reproduced from Sivapalanet al. (2012), indicates schematically that the growth of irri-gation involved the upstream migration of indicators of irri-gation. The eventual turn-around in irrigation then involved adownstream migration of the same. These complex dynam-ics, which involve pendulum swings, were the result of thetwo-way feedbacks between the hydrologic and human sys-tems; in effect they can be considered as “emergent” dy-namics. These emergent dynamics, in this case the pendu-lum swing, could not have been predicted using traditionalhydrologic prediction frameworks.
The pendulum swing has proved costly to the environ-ment, local communities and government. Yet, there is noguarantee that the imposed solutions will fix the problem in-definitely. Imposed solutions by governments on complexinter-dependent systems such as this are seldom success-ful and the outcomes which manifest many years later sel-dom align with the original objectives or intentions. Indeed,it is not absolutely clear what the situation will be in an-other 50 years for the people, and for the environment. Italso raises several related questions: Could the situation havebeen avoided in the first place? What would happen if thegovernment had not intervened? Are there other plausible so-lutions? Now that the government has intervened, what doesthe future hold for the people and the environment?
The Murrumbidgee experience teaches us that simplistichydrologic predictive frameworks that link demand to popu-lation growth or economic growth will not be adequate in thelong-term. Likewise, traditional economic frameworks thatallocate water between multiple human users are also not ad-equate. These frameworks are elements of the integrated wa-ter resource management (IWRM) approach, which has asits focus controlling or managing the water system to reachdesired outcomes for society and the environment. The Mur-rumbidgee experience clearly demonstrates the weakness ofthe IWRM approach for sustainable water resource manage-ment over decadal to century timescales, due to the fact that itcannot account for the bi-directional feedbacks between hy-drological and human systems that have been responsible formuch of the complex, emergent dynamics witnessed in theMurrumbidgee.
Instead of the costly pendulum swing experienced in theMurrumbidgee, more incremental shifts may be possiblewith a properly developed and coupled socio-hydrologicmodel that includes the bi-directional feedbacks betweenhuman and water systems. Such models can track the co-evolution of the physical (hydrological), human (social sys-tems, infrastructure, agricultural), and environmental (bio-geochemical, ecological) sub-systems in response to exter-nal drivers (i.e. climate variables, market conditions, food
www.hydrol-earth-syst-sci.net/18/1027/2014/ Hydrol. Earth Syst. Sci., 18, 1027–1041, 2014
1038 J. Kandasamy et al.: A case study from Murrumbidgee River basin, Australia
Fig 6
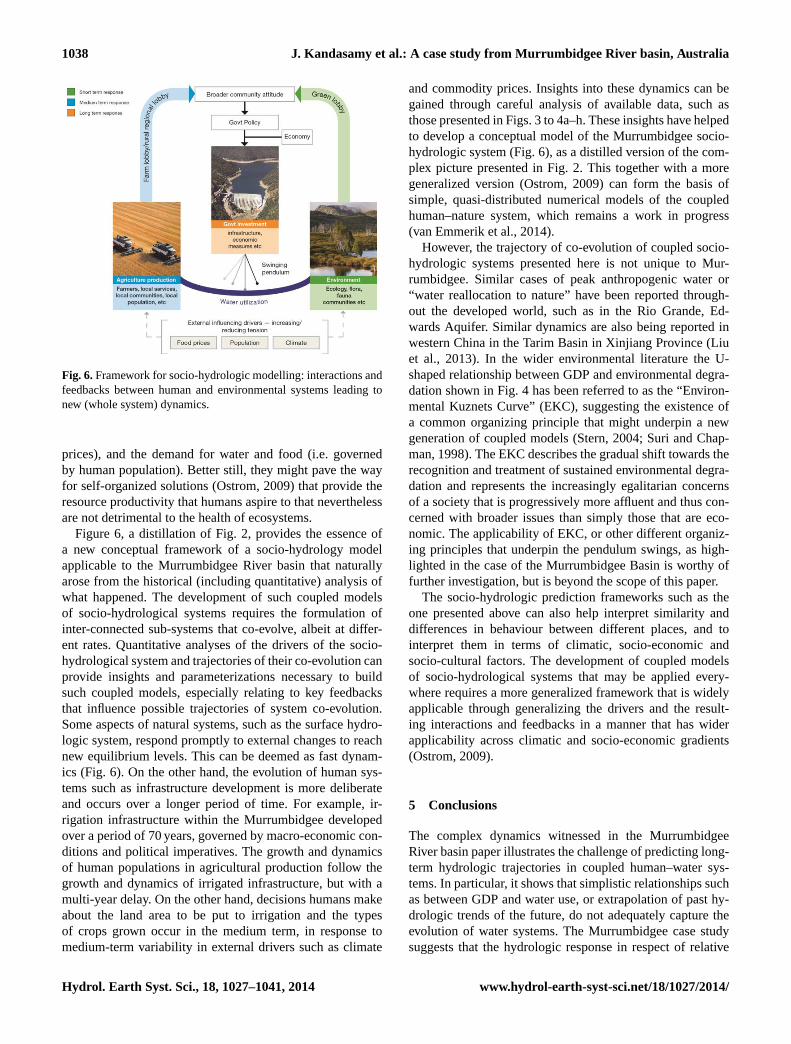
Fig. 6.Framework for socio-hydrologic modelling: interactions andfeedbacks between human and environmental systems leading tonew (whole system) dynamics.
prices), and the demand for water and food (i.e. governedby human population). Better still, they might pave the wayfor self-organized solutions (Ostrom, 2009) that provide theresource productivity that humans aspire to that neverthelessare not detrimental to the health of ecosystems.
Figure 6, a distillation of Fig. 2, provides the essence ofa new conceptual framework of a socio-hydrology modelapplicable to the Murrumbidgee River basin that naturallyarose from the historical (including quantitative) analysis ofwhat happened. The development of such coupled modelsof socio-hydrological systems requires the formulation ofinter-connected sub-systems that co-evolve, albeit at differ-ent rates. Quantitative analyses of the drivers of the socio-hydrological system and trajectories of their co-evolution canprovide insights and parameterizations necessary to buildsuch coupled models, especially relating to key feedbacksthat influence possible trajectories of system co-evolution.Some aspects of natural systems, such as the surface hydro-logic system, respond promptly to external changes to reachnew equilibrium levels. This can be deemed as fast dynam-ics (Fig. 6). On the other hand, the evolution of human sys-tems such as infrastructure development is more deliberateand occurs over a longer period of time. For example, ir-rigation infrastructure within the Murrumbidgee developedover a period of 70 years, governed by macro-economic con-ditions and political imperatives. The growth and dynamicsof human populations in agricultural production follow thegrowth and dynamics of irrigated infrastructure, but with amulti-year delay. On the other hand, decisions humans makeabout the land area to be put to irrigation and the typesof crops grown occur in the medium term, in response tomedium-term variability in external drivers such as climate
and commodity prices. Insights into these dynamics can begained through careful analysis of available data, such asthose presented in Figs. 3 to 4a–h. These insights have helpedto develop a conceptual model of the Murrumbidgee socio-hydrologic system (Fig. 6), as a distilled version of the com-plex picture presented in Fig. 2. This together with a moregeneralized version (Ostrom, 2009) can form the basis ofsimple, quasi-distributed numerical models of the coupledhuman–nature system, which remains a work in progress(van Emmerik et al., 2014).
However, the trajectory of co-evolution of coupled socio-hydrologic systems presented here is not unique to Mur-rumbidgee. Similar cases of peak anthropogenic water or“water reallocation to nature” have been reported through-out the developed world, such as in the Rio Grande, Ed-wards Aquifer. Similar dynamics are also being reported inwestern China in the Tarim Basin in Xinjiang Province (Liuet al., 2013). In the wider environmental literature the U-shaped relationship between GDP and environmental degra-dation shown in Fig. 4 has been referred to as the “Environ-mental Kuznets Curve” (EKC), suggesting the existence ofa common organizing principle that might underpin a newgeneration of coupled models (Stern, 2004; Suri and Chap-man, 1998). The EKC describes the gradual shift towards therecognition and treatment of sustained environmental degra-dation and represents the increasingly egalitarian concernsof a society that is progressively more affluent and thus con-cerned with broader issues than simply those that are eco-nomic. The applicability of EKC, or other different organiz-ing principles that underpin the pendulum swings, as high-lighted in the case of the Murrumbidgee Basin is worthy offurther investigation, but is beyond the scope of this paper.
The socio-hydrologic prediction frameworks such as theone presented above can also help interpret similarity anddifferences in behaviour between different places, and tointerpret them in terms of climatic, socio-economic andsocio-cultural factors. The development of coupled modelsof socio-hydrological systems that may be applied every-where requires a more generalized framework that is widelyapplicable through generalizing the drivers and the result-ing interactions and feedbacks in a manner that has widerapplicability across climatic and socio-economic gradients(Ostrom, 2009).
5 Conclusions
The complex dynamics witnessed in the MurrumbidgeeRiver basin paper illustrates the challenge of predicting long-term hydrologic trajectories in coupled human–water sys-tems. In particular, it shows that simplistic relationships suchas between GDP and water use, or extrapolation of past hy-drologic trends of the future, do not adequately capture theevolution of water systems. The Murrumbidgee case studysuggests that the hydrologic response in respect of relative
Hydrol. Earth Syst. Sci., 18, 1027–1041, 2014 www.hydrol-earth-syst-sci.net/18/1027/2014/

J. Kandasamy et al.: A case study from Murrumbidgee River basin, Australia 1039
allocation to humans and the environment is influenced bythe underlying socio-economic and institutional structures,which are themselves shaped by societal values – and thesevalues are fluid and ever-changing, thus requiring constantre-visiting of predictive model assumptions.
This paper has explored the history of water managementin the Murrumbidgee River basin in eastern Australia, witha focus on efforts to mediate the competition for water be-tween irrigated agriculture and the health of the riparian envi-ronment. The history of water management within the Mur-rumbidgee River basin over the past 100 years was dividedinto four eras. In Era 1 (1910–1960) the focus was exclu-sively on development of agriculture with no awareness of,or attention paid to, environmental issues. Era 2 (1960–1990)was the period which saw the onset of environmental prob-lems in the form of salinity. While the human response tosalinity was immediate in terms of remedial infrastructure,it did not address the fundamental causes and therefore theproblems persisted. Era 3 saw further widespread environ-mental degradation, with several mitigation measures imple-mented in the form of policy changes, infrastructure devel-opment, and the use of economic measures. These initiativesfailed to reverse environmental degradation. Finally, Era 4saw the implementation of a mix of solutions, some drastic,imposed by government to reverse environmental degrada-tion: these seem to have set in motion an environmental re-mediation and emergence of the “environmental customer”.
The history of conventional water management has givenrise to complex emergent dynamics, involving a pendu-lum swing that expresses a dramatic change in emphasisfrom agricultural development and food production in thefirst 50 years, which contributed to degradation of the en-vironment, to sustained efforts to mitigate and reverse en-vironmental degradation and restore ecosystem health. Thependulum swing is a result of several environmental andsocio-economic factors: evidence of worsening environmen-tal degradation, evolution of societal norms and values relat-ing to the environment, and favourable economic conditionsthat emboldened the government to act decisively. Neverthe-less, the pendulum swing has been costly to the environment,local communities and the government, and only arose be-cause hydrologic prediction frameworks that supported con-ventional integrated water management did not include bi-directional feedbacks between the human and hydrologicalsystems. The availability and use of such coupled modelsmay have prevented widespread environmental degradation.
Although this case study describes the particulars of theMurrumbidgee case study in great detail, the circumstancesare not unique. Rather, it typifies a trajectory that has beenobserved in other cases. Several authors have reported thereallocation of water from anthropogenic to ecological uses.Indeed, improved environmental outcomes as societies be-come wealthier and more focused on environmental concernshas been described via the Environmental Kuznets Curve.This therefore suggests that though individual water systems
in different settings are extremely complex and unique, thereis hope that general organizing principles may still be foundfor future research to consider.
Trajectories of co-evolution of coupled human–environment systems are governed by the nature of theinteractions and feedback between the decisions of humansto utilize water resources to derive socio-economic benefitsand by the adaptive capacity of the environmental systems.Clearly, to avoid costly pendulum swings, or to obtainmore realistic predictions of the future, this paper arguesfor the development of coupled socio-hydrological modelswith explicit inclusion of bi-directional feedbacks and thepossibility of accommodating evolving norms and valuesrelating to water and the environment. These models havethe potential to help plot a path explaining the evolution ofcoupled human–water systems under various scenarios. Thiswill provide guidance for sustainable development, and themeans to avoid costly pendulum swings as observed in theMurrumbidgee. They also provide the foundation for com-parative studies across gradients of climatic, socio-economicand socio-cultural conditions.
Acknowledgements.The work on this paper has been supportedin part by a supplementary grant from the US National ScienceFoundation to the Hydrologic Synthesis project “Water CycleDynamics in a Changing Environment: Advancing HydrologicScience through Synthesis” (EAR-0636043, PI: M. Sivapalan).The authors thank Veena Srinivasan for providing very insightfulcomments, which helped to substantially improve the paper. Theauthors also thank Adrian Williams, Gurmeet Singh and DanielMasters for providing data used in this study and for helpfuldiscussion.
Edited by: T. J. Troy
References
ABS: 100 years of change in Australian industry. 1301.0 –Year Book Australia, 2005, Australian Bureau of Statis-tics, available at:http://www.abs.gov.au/AUSSTATS/[email protected]/lookup/1301.0feature+article212005, (last access: May 2013),2005.
ABS: Australian Bureau of Statistics, available at:http://www.abs.gov.au/(last access: May 2013), 2013a.
ABS: Australian Yearbook, Australian Bureau of Statistics, avail-able at: http://www.abs.gov.au/AUSSTATS/[email protected](last ac-cess: May 2013), 2013b.
ABS: Australia’s Environment: Issues and Trends, (4613.0)2007, Australian Bureau of Statistics, available at:http://www.abs.gov.au/AUSSTATS/[email protected]/(last access:January 2014), 2013c.
ABS: Labour Force Australia Detailed Quarterly- Employed Per-sons By Industry Subdivision Sex–Employed Total- Agriculture-Persons, Australian Bureau of Statistics ABS-6291.0.55.003,Canberra Australia, 2013d.
www.hydrol-earth-syst-sci.net/18/1027/2014/ Hydrol. Earth Syst. Sci., 18, 1027–1041, 2014

1040 J. Kandasamy et al.: A case study from Murrumbidgee River basin, Australia
Arthington, A. H. and Pusey, B. J.: Flow restoration and protectionin Australian rivers, River Res. Applic., 19, 377–395, 2003.
Cai, X., McKinney, D. C., and Lasdon L. S.: A framework for sus-tainability analysis in water resources management and applica-tion to the Syr Darya Basin, Water Resour. Res., 38, 21-1–21-14,2002.
COAG: Council of Australian Governments water reform frame-work, Canberra, Australia: Council of Australian GovernmentsAustralian Government Publishing Service, 1994.
DSEWPC: Department of Sustainability, Environment, Wa-ter, Population and Communities Annual Reports, avail-able at: http://www.environment.gov.au/about/publications/annual-report/index.html(last access: May 2013), 2013.
DWR: Water distribution operations in irrigation areas and districtsof NSW, New South Wales Department of Water Resources, Gut-teridge, Haskins & Davey, Sydney, 1989.
Gleick, P. H. and Palaniappan, M.: Peak water limits to freshwaterwithdrawal and use, Proc. Natl. Acad. Sci., 107, 11155–11162,2010.
Gilligan, D.: Fish communities of the Murrumbidgee catchment:Status and trends, NSW Department of Primary Industries –Fisheries Final Report Series No. 75, ISSN 1449-9967, 2005.
GWG: Murray-Darling Basin Status of Groundwater 1992, Ground-water Working Group Technical Report No. 2. Murray-DarlingBasin Commission, Canberra, 1996.
Humphries, P.: Historical Indigenous use of aquatic resources inAustralia’s Murray-Darling Basin, and its implications for rivermanagement, Ecol. Manage. Restor., 8, 106–113, 2007.
Kingsford, R. T. and Porter, J. L.: Waterbirds on an adjacent fresh-water lake and salt lake in arid Australia, Biolog. Conserv., 69,219–228, 1994.
Kingsford, R. T. and Thomas, R. F.: Destruction of Wetlands andWaterbird Populations by Dams and Irrigation on the Mur-rumbidgee River, in Arid Australia, Environ. Manage., 34, 383–396, 2004.
Lewis, G.: The Growers’ Paddy – Land, Water and Co-operationin the Australian Rice Industry to the 1990s, available at:http://sydney.edu.au/business/__data/assets/pdf_file/0008/155969/Lewis-GrowersPaddy-2012.pdf(last access: March2013), 2012.
Liu, Y., Tian, F., Hu, H., and Sivapalan, M.: Socio-hydrologicperspectives of the co-evolution of humans and water in theTarim River Basin, Western China: the Taiji-Tire Model, Hydrol.Earth Syst. Sci. Discuss., 10, 12753–12792, doi:10.5194/hessd-10-12753-2013, 2013.
MDBA: Guide to the proposed Basin Plan: overview, Murray–Darling Basin Authority, Canberra, MDBA publication no.60/10, ISBN (print) 978-1-921557-72-9, 2010.
MDBC: Salinity and Drainage Strategy – Ten Years On 1999,Murray-Darling Basin Commission, Canberra, ACT, 1999.
MDBC: A Brief History of the Murray-Darling Basin Agreement,Murray-Darling Basin Commission, Canberra, Australia, avail-able at:http://www2.mdbc.gov.au/about/history_mdbc.html(lastaccess: December 2012), 2011.
MDBMC: The Algal Management Strategy for the Murray-DarlingBasin: a component of the natural resources management strat-egy, Murray-Darling Basin Ministerial Council, Canberra, 1994.
MDBMC: A review of the operation of the cap: Overview reportof the Murray Darling Basin Commission Ministerial Council,Murray-Darling Basin Ministerial Council, Canberra, 2000.
Montanari, A. Young, G., Savenije, H. H. G., Hughes, D., Wa-gener, T., Ren, L. L., Koutsoyiannis, D., Cudennec, C., Toth,E., Grimaldi, S., Blöschl, G., Sivapalan, M., Beven, K., Gupta,H., Hipsey, M., Schaefli, B., Arheimer, B., Boegh, E., Schy-manski, S. J., Di Baldassarre, G., Yu, B., Hubert, P., Huang,Y., Schumann, A., Post, D. A., Srinivasan, V., Harman, C.,Thompson, S., Rogger, M., Viglione, A., McMillan, H., Charack-lis, G., Pang, Z., and Belyaev, V.: Panta Rhei – EverythingFlows: Change in hydrology and society – The IAHS Sci-entific Decade 2013–2022, Hydrol. Sci. J., 58, 1256–1275,doi:10.1080/02626667.2013.809088, 2013.
Murrumbidgee CMA: Murrumbidgee catchment action plan,Wagga Wagga, NSW: Murrumbidgee Catchment ManagementAuthority, 2006.
Murrumbidgee CMA: Our Catchment, Murrumbidgee Catchment:Rich and Diverse, available at:http://www.murrumbidgee.cma.nsw.gov.au/about/catchment.aspx?print=1(last access: Decem-ber 2012), 2012.
NWI: The impacts of water trading in the southern Murray–DarlingBasin: an economic, social and environmental assessment, Na-tional Water Commission, Canberra, Australia, ISBN 978-1-921107-98-6, 2010.
NWI: Water trading in the rice industry, National Water Commis-sion, Canberra, Australia, 2011.
Ostrom, E.: A General Framework for Analyzing Sustainability ofSocial-Ecological Systems, Science, 325, 419-422, 2009.
Productivity Commission: Trends in Australian Agriculture, Re-search Paper, Canberra, Australia, 2005.
Richter, B. D.: Tapped out: how can cities secure their water future?,Water Pol., 15, 335–363, 2013.
Roderick, M. L.: Introduction to special section on Water Resourcesin the Murray-Darling Basin: Past, present, and future, Water Re-sour. Res., 47, W00G01, doi:10.1029/2011WR010991, 2011.
Schofield, B., Burt, A., and Connell, D.: Environmental water al-location: Principles, policies and practices, Canberra, Australia:Land and Water Australia, 2003.
Scholz, J. T. and Stiftel, B.: Adaptive Governance and Water Con-flict: New Institutions for Collaborative Planning, Resources forthe Future, 2005.
Sivapalan, M.: Predictions under Change (PUC): Water, Earth andBiota in the Anthropocene, Research Report. Center for Wa-ter as a Complex Ecosystem, University of Illinois at Urbana-Champaign, available at:http://www.tandfonline.com/doi/pdf/10.1080/02626667.2011.580747, 2011.
Sivapalan, M., Savenije, H. H. G., and Blöschl, G.: Socio-hydrology: A new science of people and water, Hydrol. Process.,26, 1270–1276, 2012.
Srinivasan, V., Lambin, E. F., Gorelick, S. M., Thompson, B. H., andRozelle, S.: The nature and causes of the global water crisis: Syn-dromes from a meta-analysis of coupled human-water studies,Water Resour. Res., 48, W10516, doi:10.1029/2011WR011087,2012.
Suri, V. and Chapman, D.: Economic growth, trade and energy: im-plications for the environmental Kuznets curve, Ecol. Econ., 25,195–208, 1998.
Hydrol. Earth Syst. Sci., 18, 1027–1041, 2014 www.hydrol-earth-syst-sci.net/18/1027/2014/
J. Kandasamy et al.: A case study from Murrumbidgee River basin, Australia 1041
State Library of South Australia: River Murray timeline 1800-present, available at:http://www.slsa.sa.gov.au/murray/timeline.htm (last access: January 2014), 2014.
Stern, D. I.: The rise and fall of the Environmen-tal Kuznets Curve, World Develop., 32, 1419–1439,doi:10.1016/j.worlddev.2004.03.004, 2004.
Turral, T., Connell, D., and McKay, J.: The Drama of RestrainingWater Use, Chap. 12, in: River Basin Trajectories: Societies, En-vironments and Development, edited by: Molle, F. and Wester,P., CAB International 2009, 2009.
van Emmerik, T., Zheng, Li, Sivapalan, M., Savenije, H. H. G., Kan-dasamy, J., and Chanan, A.: Socio-hydrologic modeling to un-derstand and mediate the competition for water between humansand ecosystems: Murrumbidgee River Basin, Australia, Hydrol.Earth Syst. Sci., this issue, submitted, 2014.
Wilkinson, J.: Water for Rural Production in NSW: Grand Designsand Changing Realities, NSW Parliamentary Library ResearchService, Briefing Paper No 26/97, ISBN 0731316045, 1997.
www.hydrol-earth-syst-sci.net/18/1027/2014/ Hydrol. Earth Syst. Sci., 18, 1027–1041, 2014