socioeconomic assessment of wyoming - sheridan media · socioeconomic assessment of wyoming ......
TRANSCRIPT
Socioeconomic Assessment of Wyoming
Prepared by: Economically Needed Diversity Options for Wyoming (ENDOW) Executive Council
Submitted to:Honorable Matt Mead, Governor of Wyoming
Joint Minerals, Business, and Economic Development Interim Committee
August 30, 2017
ENDOW Socioeconomic Report | A Letter from the ENDOW Executive Council P a g e | i
August 30, 2017 Dear Governor Mead and Members of the Joint Minerals, Business and Economic Development Interim Committee, Senate Enrolled Act No. 64 (2017 General Session) requires the Economically Needed Diversity Options for Wyoming (ENDOW) Executive Council (Council) to submit an exhaustive assessment of socioeconomic data. This report provides baseline information for preliminary recommendations to be provided later this year and for Wyoming’s 20-year economic diversification strategy. This report is a sector-by-sector analysis of Wyoming’s industries. These analyses, originally prepared for the Council, have been evaluated and enhanced by business representatives and include national trends, peer state comparisons, workforce data, barriers, enablers and opportunities. Honing into key sectors and specific industries, with the input of the private sector, will help us better understand how to position our workforce, infrastructure, marketing and innovation efforts. We are steadfastly optimistic. We have heard inspiring stories of Wyoming natives who left to pursue education or careers, only to return home later for fulfilling jobs or to establish and expand businesses while enjoying Wyoming’s lifestyle. In addition to pharmaceutical production and groundbreaking biomedical research, Council members have visited large manufacturing facilities as well as small batch, niche manufacturers adding value to our resource base. We have seen the value when high school robotics programs connect with computer machining and firms manufacturing high-tech instruments. The intersection of technology, creativity, engineering and education at makers’ spaces is inspiring. Whether it is virtual reality, unmanned aircraft, high-tech fabrics, or the production of industrial equipment for a global economy — there is existing sector diversity and foundational successes upon which Wyoming can build a viable and diverse economic future. Our work to date has identified areas where more can be done as part of a successful 20-year economic diversification strategy. They include:
• We need to do more to promote and celebrate our successes. There are many uniquely Wyoming stories to tell — ones that will attract other innovative and forward-thinking individuals and inspire Wyoming’s future generations. We need to trumpet these success stories far and wide.
• Wyoming has great accolades in terms of the number of business startups. Wyoming’s past economic development planning, however, has not focused enough on innovation and entrepreneurship. We are near the bottom in terms of attracting venture capital and need to turn that around. Accessing federal research and development funding and transferring technologies from the University to commercialization activity need improvement. The Council is looking at how to attract, grow and inspire entrepreneurs and provide them the space, capital, support, expertise and mentorship they need to solve the world’s problems.
• The Council needs to better understand the role each sector plays in Wyoming’s economy. This includes non-profit organizations, which generate a significant amount of economic and community activity.
• Wonderful Wyoming towns invite visitors offering scenic byways and good amenities. These communities need more development to foster long-term growth. We must focus on people and take to heart what a Sheridan business leader told us, “Our job is not about recruiting businesses, it is about recruiting people.” Housing, community amenities and jobs for spouses are critical to attracting and retaining talent. For a world-class base of workers and entrepreneurs, we must have vibrant and
ENDOW Socioeconomic Report | A Letter from the ENDOW Executive Council P a g e | ii
healthy communities. Key areas include access to health care, housing, attractive downtowns, air service and high-speed internet connectivity. The Council has created subgroups focused on barriers to advancement.
• Workforce is the single greatest inhibitor – and opportunity – for growth and stability. We must accept that encouraging reasonable population growth is necessary and can be achieved in a way that does not compromise our customs, culture or quality of life. The University of Wyoming and Wyoming’s seven community colleges are tremendous assets. They will be integral to providing our workforce better access to cutting-edge training opportunities to respond to a changing economy. Employers tell us we can do more to educate our youth about life skills such as teamwork, leadership and financial literacy. The Council is evaluating workforce solutions using apprenticeship, internship and mentorship as well as specific certification and licensing programs.
• Wyoming currently ranks among the top ten states in annual K-12 per-pupil spending (currently
about $17,000 per student), increasing 62 percent from 2005 to 2015. More than 92% of
Wyomingites 25 and older have earned at least a high school diploma. On a percentage basis, we
graduate fewer students with bachelor’s degrees and Wyoming’s service-producing industries
contribute less to our economy than our peer states or the nation. Educational readiness (pre-
kindergarten through post-secondary) and educational achievement need improvement.
• The Aeronautics Division of the Wyoming Department of Transportation has assembled a workgroup, which includes representation by Council members, to address commercial air service. Commercial air service is a significant limiting factor in expanding and diversifying Wyoming’s economy. Without it, we will be unable to effectively recruit or retain entrepreneurs and businesses that need quick access to markets and customers. An ENDOW Advisory Board member refers to it as “the billion-dollar problem” affecting all rural America. There appears to be no nationwide fix and states will be competing for a limited number of opportunities to solve this problem. Wyoming must be more aggressive in finding solutions to air service.
• Wyoming has invested in the Unified Network. This is a 100-gigabit, redundant, statewide network. Additionally, Wyoming ranks first in the nation in classroom broadband connectivity. We can do more. Internet accessibility has emerged as a barrier to economic advancement and diversification and has been highlighted in community testimonials and the attached socioeconomic report. It is a complex topic and the Council is in the process of evaluating many issues, including: access, speeds, regulatory barriers, and innovative solutions.
• The Wyoming Business Council, Department of Workforce Services, local economic developers, the University of Wyoming and our community colleges have achieved positive results. We can better align the multitude of well-intentioned economic development efforts across and within agencies to produce greater impact and focus. We are learning about agencies’ operations, funding, and how we can coordinate efforts to reduce duplication and integrate programs.
To achieve our goals, Wyoming must be prepared to address current economic circumstances – low growth, lack of diversification, and troubling population trends (e.g., outmigration and aging), while preparing for future challenges presented by a changing global economy and technological advancements. Further, our approach must be different than in the past. Joe Schaffer, Ed.D, President of Laramie County Community College states it well, “Doing the same things over and over with the same results has not served Wyoming well.” The Council is aware and sensitive to past efforts to revitalize Wyoming’s economy. The Council is keen to create benchmarks by which we can measure our outcomes.

ENDOW Socioeconomic Report | A Letter from the ENDOW Executive Council P a g e | iii
By focusing on outcomes, we believe we will be able to develop a strategy that fosters a diversified and sustainable state economy. If we have the political and cultural will to think differently and make the proper investments, we can increase Wyoming’s prosperity and economic diversification.
Sincerely,
Greg Hill, Chair Bill Schilling, Vice Chair
ENDOW Socioeconomic Report | ENDOW Executive Council Members P a g e | iv
ENDOW Executive Council Members
• Greg Hill of Wilson – President and Chief Operating Officer of Hess Corporation, Governor’s Designee and Co-Chair of ENDOW
• Bill Schilling of Casper – Executive Director of Leadership Wyoming. Vice-Chair of ENDOW • Jesus Rios of Sheridan – CEO of Ptolemy Data Systems • Rosie Berger of Big Horn – Former Legislator • Karen Hostetler of Buffalo – Founder and President of Mountain Meadow Wool • Mark Christensen of Gillette – President of The MC Family of Companies and Campbell County
Commissioner • Jerad Stack of Casper - Entrepreneur and Founding Member of Breakthrough 307 • Wally Wolski of Yoder - Goshen County Economic Development Corporation and Goshen County
Commissioner • Matt Kaufman of Cheyenne – Co-founder and Chairman of the Board of the Array School of
Technology and Design and Co-founder of Wyoming Entrepreneurs • Ray Fleming Dinneen of Cheyenne – Founder and Executive Director of CLIMB Wyoming • Mary Ellbogen Garland of Laramie – President and Chair of the John P. Ellbogen Foundation • John Temte of Laramie – Founder and Managing General Partner of Temte Capital • Steven Moldt of Riverton – President of Inberg-Miller Engineers • Cy Lee of Fort Washakie – Executive Director of the Wind River Development Fund • Ike Eastman of Powell – President of Eastmans’ Publishing • Bob Viola of Jackson – Founder and Director of Engineering for Square One Systems Design • Barbara Hoeft of Jackson – Managing Partner of Willow Street Group • Barbara Sessions of Afton – Vice President and CFO for Silver Star Communications • Cindy Johnson of Green River – President of the Para-Transit Division of Syncromatics • Bret Pizzato of Rock Springs – Plant Manager for J.R. Simplot • Steve Russell of Evanston – Former CEO of Carbon Fiber Technology • Senator Eli Bebout of Riverton – President of the Wyoming Senate • Representative Steve Harshman or Casper – Speaker of the Wyoming House of Representatives • Senator Michael Von Flatern of Gillette – Vice President of the Senate and Chairman of the
Senate Minerals, Business and Economic Development Committee • Representative Mike Greear of Worland – Chairman of the House Minerals, Business and
Economic Development Committee
Acknowledgements
Great appreciation is given to the staff members of the Wyoming Business Council, Governor’s Policy
Office, Economic Analysis Division, Wyoming Department of Workforce Services, University of Wyoming,
and Wyoming Community College Commission whose leadership, dedication and extensive
contributions have made this report possible.

ENDOW Socioeconomic Report |Table of Contents P a g e | v
Contents A Letter from the Economically Needed Diversification Options for Wyoming Executive Council ............ i
ENDOW Executive Council Members .......................................................................................................... iv
Socioeconomic Assessment of Wyoming ..................................................................................................... 1
Introduction ................................................................................................................................................... 1
Summary of Socioeconomic Data .................................................................................................................. 2
Demographic Trends in Wyoming ............................................................................................................. 2
Fiscal Sustainability .................................................................................................................................... 3
Industrial Sectors ....................................................................................................................................... 4
Synthesis of Sector Data ........................................................................................................................ 4
Gross Domestic Product and Employment ........................................................................................ 4
Enablers and Barriers ......................................................................................................................... 5
Assets ................................................................................................................................................. 6
Individual Sector Summaries ................................................................................................................. 7
Agriculture, Forestry, Fishing and Hunting (NAICS 11) ...................................................................... 7
Mining, Quarrying and Oil and Gas Extraction (NAICS 21) ................................................................ 8
Utilities (NAICS 22) ............................................................................................................................. 8
Construction (NAICS 23) .................................................................................................................... 9
Manufacturing (NAICS 31-33) .......................................................................................................... 10
Wholesale Trade (NAICS 42) ............................................................................................................ 11
Retail Trade (NAICS 44-45) .............................................................................................................. 12
Transportation and Warehousing (NAICS 48-49) ............................................................................ 13
Information (NAICS 51) .................................................................................................................... 13
Finance, Insurance and Real Estate (NAICS 52-53) .......................................................................... 14
Professional and Business Services (NAICS 54-56) .......................................................................... 15
Education and Health Care Services (NAICS 62) .............................................................................. 15
Leisure and Hospitality NAICS (71-72) ............................................................................................. 16
Other Services (NAICS 81) ................................................................................................................ 17
Public Administration (NAICS 92) .................................................................................................... 17
Assessment of Demographic Trends in Wyoming ....................................................................................... 19
Introduction ......................................................................................................................................... 19
Migration Trends ................................................................................................................................. 19
Race and Ethnicity ............................................................................................................................... 20
Aging Population .................................................................................................................................. 21

ENDOW Socioeconomic Report |Table of Contents P a g e | vi
Educational Attainment ....................................................................................................................... 24
Other Facts on Wyoming’s Population ................................................................................................ 25
Summary .............................................................................................................................................. 25
Examination of State and Local Fiscal Sustainability ................................................................................... 27
Appendix...................................................................................................................................................... 31
Appendix 1: Assessment of Economy by Industrial Sectors ........................................................................ 31
Agriculture, Forestry, Fishing, Hunting (11)............................................................................................. 34
Mining, Quarrying, Oil and Gas (21) ........................................................................................................ 54
Utilities (22).............................................................................................................................................. 78
Construction (23) ................................................................................................................................... 109
Manufacturing (31-33) ........................................................................................................................... 129
Wholesale Trade ( NAICS 42) ................................................................................................................. 155
Retail Trade (44-45) ............................................................................................................................... 173
Transportation and Warehousing (48-49) ............................................................................................. 188
Information (51)..................................................................................................................................... 213
Finance, Insurance, Real Estate – 52-53 ................................................................................................ 240
Professional and Business Services (54-56) ........................................................................................... 257
Education and Health Services (61-62) .................................................................................................. 284
Leisure and Hospitality (71-72) .............................................................................................................. 315
Other Services (81) ................................................................................................................................ 347
Public Administration (91) ..................................................................................................................... 349
Appendix 2: Wyoming County Profiles, 2016 ............................................................................................ 351

Socioeconomic Assessment of
Wyoming
ENDOW Socioeconomic Report | Introduction P a g e | 1
SOCIOECONOMIC ASSESSMENT OF
WYOMING
Introduction The socioeconomic assessment is the keystone foundational report of the Economically Needed Diversity
Options for Wyoming (ENDOW) Executive Council to foster discussion, understanding, evaluation and
development of a comprehensive economic diversification policy and strategy outlined in Wyoming
Statutes, (W.S.), 9-12-1401 through 9-12-1404.
This report is submitted to fulfill the statutory requirement identified in W.S. 9-12-1402 (a)(ii):
This report is presented in a high-level overview summary, followed by detailed assessments
of Wyoming’s demographic trends, fiscal sustainability and industry sectors. The review of industry
sectors (Page 4 and Appendix 1), utilizing the North America Industrial Code Schedule, (NAICS), will call
out state and national trends of new and emerging sectors and subsectors, descriptions of how
Wyoming compares to surrounding states, Alaska and the US, a description of businesses contained in
each sector, workforce characteristics, strengths and deficiencies, export market activity, asset
maps describing industry characteristics geographically, enablers, incentives and challenges to the
industry and industry expert input and comments.
Looking ahead, the ENDOW Executive Council will submit by December 31, 2017 their preliminary
findings and recommendations in the development of a comprehensive economic diversification
strategy to the Governor and Legislature per details outlined in W.S. 9-12-1402 (a)(iii) and their final
recommendations report will be submitted to the Governor for his approval by August 1, 2018 as
outlined in W.S. 9-12-1402(a)(iv).
“By August 30, 2017, prepare and submit to the Governor and Legislature through the
joint minerals, business and economic development interim committee, an exhaustive
assessment of socioeconomic data, which shall include an examination of state and local
fiscal sustainability, existing, new and emerging economic sectors and subsectors of the
economy, identification of potential business development and innovation zones, an
inventory of existing workforce strengths and deficiencies, economic trends and key
enablers for economic growth in the state and that translates to viable business
development.”

ENDOW Socioeconomic Report | Summary of Socioeconomic Data P a g e | 2
Summary of Socioeconomic Data This section presents high-level summaries of demographic trends, fiscal sustainability, and industrial
sector assessments. Please see following sections and Appendix 1 for more detailed analyses.
Demographic Trends in Wyoming 1. Nationwide, as low fertility rates continue to persist and baby boomers age, the growth of both
population and labor force is expected to be slow for the next 14 years. The average year-over-
year growth rate for the state is expected to be about 0.5 percent during the period, comparing
to 1.1 percent experienced so far since 2010.
2. Both the U.S. and Wyoming are experiencing considerable growth in older populations.
Wyoming’s total population declined about 1,000, or 0.2 percent between July 2015 and July
2016, but the population 65 and over grew 3.8 percent or 3,140 during the same period, and is
now nearly 88,000. The average annual growth rate for this older population is projected to be
3.3 percent from 2016 to 2030. The total number of residents 65 and over will reach 139,500 by
2030 when all baby boomers will be in this cohort, accounting for 22.0 percent of total population
in Wyoming. The rapid growth of elderly population will present challenges to policy makers and
programs such as Social Security, Medicare and Medicaid. It will also affect families, businesses,
and health care providers.
3. Both the nation and Wyoming’s population continue to grow in diversity. Wyoming’s total
minority population reached 93,256 in July 2016. Minority is defined as any group other than
single-race, Non-Hispanic White. The growth of minorities since 2010 was 14,090 persons, or 17.8
percent growth increase, compared with 3.9 percent increase for the state’s 2016 total
population. Nearly two-thirds of the state’s population growth from 2010 to 2016 was attributed
to the minority population. Future population increases for the U.S. will be from racial and ethnic
groups rather than the Non-Hispanic White.
4. Traditionally a rapid drop in a state’s unemployment rate is attributed to economic expansion
including strong employment growth. However, that is not the case in Wyoming since 2016. In
fact, the unemployment rate in the state has been steadily dropping since May 2016, and the
3.9% in June 2017 was the lowest value since November of 2009, pre-Great Recession.
However, the employment for June 2017 was still about 1% below employments levels one year
ago. Wyoming’s labor force continues to drop, and is estimated to be thousands less compared
to last year. Possible explanations for these phenomena are: 1) some baby boomers (age 53 to
71 in 2017) left the labor force by retiring in the state or out of the state, and 2) younger people
continue to move to other states because of the robust nationwide labor market, particularly in
Wyoming’s neighboring states. Additionally, Texas, Arizona, Oregon, and Washington are all
experiencing strong job growth. For example, Wyoming’s number one competitor (in terms of
labor force), Colorado, had the lowest unemployment rate (2.3%) while Utah had the fastest
employment growth (3.0%) in the country for June 2017. If the U.S. economic expansion
(already one of the longest in history) continues, Wyoming’s labor market will remain tight.
ENDOW Socioeconomic Report | Summary of Socioeconomic Data P a g e | 3
Fiscal Sustainability At the May 11, 2017 meeting, the ENDOW Executive Council adopted as a working definition for
fiscal sustainability the following: “a government’s ability and willingness to generate inflows of
resources necessary to honor current service commitments and to meet financial obligations as they
come due, without transferring financial obligations to future periods that do not result in
commensurate benefits.”
Historically, 70 percent of revenue collected by the state of Wyoming comes from the energy
mineral industry and therefore the condition of state coffers depends directly on the market value
of energy commodities that are traded on a national and international basis
Looking forward to the FY 2019-2020 biennium, including the reductions made in the FY 2017-2018
biennium, the expected standard budget for the operations of state government exceeds projected
traditional revenue by an estimated $100 million. However, the most compelling concern for the
state of Wyoming moving forward is how to fund K-12 education. Wyoming’s K-12 system is facing
a budget shortfall of an estimated $250 million per year, or $500 million for the 2019-2020
biennium.
County, municipal and other local government entities were not assessed for fiscal sustainability due
time and staff limitations, but it is presumed local governments are experiencing fiscal crisis in the
same manner. Local governments’ tax base dependence on energy commodity revenues deeply
and directly affect assessed valuation for local levies and state shared revenue.
ENDOW Socioeconomic Report | Summary of Socioeconomic Data P a g e | 4
Industrial Sectors The following section integrates and summarizes Wyoming's 15 primary industrial sectors. See Appendix
1 for more detailed analyses.
Synthesis of Sector Data
Gross Domestic Product and Employment
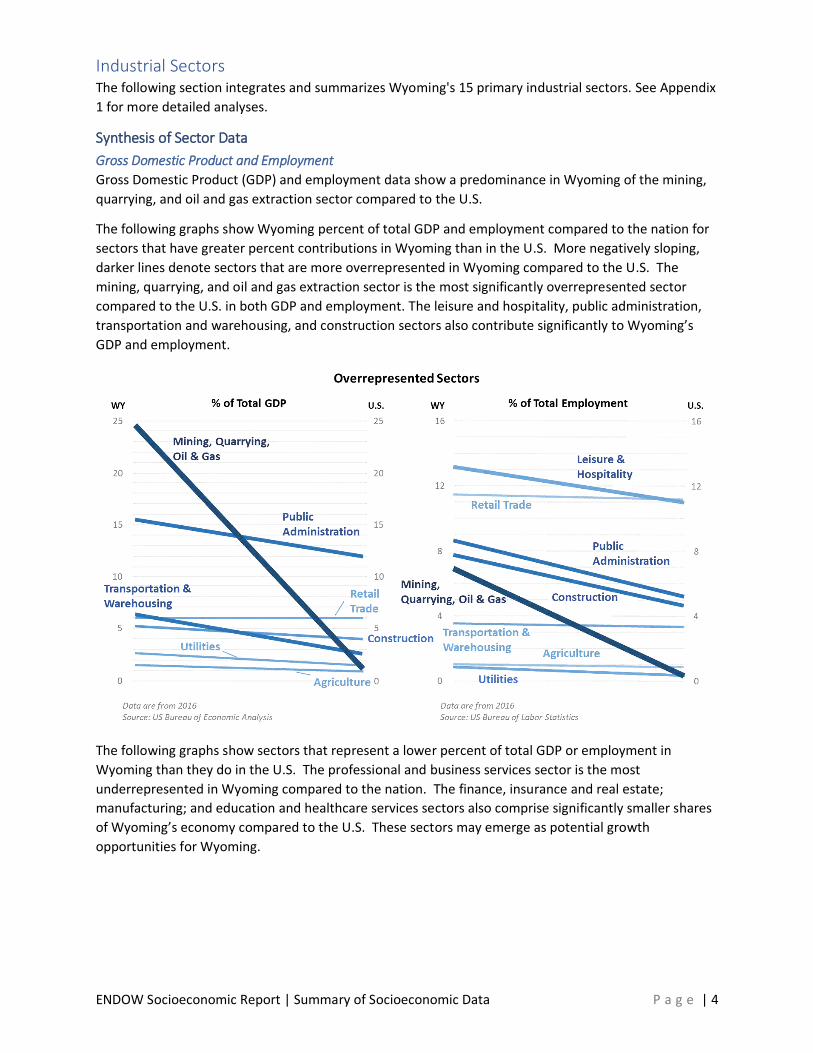
Gross Domestic Product (GDP) and employment data show a predominance in Wyoming of the mining,
quarrying, and oil and gas extraction sector compared to the U.S.
The following graphs show Wyoming percent of total GDP and employment compared to the nation for
sectors that have greater percent contributions in Wyoming than in the U.S. More negatively sloping,
darker lines denote sectors that are more overrepresented in Wyoming compared to the U.S. The
mining, quarrying, and oil and gas extraction sector is the most significantly overrepresented sector
compared to the U.S. in both GDP and employment. The leisure and hospitality, public administration,
transportation and warehousing, and construction sectors also contribute significantly to Wyoming’s
GDP and employment.
The following graphs show sectors that represent a lower percent of total GDP or employment in
Wyoming than they do in the U.S. The professional and business services sector is the most
underrepresented in Wyoming compared to the nation. The finance, insurance and real estate;
manufacturing; and education and healthcare services sectors also comprise significantly smaller shares
of Wyoming’s economy compared to the U.S. These sectors may emerge as potential growth
opportunities for Wyoming.

ENDOW Socioeconomic Report | Summary of Socioeconomic Data P a g e | 5
Enablers and Barriers
The Executive Council has inventoried a primary list of economic enablers and barriers of businesses and
the diversification of Wyoming’s economy:
✓ Enablers for successful businesses include: low taxes, livability of communities, interstate
highway system, low level of regulatory ‘red tape’, internet connectivity, regional
collaborations, natural resources, community colleges system, many business organizations.
✓ Barriers to business success include: limited workforce in numbers and skills, limited
commercial air transportation, lack of high speed internet in rural areas, proximity to markets,
access to capital, limited health care services, and affordable health insurance.

ENDOW Socioeconomic Report | Summary of Socioeconomic Data P a g e | 6
Assets
The following maps depict assets that are limiting geographic factors for more than one analyzed sector.
Workforce
The map below depicts population within 60 miles. This is used as a proxy for workforce in several
sectors, in accordance with site selector rules of thumb. According to these rules of thumb, employees
are willing to drive a maximum of ~60 miles to work, and one new employee can be drawn from every
~300 people in a population.
Broadband
ENDOW Socioeconomic Report | Summary of Socioeconomic Data P a g e | 7
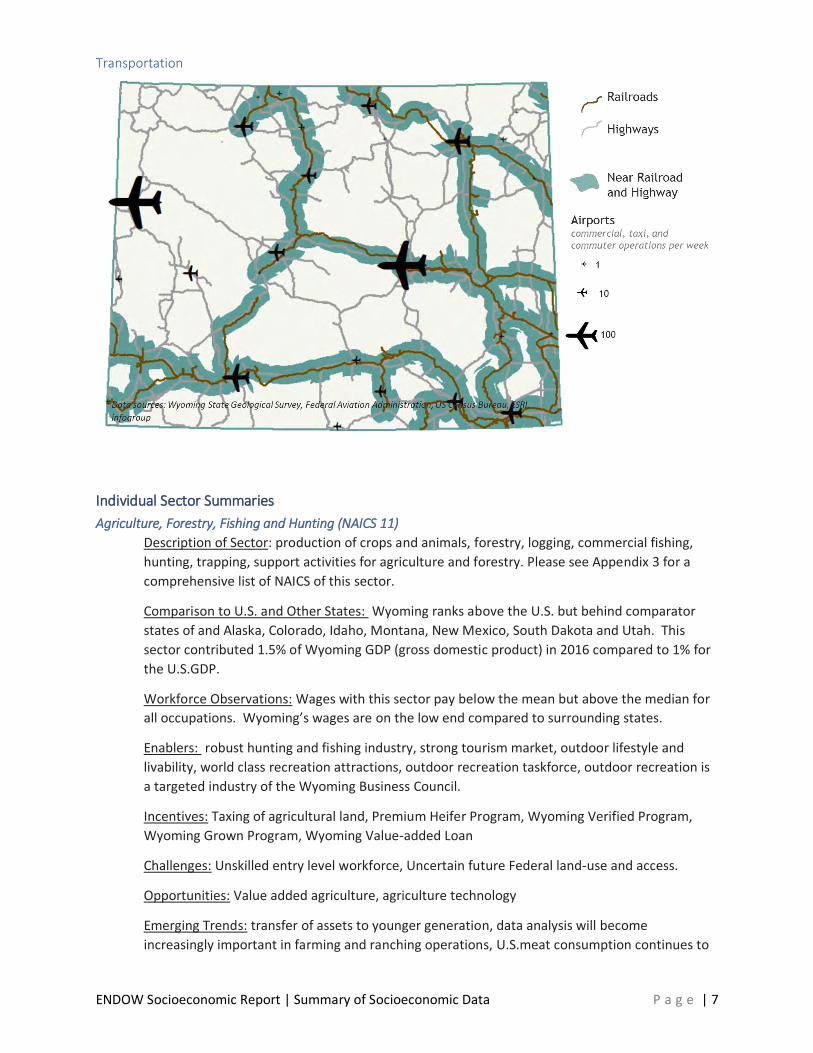
Transportation
Individual Sector Summaries
Agriculture, Forestry, Fishing and Hunting (NAICS 11)
Description of Sector: production of crops and animals, forestry, logging, commercial fishing,
hunting, trapping, support activities for agriculture and forestry. Please see Appendix 3 for a
comprehensive list of NAICS of this sector.
Comparison to U.S. and Other States: Wyoming ranks above the U.S. but behind comparator
states of and Alaska, Colorado, Idaho, Montana, New Mexico, South Dakota and Utah. This
sector contributed 1.5% of Wyoming GDP (gross domestic product) in 2016 compared to 1% for
the U.S.GDP.
Workforce Observations: Wages with this sector pay below the mean but above the median for
all occupations. Wyoming’s wages are on the low end compared to surrounding states.
Enablers: robust hunting and fishing industry, strong tourism market, outdoor lifestyle and
livability, world class recreation attractions, outdoor recreation taskforce, outdoor recreation is
a targeted industry of the Wyoming Business Council.
Incentives: Taxing of agricultural land, Premium Heifer Program, Wyoming Verified Program,
Wyoming Grown Program, Wyoming Value-added Loan
Challenges: Unskilled entry level workforce, Uncertain future Federal land-use and access.
Opportunities: Value added agriculture, agriculture technology
Emerging Trends: transfer of assets to younger generation, data analysis will become
increasingly important in farming and ranching operations, U.S.meat consumption continues to
ENDOW Socioeconomic Report | Summary of Socioeconomic Data P a g e | 8
drop, Chinese meat consumption continues to rise, Genetically Modified Organism (GMO) foods
and livestock treatment are public concern issues, lumber industry will continue to be largely
controlled by housing demand and trade with Canada, biomass conversion to energy is a viable
form of alternative energy which uses the waste of logging operations.
Mining, Quarrying and Oil and Gas Extraction (NAICS 21)
Description of Sector: companies that extract oil, gas, coal, metals, gravel, other minerals and
support activities for mining and oil and gas extraction. Please see Appendix 3 for a
comprehensive list of NAICS of this sector.
Comparison to U.S. and Other States: This sector represents 30.1% of Wyoming’s GDP
compared to 1.5% for U.S.GDP.
Workforce Observations: Wages with this sector pay above the mean and median for all
occupations. Wyoming’s wages are near the average of comparator states.
Enablers: comparative advantage of natural resources, existing infrastructure built over
decades, Wyoming Infrastructure Authority, Wyomingites and public officials favor natural
resource development.
Incentives: Business Committed Grants (BCG), Large Loan Fund, Challenge Loan
Challenges: Proximity to markets, volatility of natural resource commodity prices, boom-bust
culture, boom-bust tax revenues, cost to produce renewables will become on par with fossil
fuels, advanced carbon technologies early in life cycle, speed of industrial siting process,
inefficient permitting.
Opportunities: Growing and leveraging Wyoming’s robust natural resource base to drive growth
in research and development, tech companies, manufacturing, and other underrepresented
sectors, CO2 capture and use for enhanced oil recovery, and exploration of advances in
technology.
Emerging Trends: Safety is a perennial priority for well-regarded companies in this sector, and
safety metrics are important in evaluating shareholder value. Innovations in horizontal drilling
have bolstered U.S. oil and gas production in the last decade, and have drawn some producers’
focus. to onshore plays, including those in Wyoming. In recent years, low coal, oil, gas, and
renewable prices have led to greater competition in the electricity generation market,
decreased production of traditional resources, reduced shareholder value, and significant
reductions in employed workforce. These effects can be seen in Wyoming and globally. The
downturn has also driven innovation to reduce costs and increase efficiency, and focused U.S.
producers’ attention on plays that can break even at low prices (such as the Permian Basin in
west Texas).
Utilities (NAICS 22)
Description of Sector: Electric power generation/transmission/distribution, natural gas
distribution, water supply and sewage treatment. Please see Appendix 3 for a comprehensive
list of NAICS of this sector.
Comparison to U.S. and Other States: Wyoming exceeds the national average for this sector’s
contribution by .9%. and contributed 2.6% to Wyoming’s GDP in 2016 compared to 1.7% for the
US. Above average contribution amounts to $309 million added to Wyoming’s GDP

ENDOW Socioeconomic Report | Summary of Socioeconomic Data P a g e | 9
Workforce Observations: Wages within this sector pay above the annual mean and median for
all occupations. Compared to surrounding states; North Dakota, Utah and Colorado have aa
higher annual average wage for this sector.
Enablers: Low regulation, low tax climate
Incentives: Wyoming Infrastructure Authority
Challenges: Large barriers to entry, lack of transmission capacity.
Opportunities: Increasing efficiency of existing plants, natural gas energy generation, CO2
Capture and use from gas power plants, wind energy, nuclear energy, solar energy.
Emerging Trends: Electricity generation by coal and petroleum power plants is decreasing,
nuclear has held steady and renewables and natural gas have increased. As changing technology
and regulatory uncertainty continues to plague energy generation markets, infrastructure is
aging and needs to be updated or replaced. Energy companies are very risk averse and can be
reluctant to make large capital investments as they make decisions on long term factors, with
the life of an asset lasting 50 or more years. Renewable energy sources are becoming more
viable because of decreased cost, increased efficiency and increased ability to store energy for
future use.
Construction (NAICS 23)
Description of Sector: Residential building construction, building equipment contractors,
specialty trade contractors, affordable housing, ag infrastructure upgrades, construction
machinery. Please see Appendix 3 for a comprehensive list of NAICS of this sector.
Comparison to U.S. and Other States: Wyoming is significantly ahead of the U.S. average and on
par with many surrounding states in this industry. Activities in this sector contributed 5.1% to
Wyoming’s GDP in 2016 compared to 4.0% for the US. Wyoming is .8 percentage points ahead
of South Dakota and about a half a percentage point or less behind surrounding states Colorado,
Idaho and Montana. Utah leads the northern Rocky Mountain region at 6.0%. In 2016, Wyoming
ranked 8th nationally for construction as a percentage of gross state product
Workforce Observations: Wyoming wages within this sector pay better than the mean and
median for all occupations. In Wyoming, however, wages are less than the U.S. average, but pay
more than surrounding states Colorado, Idaho, Montana, New Mexico and South Dakota.
Enablers: No corporate and personal income taxes, low sales tax, community college training
programs
Incentives: Business Committee Grants, Community Enhancement Grants, Community
Readiness Grants, Challenge Loan, Workforce Training Grants
Challenges: Lack of skilled workforce (in-state subs, etc.), availability of workforce, significant
out-of-state competition, lack of reliable job base in sufficient numbers for building more homes
for first-time home buyers, lack of appraisers in some of the smaller rural areas, and there is a
problem with replacing them, increased government regulation, as mid-size companies find it
challenging to manage the costs of compliance.

ENDOW Socioeconomic Report | Summary of Socioeconomic Data P a g e | 10
Opportunities: Encourage politicians to eliminate overlapping government regulations, outdated
regulations, and discourage the implementation of new regulations. Increase high school
recruiting efforts at national level, and provide funding to bring back industrial arts program
Emerging Trends: Collaborative approaches for projects. Labor shortages. Offsite/modular
construction. Sustainable construction. Rising construction costs. Increased legal action and
prosecution for safety violations and incidents amid a building boom. Technology – use of
augmented reality and virtual reality.
Manufacturing (NAICS 31-33)
Description of Sector: The manufacturing sector comprises companies who make products from
materials, substances, and components. These companies include food manufacturing,
beverage and tobacco manufacturing, textile mills, wood product manufacturing, petroleum and
coal products manufacturing, and many others. Please see Appendix 3 for a comprehensive list
of NAICS of this sector.
Comparison to U.S. and Other States: As a percentage of GPD, Wyoming’s manufacturing
industry ranks 43rd in the nation. Manufacturing activities contributed 5.5% to Wyoming’s GDP
in 2016 compared to 11.7% for the US. If Wyoming can close that gap the 6% difference would
add $2 billion to the state’s GDP.
Workforce Observations: Wyoming’s manufacturing workforce is much smaller than that of
comparator states and has seen a decline between 2005 and 2016. The largest portion of
Wyoming’s workforce, 47.2%, is employed in businesses related to petroleum and coal products
manufacturing, chemical manufacturing, plastics and rubber products manufacturing, and
nonmetallic mineral product manufacturing. Nationwide, only 16.5% of manufacturing jobs fall
within these business categories. Wages within this sector pay less than the national average
but more than most surrounding states, including: Idaho, Montana, New Mexico, North Dakota,
South Dakota, and Utah
Enablers: No corporate income tax, no inventory tax, low electric and utility costs, low property
and sale taxes, lower than average workers compensation and unemployment insurance taxes,
less red tape and better government transparency, Manufacturing Works, Market Research
Center, Small Business Innovation Research Center BIR Phase 0 (SBIR), Wyoming Technology
Transfer Center.
Incentives: Sales tax exemption on equipment used in manufacturing, sales tax exemption on
electricity used in manufacturing processes, BRC – build/lease/purchase option, large loan fund,
challenge/bridge loan fund, workforce training funds.
Challenges: Lack of skilled workforce, availability of workforce, workforce housing, proximity to
markets, permitting process, lack of critical mass of employment sector.
Opportunities: Opportunities in this sector include value-added agriculture, value-added
minerals, and manufacturing machines and components. Workforce training funds, sales tax
exemptions on equipment and electricity used in manufacturing process, build/lease/purchase
option, large loan fund, challenge/bridge loan fund are important enablers to this sector in
Wyoming.

ENDOW Socioeconomic Report | Summary of Socioeconomic Data P a g e | 11
Emerging Trends: U.S. manufacturing production has increased while U.S. manufacturing jobs
have declined steadily for the past 30-40 years, owing to automation, trade, or other influences.
Despite the long-term trend in employment, manufacturing jobs have been increasing slightly
since 2010, and some are optimistic about the future of U.S. manufacturing, citing innovation,
and an emergence of consumers globally.
Wholesale Trade (NAICS 42)
Description of Sector: This sector comprises establishments engaged in wholesaling
merchandise, generally without transformation, and rendering services incidental to the sale of
merchandise. The merchandise described in this sector includes the outputs of agriculture,
mining, manufacturing, and certain information industries, such as publishing. Agriculture
implements; coffee wholesaling; commercial compost; fabrics; farm product raw material
merchant wholesalers; food and beverage equipment and supplies; food hub; food products;
grocers; machinery, equipment and supplies merchant wholesalers; meat products. Please see
Appendix 3 for a comprehensive list of NAICS of this sector.
Comparison to U.S. and Other States: Wyoming lags the U.S. average and surrounding states in
this industry. Activities in this sector contributed 4.3% to Wyoming’s GDP in 2016 compared to
6.1% for the US. Surrounding states Colorado, Idaho, Montana, South Dakota and Utah ranged
from 5.1% to 7.5%. In 2016, Wyoming ranked 44th nationally for wholesale trade; it would rank
21st nationally if we grow our GDP to 6.1%.
Workforce Observations: Wyoming wages within this sector pay better than the mean and
median for all occupations. In Wyoming, however, wages are less than the U.S. average, but pay
more than some surrounding states including Idaho, Montana, New Mexico and South Dakota.
Enablers: Low sales tax, Market Research Center, Small Business Development Centers, lower
than average workers compensation and unemployment insurance, less red tape and barriers to
entry (licensing, permitting, etc.)
Incentives: Challenge/Bridge Loan Program, Tradeshow Incentive Grants
Challenges: lack of market due to low population, extremely small rural trade areas, significant
leakage to out-of-state centers, Walmart effect (big-box retail squeezing out other retail),
Amazon effect (online sales eroding traditional retail), significant competition (tradition and web
presence), unskilled entry level workforce.
Opportunities: No response from industry
Emerging Trends: ·Rise in implementation and use of connected robotics allows companies to
gain efficiency and cut costs on the customer’s factory floor, in the warehouse, and elsewhere.
Wholesale distribution companies historically spent less time and effort in developing brand
awareness to let customers know why they should choose their company; that is changing in
favor of increased brand awareness efforts. Blockchain technology is allowing companies to
make and verify transactions on networks in near real time without a central point of control. E-
commerce is morphing into digital commerce, which is not only a transaction, but a way of
doing business. This includes branding, image, customer service and transactions. The amount
of data produced today is increasing exponentially, allowing companies to analyze it and garner
new insights about customers and themselves. Distributors have a twofold opportunity to
capitalize on the internet of things. This includes sensors within the business, such as
ENDOW Socioeconomic Report | Summary of Socioeconomic Data P a g e | 12
warehousing, transportation and equipment monitoring to improve operations. To reduce
warehouse space, goods can be produced inside a mobile hub near the end customer, speeding
delivery and always being in stock. While still in the early stages, drones and driverless vehicles
will allow companies to address driver shortages, increase safety, lower shipping costs, and
more. Drone technology has potential in many trades, but those focused on construction and
similar markets can use drones to provide aerial imagery, coupled with data analytics and 3D
modeling algorithms, can provide accurate measurements and material requirements.
Retail Trade (NAICS 44-45)
Description of Sector: Motor Vehicles, Furniture, Electronics, Building Materials, Food and
Beverage, Health and Personal Care, Clothing, Gasoline, General Merchandise. Please see
Appendix 3 for a comprehensive list of NAICS of this sector.
Comparison to U.S. and Other States: Wyoming retail (5.8 percent of state GDP) trails U.S. by
just .3 percent. Closing the gap could add $103M in revenue. Wyoming trails all neighbors
(aside from Colorado, at 5.6 percent) slightly. Outliers Utah, S. Dakota and Idaho rely much more
heavily on retail for revenue. Wyoming is ahead of the U.S. in many sectors of the Retail
Industry, however finds itself notably behind in Food and Beverage (8 percent vs. 14 percent)
Health and Personal Care (5.4 percent vs 10.5 percent) and Clothing (8.8 percent vs. 12.2
percent)
Workforce Observations: Wyoming lags the U.S. in annual wages in many retail sectors,
significantly in electronics and appliances (31.7K vs 45.4K), in the industry, Wyoming finds itself
in the middle of the pack amongst its neighbors, with Colorado as an outlier on the high end of
annual wages.
Enablers: Low sales tax, Market Research Center, Small Business Development Center, lower
than average workers compensation and unemployment insurance, less red tape and barriers to
entry (licensing, permitting, etc.), strong tourism market brings new money into economy.
Incentives: Main Street Program, Main Street Loan Program, Challenge/Bridge Loan Program
Challenges: lack of market due to low population, extremely small rural trade areas, significant
leakage to out-of-state centers, Walmart effect (big-box retail squeezing out other retail),
Amazon effect (online sales eroding traditional retail), retail industry has very low margins to
begin (1%-2%), lack of consolidated information for entrepreneurs, significant competition
(tradition and web presence), unskilled entry level workforce.
Opportunities: Retail support technology, augmented reality – try before you buy clothes,
games and more, AI – chat bots, virtual agents offer customer service and support interactions o
Robotic process automation for repetitive, rules-based, high-volume tasks, food and beverage,
health and personal care and clothing sectors of retail Industry.
Emerging Trends: ·Growth will primarily come from emerging global markets. Diminishing
importance of stand-alone brick and mortar stores represents both barrier and opportunity to
small retailers, Subscription-based services – groceries, prescriptions, etc. Customers now seek
personalized brand interactions and engagements – think geotagged coupons, social media-
tailored ads, etc.
ENDOW Socioeconomic Report | Summary of Socioeconomic Data P a g e | 13
Transportation and Warehousing (NAICS 48-49)
Description of Sector: 1,200 firms averaging 9-12 years depending and employing 9,500 people
primarily in truck transportation (39 percent) but also warehousing and storage (29 percent).
See Appendix 3 for a complete list of NAICS in this sector.
Comparison to U.S. and Other States: Transportation occupies more than twice the share of
Wyoming’s GDP as it does on a national level (6.2% v. 2.8%), and 150% to 300% more than
regional neighbors. The percentage of total employment, however is more in line with regional
neighbors and nearly identical to the U.S. share.
Workforce Observations: Wages in this sector generally lag national averages, but the difference
is particularly stark in air ($36K vs $84K) and pipeline ($94K vs $122K) transportation.
Enablers: Interstate 80, Interstate 90, Interstate 25, Wyoming highway quality and performance
consistently leads nation, less government red tape and more government transparency, gas tax
competitive with surrounding states, pervious success with Sierra Trading Post, Lowes’s, and
Walmart distribution centers, wages on par with entry level manufacturing jobs.
Incentives: BRC – Infrastructure Grants, WYDOT – minimum revenue guarantee grants,
workforce training grants.
Challenges: ongoing infrastructure maintenance costs, trucking and shipping costs higher in
rural areas, lack of rail served sites in some areas of Wyoming, lack of long term comprehensive
air service solution, lack of proximity to markets, generally favors Casper and Cheyenne, natural
resource jobs compete for workers, CapEx can be a barrier to entry. Consolidation has yielded
fewer and larger airlines, which often leaves rural airports behind. Low-cost and Ultra Low-Cost
carriers continue to nibble away at market share from the established carriers, shrinking the
difference between the three models. On the ground, Uber is expected to reach $42 billion in
revenue by 2025 through both geographical expansion and other markets that involve moving
something from A to B. Amazon has trained consumers to expect goods in hours, not days.
Automation.
Opportunities: Logistics as a service – companies able to provide software and analytics at
various points along the supply chain can improve customer service and maximize efficiency for
distributors. The consumer trend toward transparent order status means the industry is
investing in new tech and partnerships. As consumers purchase products through ever more
varied channels, new technology will be required to meet fulfillment and shipping challenges
Emerging Trends: Automation, Uber disruption, airline consolidation
Information (NAICS 51)
Description of Sector: The Information sector comprises companies that produce and distribute
information and cultural products, provide the means to distribute these products or other data
or communications, and process data. They include publishing industries, motion picture and
sound recording industries, broadcasting, telecommunications, and data processing, hosting,
and related services. See Appendix 3 for a complete list of NAICS in this sector.
Comparison to U.S. and Other States: This sector contributes less to Wyoming’s economy than
it does to comparator states’ and the US, representing 30.1% of Wyoming’s GDP, and 1.5% of
ENDOW Socioeconomic Report | Summary of Socioeconomic Data P a g e | 14
U.S. GDP. Wyoming can grow the economy by $1.3 billion over the next 20 years, by increasing
the 1.8% Wyoming GDP contribution to the 5.6% GDP contribution of the US.
Workforce Observations: Wages within this sector Wyoming wages in this sector are about half
of the wages in the sector for the US.
Enablers: No income taxes, Wyoming’s outdoor lifestyle and livability, reputation for data
centers (Microsoft, EchoStar, Ptolemy, Green House), low electricity rates, cool climate reduces
cooling costs, Breakthrough 307, Wyoming Technology Business Center.
Incentives: BRC- Managed Cost Data Center Grants, tradeshow incentive grants, challenge loan,
SBIC, workforce training grants
Challenges: lack of amenities to attract millennial talent, lack of skilled workforce, availability of
workforce, cost of housing in some areas of the state (Jackson, Laramie), broadband may be a
challenge in some parts of Wyoming, lack of long-term comprehensive air service solution,
proximity to markets, transmission capacity.
Opportunities: Opportunities for growth in this sector include data centers and
telecommunications. Data centers have been identified as an important opportunity and are a
large focus in this report. Assets from industries within this sector are enablers for other
sectors, and are also represented there. Expanding the footprint of this industry in Wyoming,
especially broadband, will enable growth in other sectors.
Emerging Trends: The prevalence of technology and digitization is driving innovation in the
publishing industry. The telecommunications industry is expected to grow, consolidate through
mergers and acquisitions, and continue to innovate. While data center square footage is
predicted to rise, the number of data centers is also expected to peak in 2017.
Finance, Insurance and Real Estate (NAICS 52-53)
Description of Sector: Leasing; monetary authorities – central bank; credit intermediation;
securities, commodity contracts, investments; insurance carriers and related activities; funds,
trusts and other financial vehicles; real estate; rental and leasing services and lessors of
nonfinancial intangible assets. See Appendix 3 for a complete list of NAICS in this sector.
Comparison to U.S. and Other States: Wyoming general ranks behind the U.S. and other
surrounding states in this industry. Financial activities contributed 13.9% to Wyoming’s GDP in
2016 compared to 19.8% for the US. If Wyoming can close that gap the 6% difference would add
$2 billion to the State’s GDP.
Workforce Observations: Wages within this sector general pay above the mean and median for
all occupations. In Wyoming, however, wages are on the lower end as compared to surrounding
states.
Enablers: No corporate or personal income tax, law are favorable for trust industry.
Incentives: Challenge Loan Program, USDA, SBA loan programs
Challenges: Significant barriers to entry (legal, regulatory, etc.) for startups, real estate
development costs are higher in rural areas, heavily focused in two areas of the state (Jackson
and Cheyenne).
ENDOW Socioeconomic Report | Summary of Socioeconomic Data P a g e | 15
Opportunities: Industry consolidation, family trusts
Emerging Trends: · Deregulation will allow financial institutions to invest more in customers and
less on risk mitigation, asset management, technology will change the fundamentals of the
traditional jobs in this industry, most ventures will require larger partners.
Professional and Business Services (NAICS 54-56)
Description of Sector: The Professional and Business Services Sector (sometimes called the
knowledge sector) comprises companies that perform professional, technical, scientific,
administrative, and managerial services for other businesses or entities. These often require a
high degree of expertise and training. Companies in this sector perform services such as
engineering, research and development, accounting, architecture, legal services, design,
computer systems design, advertising, management of companies or enterprises, and
administrative and support services. See Appendix 1 for a comprehensive list of NAICS codes in
this sector. See Appendix 3 for a complete list of NAICS in this sector.
Comparison to U.S. and Other States: There is tremendous opportunity for growth in this
sector, as it contributes significantly less to Wyoming’s economy than it does to other states and
the US. It makes up 4.5% of Wyoming’s GDP. Over the next 20 years, Wyoming can grow its
economy by $2.7 billion by increasing the Professional and Business Services 4.5% contribution
to the Wyoming GDP to the U.S. contribution of 12.8%.
Workforce Observations: Wages within this sector pay above the mean and median for all
occupations. However, Wyoming wages in this sector are low compared to most comparator
states.
Enablers: No income taxes, Wyoming’s outdoor lifestyle and livability, Breakthrough 307,
Wyoming Technology Business Center
Incentives: Main Street Technical Assistance Grants, BRC – Business Committed Grants, BRC-
Community Enhancement Grants, Challenge Loan, Workforce Training Grants.
Challenges: lack of amenities to attract millennial talent, lack of skilled workforce, availability of
workforce, cost of housing in some areas of the state (Jackson, Laramie), broadband may be a
challenge in some parts of Wyoming, lack of long-term comprehensive air service solution.
Opportunities: Opportunities in this sector include growing Professional and Business services
that are traditionally performed out of state, and leveraging Wyoming’s robust natural resource
base (e.g. minerals, oil and gas, agriculture) to drive growth in research and development, tech
companies, and other professional and business services entities.
Emerging Trends: Automation, continued innovation in models (e.g. “Uberization”), and
increased funding for research and development are some emerging trends within this sector.
Education and Health Care Services (NAICS 62)
Description of Sector: The Education and Health Services sector comprises companies and
entities that provide healthcare, social assistance, instruction, or training. This includes
physicians’ offices, hospitals, dentists, home health services, residential care facilities, public and
private schools, universities and colleges, day cares, and other entities. See Appendix 3 for a
comprehensive list of NAICS in this sector.
ENDOW Socioeconomic Report | Summary of Socioeconomic Data P a g e | 16
Comparison to US and other states: This sector contributes less to Wyoming’s economy than it
does to comparator states’ and the US. Wyoming can grow their economy by $1.37 billion over
the next 20 years, by increasing the 4.5% Wyoming GDP contribution to the 8.5% U.S. GDP
contribution.
Workforce Observations: Wyoming wages in this sector are near the average of comparator
states
Enablers: No corporate and personal income taxes, Wyoming’s outdoor lifestyle and livability,
Community College training programs.
Incentives: BRC – Business Committed Grants, Community Enhancement Grants, Community
Readiness Grants, Challenge Loan, Workforce Training Grants.
Challenges: challenged funding environment for UW and Wyoming schools due to recent drop in
commodity production, lack of fast, cost-competitive broadband, and challenged recruitment
and retention of workforce, especially physicians. This recruitment and retention is enabled by
livability and amenities.
Opportunities: Opportunities in this sector include healthcare, especially telehealth.
Emerging Trends: For-profit higher education institutes are focused on areas where there are
skills gaps, including middle skills jobs. Healthcare is innovating in many areas, including
business and financial models, care delivery, and predictive analytics.
Leisure and Hospitality NAICS (71-72)
Description of Sector: Restaurants, tourism, coffee shops, bed and breakfasts, hunting/fishing,
accommodation/food services, arts/entertainment/recreation, bakeries, outfitting, outdoor
recreation, candy shops, visual arts, performing arts, music, gaming, roasteries, wineries,
distilleries, craft brewing and agro-tourism.
Comparison to U.S. and Other States: Wyoming is on par with the U.S. average for this
industry. This is comparable with many surrounding states, but lags Colorado, New Mexico and
Utah. Activities from this sector contributed 3.7% to Wyoming’s GDP in 2016 compared to 3.9%
for the US. If Wyoming were at the U.S. average, it would add $69 million to the state’s GDP.
Workforce Observations: Wages within this sector pay below the mean and median for all
occupations. In Wyoming, however, wages are less than the U.S. average, but pay more than
some surrounding states including Idaho, Montana, New Mexico, North Dakota, South Dakota
and Utah.
Enablers: Low sales tax, Wyoming Arts Council, Wyoming Humanities Council, Strong tourism
market, outdoor lifestyle and livability, recreation attractions, Wyoming Women’s Business
Center, Wyoming Restaurant and Lodging Association.
Incentives: BRC – Community Enhancement Grants, Challenge Loan, Wyoming Women’s
Business Center -Microloan Program, Wyoming Arts Council grants, Wyoming Humanities
Council Grants, Main Street Program, Main Street Technical Assistance grants.
Challenges: Stable and consistent access to big game hunting licenses, lack of available and
sustainable air service, lack of available workforce, uncertain future of land use and access at
federal level.
ENDOW Socioeconomic Report | Summary of Socioeconomic Data P a g e | 17
Opportunities: Tourism; art; new potential wolf and grizzly hunting markets; take advantage of
Wyoming resources including lots of animals, open spaces and quality outfitting industry; ensure
a system of stable licensing.
Emerging Trends: Incoming young workforce in need of opportunities, Gaming industry
attempts to broaden and enter new markets, expanding on E-Casinos, sports gaming and
underutilized opportunities, Many aspects of the outdoor recreation industry are growing
because of changing technology and an increased desire for personalized experience, Because of
regular exposure to brands such as amazon and Starbucks, consumers have expectations of
instant, responsive, mobile and seamless travel experiences, Health, safety, social impact,
experience and transparency have become new drivers of the food service industry.
Other Services (NAICS 81)
Description of Sector: The Other Services sector comprises establishments engaged in providing
services not specifically provided for elsewhere in the classification system. Establishments in
this sector are primarily engaged in activities, such as equipment and machinery repairing,
promoting or administering religious activities, grantmaking, advocacy, and providing dry
cleaning and laundry services, personal care services, death care services, pet care services,
photofinishing services, temporary parking services, and dating services.
Private households that engage in employing workers on or about the premises in activities primarily concerned with the operation of the household are included in this sector.
Comparison to U.S. and Other States: Wyoming is on par with the U.S. average for this industry. This is comparable with many surrounding states and the US. Activities from this sector contributed 1.5% to Wyoming’s GDP in 2016 compared to 2.1% for the US.
Workforce Observations: In Wyoming wages are less than the U.S. average, but pay more than
some surrounding states including Idaho, Montana, New Mexico, North Dakota, South Dakota
and Utah. In 2016, it is estimated that 7,288 worked in this sector earning an average annual
wage of $34,505.
Emerging Trends: Of the 2,952 registered charitable nonprofits in Wyoming, 2,336 (79%) are
comprised of small, community-based organizations, for example: adult and youth sports
organizations, community theatres, small museums, 4-H clubs and library foundations. All have
budgets under $100,000 and most of them rely heavily on volunteers. Many start-up nonprofits
fall into this category as well. Note: 1,878 of the public charities are non-reporting and therefore
have been included in this 79% due to their annual receipts being less than $50,000.
The remaining 616 charitable nonprofits address more complex community needs. There are
465 nonprofits (16%) with budgets between $100,000 and $999,000. Examples of organizations
in this budget range include food pantries, animal rescues, rural-based senior centers, and child
advocacy organizations. There are 151 nonprofits (5%) with budgets over $1 million. Examples in
this group include hospitals, mental health centers, youth and recreation centers, child
development centers and community foundations.
Public Administration (NAICS 92)
Description of Sector: The Public Administration sector consists of establishments of federal,
state, and local government agencies that administer, oversee, and manage public programs
ENDOW Socioeconomic Report | Summary of Socioeconomic Data P a g e | 18
and have executive, legislative, or judicial authority over other institutions within a given area.
These agencies also set policy, create laws, adjudicate civil and criminal legal cases, provide for
public safety and for national defense. In general, government establishments in the Public
Administration sector oversee governmental programs and activities that are not performed by
private establishments. In addition to state, county, local governments, the K-12 public school
systems/districts, community colleges, university are in this category along with federal agencies
and military entities.
Comparison to U.S. and Other States: Wyoming’s sparse and rural population and multiple
counties, cities, towns and school districts coupled with state executive, justice and legislative
systems, federal agencies, and military bases and camps, provides a high sector share to the
state’s GDP make-up. Only Alaska and New Mexico of the comparator states exceed Wyoming’s
GDP percentage. Activities from this sector contributed 15.6% to Wyoming’s GDP in 2016
compared to 12% for the US.
Workforce Observations: In Wyoming, wages are less than the U.S. average, but pay more than
some surrounding states including Idaho, Montana, New Mexico, North Dakota, South Dakota
and Utah.
Emerging Trends: Declining local and state revenues have consequently reduced employment
and service levels throughout the state.

ENDOW Socioeconomic Report | Assessment of Demographic Trends in Wyoming P a g e | 19
Assessment of Demographic Trends in Wyoming Introduction Population change is a function of three
processes: births, deaths, and migration
either, into (in-migration) or out of a
population (out-migration), collectively
referred to as the demographic process.
It is of vital importance to study the
sources of population change because
the determinants of the processes of
natural increase (combined effects of
births and deaths) and migration are
quite different. Both births and deaths
are physiological and biological
processes. Migration, however, is a
behavior involving people moving from
one area to another often because of
employment, income, and other socioeconomic changes.
Although births and deaths influence a state’s population by increasing or decreasing its size, their effects
on other non-demographic and socioeconomic factors are considerably more long-term. Migration, on
the other hand, has an immediate impact on an area because it is likely to involve young adults in their
family formation ages. Migration results in a near simultaneous change in demand for goods and services.
Migration Trends Wyoming’s migration (either inflow or outflow) history has been predominately driven by employment
opportunities in the state and economic
conditions in the rest of the country.
Wyoming’s total population experienced a
dramatic increase of nearly 180,000 (or
54%) from 1970 to 1983 as oil production
was booming. This rapid growth was
immediately followed by a decline of
57,700 people (or 11%) during the last
seven years in 1980s, as oil prices dropped
by 70 percent in constant dollars. The first
few years of the 1990s brought steady
growth as the national economy,
particularly California, contracted,
however, strong national expansion in the
rest of the 1990s played a major role for the
negative net migration flow, more people left than moved into Wyoming. By the end of the decade
Wyoming experienced 8.9 percent growth compared to the U.S. average of 13.2 percent. The booming
natural gas exploration during the first decade of the new century drew many younger workers into the
state, particularly between 2006 and 2009. Total population in Wyoming grew 14.1 percent from 2000 to
2010, faster than the U.S. average of 9.7 percent. However, since 2013 the state has experienced three
-30,000
-25,000
-20,000
-15,000
-10,000
-5,000
0
5,000
10,000
15,000
20,000
25,000
325,000
350,000
375,000
400,000
425,000
450,000
475,000
500,000
525,000
550,000
575,000
600,000
Ne
t Mig
ratio
nPo
pu
lati
on
* Net Migration = In-migration - Outmigration
Wyoming Population and Net Migration: 1970 to 2016
Net Migration* Population Natural Incease (R)
Source: U.S. Census Bureau Prepared by WyomingEconomic Analysis Division
0
1,000
2,000
3,000
4,000
5,000
6,000
7,000
8,000
9,000
10,000
11,000
12,000
Source: Wyoming Department of Health
Number of Births and Deaths in Wyoming: 1970 to 2016
Births Deaths
ENDOW Socioeconomic Report | Assessment of Demographic Trends in Wyoming P a g e | 20
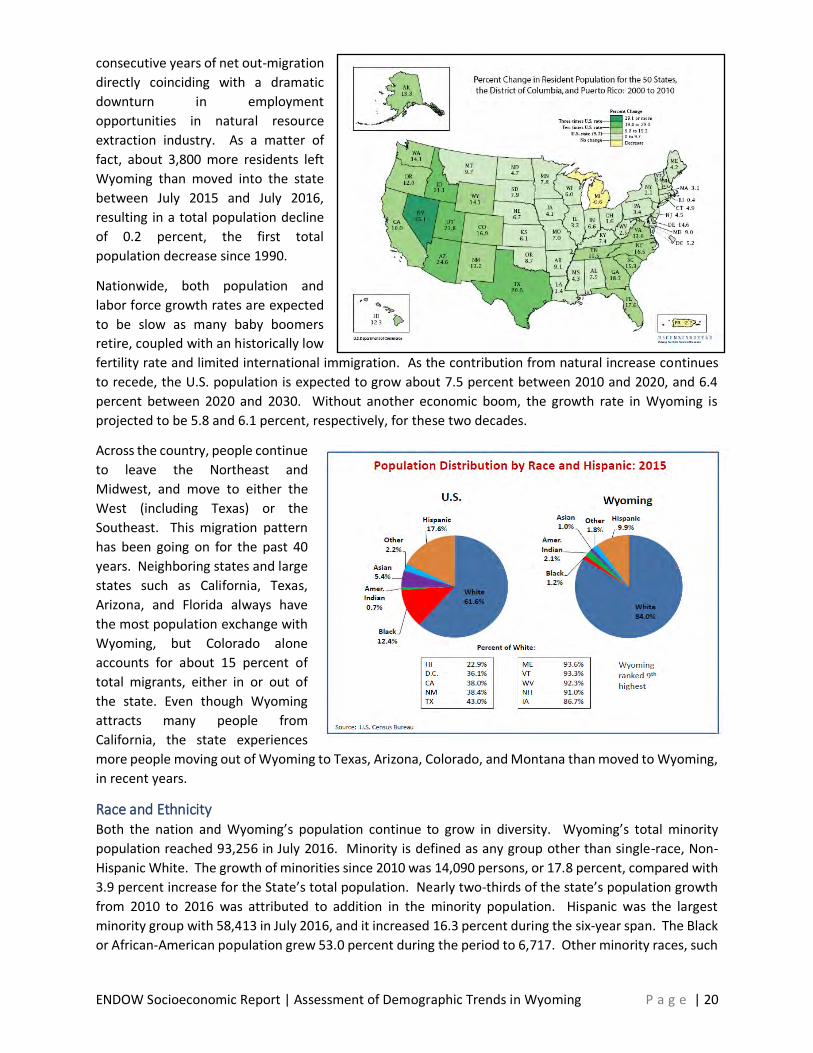
consecutive years of net out-migration
directly coinciding with a dramatic
downturn in employment
opportunities in natural resource
extraction industry. As a matter of
fact, about 3,800 more residents left
Wyoming than moved into the state
between July 2015 and July 2016,
resulting in a total population decline
of 0.2 percent, the first total
population decrease since 1990.
Nationwide, both population and
labor force growth rates are expected
to be slow as many baby boomers
retire, coupled with an historically low
fertility rate and limited international immigration. As the contribution from natural increase continues
to recede, the U.S. population is expected to grow about 7.5 percent between 2010 and 2020, and 6.4
percent between 2020 and 2030. Without another economic boom, the growth rate in Wyoming is
projected to be 5.8 and 6.1 percent, respectively, for these two decades.
Across the country, people continue
to leave the Northeast and
Midwest, and move to either the
West (including Texas) or the
Southeast. This migration pattern
has been going on for the past 40
years. Neighboring states and large
states such as California, Texas,
Arizona, and Florida always have
the most population exchange with
Wyoming, but Colorado alone
accounts for about 15 percent of
total migrants, either in or out of
the state. Even though Wyoming
attracts many people from
California, the state experiences
more people moving out of Wyoming to Texas, Arizona, Colorado, and Montana than moved to Wyoming,
in recent years.
Race and Ethnicity Both the nation and Wyoming’s population continue to grow in diversity. Wyoming’s total minority
population reached 93,256 in July 2016. Minority is defined as any group other than single-race, Non-
Hispanic White. The growth of minorities since 2010 was 14,090 persons, or 17.8 percent, compared with
3.9 percent increase for the State’s total population. Nearly two-thirds of the state’s population growth
from 2010 to 2016 was attributed to addition in the minority population. Hispanic was the largest
minority group with 58,413 in July 2016, and it increased 16.3 percent during the six-year span. The Black
or African-American population grew 53.0 percent during the period to 6,717. Other minority races, such
ENDOW Socioeconomic Report | Assessment of Demographic Trends in Wyoming P a g e | 21
as Asian and Pacific Islanders, and two-or-more races also recorded 23.6 percent or higher growth rate,
while the majority, Non-Hispanic White, increased only 1.6 percent. With 15.9 percent of the State’s total
population, the proportion of minorities in Wyoming was still ranked the 9th lowest in the nation, while
38.7 percent of U.S. residents are minorities. 2017 is expected to be the first year that the total white
population in the nation shows a decline, while the proportion of non-white in the U.S. is now expected
to reach 50 percent in less than 30 years.
Aging Population The age composition of a population
affects many other characteristics,
from fertility rates to the nature of
the goods and services demanded.
The size and structure of the older
population is important to public
and private interests, both socially
and economically, and is used to
calculate the dependency ratio. The
aging of population means that the
proportion of the population in the
older ages increases. The whole
globe is undergoing a major
demographic transformation. Over
the next several decades, the
combined effects of increased life
expectancy and lower fertility rates are leading to slower population growth and significant population
aging across the world. Many developed countries, such as Japan and some European countries, are
already far along in this transition. They are experiencing more rapid population aging than the U.S. The
percentage of population 65 years and over is already over 20 percent in those countries, while it may
take just over 10 more years to get there for U.S. The main factor is the international immigration
resulting from evolving economic conditions in the country because immigrants are much younger than
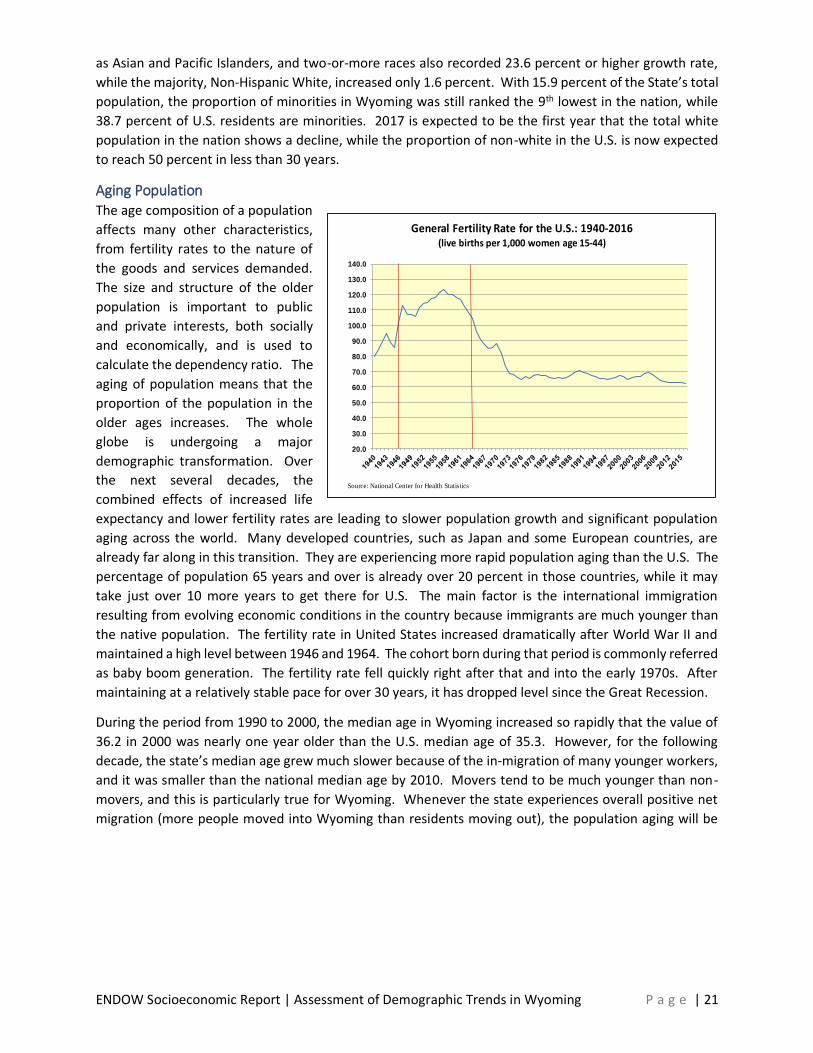
the native population. The fertility rate in United States increased dramatically after World War II and
maintained a high level between 1946 and 1964. The cohort born during that period is commonly referred
as baby boom generation. The fertility rate fell quickly right after that and into the early 1970s. After
maintaining at a relatively stable pace for over 30 years, it has dropped level since the Great Recession.
During the period from 1990 to 2000, the median age in Wyoming increased so rapidly that the value of
36.2 in 2000 was nearly one year older than the U.S. median age of 35.3. However, for the following
decade, the state’s median age grew much slower because of the in-migration of many younger workers,
and it was smaller than the national median age by 2010. Movers tend to be much younger than non-
movers, and this is particularly true for Wyoming. Whenever the state experiences overall positive net
migration (more people moved into Wyoming than residents moving out), the population aging will be
20.0
30.0
40.0
50.0
60.0
70.0
80.0
90.0
100.0
110.0
120.0
130.0
140.0
Source: National Center for Health Statistics
General Fertility Rate for the U.S.: 1940-2016(live births per 1,000 women age 15-44)
ENDOW Socioeconomic Report | Assessment of Demographic Trends in Wyoming P a g e | 22
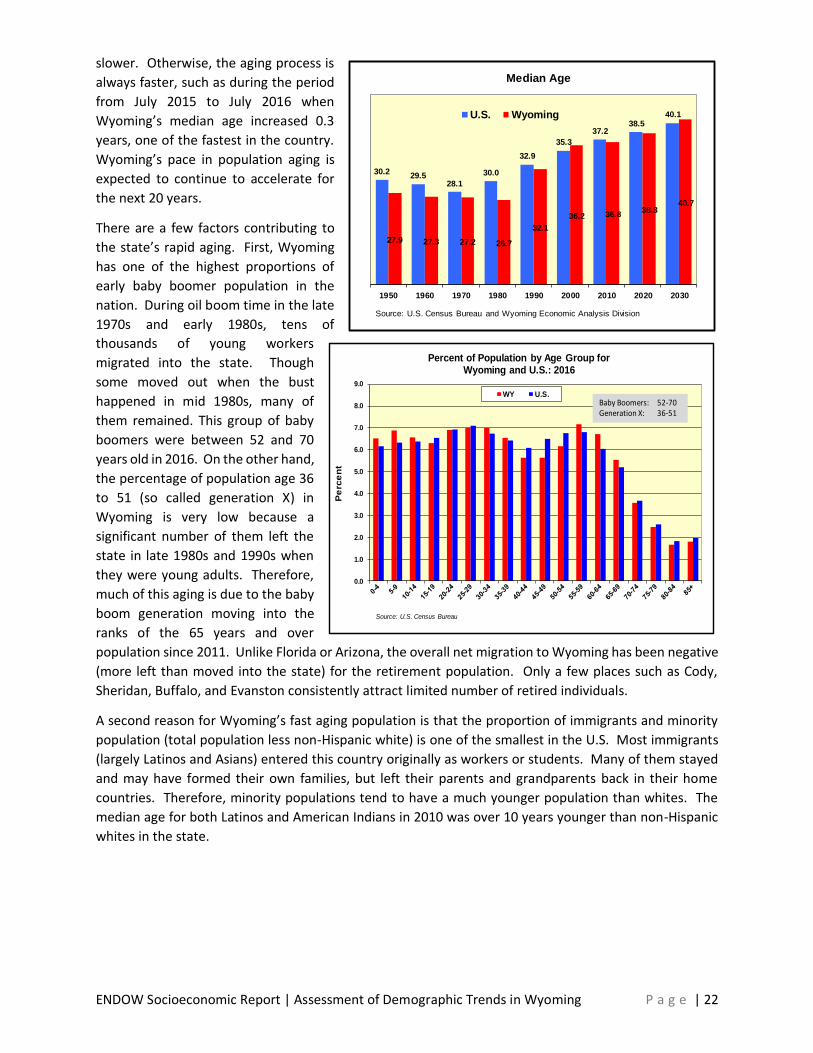
slower. Otherwise, the aging process is
always faster, such as during the period
from July 2015 to July 2016 when
Wyoming’s median age increased 0.3
years, one of the fastest in the country.
Wyoming’s pace in population aging is
expected to continue to accelerate for
the next 20 years.
There are a few factors contributing to
the state’s rapid aging. First, Wyoming
has one of the highest proportions of
early baby boomer population in the
nation. During oil boom time in the late
1970s and early 1980s, tens of
thousands of young workers
migrated into the state. Though
some moved out when the bust
happened in mid 1980s, many of
them remained. This group of baby
boomers were between 52 and 70
years old in 2016. On the other hand,
the percentage of population age 36
to 51 (so called generation X) in
Wyoming is very low because a
significant number of them left the
state in late 1980s and 1990s when
they were young adults. Therefore,
much of this aging is due to the baby
boom generation moving into the
ranks of the 65 years and over
population since 2011. Unlike Florida or Arizona, the overall net migration to Wyoming has been negative
(more left than moved into the state) for the retirement population. Only a few places such as Cody,
Sheridan, Buffalo, and Evanston consistently attract limited number of retired individuals.
A second reason for Wyoming’s fast aging population is that the proportion of immigrants and minority
population (total population less non-Hispanic white) is one of the smallest in the U.S. Most immigrants
(largely Latinos and Asians) entered this country originally as workers or students. Many of them stayed
and may have formed their own families, but left their parents and grandparents back in their home
countries. Therefore, minority populations tend to have a much younger population than whites. The
median age for both Latinos and American Indians in 2010 was over 10 years younger than non-Hispanic
whites in the state.
30.229.5
28.1
30.0
32.9
35.3
37.238.5
40.1
27.9 27.3 27.2 26.7
32.1
36.2 36.838.3
40.7
1950 1960 1970 1980 1990 2000 2010 2020 2030
Source: U.S. Census Bureau and Wyoming Economic Analysis Division
Median Age
U.S. Wyoming
0.0
1.0
2.0
3.0
4.0
5.0
6.0
7.0
8.0
9.0
Pe
rce
nt
Source: U.S. Census Bureau
Percent of Population by Age Group forWyoming and U.S.: 2016
WY U.S.Baby Boomers: 52-70Generation X: 36-51
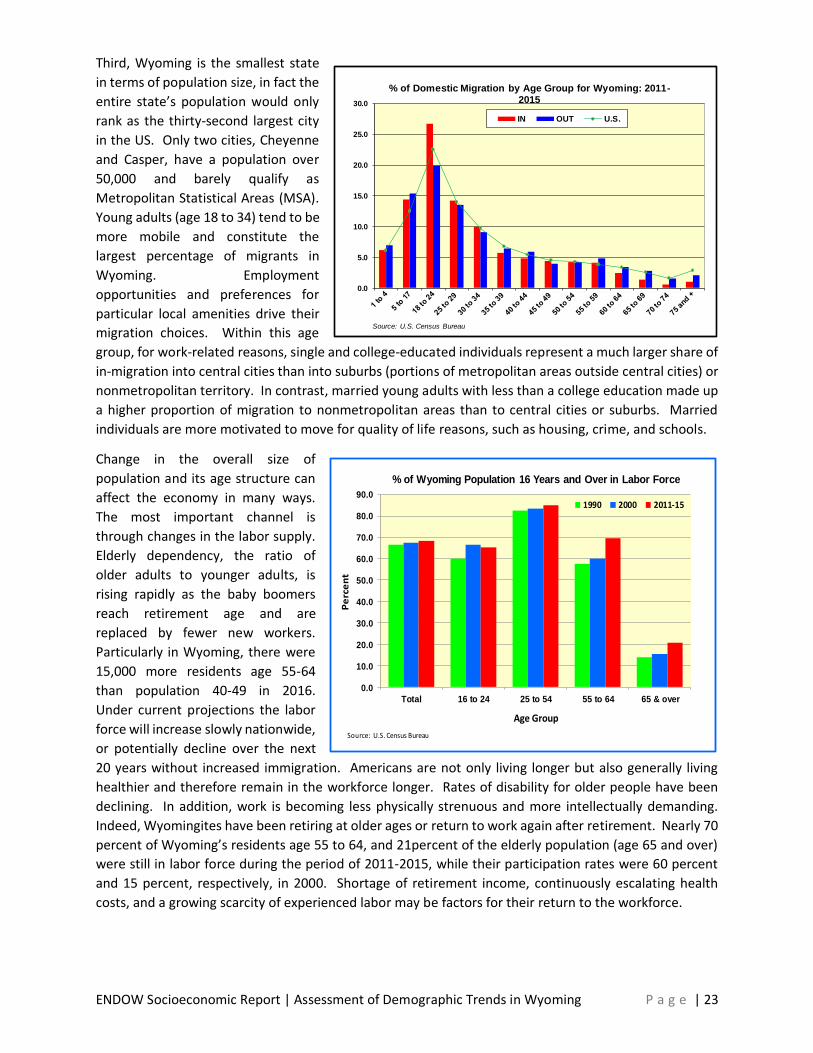
ENDOW Socioeconomic Report | Assessment of Demographic Trends in Wyoming P a g e | 23
Third, Wyoming is the smallest state
in terms of population size, in fact the
entire state’s population would only
rank as the thirty-second largest city
in the US. Only two cities, Cheyenne
and Casper, have a population over
50,000 and barely qualify as
Metropolitan Statistical Areas (MSA).
Young adults (age 18 to 34) tend to be
more mobile and constitute the
largest percentage of migrants in
Wyoming. Employment
opportunities and preferences for
particular local amenities drive their
migration choices. Within this age
group, for work-related reasons, single and college-educated individuals represent a much larger share of
in-migration into central cities than into suburbs (portions of metropolitan areas outside central cities) or
nonmetropolitan territory. In contrast, married young adults with less than a college education made up
a higher proportion of migration to nonmetropolitan areas than to central cities or suburbs. Married
individuals are more motivated to move for quality of life reasons, such as housing, crime, and schools.
Change in the overall size of
population and its age structure can
affect the economy in many ways.
The most important channel is
through changes in the labor supply.
Elderly dependency, the ratio of
older adults to younger adults, is
rising rapidly as the baby boomers
reach retirement age and are
replaced by fewer new workers.
Particularly in Wyoming, there were
15,000 more residents age 55-64
than population 40-49 in 2016.
Under current projections the labor
force will increase slowly nationwide,
or potentially decline over the next
20 years without increased immigration. Americans are not only living longer but also generally living
healthier and therefore remain in the workforce longer. Rates of disability for older people have been
declining. In addition, work is becoming less physically strenuous and more intellectually demanding.
Indeed, Wyomingites have been retiring at older ages or return to work again after retirement. Nearly 70
percent of Wyoming’s residents age 55 to 64, and 21percent of the elderly population (age 65 and over)
were still in labor force during the period of 2011-2015, while their participation rates were 60 percent
and 15 percent, respectively, in 2000. Shortage of retirement income, continuously escalating health
costs, and a growing scarcity of experienced labor may be factors for their return to the workforce.
0.0
10.0
20.0
30.0
40.0
50.0
60.0
70.0
80.0
90.0
Total 16 to 24 25 to 54 55 to 64 65 & over
Pe
rce
nt
Age Group
% of Wyoming Population 16 Years and Over in Labor Force
1990 2000 2011-15
Source: U.S. Census Bureau
0.0
5.0
10.0
15.0
20.0
25.0
30.0
Source: U.S. Census Bureau
% of Domestic Migration by Age Group for Wyoming: 2011-2015
IN OUT U.S.
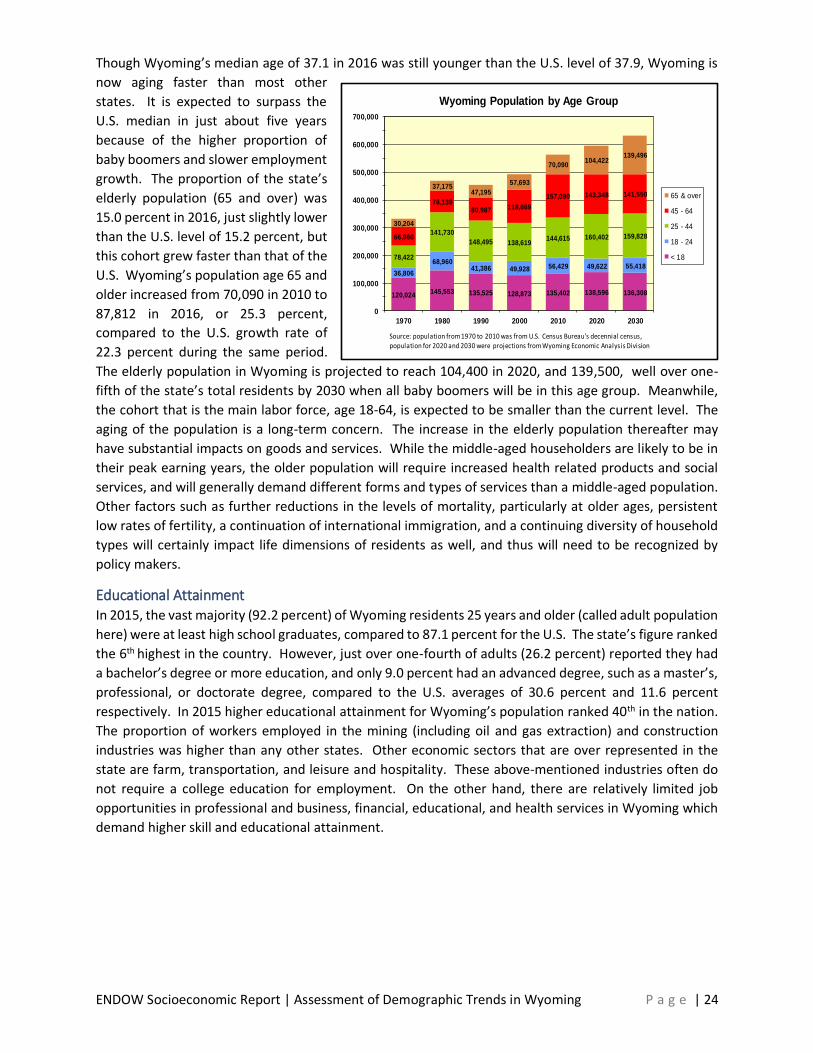
ENDOW Socioeconomic Report | Assessment of Demographic Trends in Wyoming P a g e | 24
Though Wyoming’s median age of 37.1 in 2016 was still younger than the U.S. level of 37.9, Wyoming is
now aging faster than most other
states. It is expected to surpass the
U.S. median in just about five years
because of the higher proportion of
baby boomers and slower employment
growth. The proportion of the state’s
elderly population (65 and over) was
15.0 percent in 2016, just slightly lower
than the U.S. level of 15.2 percent, but
this cohort grew faster than that of the
U.S. Wyoming’s population age 65 and
older increased from 70,090 in 2010 to
87,812 in 2016, or 25.3 percent,
compared to the U.S. growth rate of
22.3 percent during the same period.
The elderly population in Wyoming is projected to reach 104,400 in 2020, and 139,500, well over one-
fifth of the state’s total residents by 2030 when all baby boomers will be in this age group. Meanwhile,
the cohort that is the main labor force, age 18-64, is expected to be smaller than the current level. The
aging of the population is a long-term concern. The increase in the elderly population thereafter may
have substantial impacts on goods and services. While the middle-aged householders are likely to be in
their peak earning years, the older population will require increased health related products and social
services, and will generally demand different forms and types of services than a middle-aged population.
Other factors such as further reductions in the levels of mortality, particularly at older ages, persistent
low rates of fertility, a continuation of international immigration, and a continuing diversity of household
types will certainly impact life dimensions of residents as well, and thus will need to be recognized by
policy makers.
Educational Attainment In 2015, the vast majority (92.2 percent) of Wyoming residents 25 years and older (called adult population
here) were at least high school graduates, compared to 87.1 percent for the U.S. The state’s figure ranked
the 6th highest in the country. However, just over one-fourth of adults (26.2 percent) reported they had
a bachelor’s degree or more education, and only 9.0 percent had an advanced degree, such as a master’s,
professional, or doctorate degree, compared to the U.S. averages of 30.6 percent and 11.6 percent
respectively. In 2015 higher educational attainment for Wyoming’s population ranked 40th in the nation.
The proportion of workers employed in the mining (including oil and gas extraction) and construction
industries was higher than any other states. Other economic sectors that are over represented in the
state are farm, transportation, and leisure and hospitality. These above-mentioned industries often do
not require a college education for employment. On the other hand, there are relatively limited job
opportunities in professional and business, financial, educational, and health services in Wyoming which
demand higher skill and educational attainment.
120,024145,553 135,525 128,873 135,402 138,596 136,308
36,806
68,96041,386 49,928 56,429 49,622 55,418
78,422
141,730
148,495 138,619144,615 160,402 159,82866,960
76,13980,987 118,669
157,090 143,348 141,550
30,204
37,17547,195
57,693
70,090104,422
139,496
0
100,000
200,000
300,000
400,000
500,000
600,000
700,000
1970 1980 1990 2000 2010 2020 2030
Wyoming Population by Age Group
65 & over
45 - 64
25 - 44
18 - 24
< 18
Source: population from 1970 to 2010 was from U.S. Census Bureau's decennial census, population for 2020 and 2030 were projections from Wyoming Economic Analysis Division

ENDOW Socioeconomic Report | Assessment of Demographic Trends in Wyoming P a g e | 25
Other Facts on Wyoming’s Population (U.S. Census Bureau, 2015 American Community Survey)
Wyoming U.S. Wyoming’s
Rank in the U.S.
Persons Per Square Mile 6.0 91.3 50
Percent of Native Population Born in State of Residence 42.1 67.7 49
Percent of People with a Disability 12.4 12.6 29
Percent of Civilian Population 18 Years and Over Who are Veterans
10.2 7.6 4
Percent of People Who Lived in a Different House in the Past Year
17.5 14.1 8
Percent of People Who Lived in a Different State in the Past Year
6.2 2.4 2
Percent of Household that are Married-Couple Families 51.2 48.0 5
Percent of People Without Health Insurance Coverage 11.5 9.4 10
Percent of Households That Receive Food Stamps/SNAP 4.7 12.8 51
Percent of People Below Poverty Level 11.1 14.7 42
Median Household Income $60,214 $55,775 18
Median Earnings for Male Full Time, Year-Round Workers $55,965 $49,938 8
Median Earnings for Female Full Time, Year-Round Workers $36,064 $39,940 34
Median Housing Value of Owner-Occupied Units $212,500 $194,500 20
Median Monthly Housing Costs for Renter-Occupied Units $815 $959 29
Percent of People 16 to 64 Years Who are in the Labor Force 78.1 73.6 8
Mean Travel Time to Work of Workers Not Working at Home - min
19.0 26.4 45
Summary 1. Nationwide, as low fertility rates continue to persist and baby boomers age, the growth of both
population and labor force is expected to be slow for the next 14 years. The average year-over-
year growth rate for the state is expected to be about 0.5 percent during the period, comparing
to 1.1 percent experienced so far since 2010.
2. Both the U.S. and Wyoming are experiencing considerable growth in older populations.
Wyoming’s total population declined about 1,000, or 0.2 percent between July 2015 and July
2016, but the population 65 and over grew 3.8 percent or 3,140 during the same period, and is
now nearly 88,000. The average annual growth rate for this older population is projected to be
3.3 percent from 2016 to 2030. The total number of residents 65 and over will reach 139,500 by
2030 when all baby boomers will be in this cohort, accounting for 22.0 percent of total population
in Wyoming. The rapid growth of elderly population will present challenges to policy makers and
programs such as Social Security, Medicare and Medicaid. It will also affect families, businesses,
and health care providers.
ENDOW Socioeconomic Report | Assessment of Demographic Trends in Wyoming P a g e | 26
3. Both the nation and Wyoming’s population continue to grow in diversity. Wyoming’s total
minority population reached 93,256 in July 2016. Minority is defined as any group other than
single-race, Non-Hispanic White. The growth of minorities since 2010 was 14,090 persons, or 17.8
percent growth increase, compared with 3.9 percent increase for the state’s 2016 total
population. Nearly two-thirds of the state’s population growth from 2010 to 2016 was attributed
to the minority population. Future population increases for the U.S. will be from racial and ethnic
groups rather than the Non-Hispanic White.
4. Traditionally a rapid drop in a state’s unemployment rate is attributed to economic expansion
including strong employment growth. However, that is not the case in Wyoming since 2016. In
fact, the unemployment rate in the state has been steadily dropping since May 2016, and the
3.9% in June 2017 was the lowest value since November of 2009, pre-Great Recession. However,
the employment for June 2017 was still about 1% below employments levels one year ago.
Wyoming’s labor force continues to drop, and is estimated to be thousands less compared to last
year. Possible explanations for these phenomena are: 1) some baby boomers (age 53 to 71 in
2017) left the labor force by retiring in the state or out of the state, and 2) younger people
continue to move to other states because of the robust nationwide labor market, particularly in
Wyoming’s neighboring states. Additionally, Texas, Arizona, Oregon, and Washington are all
experiencing strong job growth. For example, Wyoming’s number one competitor (in terms of
labor force), Colorado, had the lowest unemployment rate (2.3%) while Utah had the fastest
employment growth (3.0%) in the country for June 2017. If the U.S. economic expansion (already
one of the longest in history) continues, Wyoming’s labor market will remain tight.
ENDOW Socioeconomic Report | Examination of State and Local Fiscal Sustainability P a g e | 27
Examination of State and Local Fiscal Sustainability Historically, 70 percent of revenue collected by the state of Wyoming comes from the energy mineral
industry and therefore the condition of state coffers depends directly on the market value of
commodities that are traded on a national and international basis. As a result, Wyoming’s main revenue
streams generally move in the same direction and at the same velocity. When times are good in the
minerals’ industry, revenue across the board is up, but when times are bad, the opposite occurs.
This reality was never more evident than the flow of state revenue over the past twenty years.
Improved drilling technology and gathering systems for natural gas extraction in western Wyoming
brought significant capital investment to the state and seemingly overnight expansive natural gas fields
were developed. At roughly the same time, coal bed methane in the Powder River Basin and coal
production were increasing at a rapid clip. Energy development created tremendous wealth not just for
the landowners and energy companies but for state and local governments as well. The state and local
budgets grew as demands for public services expanded. At the state level, policy makers experienced
multiple short-term drops in revenue between 2009 and 2016 reinforcing the reality that markets would
eventually falter. When the crash came, starting in the fall of 2015 and continuing through the spring of
2016, revenue streams began drying up. In the end, Wyoming state coffers had experienced a 32% drop
in revenue between state fiscal year (FY) 2015 and state FY 2016.
At the May 11, 2017 meeting, the ENDOW Executive Council adopted as a working definition for fiscal
sustainability the following: “a government’s ability and willingness to generate inflows of resources
necessary to honor current service commitments and to meet financial obligations as they come due,
without transferring financial obligations to future periods that do not result in commensurate
benefits.”
For state agencies, Wyoming uses a biennial standard/base budget (also referred to as an incremental
budget) method, defines the “standard budget” as a budget enabling an entity to continue to furnish the
same level of services during the ensuing biennium, and reflects the revenue or appropriation necessary
to provide the services. The standard budget includes all personnel approved in the preceding biennial
budget, a support services and the amount of revenue generated by the entity during the preceding
biennium and estimated revenue for the ensuing biennium regardless of the fund to which the monies
were deposited. The standard budget does not include any personnel other than those specifically
authorized in the preceding biennial budget. The standard budget does not include requests for any
equipment, any special projects and services nor any requests for special or nonrecurring funding. The
limitations regarding authorized personnel and equipment requests does not apply to the University of
Wyoming.
Uniting these two definitions the question becomes: “does the state have the resources in place to
continue to fund the “standard budget”? At the state level, Wyoming prepared well for this downturn
through permanent and intermediate savings; however, the abruptness of the collapse in mineral
commodity prices and production had a dramatic and immediate impact on state services. In June 2016,
the Governor identified that revenue collections were going to be insufficient to cover appropriations
made by the Legislature for the upcoming biennium, July 1, 2016 through June 30, 2018, and
implemented 8 percent budget reductions for most state agencies. In fact, this became the third
consecutive biennium in which state agencies have had budgets reduced from the originally
appropriated level. During the 2017 Legislative Session, the Legislature, with a few minor exceptions,
accepted the Governor’s reductions and made additional reductions on an agency-by-agency basis.
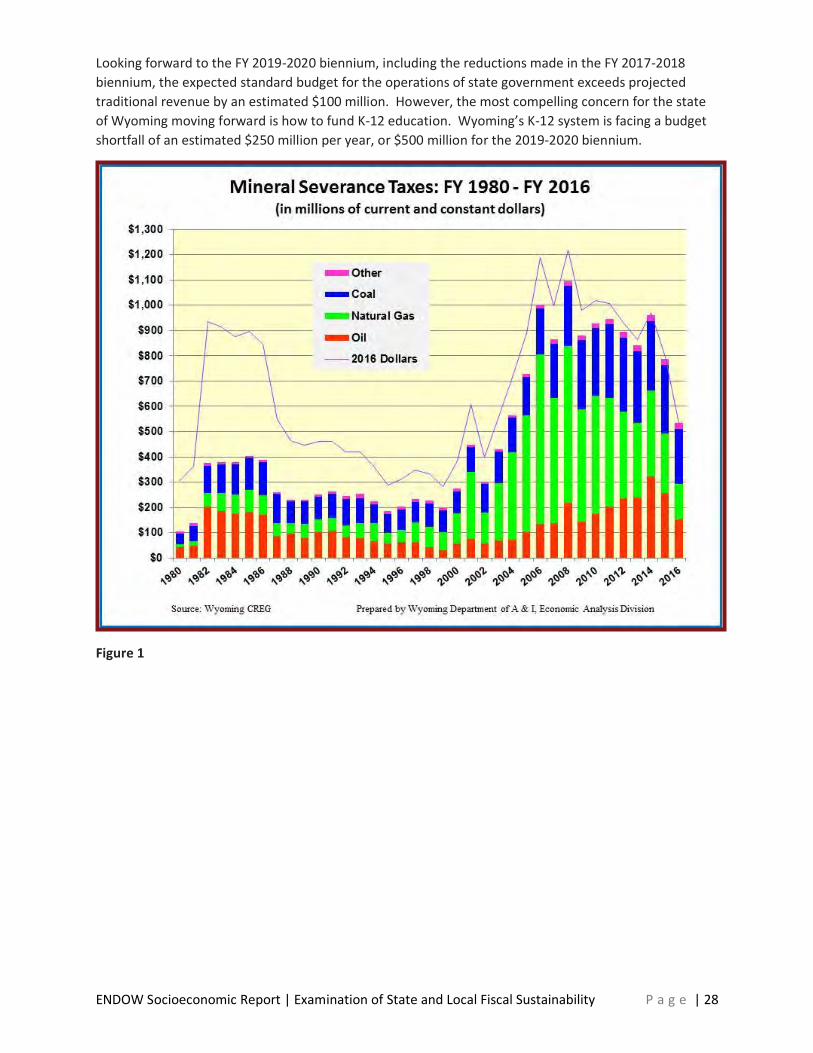
ENDOW Socioeconomic Report | Examination of State and Local Fiscal Sustainability P a g e | 28
Looking forward to the FY 2019-2020 biennium, including the reductions made in the FY 2017-2018
biennium, the expected standard budget for the operations of state government exceeds projected
traditional revenue by an estimated $100 million. However, the most compelling concern for the state
of Wyoming moving forward is how to fund K-12 education. Wyoming’s K-12 system is facing a budget
shortfall of an estimated $250 million per year, or $500 million for the 2019-2020 biennium.
Figure 1
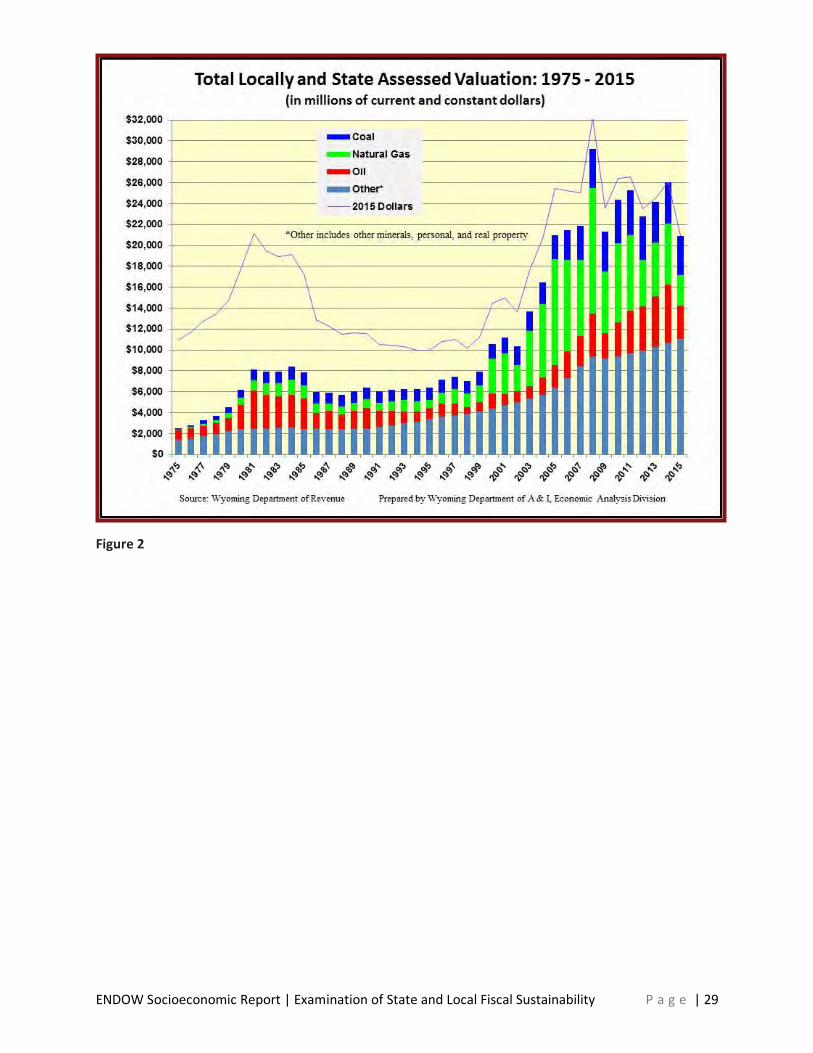
ENDOW Socioeconomic Report | Examination of State and Local Fiscal Sustainability P a g e | 29
Figure 2

ENDOW Socioeconomic Report | Examination of State and Local Fiscal Sustainability P a g e | 30
Figure 3
General Fund - to account for the ordinary operation of state government, and shall receive all revenues
and account for all expenditures not otherwise provided for by law in any other fund.
Budget Reserve Account - a special revenue fund to account for the proceeds of specific revenue sources
that are legally restricted to be expended for specified purposes. The state auditor is authorized to
transfer to the general fund, from any funds within the budget reserve account other than funds
appropriated or transferred to the legislative stabilization reserve account, amounts to maintain an
unencumbered, unobligated and unappropriated general fund balance adequate for cash flow needs.
Figures 1-3 demonstrate the impact of the Wyoming revenue base volatility and state budget
appropriations. County, municipal and other local government entities were not assessed for fiscal
sustainability due time and staff limitations, but it is presumed local governments are experiencing fiscal
crisis in the same manner. Local governments’ tax base dependence on energy commodity revenues
deeply and directly affect assessed valuation for local levies and state shared revenue.
$1,405.9
$1,330.5
$0
$400
$800
$1,200
$1,600
$2,000
$2,400
2005 2006 2007 2008 2009 2010 2011 2012 2013 2014 2015 2016 2017 2018 2019 2020 2021 2022
Traditional and Supplemental Revenue vs. Wyoming State
Government Standard Budget
General FundBudget ReserveStatutory 1% Sev. Taxstandard budget all branchesStandard Budget (2016 Constant Dollars)
Projected
Standard Budget
using 2017
Budget bill and
Estimated
standard budget
amount for 19-20.