softening at production plant rodenhuis - oasen.nl · pdf filesoftening at production plant...
TRANSCRIPT

Softening at production plant Rodenhuis
Ontharding op zuiveringsstation
Rodenhuis te Bergambacht
Ruud Kolpa, research departement
Jan van Eekeren, maintenance departement
10-09-2010

Softening at production plant Rodenhuis 2
Subjects:
Oasen and softening policy
Research at Oasen
ZS Rodenhuis

Softening at production plant Rodenhuis 3
Supply area

14/09/2010 | Oasen watercompany 4
Oasen: Facts and figures
317.000 customers, 750.000 inhabitants
Water consumption
47 Mm3 water per year
per person: 45 m3 per year
36 municipals
7.200 companies

14/09/2010 | Oasen watercompany 5
Oasen: the organisation
250 employees
60 cars
8 production plants
7 distributions stations
1 water towers
1 mainoffice

Softening at production plant Rodenhuis 6

Softening at production plant Rodenhuis 7
Typical Riverbank infiltration purification scheme
(intensive) aeration
filtration (wet/dry)
aeration
filtration (wet/dry)
softening
Carry-over filtration
activated carbon
UV-desinfection

Softening at production plant Rodenhuis 8
Softening policy of Oasen
Less copper and lead
Beter consumer comfort
Less energy consumption
Less use of washing powder
No use of home softening units
0%
10%
20%
30%
40%
50%
60%
70%
80%
90%
100%
% v
an
het
gep
rod
uceerd
e w
ate
r
1995
2000
2005
2008
(ver
wac
ht)
2010
(ver
wac
ht)
2012
(ver
wac
ht)
Voortgang implementatie ontharding
niet onthard
onthard

Softening at production plant Rodenhuis 9
Subjects:
Oasen and softening policy
Research at Oasen
ZS Rodenhuis

Onderzoek: MJOP2010-2012
01-06-2010

Our knowlegde networkWetsus
Bioclear
TU / IHE
RheinEnergie
01-06-2010
PDAM Pontianak

Problem 1: Aeromonas Summer 2006
12
10% > 1000
28% > 500

Problem 2: hydro biology
0
1
2
3
4
2004
2005
2006
2007

Understanding of mechanisms
Basic Approach Oasen
14
Cleaning network
Optimizing
current purification
Adding
Purification
steps
Short - term
Long - term
Network Purification
Redesign
network

Understanding mechanismsSampling sediment
Why sampling sediment?
• Hypothesis: biology in sediment
• Good indication of total amount of biology in distribution system.
Case study
• Sediment sampled in 3 different areas
• Different treatment plant different water quality
• Different biology?
• ATP, Aeromonas, TSS and other parameters
15

Optimizing current purification:
Reduce ATP / biology /AOC by
• Optimizing filter backwash procedures
• ??
But First: develop new on-line measurements!
• Because old methods are:
– Time consuming (Biofilm monitor)
– Expensive (AOC)
– Not quick enough (ATP, CFU) 16

Improving future purification(research)
Prevent regrowth by improving treatment process
• Remove particles/cells/nutrients
– Membrane filtration
– Ion Exchange
– Biological treatment
17

Cooperation with PDAM Pontianak
Main topics:
-Water quality
-Coagulation and filtration
-Leakage control
-Pipeline materials
-Salt intrusion Kapuas river
Softening at production plant Rodenhuis 18

Softening at production plant Rodenhuis 19
Subjects:
Oasen and softening policy
Research at Oasen
ZS Rodenhuis

Softening at production plant Rodenhuis 20
Production plant C. Rodenhuis (<2004)

ZS Rodenhuis: Facts and figures
Source: Bank infiltrated ground water from river Rhine
Raw water quality: Fe: 1,9 mg/l Mn: 0,6 mg/l NH4: 1,0 mg/l
Total hardness: 2,4 mmol/l, Bentazone: 0,11 ug/l.
Production (2007): 11,3 Mm3/a (=1290 m3/h)
Proces scheme:
1. Aeration and filtration: removal of Fe, Mn, NH4
2. Softening: Reduction of total hardness
3. Aeration and filtration: removal of carry-over
4. Activated Carbon filtration: removal of pesticides
5. UV-desinfection: safety barrier. Softening at production plant Rodenhuis 21

Softening at production plant Rodenhuis 22
Richard Lagendijk

Softening at production plant Rodenhuis 23
Richard Lagendijk

Softening at production plant Rodenhuis 24

Softening at production plant Rodenhuis 25

Softening at production plant Rodenhuis 26
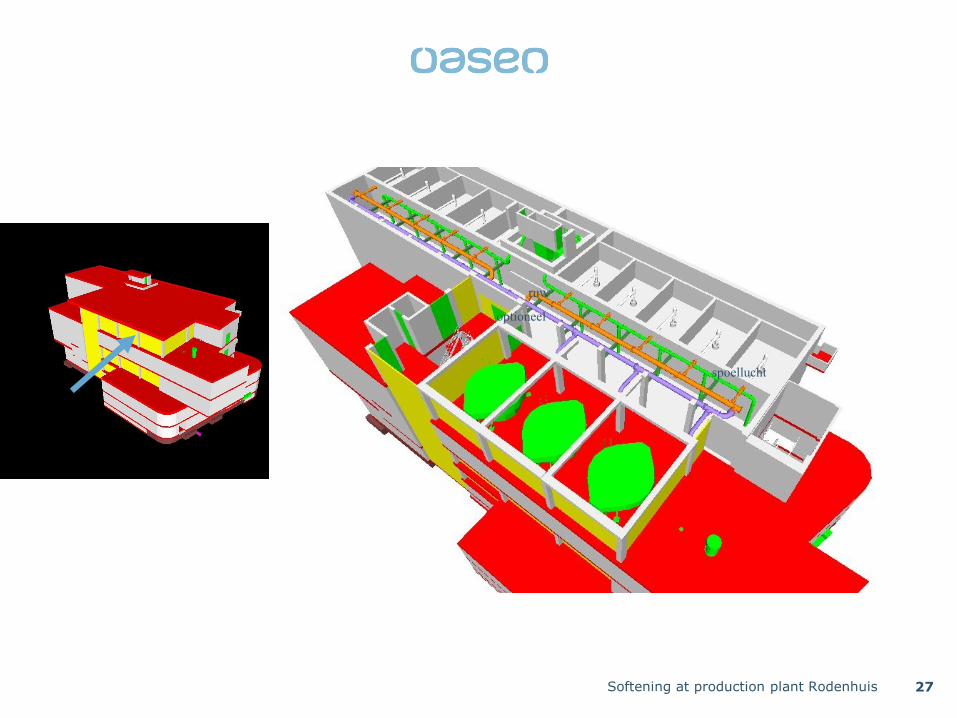
Softening at production plant Rodenhuis 27
spoellucht
ruw
optioneel

Softening at production plant Rodenhuis 28
pers
zuig
overstort
By-pass
op
tioneel
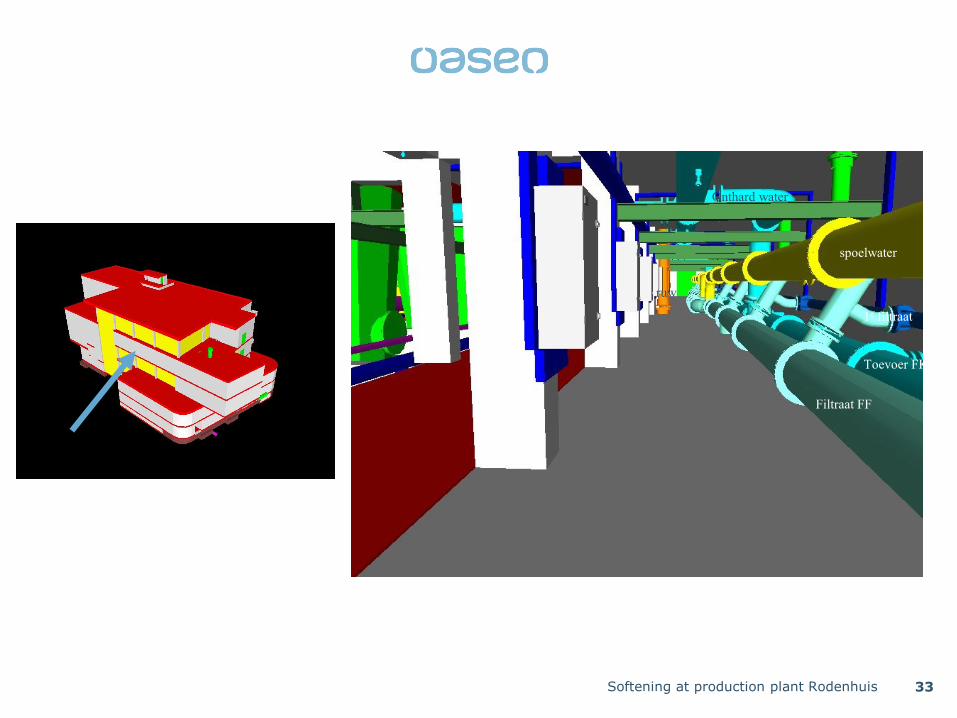
Ruw water
Filtraat FF

Softening at production plant Rodenhuis 29
afvalwater

Softening at production plant Rodenhuis 30

Softening at production plant Rodenhuis 31

Softening at production plant Rodenhuis 32
Softening at production plant Rodenhuis 33
Filtraat FF
Toevoer FK
1e filtraat
spoelwater
Onthard water
ruw
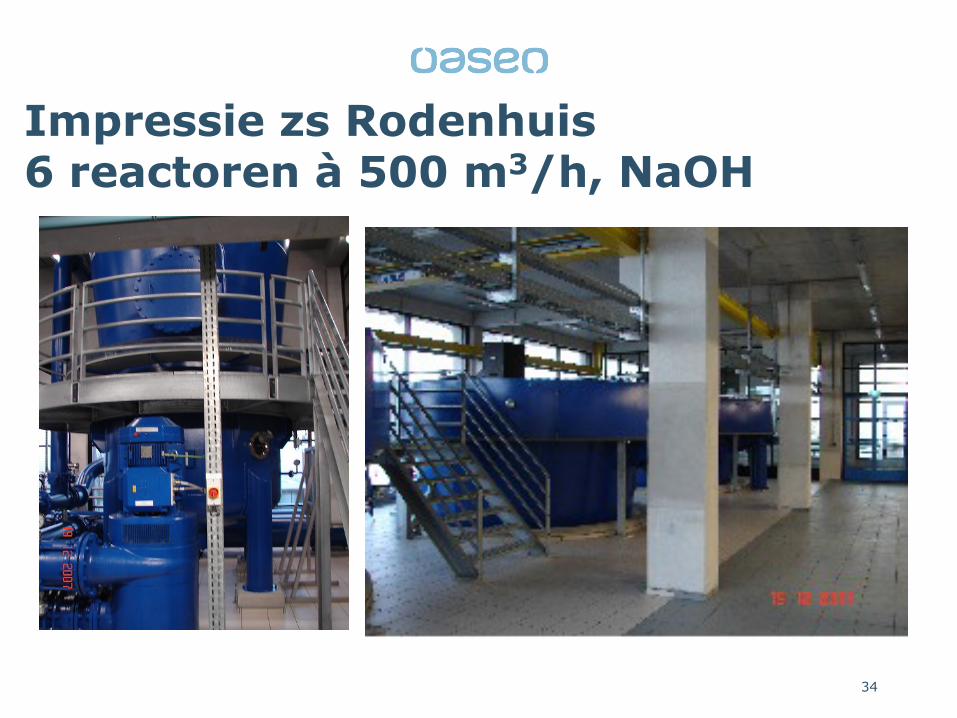
Impressie zs Rodenhuis6 reactoren à 500 m3/h, NaOH
34

Problemen pelletaftapsysteem
35

Onthardingsreactor – de aspecten
-Natronloog
-Entzand (toevoer)
-Pelletaftap
-Korrelbedbeheer
Softening at production plant Rodenhuis 36

De pelletaftap
Softening at production plant Rodenhuis 37

Korrelbedbeheer
Aspecten:
-Gewenste korrelgrootte
-Gewenste expansie
-Eén of tweelagensysteem
-Entzandtoevoer: frequentie en hoeveelheid
-Pelletafvoer: frequentie en hoeveelheid
Softening at production plant Rodenhuis 38

Simulatiemodel Pelletbedbeheer Rodenhuis
OASEN, CGT, 13 jun
entzand: dosering
(50 kg per 10 000 m3)
Calciumconcentratie IN
Calciumconcentratie UIT
(mmol/l)
aftapregime
(1050 kg per 10 000 m3)
Beginsituatie
aantal korrels + diameters
MODEL
0.00
0.50
1.00
1.50
2.00
2.50
3.00
0.0
0.2
0.4
0.6
0.8
1.0
1.2
1.4
1.6
0 20 40 60 80 100 120 140 160 180 200Dagen
D10 (mm) L
D50 (mm) L
D90 (mm) L
Cu (D60/D10) R
0
20000
40000
60000
80000
100000
120000
140000
160000
180000
200000
0.0
0.5
1.0
1.5
2.0
2.5
3.0
3.5
4.0
0 20 40 60 80 100 120 140 160 180 200Dagen
Bedhoogte rust (m) LBedhoogte bij 350 m3/u (m) LSpec. Opp. (vbv/m3 bed in rust) LTotaal bedoppervlak (m2) R
Korrelgrootteverdeling entzand
Dimensionering reactor
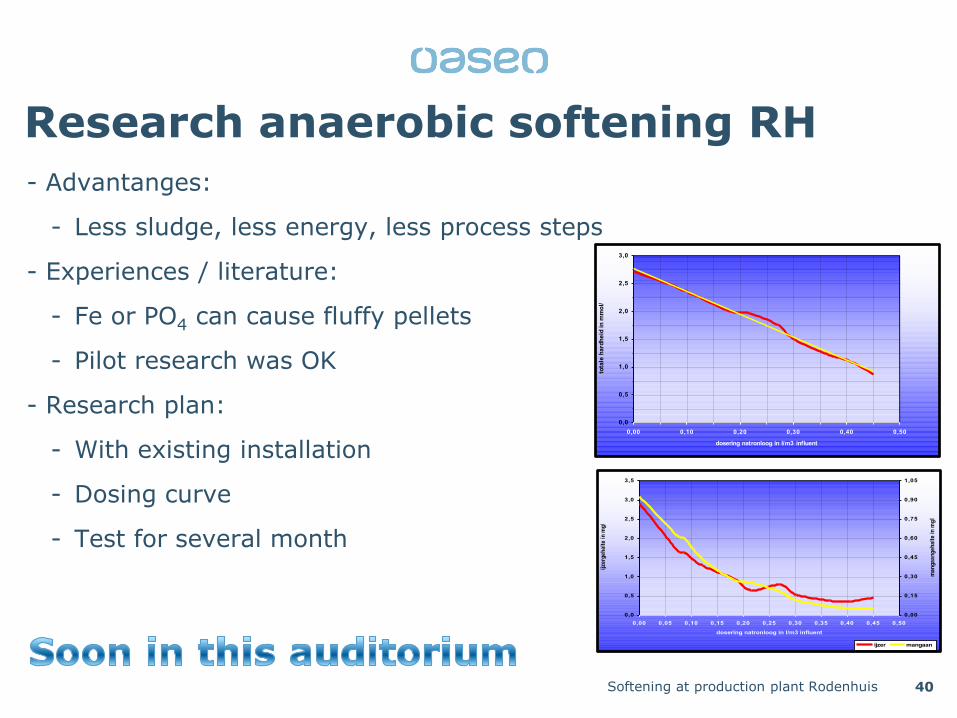
Research anaerobic softening RH
- Advantanges:
- Less sludge, less energy, less process steps
- Experiences / literature:
- Fe or PO4 can cause fluffy pellets
- Pilot research was OK
- Research plan:
- With existing installation
- Dosing curve
- Test for several month
Softening at production plant Rodenhuis 40
0,0
0,5
1,0
1,5
2,0
2,5
3,0
3,5
0,00 0,05 0,10 0,15 0,20 0,25 0,30 0,35 0,40 0,45 0,50
dosering natronloog in l/m3 influent
ijze
rge
ha
lte
in
mg
/l
0,00
0,15
0,30
0,45
0,60
0,75
0,90
1,05
ma
ng
aa
ng
eh
alt
e i
n m
g/l
ijzer mangaan
0,0
0,5
1,0
1,5
2,0
2,5
3,0
0,00 0,10 0,20 0,30 0,40 0,50
dosering natronloog in l/m3 influent
tota
le h
ard
he
id i
n m
mo
l/l

Softening at production plant Rodenhuis 41
Thank you for your attention
Questions ?