software for the hydraulic design of underground ... · software for the hydraulic design of...
TRANSCRIPT

Software for the Hydraulic Design of Underground Stormwater Detention Tanks
Shane Finlay
The quantitative and qualitative impacts of storm water runoff have become a key issue in urban development design. Traditional methods of addressing the quantitative impacts of increased peak flows and increased runoff volumes, through stormwater detentioniretention, have used above ground structures such as stormwater management ponds. Insufficient space, high land values, topography, maintenance, aesthetics and liability issues are reasons why underground detention is being considered more frequently.
This chapter presents the development of a computer program for designing underground stormwater detention tanks. The program was developed by the Corrugated Steel Pipe Institute (CSPI) as a tool to simplify the hydraulic design of corrugated steel pipe (CSP) detention tanks.
The program has four main functions: '" develop or allow the direct input of an inflow hydrograph, '" size the structure and develop a stage-storage relationship, • design the release structure and develop the stage-discharge rela
tionship, and '" route the inflow hydrograph through the structure
The design methodology is the same as that used to design above ground systems, tailored to underground tanks. Two design examples are presented.
Finlay, S. 2000. "Software for the Hydraulic Design of Underground Storm water Detention Tanks." Journal of Water Management Modeling R206-13. doi: 10.14796/JWMM.R206-13. ©CHI 2000 www.chijournal.org ISSN: 2292-6062 (Formerly in Applied Modeling of Urban Water Systems. ISBN: 0-9683681-3-1)
203

204 Underground Detention Tank Design Software
13.1 Introduction
The quantitative and qualitative impacts of stormwater runoff have become a key issue in urban development. The design of stormwater management facilities has, therefore, become an increasingly important part of most projects. Few development projects are exempt from some form of stormwater management regulation.
From the qualitative perspective, the constituents of storm water runoff can have negative effects on receiving bodies of water. These pollutants accumulate on impervious surfaces and are washed off during rainfall events.
Development causes increased peak flows and increased runoff volumes. Resulting flooding and erosion have unacceptable impacts on our environment. Flooding can include downstream bodies of water as well as connections to storm sewer systems. Erosion, in particular, causes increased stress on the receiving body of water. Limiting the volume of runoff has a positive impact.
Above ground facilities have a common method of addressing the impact ofland development runoff. Thesefacilities have typically taken the form of either wet or dry ponds. A wet pond, where the runoff is permanently retained, is an example of stormwater retention. A dry pond, where the runoff is detained and allowed to discharge at a predetermined rate, is an example of stormwater detention.
Disadvantages of above ground facilities are that they take up valuable property that could be put to a more economical use, they are a liability concern, they may become an "attractive nuisance", and they require frequent maintenance.
Underground stormwater facilities offer many benefits. Like above ground storage, they can operate as pure detention facilities or their design can be modified to allow their use for infiltration (groundwater recharge), filtration (quality treatment), or a combination of an three. The further benefits of underground detention include concealment and the discouragement of unauthorized access, and the more efficient use of both above and below ground space available on the site.
The approach to stormwater quantity control, in many jurisdictions, is to limit the outflow from the site to the pre-developed flow rate. This ensures, in theory, that the resulting volume or rate of runoff does not adversely affect downstream users.
The challenge for the designer, once the hydrologic characteristics of the site are known, is the sizing of the structure and it's components, and routing the flow through the structure. The detention tank must be designed to provide enough storage and release capacity so that the system does not surcharge and flood upstream connections.

13.2 Underground Detention Design System Software 205
To determine the detention tank storage requirements, the designer uses the pre-development and post -development hydrographs forllie site. The hydrographs can be obtained though the use of a variety of methods and computer programs. An estimate of the differential volume of runoff that must be stored, under the "no increase in runoff rate" design philosophy, can be obtained by taking the difference in areas under the pre-development and post-development inflow hydrographs. This volume estimate can be refined by determining the difference in areas between the post-development hydrograph and an estimated outflow hydro graph, where the outflow hydro graph has a maximum flow rate equal to the maximum discharge of the pre-development hydrograph.
13.2 Underground Detention Design System Software
The Underground Detention Design System software is a tool to simplify calculations associated with the design of underground detention systems. A companion manual entitled Design of Underground Detention Systems for Stormwater 1"1tfanagement is also available from CSPI. The manual describes, in detail, all aspects of the design of underground detention tanks and their components.
The main purpose of this chapter is to present an overview of the design methodology used in the development of the computer program. It uses the input screens to demonstrate the methodology and hardcopy output to demonstrate the results.
The program is written in Vi"uai Basic®. It uses standard Windows® 95 conventions such as pull-do'h'11 menus, minimizing the screen, and exiting. The program provides a brief description of each input field if the mouse pointer is held over the field. More detailed descriptions can be found in the online Help.
The main modules of the program, presented as pun-down menus on the opening screen are:
'I> File management - create a new project, open and save projects (files), print select portions of the output or aU the output, and start the Storm water Detention Expert
.. Project data - project specific information, as well as data common to other modules
.. Hydrograph - develop or allow the direct input and editing of an inflow hydrograph
.. Storage - size the structure and develop a stage-storage relationship, or allow the direct input and editing of a stage-storage relationship

206 Underground Detention Tank Design Software
• Discharge - design the release structure and develop the stagedischarge relationship, or allow the direct input and editing of a stage-discharge relationship
• Results - quick view of the results of the routing, and • Help - online help.
The Stormwater Detention Expert acts as a guide through the various modules of the program. It walks a new user through the steps in a logical manner, giving a more detailed description of the options available and requesting the necessary information for each module. It is one of the options automatically made available to the user when the program first starts, as shown in the New Project Options. It can also be started from the File pun-down menu.
Other utilities, that are accessed through the File pun-down menu, include: • the creation of a new (blank) project • open existing files, • save the current file (with the current file name or a new name), • print select portions of the output (hydrograph, stage-storage and
stage-discharge data), and • print all of the output.
13.2.1 The Project Information
The Overall Project Options screen includes the project name, project number, designer name and project description. The input of this information is optional. The screen also contains the stage increment for the stage-storage and stagedischarge calculations. The stage increment must be the same for each set of calculations, which is why it is set as an overall project option. The stage increment defaults to 0.1 m, and must be either accepted by clicking the mouse with the pointer over the OK button or changed for the program to proceed.
13.2.2 The Hydrograph
The inflow hydro graph can be either entered manually, if it has been developed using other software, or developed using the features provided by the program. Once it has been input or developed, it can be edited.
Manual input will require the inflow, in cubic metres per second, for each time increment. A number of methods to estimate the rate and amount of runoff are available. They range from the widely used rational formula, developed in the late 1800s, to the more recently developed computer models that are being continuously upgraded. The method used should be based on the size of the drainage area, the data available, and the degree of sophistication warranted by the design. Summaries of hydrologic computer models and runoff estimation methods are presented in Modern Sewer Design and Handbook o/SteelDrainage

13.2 Underground Detention Design System Software 207
& Highway Construction Products by the CSPI, and the Ministry of Transportation of Ontario Drainage Management Manual.
The program allows the user to develop inflow hydrographs using the modified rational method. This method is claimed by some to be generally applicable to sman highly-developed watersheds, which encompasses the typical application range of underground detention systems.
As previously discussed, a designer can develop pre-developed and postdeveloped hydrographs for a site. Under a no increase in runoff rate design philosophy, the pre-developedhydrograph can serve as the allowable release rate, or outflow hydrograph, for the purpose of estimating the required storage volume. The difference in areas under the two hydrographs serves as an estimate of the differential volume of runoff that must be stored.
The modified rational method results in a triangular or trapezoidal-shaped hydrograph. Figure 13.1 shows typical pre-developed and post-developed hydro graphs derived by this method. This straight line representation simplifies the mathematics involved in calculating the area between the two hydrographs.
0.10
Qp
0.08
" ~ 0.08 ,. I!' II ...
QAO.G4 J Q
0.G2
0.00
0 5 W U ~ a _ ~ ~ G T. T.
Time, min.
Figure 13.1 Pre- and post-developed hydro graphs
An estimate of the area between the two hydrographs can be determined from the equation:
where:
V. = Q T _ Q T _ Q T + a QA Tp + QA 2 Tp
S P dAd A P 2 2Qp
Vs = volume of storage (m3) T d = duration of precipitation (seconds) Op = post-development peak discharge (m3/s) OA = pre-development peak discharge (m3/s) T p = post development time to peak (seconds) a = ratio of pre-development time to peak to
post-development time to peak
(13.1)

208 Underground Detention Tank Design Software
As suggested by the above discussion, the program generates both the predeveloped and post-developed hydrographs. The required input, as shown in Figure 13.2, includes:
.. storm duration (minutes)
.. rainfall intensity (mm/hr)
.. drainage area (hectares)
.. hydrograph duration (minutes)
.. time increment (minutes)
.. pre-developed and post-developed runoff coefficients
.. pre-developed and post-developed times of concentration
G]O h:: .0.95 O:ro .. M5
0.75 t ... 0.95
Q.1:)toG.17 0.18 tv 1),22 0.25 to 0.35
Figure 13.2 Screen for modified rational method hydrographs.
It is assumed that the user will have some proficiency in hydrology and that the terms and input data will be familiar (these are discussed in CSPI, 1999). Typical runoff coefficients are shown on screen for a variety of area and surface types. The estimated storage volume is shown, based on the calculation detailed above, as well as pre-development and post-development peak discharges and runoff volumes.
The program generates the outflow hydrograph, during the routing procedure, for the hydrograph duration supplied by the user. When entering a hydrograph manually, the required hydrograph duration must be considered when entering the number of ordinates.

13.2 Underground Detention Design System Software 209
13.2.3 The Stage-Storage Relationship
The stage-storage relationship can be either entered manually, if it has been created by the user, or developed using the feature provided by the program. Once it has been input or developed, it can be edited.
Manual input requires the user to enter the total amount of storage available in the system for each stage increment. Minimum and ma.."{imum stage elevations are required so that an input table is created. Tabbing (rather than pressing enter) creates the table. The stage increment is set in the Overall Project Options screen.
The module of the program that helps the user develop the stage-storage relationship uses simple geometry to perform the necessary calculations. The fIrst step in the development of the stage-storage relationship involves sizing of the detention tank so that it will accommodate an estimated storage requirement.
If the llser entered an inflow hydrograph manually, the storage requirement can be calculated by some other means or estimated graphically, or the user can use a trial-and-error approach to size the detention tank through repeated trials.
If the program was used to generate the inflow hydro graph, the estimated storage requirement is already calculated. Note that the method used underestimates the required storage volume by up to 25%. This is the result of the trapezoidal shape of the pre-development hydrograph. In reality, the discharge or outflow hydrograph will have a different shape. The target volume estimate, which is shown as a reminder in the storage computations screen includes a safety factor to allow for the underestimation. This is only a guide to aid in the initial sizing of the tank. The final tank size can be adjusted to optimize design economics.
Several site parameters affect the possible size of the detention tank. Site topography and land use win int1uence the plan location of the system. The tank invert elevation can depend on the elevation of a receiving body or of a storm sewer into ,-vhich the tank will empty. The presence of other infrastructure services or bedrock will also influence the location of the tank invert. The proposed site plan elevations and minimum cover requirements will affect the maximum elevation of the tank obvert The combination of these elevation limitationswiH dictate the maximum allowable rise or height ofthe detention tank. To allow access and room for maintenance, a minimum pipe diameter of 1500mm should be considered.
Clicking the mouse with the pointer over the Add Pipe button will add a new pipe. The same type of feature is available for removing pipes from the list.
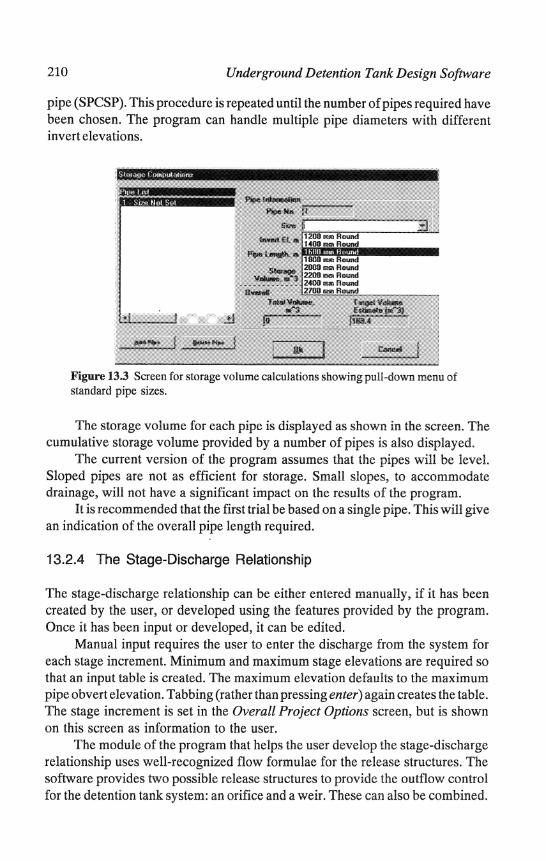
A pipe number is applied to the new pipe and the user is required to input the size, invert elevation and length. The Storage Computations screen, as shown in Figure 13.3, contains a pull-down menu which will provide a selection list of standard round and pipe-arch shapes in CSP and structural plate corrugated steel
210 Underground Detention Tank Design Software
pipe (SPCSP). This procedure is repeated until the number of pipes required have been chosen. The program can handle multiple pipe diameters with different invert elevations.
Figure 13.3 Screen for storage volume calculations showing pull-down menu of standard pipe sizes.
The storage volume for each pipe is displayed as shown in the screen. The cumulative storage volume provided by a number of pipes is also displayed.
The current version of the program assumes that the pipes will be level. Sloped pipes are not as efficient for storage. Small slopes, to accommodate drainage, will not have a significant impact on the results of the program.
It is recommended that the first trial be based on a single pipe. This will give an indication of the overall pipe length required.
13.2.4 The Stage-Discharge Relationship
The stage-discharge relationship can be either entered manually, if it has been created by the user, or developed using the features provided by the program. Once it has been input or developed, it can be edited.
Manual input requires the user to enter the discharge from the system for each stage increment. Minimum and maximum stage elevations are required so that an input table is created. The maximum elevation defaults to the maximum pipe obvert elevation. Tabbing (rather than pressing enter) again creates the table. The stage increment is set in the Overall Project Options screen, but is shown on this screen as information to the user.
The module of the program that helps the user develop the stage-discharge relationship uses well-recognized flow formulae for the release structures. The software provides two possible release structures to provide the outflow control for the detention tank system: an orifice and a weir. These can also be combined.

13.2 Underground Detention Design System Software 211
For instance, an orifice can be used as the primary release structure and a weir can provide emergency overflow release.
Orifice
The program uses the basic orifice equation:
(13.2)
where: Q == discharge through orifice (m3/s)
Cd ::: coefficient of discharge A ::: cross sectional area of the orifice (m2)
g ::: acceleration due to gravity (9.81 m/52), and h == head measured from the center of the orifice (m)
The discharge through the orifice is accurate, using the above equation, when the orifice is small in comparison to the depth of water. The program is not set up, in its current format, to accurately handle flows through an orifice as a weir when the head elevation is within the orifice. When the head is less than about two or three times the diameter of the orifice, severe vortex action can develop which causes inaccuracies which are not accounted for in the program.
The coefficient of discharge can vary significantly, depending on the configuration of the bulkhead and the design of the orifice. The coefficient for a sharp-edged orifice with complete contraction varies from 0.59 to 0.66. For orifices with partially suppressed contractions, the coetlicient ranges from 0.62 to 0.71. For orifices with fully round edges (the contraction of the jet is fully suppressed), the coefficient ranges from 0.94 to 0.95. If a hole is cut through a steel or concrete bulkhead and the surface and edges of the hole are left rough, the coefficient could be 0.4. A nominal value of 0.61 is often used for the types of orifices and range of heads normally used for detention tank outlet structures.
The equation assumes that the outlet is not submerged and there is, therefore, no back pressure. If the outlet is submerged, h should be taken as the difference in \vater elevations or head on either side of the orifice. If that is the case, the stage-discharge relationship must be calculated and input manually.
The Calculate Stage Discharge orifice screen, as shown' in Figure 13.4, requires the user to enter an orifice coefficient and orifice invert elevation. There are two ways that this screen can be used. The user can input the size of orifice and a maximum head elevation, in which case the program calculates the maximum discharge. The other option is for the user to input the maximum head elevation and a maximum discharge, in which case the program calculates orifice size when the user clicks the mouse with the pointer over the Size Orifice button. The pre-developed maximum discharge rate is shown, for reference, only if the modified rational method was used for the hydrograph development.

212 Underground Detention Tank Design Software
Figure 13.4 Screen for orifice design.
Weir
The program uses the general equation for a horizontal-crested weir:
where: Q =CLh3 / 2
Q :::: discharge over the weir (m3/s) C ::: coefficient of discharge L :: effective length of the weir crest (m), and h ::: head above the weir crest (m)
(13.3)
The discharge over the weir can be calculated using the above equation when the weir has no end contractions. The measuremcnt of h, for a sharp crested weir, is made a distance of 2.5*h upstream of the weir crest. The discharge coefficient for a sharp-crested weir can be represented by:
C = 1.81 + 0.22~) (13.4) where:
C == coefficient of discharge h = head above the weir crest (m), and P :::: height of the weir crest above the tank bottom (m)
For hiP values up to 0.3, a constant value of 1.84 is typically used for C. The equation assumes that the weir nappe is fully aerated and is not
submerged. In other words, the tail water elevation on the downstream side of the bulkhead is below the weir crest. If the tail water elevation approaches the weir elevation, the nappe is not fully aerated and a partial vacuum develops under the nappe in which case the flow over the weir increases. The flow becomes unstable and undulating.

13.2 Underground Detention Design System Software 213
The program is based on the assumption that, if an overflow weir is provided, an internal bulkhead forms part of the design. In that case, both an orifice and a weir are included. The designer must consider the discharge capacity of the outlet from the tank. The outlet would typically be a pipe located in the end waH of the tank, and would be located and sized to ensure that flow through the orifice and weir are not affected.
The weir crest does not always extend completely across the tank. This would be a weir with end contractions. In this case, the length of the weir needs to be corrected to account for flow contractions at each end of the sharp-crested weir. The effective weir length is calculated using:
L =L'-(O.lnh) (13.5) where:
L := effective length of the weir crest (m) L' == measured length of the weir crest (m) n :::: number of end contractions, and h ::::: head above the weir crest (m)
A single weir length value is required for the program input, so a representative value should be used.
The discharge formula and coefficient described above are for a sharpcrested weir. However, broad-crested weirs are often used as the overt1ow release structure in detention tanks. The equation for a horizontal-crested weir can be slightly modified, so that it applies specifically to a broad-crested weir:
Q=CLHt ,12 (13.6)
V2 (13.7) H =h+-
t 2g
where:
and: Q == discharge over the weir (m3is) C :::: coefficient of discharge L == effective length of the weir crest (m) h ::: head above the weir crest (m) V :::: approach velocity (m/s), and g :::: acceleration due to gravity (9.81 mis2)
The approach velocity is measured at a distance 3*h upstream of the crest. For detention tanks, the approach velocity is often taken to be negligible, in which case the equation is the same as that for a sharp-crested weir.
214 Underground Detention Tank Design Software
The discharge coefficient for broad-crested weirs has been determined experimentally to range between 1.48 and 1.71. A typical value of 1.705 is often used for the design of detention tank overflow structures. If the upstream edge of the weir is well rounded, the coefficient of discharge is often taken as 1.67. Discharge coefficients are covered in a number of references including MTO, 1998; Streeter & Wylie, 1979; CSPI,1999.
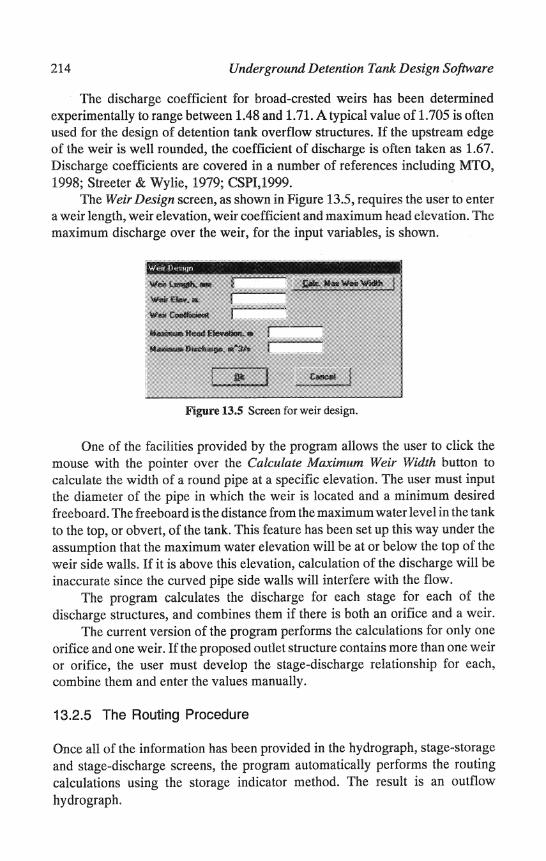
The Weir Design screen, as shown in Figure 13.5, requires the user to enter a weir length, weir elevation, weir coefficient and maximum head e!.evation. The maximum discharge over the weir, for the input variables, is shown.
Figure 13.5 Screen for weir design.
One of the facilities provided by the program allows the user to click the mouse with the pointer over the Calculate Maximum Weir Width button to calculate the width of a round pipe at a specific elevation. The user must input the diameter of the pipe in which the weir is located and a minimum desired freeboard. The freeboard is the distance from the maximum water level in the tank to the top, or obvert, of the tank. This feature has been set up this way under the assumption that the maximum water elevation will be at or below the top of the weir side walls. If it is above this elevation, calculation of the discharge will be inaccurate since the curved pipe side walls will interfere with the flow.
The program calculates the discharge for each stage for each of the discharge structures, and combines them if there is both an orifice and a weir.
The current version of the program performs the calculations for only one orifice and one weir. If the proposed outlet structure contains more than one weir or orifice, the user must develop the stage-discharge relationship for each, combine them and enter the values manually.
13.2.5 The Routing Procedure
Once all of the information has been provided in the hydrograph, stage-storage and stage-discharge screens, the program automatically performs the routing calculations using the storage indicator method. The result is an outflow hydrograph.
13.2 Underground Detention Design System Software 215
Routing using the storage indicator method is based on the concept that:
Storage:::: Inflow - Outflow therefore, the change in storage over a time increment will be the difference in the volume of water flowing in and the volume of water flowing out during that time increment. Or:
The routing equation could then be written in the form:
11+12 °1+°2 S2- S1
where: 2 2 !It
I1 = inflow at time 1 (m3js) 12 == inflow at time 2 (m3js)
01 == outflow at time 1 (m3js) 02 == outflow at time 2 (m3js)
Sl :::: storage at time 1 (m3) S2 == storage at time 2 (m3), and At = time interval
This equation can be rearranged so that it is now written as:
II + 12 Sl 01 S2 02 --"--=-+---=-+-2 I1t 2 !It 2
(13.8)
(13.9)
(13.10)
In it's final form, which is how the routing procedure is set up, the equation is:
.~~ ~ 12 + (~~ + ~L ) _ 01 = ~~ + ~2 (13.11)
The inflows are known, as they have been provided in the hydrograph module. The initial storage and outflow are known, and are zero, assuming that the tank is empty when the rainfall event begins. That leaves two unknowns. The storage indicator method treats the two unknowns, the storage at time two and the outflow at time two, as a single number. This number, which is the right side of the above equation, is known as the storage indicator number.
The storage and discharge are known for each stage (eleva tion) as they were developed in the stage-storage and stage-discharge modules. Note that the time increment used must be the same as that used to develop the inflow hydro graph.
The program performs a check of the storage indicator curve (plot of the storage indicator number against discharge). If the slope is too steep (greater than unity) the program advises that the results will likely be inaccurate and that consideration must be given to refining the stage or time increment.

216 Underground Detention Tank Design Software
Figure 13.6 shows how the storage routing proceeds. At time 0, the inflow, storage and outflow are aU 0 . In other words, the values a and bare O. These values become the time 1 values in columns 2 and 3 on the next line. The value c in column 4 (the storage indicator number) is calculated by adding the values in columns 1 and 2 and subtracting the value in column 3. This value is then used to obtain, through interpolation, the discharge "d" from the storage indicator table. The process continues in this manner to the end of the hydro graph duration as input by the user in the hydro graph screen.
2 3 4
Time Inflow (11 +12 ) Sl 0 1 °1 Sz 02 °2 -+- -+-12 2 A.t 2 At 2
0 ! 0 a b
At 1M iA,/2 I
a b c d
-1 2M 12M (I"" +'/2/J/2 c d
Figure 13.6 Routing procedure.
13.2.6 The Results
The program provides two methods for viewing the results. The View Results option from the View pull-down menu only displays the storage indicator table and the storage routing table in a numerical grid format. The Print option from the File pull-down menu shows the fun formatted output for all steps of the design, induding both numerical and graphical representations. The fully formatted output can be previewed on-screen before printing.
While the fully formatted output is on-screen, the user can continue to make changes to the various design input screens and preview the effects of these.
The fully formatted output is not very legible when it first appears on the screen. The user can more closely examine the data by clicking the left mouse button to zoom in (the right mouse button will cause the view to zoom out).
To move forward or backward through the pages of output, the user must dick the mouse with the pointer over the left and right arrows on the preview screen toolbar.
To print the output, the user must dick the print button on the toolbar. Examples of hardcopy output are provided in Figures 13.7 and B.S.
13.3 Examples
Example 1 details a simple design using the modified rational method for hydro graph creation, pipe definition for the storage calculations, and an orifice as the release structure.

13.3 Examples 217
The fonowing data were used for this example: Hydrology
Location: Toronto Pearson International Airport area
Design storm frequency: 1 in 10 years Storm Duration: 60 minutes RainfallIntensity: 34 mm/hr Drainage Area: 1 hectare HydrographDuration: 250 minutes Time Interval: 5 minutes Pre-Developed Runoff Coefficient: 0.30 Post-Developed Runoff Coefficient: 0.70 Pre-Developed Time of Concentration: 15 minutes Post-Developed Time of Concentration: 10 minutes
Pipe Size Based on site parameters, the maximum allowable pipe diameter is 1600 mm. There are no site plan restrictions.
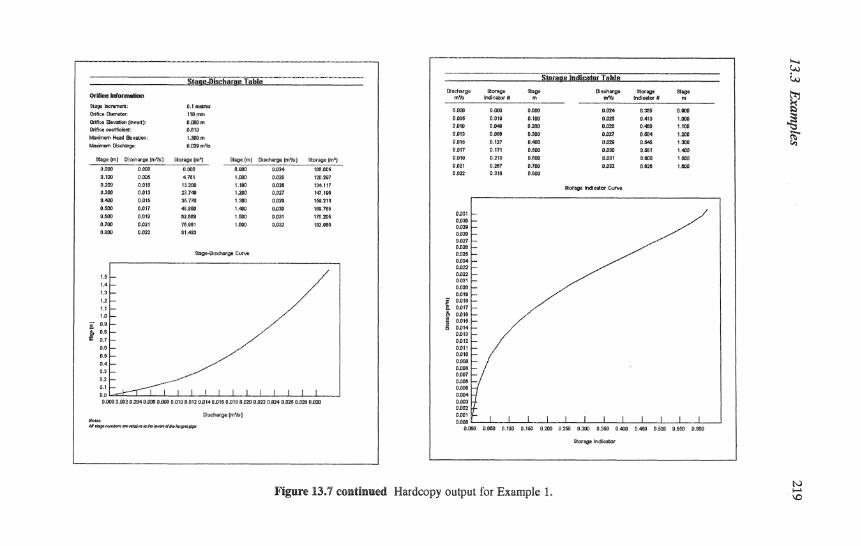
The resulting hardcopy is shown, reduced, in Figure 13.7. Note that the length of pipe exceed that required by the estimated storage requirement. A weir will be added in the next example as a demonstration of providing emergency overflow. It is estimated that the weir elevation will be at about 1.3 m elevation, so the intention here is to provide a design in which the orifice provides the maximum allowable discharge with a maximum water level not exceeding 1.3 m.
As shO\VTI in the storage routing table, the maximum discharge is 0.028 m3/s and the maximum stage is 1.286 m.
Example 2 takes the first example and adds a weir for emergency overflow under a more intense rainfall event. The fonowing data were used: Hydrology
Design storm frequency: 1 in 100 years RainfallIntensity: 51 mm/hr
Release Structure In addition to the orifice provided in the first example, a weir will be provided to provide emergency overflow. Based on the results of the first example, the weir could be placed at an elevation of 1.29 m without affecting the results of the analysis. It will be located at an elevation of 1.3 m. A check of the weir width, using the Calculate Maximum Weir Width feature, suggests that a weir width of 1000 mm will result in a top of weir side waH to top of pipe dimensional difference of about 175 mm (top of wall elevation of 1.425 m).
As shown in the Storage Routing Table, the maximum stage is 1.415 m. Since this is below the top of wall elevation of 1.425 m, the top of the pipe will not impact the flow.

218 Underground Detention Tank Design Software
-----,
18 ~!! II g -: f"! .... <"'i <It !q~3~$! 1- - ~ .--
JI~~!~~ I
Orifice inf0rma4kln
St~!npR!m'ilm.
OTifie<l Diam'~hlr
OrlfiMl 2w~on {!nw!rt): Orjfj(~ coeff;cler«:
Mllx!mum H~ Emv!!ltllm:
Milrimum [)w;CMrgol!
D.l0n D.lOtt 0.300
'-'00 0.500 iI.500 11.100 >200
I,.~ 1,'
1,3
1,2
U La
i 1l.1l
I a,a ", a" M ,,4 ;},3
'2 0,1
(\.005
'l.Otl) ~.O13
1).015
D.Dl1 0.019 0.021
0.022
-~""S!m:I)'i$chai!i' hWi,:::--'-------' ,,-'"~,
fJ.lrnltrti
l1iJf<Im O,OOOm O.UO !.SCl)rn
U.(l29m"/!l"
410i
1".100 3;L749 3iU'?O
4t.SOO 52Jl6l.4
76J1I51 01.433-
1JliID \.100
1,200 1.3lJO
1.'~!!
''''' 1.6£10
me~·[)j:;d~rgt /:WVIIl
IHl25 tW.:w'r !l.O~ ':)4,111 t).027 141,19:)
O.oau 16\1.216
.""n 100.100
"a,,, m.206 [Ul3l tfl1.006
a" kd:::.:.J._L-..l".-1 __ ,L,..l" .. J, ___ L",,L,,,,,.,l_J.. Li-L __ J D,D\JU D.Wl2 Gr040.DOO 1).1)00 0.()10 O,(l11 U.0141).o1$ Q,ell'! O,OlIl. 0.022 DJ.t24 OD2(! lill:W om
UJo:chWg>;l(m"ls}
"--.. ~--
,-",---------~,~ 'Sii!riiiiiiliiilfiiiDr able
OiJ!lf"~~ $I"l' OI5MVge """'" " .... ..... m rt& 1nd!~orN /'I'l ·~'~'_V"·_~_·~".~~.~~'~'~'M_~~" ___
~--.~-------,---
0,001) ',"", OIlllt) a,024 O,3a~ MOD nnw 0.0'10 0,100 'D'" Do.413 LOOD O.fHO 0,,,., 0200 .". MOO 1.10D 01)13 0'.000 '"'" '''' 0,004 U!lO S.ol15 D.12i" '''''' ""'" D,"" ~.30.3
!l1.l11 0.111 &:500 M'" "-"" ''''' O,:")!Q 0.218 rl.\~oo tum O.60~ 1,100 (J!!21 0.7$7 0.700 C.!l'J2 0." 1.00C O!m ~L"llf~ OS""
Stor~ ltIdiemor Cut'OIe
0.031 0.030
0." n,,,. 71 ... //! 0."_ /
ll.o27 !)J)llIf,~
0.026 0." O.D23 OJJ22 0.&2t
i (l.OU.
~:::;( ~ 0.015 Z; D.DI4
0.01:'.1 01112 !Ulll 0.010 D,noo 0.000 " O.oor iHlOO 0.036 .' a.,.. a"", 0,002 ~),(I!l!
0.000 L~~.~I __ L--L __ L-J
I l-.L_G
fLOOO OM!) O,tOO C.truJ 0.200 D'wi.l 0.300 0.300 U,'1tIi'J ll."It'IU u.~ U.::I:iij ll.iClI.I<l
stOf'&gelr.1j1"ator
Figure 13,7 continued Hardcopy output for Example 1.
....... ~ Y.l
t:rl ~ ~ lr
t-.J ,.... \C

n ... mio
m • w ~
~
• ~
~
~
u 00
~
ro ro w ~
00
~
• -'" '" ~ m • rn ~
~
• -• ~
rn rn • • • • m ~
m
Inflow m"/,:
O.flOO
O.G33
o.oce 0.'" a.ooo ODes 0.066
0.066
0."" O.CGG
o.lir:le D!lte 0.",
Dim 0.000
0.000 0.000
a.DOO
0.000
D.DOD 0.000 0.000 0.000 .... 0.000 0,000 (},I,'IOO
0.000 1).000
{)jlDD
ODGD 0.0;)0
ODlifJ
'.000 .. " o.coo C.MO ODD!) [I.liOO
0000 (I.!lon i),flOC
D,DOG
Slor.ao Routina Tabl.
iWg. Inflow OtMIow ~or0g~ md. \'/u!um~ m"l3 m"f$ m~
O.COO
O.!i15
a.C4Q .... D.OO~
'OOfl 0 ....
D."'" D ....
D.'" 0."" D."'" o.ooe 0.041
G.OHl ,,,,.. D."'" D."'" D_ 0.000
D.'" 0.000 D.OOC
D.OOC 0.., ,.coo 0",..
0 ... D.COO
0.0011 D./lOO 0.000
D.""" D."'" D.1lOO .. .., '.000 0."'" '.000
0<'00 D.ooo 0.000
0."'"
"" 0.006
0.011
1l1ll4
OJ)17
D.!HQ 0./.:21
D.D2:l:
0.:023 0.024 DO,. rum tl.D21l'
a.OZi'l
Do:ro 0.027 D.<m D . .". DIJ20
O.M4
0.024
tim D.'"
'"'" 0.021 0.01£1 O.O::W o.OlQ ODltl
;;,017
0,017
O.DU;
IlOl5
0.014 £1.014 0.01:; O.C!2
0.011 0.010 0.001)
D.""" D.'" 0."",
0.000 (UJW ... , 0.110 0160
0.2:11
~.2M
0.310
0.354
0.396
o . ..uo 0.41'8
01H&
0.5'30
0..,' 00499 [\,472 . ..., O.41£:
I).~"
0.370 , .... O.32'lc
11.301
C.l1G 1.(16$ ,~ .. 021$ 0.100
1.1.1111 0.164 0.147
0.131 c.m): a.Wl
0'.00.1
"'" , .. , ."" ."'" (l.o~'3
o,c:le O.l)t~
0."'" 4."" 16.737
::2.162 .,." 112.258
1G.148
SO.fi76
102.5$lfi.
11!U:jlJl
12:7.524
1~.4i'O
151.oa~
1:51.<ml 153.94il
i4B.t\I3l 137!M2
129.00<4 122,004
1!4.62t':
107.405 100.301 ';I;J.i82
86.971
00.$10 14.3ti e:::.3$l 02.1009 5f.033
51.6fl3 «LG"I~
41.632
30.946 32.4Q1
:.c1!1~il
2't;;2C :W.G2G
11.2111 14,003
11.263 IUHS 1J.1:i:l 4.Q%
Stllg>'.! m
"on ,. .. a.2!l4 1l.375
O.4'-l2
0.5S7 o.eQ4 0.797
o.en 0.955 1.052
1.f41 1.2;)2
1.2SIJ ,,,,. 1.100 1.120
I.Gee 1.01$
D.900 0.010
0.861
0.214
O.7ii1!
C.7K O.&fl2 c..Goff} 0 .... IUISQ
0.521 0.42.2
0 .... , .... 0.313 D.l3U
D.3D!S 01l'1l il.2J®
n.2tl~
0.1'17 0.14t
D.ll!~
0.102
• _________ ~.._. _ _..J
.~
min
'" no
'" :130
'.005 0.000
[I.M:'l
0."" 0.045
'i O.D<W
i o
'''''' .. '" !LOW
0.000
0,015
0.010
0.005
0.000
~-.fiow m~fG
0.000
D.OOD
GlllIO O.DOD
Storage R."ti •• robl. leonli"uedl ."-""~--
PilJg Il"tlow Outflow !notljSt Ind. Volume m"lr> m"/s m'
O,OOD 0.000
D."'" ,.""
0.004 0.014 0.003 01l1!)
0.002 0001 Mill O'.ooS
!rI1iow/oulfl(lw H)ldr09r~ph
MOO 1472
" ... t.'2J6
I':ltfllgll
n.rm O.t)/I1 o.[);)r O.IJ2e
1\ /~-- . .-' '-------- J 'lLLLl~LLJ~====~> o lD 20 30 40 Iro 1.10 70 &I 90 lDO 111) 120 130 10ft) tOO 100 170 IW iGO i.:IO :1:10 21C 230
TImo!(rntn)
Figure 13.7 continued Hardcopy output for Example 1.
N
t3
~ f} ~ ~ :;:::
~ tl (':>
~ :.::t .... §' ~ ~ tl ~
aQ' ;::: VJ
t ~
~

..... \.I,,)
Oepl timelmln) InrIOWI""') 111M (""n) Inllow(m-Is) lIrnt(mln) lrIIow(m-m) ~
CSPl UntIerground DeCvnIIon Design Sysf8m • D. 02 •• .30 0.000
Venloll 3.1.11 • •• t3 D. .37 ..... ~ .. '.003 .. , ... '30 ..000
JfriiIiiliiiljfOiililill •• " ..... Of . .... '30 0.000 02 D.oeo .. . .... .", ..... ~ _ ..... ,
OImmolo2 G3 ..... ., ..... • •• . .... --, 04 •• .. D .... .'" .... r ""-, ............ 00 ..... .. ..... . ... D .... --"" =-~;-__ "''''' __ of __ .. ..... t'" ..... .44 ..... 67 D. 10. . .... .45 .....
oat,: VIIrachesdav.FuNlltyI7,ltSII .. •• '02 ..... t. . .... ..... -, ... "" ..... '03 ..... .47 "'" .. ..... . .. . .... .41 "'" lull_ Hvdmamab •• •• ." ..... •• "'" 02 .m ... . .... .00 ..... _od_Ml_od
03 .... ID' ..... '8' ..... 910I'I'II 0JnIti0n; .. "' .... 04 •• . .. . .... '02 "'" --, .......... 00 ..... '00 .'''' .03 "'" DnlinateIl'U: ,- .. ..... 11. 0'''' .04 ..... .................. , 200_ 07 om II. . .... , .. . .... Tmcalrlerw;al: ,- .. ..0211 112 .'''' ... . .... .. UID 11. . .... 'G? .....
Pr ... Oevdopod Post._ .... 70 .... 11. . ... . .. . .... c ... ~ .3 .. , " ...... "' ..... "" . .... Te,min. ,. ID 72 0'" 11. . ... . .. . .... 1Ipo". "'" ..... .... 73 .... 117 .... • •• . ...
74 ..... 11. . .... • 02 .. .. T1rne(mlnJ HI~ limo (min) ...... _J TIIM(mln, 1nHO'W(m-tlJ ,. .... '10 .... .03 ..... ..... " ..... 32 ..... " .... 0 120 .... ... . ....
UfO " ..... 33 ..... 71 •• 12. , .... .00 ..... '.020 .. . .... 0< ..... " .... '22 .... .DO "'" 0'" •• D .... .. ..... 70 .... '22 ..... '07 ..000 ..... .. D .... 30 ..... .. ..... '24 "'" .00 ..... .... " ..... 37 .... Sf 0 .... '20 U" .00 ..... •• 22 ..... 30 .... 02 ..... '20 ..... • 70 . .... .... 23 ..... 30 ..... .. ..... .27 .... 171 . .... . .,. 24 D .... .. ..... M ..... '28 .... .72 ..... D.0I0 20 ..... 41 .... " .... 0 '20 .... '73 ....
ID ..... 28 .... ... .... 00 ..... ""
.... .,. . ... 11 ..... 27 .... ... ..... ., ..... 13. . .... .76 "'" 12 ..... 20 , ... .. .... 00 '.003 "" .... .76 .... '3 ..... 28 .... 45 0 ... .. ..... .23 ..... '" .... •• . .... ,. .... • .... DO ..... '34 ..... '70 .... ., ..... •• .... 41 .... •• . .... . .. . ... "8 . ....
Figure 13.8 Hardcopy output for Example 2. ~ ~

Sta.e-St.'~u.I~,-"bJ.<I.L-________ _
Calculated Stage~storlillge Table
St<l~ !oo~rnM1: OJrn~$
Pipa Numbfcr Pip'll SIze
f 1fiOO rmn Round
l}I:"\J€!{mJ Stor~tm=J m:IlgE!{mJ
0.000 D."" o.eoo 0.100 4.761 0.100
0.20' 13.200 D.SOD
'.!l!l' 2:).7oW O.~OD
DAnO 35.770 1.000 0,500 ~.ai50 1.HlD
.. 6
1..
1.3
1.2
1.1
1.' e: 0.0
t D.' 0.1
G.' 0.'
D.' 0.3
D.'
,., ... M!:Iqf'Ufllb!N~_l"l1l1J1i'1~*"fIWIlflllJrtt~ll!(iF
I"l~ Lllngth $l:0f'a~ Volume frwan 13,
'01.000 m lS2.GeC rn" '''''''m S!oraQff{m&) Stage (m) Gtorllg0:!m"1
02.609 1200 141'.1G-tl 7fI.OO1 1.'"'" i~.21S
Q1,4ro .. 4JlIJ lM.1t\G
100.006 '''''' 17tllOI} 1:W.297 1.000 182.QO~
13<'l:.111
stag(!· fi'torbgt CutVtl
I I 140 I~ 100 170 HlO
~or\lg.:! (m~i
St.g.-I)I"""", •• Table
Orifice Information
St~ bcremtnt 0.1 rootm: OriflCfl O!;imi1lt~r: 110mm Orifioe 81il'<fartion Gnv0ll;); O.DOOm OrifioelXldflciri.mt: D.OID MslClmum Htad Ekl:lII:icn- I_300m
Mlxim'Jm DfIi¢lIlrae:: O,02$m"fs
Weir tnformetion
SrIgQ!r.eftlMnt: D.1l'roi!treg
\J\lWr SQvM~: l.$OOm
W.rurl.!2r.gth: 11l00m
\MrirGoeffir;;-ft!nt: 1.705 Ma~imom HeM EHi>r.JI:itm: 1,425m
M:!xlmum OI00h<tl"i:lE'" O.ooom"ls
Stage: (m) Oisch~r~ {m"l's) &!:of!'l(Jt{m"l _I"') OIt:ohVf]1!. (m"n) ~raBI! (m") ---<.-.~">---
'ilOO a.ooo ''''"' 0.,,0 0.014 11.'6..005 D.1oo ,."'" 4.761 l.ilOO 0.026 120.297
D."" D.010 1.::t.200 UOO O.D2t1 ti4,m
'.300 !).()13 23.749 1:200 tum 147.100
0.'" (1)15 ~.710 1."" 0.01<1 1502!S
O.!iOO 0.017 «1.960 .. "'" fU184 \51nee '.WL D.01i<' e2.CM "600 0,1(1'.3 m.2D5 0.700 O..,! 7lUl'tl1 1.000 D.:m 1$2.~
0.>"" 0.1)22- 511.4$3
NfJM.~ AN lIhf(o ~n am mlatlm tn tI$ inw-# Mfm MItfN:!' pi{Jtl,
.--_._--_ .. _._-------------"
Figure 13.8 continued Hardcopy output for Example 2.
~
~ ~ ~ ~ 0:: ;::: >::l. tl fIl ~ ;:::
g" ;:::
~ ~ tl ~ ~-C"'l
~ ~
~

13.3 Examples 223
1
j -1 1
j -1

224 Underground Detention Tank Design Software
Not aU pages have been included with the results of this example, as shown in Figure 13 .8. The slope of the Storage Indicator Curve suggested that the results may be inaccurate. This was, in fact, a result of the introduction of the weir. In order to correct this potential problem, the time increment was reduced to Imin. The inflow and outflow hydrographs, therefore, contained a large number of data points.
13.5 Summary
The Underground Detention Design System software simplifies the calculations associated with the design of underground detention systems.
This chapter presented an overview of the computer program, and provided worked examples to demonstrate results obtained from the program.
Designers can use the software to quickly perform the calculations associated with the design of underground stormwater detention facilities.
References
MTO, 1998. Ministry of Transportation of Ontario, "Drainage Management Manual", Streeter, V.L. & Wylie, E.B., 1979. Fluid Mechanics, McGraw-Hill Book Company,. CSPI, 1999. Corrugated Steel Pipe Institute, Design of Underground Detemion Systems
for Stormwater Management [Draft]. CSPI, 1998. Corrugated Steel Pipe Institute, Design of Underground Detention
Systems, Seminar Notes. CSPI, 1996. Corrugated Steel Pipe Institute, Modern Sewer Design - Canadian Edition. CSPI, 1991. Corrugated Steel Pipe Institute, Handbook of Steel Drainage & Highway
Construction Products - Canadian Edition