software performance engineering for object-oriented systems: a
TRANSCRIPT

Software Performance Engineering for Object-Oriented Systems:A Use Case Approach
Connie U. Smith† and Lloyd G. Williams§
†Performance Engineering ServicesPO Box 2640, Santa Fe, New Mexico, 87504-2640
(505) 988-3811, http://www.perfeng.com/~cusmith
§Software Engineering Research264 Ridgeview LaneBoulder, CO 80302
(303) 938-9847
Copyright © 1998, Performance Engineering Services and
Software Engineering Research
All Rights Reserved
This material may not be sold, reproduced or distributed without written permissionfrom Software Engineering Research or Performance Engineering Services

Abstract
Many object-oriented systems fail to meet performance objectives when they areinitially constructed. These performance failures result in damaged customerrelations, lost productivity for users, lost revenue, cost overruns due to tuning orredesign, and missed market windows. Most performance failures are due to a lack ofconsideration of performance issues early in the development process. However,early consideration of performance in object-oriented systems is straightforward. TheUse Case scenarios produced by developers during analysis and design serve as astarting point for performance analysis. This paper describes a systematic approach tothe performance engineering of object-oriented systems based on Use Case scenarios.This approach is cost-effective and has a low impact on the software developmentprocess. A simple case study illustrates the process.

- 1 -
1 Introduction
Object-oriented techniques have become widely accepted for designing andimplementing software systems in application areas ranging from client-server toreal-time, embedded systems. Object-oriented software systems are typically easier tounderstand, easier to adapt to new requirements, and have a higher potential for reusethan those developed with procedural approaches.
Unfortunately, many object-oriented systems fail to meet performance objectiveswhen they are initially constructed. These performance failures result in damagedcustomer relations, lost productivity for users, lost revenue, cost overruns due totuning or redesign, and missed market windows. Moreover, “tuning” code toimprove performance is likely to disrupt the original design, negating the benefitsobtained from using the object-oriented approach. Finally, it is unlikely that “tuned”code will ever equal the performance of code that has been engineered forperformance. In the worst case, it will be impossible to meet performance goals bytuning, necessitating a complete redesign or even cancellation of the project.
Our experience is that most performance failures are due to a lack of consideration ofperformance issues early in the development process, in the architectural designphase. Poor performance is more often the result of problems in the design ratherthan the implementation. However, the trend in the object-oriented community is todefer consideration of performance until after the system has been implemented. Thefollowing quote from Auer and Beck (Auer and Beck, 1996) is typical:
Performance myth: “Ignore efficiency through most of the development cycle. Tuneperformance once the program is running correctly and the design reflects your bestunderstanding of how the code should be structured. The needed changes will belimited in scope or will illuminate opportunities for better design.”
This “fix-it-later” attitude is not unique to the object-oriented community. It is rootedin the view that performance is difficult to predict and that the models needed topredict the performance of an emerging system are complex and expensive toconstruct. Predicting the performance of object-oriented systems can, in fact, be verydifficult. The functionality of object-oriented systems is decentralized. Performing agiven function is likely to require collaboration among many different objects fromseveral classes. These interactions can be numerous and complex and are oftenobscured by polymorphism, making them difficult to trace. The current trend towarddistributing objects over a network compounds the problem.
Despite these difficulties, our experience is that it is possible to cost-effectively engineerobject-oriented systems that meet performance goals. By carefully applying thetechniques of software performance engineering (SPE) throughout the developmentprocess, it is possible to produce object-oriented systems that have adequateperformance and exhibit the other qualities, such as reusability, maintainability, andmodifiability that have made object-oriented development (OOD) so effective (Smithand Williams, 1993).

- 2 -
In this paper we focus on Use Cases since they provide the basis for a bridge betweenobject-oriented methods and SPE (Smith and Williams, 1997). An instance of a UseCase represents a particular execution of the system. Use Case instances are describedusing Scenarios. Scenarios from Use Cases are translated into SPE performancescenarios. Performance scenarios are, in turn, used to construct and evaluate a varietyof performance models.
SPE is a method for constructing software systems to meet performance objectives(Smith, 1990). Performance refers to the response time or throughput as seen by theusers. The SPE process begins early in the software life cycle and uses quantitativemethods to identify a satisfactory architecture and to eliminate those that are likely tohave unacceptable performance. SPE continues throughout the development processto: predict and manage the performance of the evolving software, monitor actualperformance against specifications, and report problems as they are identified. SPEbegins with deliberately simple models that are matched to the current level ofknowledge about the emerging software. These models become progressively moredetailed and sophisticated as more details about the software are known. SPE methodsalso cover performance data collection, quantitative analysis techniques, predictionstrategies, management of uncertainties, data presentation and tracking, modelverification and validation, critical success factors, and performance design principles.
This paper describes the application of SPE to object-oriented systems. We begin witha review of related work. Overviews of OOD and SPE follow. We then present anoverview of the SPE process for object-oriented systems. A simple example illustratesthe process.
2 Related Work
As noted in the introduction, object-oriented methods typically defer consideration ofperformance issues until detailed design or implementation (see e.g., (Rumbaugh, etal., 1991), (Jacobson, et al., 1992), (Booch, 1994)). Even then, the approach tends to bevery general and ad hoc. There is no attempt to integrate performance engineeringinto the development process.
Some work specifically targeted at object-oriented systems has emerged from theperformance community. Smith and Williams (Smith and Williams, 1993) describeperformance engineering of an object-oriented design for a real-time system.However, this approach applies general SPE techniques and only addresses thespecific problems of object-oriented systems in an ad hoc way.
Hrischuk et. al. (Hrischuk, et al., 1995) describe an approach based on constructing anearly prototype which is then executed to produce angio traces. These angio traces arethen used to construct workthreads (also known as timethreads or use case maps (Buhr andCasselman, 1992), (Buhr and Casselman, 1994), (Buhr and Casselman, 1996)), whichshow object method invocations. Service times for methods are estimated. This differs

- 3 -
from the approach described here in that their approach derives scenarios fromprototype execution and generates the system execution model from the angio traces.Our approach is intended for use long before executable prototypes are available; andit reflects a view of the software that explicitly models more general scenarios withexecution path frequencies and repetitions.
Baldassari et. al. describe an integrated object-oriented CASE tool for software designthat includes a simulation capability for performance assessment (Baldassari, et al.,1989), (Baldassari and Bruno, 1988). The CASE tool uses petri nets for the designdescription language rather than the general methods described above, thus thedesign specification and the performance model are equivalent and no translation isnecessary. Using these capabilities requires developers to use both the PROTOBmethod and CASE tool. The approach described here is general in that it may be usedwith a variety of object-oriented analysis and design methods.
3 Object-Oriented Development
Object-oriented development is an approach to software specification, design andconstruction that is based on identification of the objects that occur naturally in theapplication and implementation domains. The specification, design and code are thenorganized to reflect the structure inherent in those objects and their interactions.
A number of approaches to object-oriented analysis and/or design have appearedover the past several years (see e.g., (Shlaer and Mellor, 1988), (Shlaer and Mellor,1992), (Booch, 1991), (Rumbaugh, et al., 1991), (Jacobson, et al., 1992), (Selic, et al.,1994), (Rational Software Corporation, 1997)). Despite their apparent differences, theseapproaches share several significant commonalties. They all involve construction of aset of conceptual models of the system under development. These conceptual modelsare based on object-oriented concepts such as classes, objects, methods (operations),and inheritance. Each of them also employs, at one time or another, different views ofthe classes and objects that are being modeled.
The principal views are embodied in static and dynamic models. Static models (Classand Object Diagrams) describe the classes and objects that are relevant to the problemand the relationships among them. Dynamic models (State Diagrams) describe thepatterns of behavior that apply to objects belonging to a given class. A number ofmethods have also adopted Use Case Diagrams to describe interactions between thesystem and its environment or between objects within the system.
In this paper, we focus on Use Cases since these provide the basis for a bridge betweenobject-oriented methods and SPE (Williams and Smith, 1995). A Use Case is a specificway of using the system (Jacobson, et al., 1992), (Rational Software Corporation, 1997).Each Use Case consists of a set of sequences of actions that the system performs toachieve some desired result. An instance of a Use Case represents a particularexecution of the system.

- 4 -
Use Case instances are described using Scenarios. A Scenario is a sequence of actionsdescribing the interactions between the system and its environment (including theuser) or between the internal objects involved in a particular execution of the system.The scenario shows the objects that participate and the messages that flow betweenthem. A message may represent either an event or an invocation of one of the object’smethods (operations). In object-oriented methods, scenarios are used to:
• describe the externally visible behavior of the system,• involve users in the requirements analysis process,• support prototyping,• help validate the requirements specification,• understand interactions between objects, and• support requirements-based testing.
As described in (Williams and Smith, 1995), scenarios provide a common point ofdeparture between object-oriented requirements or design models and SPE models.Scenarios may be represented in a variety of ways (Williams, 1994). Here we useMessage Sequence Charts (MSCs) to describe scenarios in object-oriented models. TheMSC notation is specified in ITU standard Z.120 (ITU, 1996). Several other notationsused to represent scenarios are based on MSCs (examples include: (Rumbaugh, et al.,1991), (Jacobson, et al., 1992), (Booch, 1994), and (Rational Software Corporation,1997)). However, none of these incorporates all of the features of MSCs needed toestablish the correspondence between scenarios in object-oriented modeling andscenarios in SPE.
Figure 1 illustrates a high-level MSC for a simple automated teller machine (ATM).Each object that participates in the scenario is represented by a vertical line or axis.The axis is labeled with the object name (e.g., anATM). The vertical axis representsrelative time which increases from top to bottom; the MSC notation does not include arepresentation of absolute time. Interactions between objects (events or methodinvocations) are represented by horizontal arrows.

- 5 -
aUser anATM homeBank
cardInserted
requestPIN
pINEntered(aPIN)
requestTransaction
response
msc userInteraction
loop
alt
processDeposit
processWithdrawal
processBalanceInquiry
terminateSession
Figure 1. Message Sequence Chart for a user interaction with the ATM
aUser anATM homeBank
requestAccount
account
requestAmount
amount
requestAuthorization
msc processWithdrawal
authorization
dispense(amount)
requestTakeCash
cashTaken
transactionComplete
ack
Figure 2. Message Sequence Chart processWithdrawal
Figure 1 describes a general scenario for user interaction with the ATM. Therectangular areas labeled “loop” and “alt” are known as “inline expressions” anddenote repetition and alternation. This Message Sequence Chart indicates that the usermay repeatedly select a transaction which may be a deposit, a withdrawal, or a

- 6 -
balance inquiry. The rounded rectangles are “MSC references” which refer to otherMSCs. The use of MSC references allows horizontal expansion of Message SequenceCharts. The MSC that corresponds to ProcessWithdrawal is shown in Figure 2. A Message Sequence Chart may also be decomposed vertically, i.e., a refining MSCmay be attached to an instance axis. Figure 3 shows a part of the decomposition of theanATM instance axis. The dashed arrows represent object instance creation ordestruction. Arrows originating or terminating at the edge of the chart are those fromthe higher-level MSC.
anATM aCustomerSession aWithdrawal
new
requestPIN
msc anATM
requestTransaction
requestTransaction
response
new
cardInserted
requestPIN
aPIN
aPIN
response
requestAccount
requestAccount
... ... ...
Figure 3. MSC anATM
MSC references and decomposition help to control complexity by hiding details untilthey are needed. They also make it easier to assemble scenario fragments into fullscenarios. Finally, decomposition allows a developer to elaborate a scenario byincluding additional objects (as in Figure 3) as the design becomes more detailed.
Scenarios from Use Cases provide the basis for constructing performance scenarios.Performance scenarios are, in turn, used to construct performance models. Section 4describes these performance models and their use in managing performancethroughout the development process.
4 Software Performance Engineering
Software performance engineering is a quantitative approach to constructing softwaresystems that meet performance objectives. SPE prescribes principles for creatingresponsive software, the data required for evaluation, procedures for obtainingperformance specifications, and guidelines for the types of evaluation to be conducted

- 7 -
at each development stage. It incorporates models for representing and predictingperformance as well as a set of analysis methods.
SPE uses deliberately simple models of software processing with the goal of using thesimplest possible model that identifies problems with the system architecture, design,or implementation plans. These models are easily constructed and solved to providefeedback on whether the proposed software is likely to meet performance goals. Asthe software process proceeds, the models are refined to more closely represent theperformance of the emerging software.
The precision of the model results depends on the quality of the estimates of resourcerequirements. Because these are difficult to estimate early in the software process, SPEuses adaptive strategies, such as upper- and lower-bounds estimates and best- andworst-case analysis to manage uncertainty. For example, when there is highuncertainty about resource requirements, analysts use estimates of the upper andlower bounds of these quantities. Using these estimates, analysts produce predictionsof the best-case and worst-case performance. If the predicted best-case performance isunsatisfactory, they seek feasible alternatives. If the worst case prediction issatisfactory, they proceed to the next step of the development process. If the results aresomewhere in-between, analyses identify critical components whose resourceestimates have the greatest effect and focus on obtaining more precise data for them.A variety of techniques can provide more precision, including: further refining thedesign and constructing more detailed models or constructing performancebenchmarks and measuring resource requirements for key components.
Two types of models provide information for design assessment: the softwareexecution model and the system execution model. The software execution model representskey aspects of the software execution behavior. It is constructed using executiongraphs (Smith, 1990) to represent workload scenarios. Nodes represent functionalcomponents of the software; arcs represent control flow. The graphs are hierarchicalwith the lowest level containing complete information on estimated resourcerequirements. Figure 4 shows the execution graph corresponding to the userinteraction scenario from Figures 1 - 3. The graph shows that, followingGetCustomerInfo and GetPIN, the ATM will repeat the ProcessTransaction node n times.ProcessTransaction and TerminateSession are expanded nodes; they are expanded in aseparate graph. Figure 5 shows the expansion of ProcessTransaction.

- 8 -
A comparison of Figures 1 through 3 with Figures 4 and 5 illustrates the strongcorrespondence between Use Case scenarios, as represented in MSCs, andperformance scenarios, as represented in execution graphs.
Solving the software model provides a static analysis of the mean, best- and worst-case response times. It characterizes the resource requirements of the proposedsoftware alone, in the absence of other workloads, multiple users or delays due tocontention for resources. If the predicted performance in the absence of theseadditional performance-determining factors is unsatisfactory, then there is no need inconstructing more sophisticated models.
If the software execution model indicates that there are no problems, analysts proceedto construct and solve the system execution model. This model is a dynamic modelthat characterizes the software performance in the presence of factors, such as otherworkloads or multiple users, that could cause contention for resources. The resultsobtained by solving the software execution model provide input parameters for thesystem execution model. Solving the system execution model provides the followingadditional information:
• more precise metrics that account for resource contention• sensitivity of performance metrics to variations in workload composition• effect of new software on service level objectives of other systems• identification of bottleneck resources• comparative data on options for improving performance via: workload
changes, software changes, hardware upgrades, and various combinations ofeach
The system execution model represents the key computer resources as a network ofqueues. Queues represent components of the environment that provide someprocessing service, such as processors or network elements. Environment
GetPIN
n
ProcessTransaction
TerminateSession
Get CustomerInfo
Figure 4. Execution Graph for userinteraction with the ATM
ProcessTransaction
GetTransaction
ProcessWithdrawal
ProcessDeposit
ProcessBalance
=
ProcessRequest
Figure 5. Expansion of processTransaction

- 9 -
specifications provide device parameters (such as CPU size and processing speed).Workload parameters and service requests for the proposed software come from theresource requirements computed by solving the software execution model. The resultsof solving the system execution model identify potential bottleneck devices andcorrelate system execution model results with software components.
If the model results indicate that the performance is likely to be satisfactory,developers proceed. If not, the model results provide a quantitative basis forreviewing the proposed design and evaluating alternatives. Feasible alternatives canbe evaluated based on their cost-effectiveness. If no feasible, cost-effective alternativeexists, performance goals may need to be revised to reflect this reality.
This discussion has outlined the SPE process for one design-evaluation cycle. Thesesteps repeat throughout the development process. At each phase, the models arerefined based on the more detailed design and analysis objectives are revised toreflect the concerns that exist for that phase (Smith, 1990).
5 SPE for OOD
Software performance engineering for object-oriented systems includes the followingsteps:
1. Establish performance objectives: Performance objectives specify thequantitative criteria for evaluating the performance characteristics of thesystem under development. These objectives may be expressed in severaldifferent ways, including: response time, throughput, or constraints onresource usage. For information systems, response time is typicallydescribed from a user perspective, i.e., the number of seconds required torespond to a user request. For real-time systems, response time is given asthe amount of time required to respond to a given external event.Throughput requirements are specified as the number of transactions orevents to be processed per unit time.
2. Identify important Use Cases: The important Use Cases are those that arecritical to the operation of the system or which are important toresponsiveness as seen by the user. Typically, this is only a subset of the UseCases that are identified during object-oriented analysis.
3. Select key performance scenarios: It is unlikely that all of the scenarios for eachcritical Use Case will be important from a performance perspective. Foreach important Use Case, the key scenarios are those which are executedfrequently or those which are critical to the perceived performance of thesystem.
4. Translate scenarios to execution graphs: Once the key performance scenarioshave been identified, the MSC representation is translated to an executiongraph. Currently, this is a manual process. However, the close

- 10 -
correspondence between scenarios as expressed in MSCs and executiongraphs suggests that an automated translation may be possible.
Estimates of the amount of processing required for each step in theexecution graph are obtained form the class definition for each objectinvolved. This information is contained in the class diagram, or the logicalview of the system architecture (Kruchten, 1995). As described above, earlyin the development process, these may be simply best/worst case estimates.Later, as each class is elaborated, the estimates become more precise.
5. Add resource requirements: The processing steps in an execution graph aretypically described in terms of the software resources (e.g., operatingsystems calls or database accesses) used. Resource requirements map thesesoftware resource requirements onto the amount of service they requirefrom key devices in the hardware configuration.
Resource requirements depend on the environment in which the softwareexecutes. Information about the environment is obtained from the physicalview of the architecture (Kruchten, 1995). In the UML, this corresponds tothe Deployment Diagram.
6. Solve the models: As noted above, solving the execution graph characterizesthe resource requirements of the proposed software alone. If this solutionindicates problems, analysts consider design alternatives to address theproblems. If not, then analysts proceed to solve the system execution model.
These steps are illustrated with the following case study.
6 Case Study
This case study examines an interactive system, known as ICAD, to support computer-aided design (CAD) activities. Engineers will use the application to construct and viewdrawings that model structures, such as aircraft wings. The system also allows users tostore a model in a database and interactively assess the design’s correctness,feasibility, and suitability. The model is stored in a central, relational database andseveral versions of the model may exist within the database.
A drawing consists of nodes and elements. Elements may be: beams, which connecttwo nodes; triangles, which connect three nodes; or plates, which connect four or morenodes. Additional data is associated with each type of element to allow solution of theengineers’ model. A node is defined by its position in three-dimensional space (x, y,z), as well as additional information necessary for solution of the model.
Several different Use Cases have been identified for ICAD, including Draw (draw amodel) and Solve (solve a model). For this example we focus on the Draw Use Caseand one particular scenario, DrawMod (Figure 6). In the DrawMod scenario, a typicalmodel is drawn on the user’s screen. A typical model contains only nodes and beams

- 11 -
(no triangles or plates) and consists of 2050 beams. The performance goal is to draw atypical model in 10 seconds or less.
iCAD aModel theDatabase
msc DrawMod
new
open
find(modelID)
retrieve(modelId)
draw
close
Figure 6. The DrawMod Scenario
The following sections consider three alternative designs for this application and theirperformance.
6.1 Design 1The first design uses objects to represent each beam and node. This design offers agreat deal of flexibility, makes it possible to treat all types of elements in a uniformway, and allows the addition of new types of elements without the need to change anyother aspect of the application. The Class Diagram for Design 1 is illustrated in Figure7.
Model
TriangleNode Beam Plate
Element
modelID : intbeams[] : beam
node1 : intnode2 : intnode3 : int…
nodeNo : intx : inty : intz : int…
node1 : intnode2 : int…
nodes[] : node…
elementNo : int
draw()
draw()draw()
draw()draw()
1..N
2
3
4..N
Figure 7. Class Diagram for Design 1

- 12 -
Given the design in Figure 7, the DrawMod scenario expands to that in Figure 8. Theunlabeled dashed arrows indicate a return from a nested set of messages. Thisnotation is not part of the MSC standard, it is taken from the UML (Rational SoftwareCorporation, 1997).
iCAD aModel
msc DrawMod
loop
new
open
find(modelID)
sort(beams)
retrieve(beam)
find(modelID, node1, node2)
retrieve(node1)
retrieve(node2)
new
new
new
draw
close
node2theDatabase aBeam node1
draw
draw
drawBeam
draw
Figure 8. DrawMod scenario for Design 1
This paper illustrates model solutions using the SPE•ED™ performance engineering tool(Smith and Williams, 1997). A variety of other performance modeling tools areavailable, such as (Beilner, et al., 1988), (Beilner, et al., 1995), (Goettge, 1990),(Grummitt, 1991), (Rolia, 1992), (Turner, et al., 1992). However, the approach describedhere will need to be adapted for tools that do not use execution graphs as theirmodeling paradigm.
Figure 9 shows SPE•EDs screen with the execution graph corresponding to the scenarioin Figure 8. The expanded nodes in the tool’s graphs are shown with color. The “worldview” of the software model appears in the small navigation boxes on the right sideof the screen. The top level of the model is in the top-left navigation box; its nodes areblack. The top-right navigation (turquoise) contains the Initialize processing step (thesteps preceding find(modelID) in the MSC). Its corresponding expanded node in the top-level model is also turquoise. The expansion of the yellow DrawBeams processing step

- 13 -
contains all the steps within the loop in the MSC. Again, there is a closecorrespondence between the object interactions in the MSC scenario in Figure 8 andthe execution graph in Figure 9.
After creating the processing steps in the execution graph, analysts then specifyresource requirements for each step. Then, SPE•ED produces solutions for both thesoftware execution model and the system execution model. The specification ofresource requirements as well as the model solutions are described in (Smith andWilliams, 1997). The parameters in this case study are based on the example in (Smith,1990); the specific values used are omitted here.
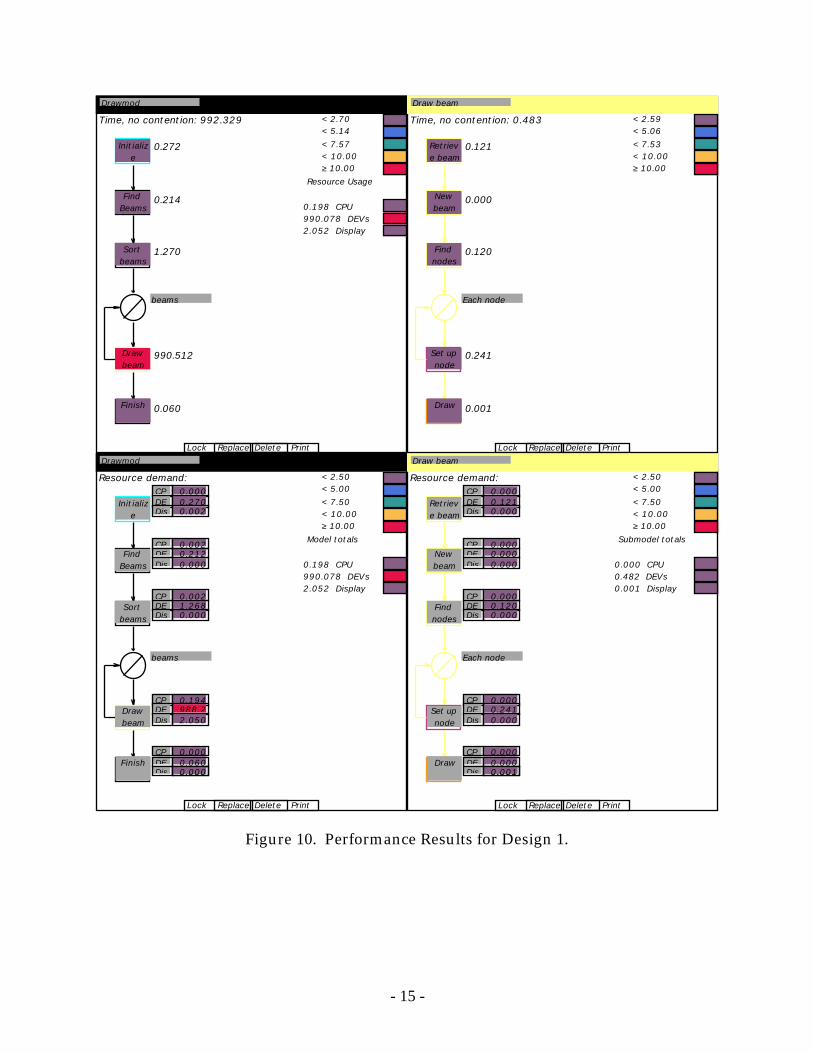
Figure 10 shows a combination of four sets of results for the “No Contention”Solution - the elapsed time for one user to complete the Drawmod scenario with nocontention delays in the computer system. This best-case solution indicates whether itis feasible to achieve performance objectives with this approach. The solution in thetop-left portion of the Figure shows that the best-case elapsed time is 992.33 seconds.The time for each processing step is next to the step. The color bar legend in the upper-right corner of the quadrant shows the values associated with each color. Valueshigher than the 10 second performance objective will be red, lower values arerespectively cooler colors. The “Resource usage” values below the color bar legendshow the time spent at each computer device. Of the approximately 992 seconds, 990 isdue to time required for I/O at the “DEVs” disk device. The DrawBeam processing steprequires 991 seconds for all 2050 iterations. The time per iteration, 0.483 seconds, is inthe top-right quadrant along with the time for each processing step in the loop. Thebottom two quadrants show the break-down of the computer device resource usagefor the top level model and the DrawBeam submodel. Most of the I/O time (988seconds) is in the DrawBeam step, the bottom-right quadrant shows that the I/O is fairlyevenly spread in the submodel: 0.12 secs. for both RetrieveBeam and FindNodes, 0.24 secs.for SetUpNode.
The results show that Design 1 clearly will not meet the performance goal of 10seconds, so we explore other possible designs.

- 14 -
SPE•EDTM
Display: Specify:
©1993 Performance EngineeringServices
Solve OK
Software mod Names
Results Values
Overhead Overhead
System model Service level
SPE database Sysmod globals
Save Scenario Open scenario
Add
Link Expand
Insert node
Software model
Drawmod
Drawmod
Initialize
Find Beams
Sort beams
beams
Draw beams
FinishFinish
Figure 9. Execution Graph for DrawMod scenario for Design 1
- 15 -
Lock Replace Delete Print
< 2.70< 5.14< 7.57< 10.00≥ 10.00
Resource Usage
0.198 CPU990.078 DEVs2.052 Display
Time, no contention: 992.329
0.272
0.214
1.270
990.512
0.060
Drawmod
Initialize
Find Beams
Sort beams
beams
Draw beam
FinishFinish
Lock Replace Delete Print
< 2.59< 5.06< 7.53< 10.00≥ 10.00
Time, no contention: 0.483
0.121
0.000
0.120
0.241
0.001
Draw beam
Retrieve beam
New beam
Find nodes
Each node
Set up node
DrawDraw
Lock Replace Delete Print
< 2.50< 5.00< 7.50< 10.00≥ 10.00
Resource demand:
Model totals
0.198 CPU990.078 DEVs2.052 Display
Drawmod
Initialize
Find Beams
Sort beams
beams
Draw beam
FinishFinish
CP 0.000DE 0.270Dis 0.002
CP 0.002DE 0.212Dis 0.000
CP 0.002DE 1.268Dis 0.000
CP 0.194DE 988.2Dis 2.050
CP 0.000DE 0.060Dis 0.0000.000
Lock Replace Delete Print
< 2.50< 5.00< 7.50< 10.00≥ 10.00
Resource demand:
Submodel totals
0.000 CPU0.482 DEVs0.001 Display
Draw beam
Retrieve beam
New beam
Find nodes
Each node
Set up node
DrawDraw
CP 0.000DE 0.121Dis 0.000
CP 0.000DE 0.000Dis 0.000
CP 0.000DE 0.120Dis 0.000
CP 0.000DE 0.241Dis 0.000
CP 0.000DE 0.000Dis 0.0010.001
Figure 10. Performance Results for Design 1.

- 16 -
6.2 Design 2Design 1 uses an object for each beam and node in the model. While this gives thedesign a great deal of flexibility, using an object for each node and beam is potentiallyexpensive in terms of both run-time overhead and memory utilization.
We can reduce this overhead by using the Flyweight pattern (Gamma, et al., 1995).Using the Flyweight pattern in ICAD allows sharing of beam and node objects andreduces the number of each that must be created in order to display the model. Eachmodel now has exactly one beam and node object. The node and beam objects containsintrinsic state, information that is independent of a particular beam or node (such ascoordinates). They also know how to draw themselves. Extrinsic state, coordinates andother information needed to store the model are stored separately. This information ispassed to the beam and node flyweights when it is needed.
The Flyweight pattern is applicable when (Gamma, et al., 1995):• the number of objects used by the application is large,• the cost of using objects is high,• most object state can be made extrinsic,• many objects can be replaced by fewer, shared objects once the extrinsic
state is removed, and• the application does not depend on object identity.
The SPE evaluation will determine if the ICAD application meets all of these criteria.
Instead of using an object for each Beam and Node, we use a shared object based onthe Flyweight pattern. The state information is removed from the Beam and Nodeclasses and is stored directly in Model. The Class Diagram for this design is shown inFigure 11.
Model
TriangleNode Beam Plate
Element
modelID : intbeams[] : Points
node1 : intnode2 : intnode3 : int…
nodeNo : intx : inty : intz : int…
node1 : intnode2 : int…
nodes[] : node…
elementNo : int
draw()
draw()draw()
draw()draw()
1..3
Figure 11. Class diagram for Design 2

- 17 -
The scenario resulting from this set of classes is shown in Figure 11. As shown inFigure 11, constructors for Node and Beam are executed only once, resulting in asavings of X constructor invocations.
iCAD aModel theDatabase
msc DrawMod
loop
aBeam aNode
new
open
find(modelID)
sort(beams)
retrieve(beam)
find(modelID, node1, node2)
retrieve(node1)
retrieve(node2)
new
draw(point1)
draw(point2)
close
draw(point1, point2)
new
draw
Figure 11. DrawMod scenario for Design 2
The changes to the execution graph for this design are trivial. The graph nodescorresponding to the “New” processing steps move from the yellow subgraph thatrepresents the DrawBeam processing step to the turquoise subgraph corresponding tothe Initialize processing step. This takes the corresponding resource requirements outof the loop that is executed 2050 times.
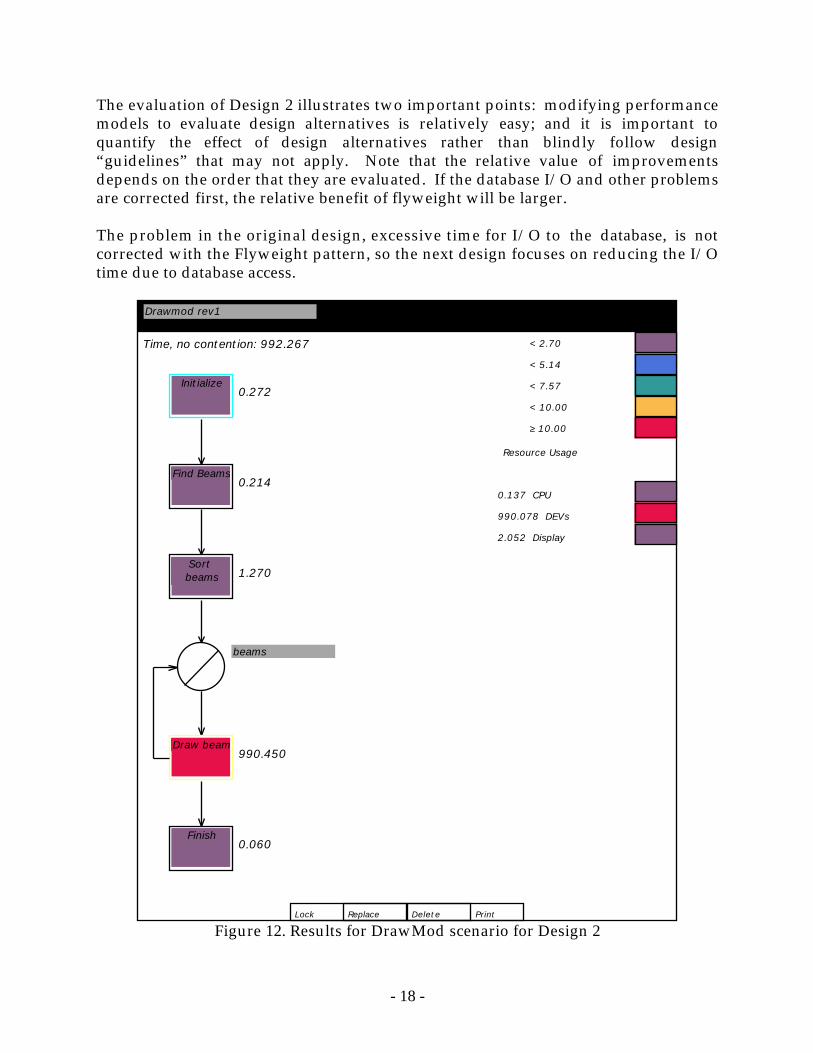
The overall response time is reduced from 992.33 to 992.27 seconds. The results of thesoftware execution model for this design indicate that using the Flyweight pattern didnot solve the performance problems with ICAD. Constructor overhead is not asignificant factor in the DrawMod scenario. The amount of constructor overhead usedin this case study was derived from a specific performance benchmark and will notgeneralize to other situations. It is compiler, operating system, and machinedependent; in our case constructors required no I/O. It is also design-dependent; inour example there is no deep inheritance hierarchy. It is also workload-dependent; inthis case the number of beams and nodes in the typical problem is relatively small.Nevertheless, we choose to retain the Flyweight-based design; it will help with muchlarger ICAD models where the overhead of using an object for each beam and nodemay become significant, making the design more scalable.
- 18 -
The evaluation of Design 2 illustrates two important points: modifying performancemodels to evaluate design alternatives is relatively easy; and it is important toquantify the effect of design alternatives rather than blindly follow design“guidelines” that may not apply. Note that the relative value of improvementsdepends on the order that they are evaluated. If the database I/O and other problemsare corrected first, the relative benefit of flyweight will be larger.
The problem in the original design, excessive time for I/O to the database, is notcorrected with the Flyweight pattern, so the next design focuses on reducing the I/Otime due to database access.
Lock Replace Delete Print
< 2.70
< 5.14
< 7.57
< 10.00
≥ 10.00
Resource Usage
0.137 CPU
990.078 DEVs
2.052 Display
Time, no contention: 992.267
0.272
0.214
1.270
990.450
0.060
Drawmod rev1
Initialize
Find Beams
Sort beams
beams
Draw beam
FinishFinish
Figure 12. Results for DrawMod scenario for Design 2

- 19 -
6.3 Design 3This design uses the same architecture as Design 2 (Figure 10) but modifies thedatabase management system with a new operation to retrieve a block of data withone call: retrieveBlock(). Design 3 uses this new operation to retrieve the beams andnodes once at the beginning of the scenario and stores the data values for all beamsand nodes with the model object rather than retrieve the value from the database eachtime it is needed. This new operation makes it possible to retrieve blocks containing20K of data at a time instead of retrieving individual nodes and beams1. A singleblock retrieve can fetch 64 beams or 170 nodes at a time. Thus, only 33 databaseaccesses are required to obtain all of the beams and 9 accesses are needed to retrievethe nodes.
The class diagram for Design 3 does not change from Design 2. Figure 13 shows theMSC that corresponds to the new database access protocol. The bold arrows indicatemessages that carry large amounts of data in at least one direction. Although thisnotation is not part of the MSC standard, we have found it useful to have a way ofindicating resource usage on scenarios that are intended for performance evaluation.
iCAD aModel theDatabase
msc DrawMod
loop
aBeam aNode
new
open
find(modelID)
retrieveBlock(beams)
find(nodes)
retrieveBlock(nodes)
new
draw(point1)
draw(point2)
close
draw(point1, point2)
new
draw
loop
loop match
Figure 13. DrawMod scenario for Design 3
1 Note: A block size of 20K is used here for illustration. The effect of using different block sizes could
be evaluated via modeling to determine the optimum size.

- 20 -
Figure 14 shows the execution graph corresponding to Figure 13 along with theresults for the “No Contention” solution. The time for Design 3 is approximately 8seconds – a substantial reduction.
Other improvements to this design are feasible, however, this serves to illustrate theprocess of creating software execution models from object-oriented designs andevaluating trade-offs. It shows that it is relatively easy to create the initial models, andthe revisions to evaluate design alternatives are straightforward. Analysts willtypically evaluate other aspects of both the software and system execution models tostudy configuration sizing issues and contention delays due to multiple users of ascenario and other workloads that may compete for computer system resources. Inthese additional performance studies, the most difficult aspect has been gettingreasonable estimates of processing requirements for new software before it is created.The process described here alleviates this problem. Once this data is in the softwareperformance model, the additional studies are straightforward and are not describedhere. Information about these additional performance models are in (Smith andWilliams, 1997).
Lock Replace Delete Print
< 2.81
< 5.21
< 7.60
< 10.00
≥ 10.00
Resource Usage
0.003 CPU
5.908 DEVs
2.052 Display
Time, no contention: 7.964
0.412
5.440
2.051
0.060
Drawmod design 3
Initialize
Get data
Each beam
Match and draw
Close DBClose DB
SPE•EDTM
Display: Specify:
©1993 Performance EngineeringServices
Solve OK
Software mod Names
Results Values
Overhead Overhead
System model Service level
SPE database Sysmod globals
Save Scenario Open scenario
Solution: View:No contention Residence time
Contention Rsrc demand
System model Utilization
Adv sys model SWmod specs
Simulation data Pie chart
Results screen
Figure 14. Execution Graph for DrawMod scenario for Design 3.

- 21 -
7 Summary and Conclusions
This paper has described a systematic approach to the performance engineering ofobject-oriented software that is critical to preventing performance failures.Performance failures may result in damaged customer relations, lost productivity forusers, lost revenue, cost overruns due to tuning or redesign, missed market windows,and, in the worst case, the need to completely re-design the product or even cancel theproject.
Object-oriented systems offer unique challenges for performance engineering due tothe complexity of interactions between objects and the trend toward distribution ofobjects over a network. However, our experience has shown that it is possible to cost-effectively engineer object-oriented systems that meet performance goals. This paperhas described the process of software performance engineering for object-orientedsystems and illustrated that process with a simple case study.
The key to this process is the employment of Use Case scenarios as a link betweenobject-oriented analysis and design models and performance models. Use casescenarios can be translated to execution graphs which serve as a starting point forperformance modeling. This connection is a key step in enabling the performanceevaluation of new object-oriented software systems. We illustrated the connectionwith a simple best-case software execution model. The software execution model issufficient for many architecture and design evaluations. Even when more complexperformance analysis is required, this first-step evaluation is essential to narrow theproblem space and focus on the problems requiring analysis. Thus, the modelingapproach uses deliberately simple models that are matched to the current level ofknowledge about the emerging software. These models become progressively moredetailed and sophisticated as more details about the software are known. Adaptivestrategies are used to manage uncertainty. Thus, the modeling effort matches the levelof knowledge about the emerging system and is less intrusive upon the developmentprocess.
The Use Case scenarios are vital to this SPE approach; they are also an important stepin the design process. Scenarios have been shown to be useful to designers forreasoning about the problem and its solution. Other advantages of Use Cases aredescribed in Section 3. Using scenarios as a starting point for the SPE analysis meansthat designers do not have to produce additional artifacts and performance analystshave a familiar description of workloads. This approach also facilitatescommunication between designers and performance analysts, lowering one of thebarriers to using SPE.
The case study in this paper omits an important step in the SPE process: specificationof software resource requirements. While it is a vital step in the process, the processof identifying specifications necessary, gathering data in performance walkthroughs,and specifying the performance data in the SPE tool is documented elsewhere (Smith,1990), (Smith and Williams, 1997). We are currently exploring an approach for

- 22 -
integrating the specification of performance requirements into Message SequenceCharts.
The case study illustrates the value of systematically connecting the softwarearchitecture and design models to SPE performance models. It provides quantitativedata for alternatives to ensure that performance goals can be achieved with theselected design thus precluding tuning that may disrupt the design. It permits projectmanagers to invest in alternatives that have a beneficial effect. Our technique forconnecting design and SPE performance models preserves the benefits of bothsystematic design methods and systematic application of SPE methods. Thispreservation results from our particular combination of design and performanceexperience. Preserving the benefits of design and performance engineering isessential to effectively meet performance objectives of new systems with a design thatis scalable, robust, maintainable, reusable and has other quality attributes.
This work is part of a larger project to make it easier for developers to perform initialperformance assessments. One of the principal barriers to the widespread acceptanceof SPE is the gap between the software developers who need performance assessmentsand the performance specialists who have the skill to conduct comprehensiveperformance engineering studies with today’s modeling tools. Thus, extra time andeffort are required to coordinate the design formulation and the design analysis. Thislimits the ability of developers to explore design alternatives. The matching of UseCase scenarios and performance scenarios, together with the use of a tool, such asSPE•ED, that automates key aspects of the SPE process represent a significant steptoward achieving this goal.
As noted in Section 4, the translation of MSCs to execution graphs is currently amanual process. However, the close correspondence between scenarios as expressed inMSCs and execution graphs suggests that an automated translation may be possible. Afuture project will explore this possibility. A previous project developed an SPE meta-model that defines the information requirements for SPE (Williams and Smith, 1995).The SPE meta-model can be used by CASE tool vendors to add the capability to collectperformance data as part of the design information. By collecting performance datawithin the design tool and automatically translating MSCs to execution graphs, it willbe possible to export data from the CASE tool to any SPE tool that supports the meta-model. Thus CASE tools need not replicate the performance expertise alreadyavailable. This offers a more cost-effective approach to supporting SPE. Our otherfuture work will address models of distributed object-oriented systems, thespecification of performance requirements, and additional tool features to automateSPE evaluations.
8 References
Auer, K. and K. Beck, Lazy Optimization: Patterns for Efficient SmalltalkProgramming, in Pattern Languages of Program Design, Volume 2, (J. Vlissides, et al., ed.),Addison-Wesley, 1996.
- 23 -
Baldassari, M., et al., PROTOB: A Hierarchical Object-Oriented CASE Tool forDistributed Systems, Proceedings of the European Software Engineering Conference, 1989,Coventry, England, (1989).
Baldassari, M. and G. Bruno, An Environment for Object-Oriented ConceptualProgramming Based on PROT Nets, in Advances in Petri Nets, Lectures in ComputerScience No. 340, ed.), Springer-Verlag, Berlin, 1988.
Beilner, H., et al., Towards a Performance Modeling Environment: News on HIT,Proceedings of the 4th International Conference on Modeling Techniques and Tools forComputer Performance Evaluation, Plenum Publishing, (1988).
Beilner, H., et al., The Hierarchical Evaluation Tool HIT, in Performance Tools and ModelInterchange Formats, (F. Bause and H. Beilner, ed.), Universität Dortmund, FachbereichInformatik, Dortmund, Germany, 1995.
Booch, G., Object-Oriented Analysis and Design with Applications, Benjamin/Cummings,Redwood City, CA, 1994.
Booch, G., Object-Oriented Design with Applications, Benjamin/Cummings, RedwoodCity, CA, 1991.
Buhr, R. J. A. and R. S. Casselman, Use Case Maps for Object-Oriented Systems, PrenticeHall, Upper Saddle River, NJ, 1996.
Buhr, R. J. A. and R. S. Casselman, Timethread-Role Maps for Object-Oriented Designof Real-Time and Distributed Systems, Proceedings of OOPSLA '94: Object-OrientedProgramming Systems, Languages and Applications, Portland, OR, 301-316 (1994).
Buhr, R. J. A. and R. S. Casselman, Architectures with Pictures, Proceedings of OOPSLA'92: Object-Oriented Programming Systems, Languages and Applications, Vancouver, BC,466-483 (1992).
Gamma, E., et al., Design Patterns: Elements of Reusable Object-Oriented Software,Addison-Wesley, Reading, MA, 1995.
Goettge, R. T., An Expert System for Performance Engineering of Time-CriticalSoftware, Porceedings of the Computer Measurement Group Conference, Orlando, FL, 313-320 (1990).
Grummitt, A., A Performance Engineer's View of Systems Development and Trials,Proceedings of the Computer Measurement Group Conference, Nashville, TN, 455-463(1991).

- 24 -
Hrischuk, C., et al., Automatic Generation of a Software Performance Model Using anObject-Oriented Prototype, Proceedings of the Third International Workshop on Modeling,Analysis, and Simulation of Computer and Telecommunication Systems, Durham, NC, 399-409 (1995).
ITU, Criteria for the Use and Applicability of Formal Description Techniques, MessageSequence Chart (MSC), International Telecommunication Union, 1996.
Jacobson, I., et al., Object-Oriented Software Engineering, Addison-Wesley, Reading, MA,1992.
Kruchten, P. B., The 4+1 View Model of Architecture, IEEE Software, 12(6), 42-50 (1995).
Rational Software Corporation, Unified Modeling Language: Notation Guide,Version 1.1, Rational Software Corporation, Santa Clara, CA, 1997.
Rolia, J. A., Predicting the Performance of Software Systems, University of Toronto,1992.
Rumbaugh, J., et al., Object-Oriented Modeling and Design, Prentice Hall, EnglewoodCliffs, NJ, 1991.
Selic, B., et al., Real-Time Object-Oriented Modeling, John Wiley and Sons, New York,1994.
Shlaer, S. and S. J. Mellor, Object Lifecycles: Modeling the World in States, Yourdon Press,Englewood Cliffs, NJ, 1992.
Shlaer, S. and S. J. Mellor, Object-Oriented Systems Analysis: Modeling the World in Data,Yourdon Press, Englewood Cliffs, NJ, 1988.
Smith, C. U., Performance Engineering of Software Systems , Addison-Wesley, Reading,MA, 1990.
Smith, C. U. and L. G. Williams, Performance Engineering Evaluation of Object-Oriented Systems with SPEED, in Computer Performance Evaluation: Modelling Techniquesand Tools, No. 1245, (R. Marie, et al., ed.), Springer-Verlag, Berlin, 1997.
Smith, C. U. and L. G. Williams, Software Performance Engineering: A Case StudyIncluding Performance Comparison with Design Alternatives, IEEE Transactions onSoftware Engineering, 19(7), 720-741 (1993).
Turner, M., et al., Simulating Optimizes Move to Client/Server Applications,Proceedings of the Computer Measurement Group Conference, Reno, NV, 805-814 (1992).

- 25 -
Williams, L. G., Information Requirements for Software Performance Engineering,Software Engineering Research, Boulder, CO, 1994.
Williams, L. G. and C. U. Smith, Information Requirements for Software PerformanceEngineering, in Quantitative Evaluation of Computing and Communication Systems, No. 977,(H. Beilner and F. Bause, ed.), Springer-Verlag, Heidelberg, Germany, 1995.