software risk assessment: fuzzy logic approach … logic requires a numerical input that allows a...
TRANSCRIPT

Date: 09 August 2012UNCLASSIFIED
UNCLASSIFIED
Software Risk Assessment: Fuzzy Logic Approach to
Risk Estimation(FLARE)
Presented to:International System Safety
Society
Presented by:
Dr. Willie Fitzpatrick, Dr. David Skipper, Josh McNeil, & J.P.
RogersSoftware Safety & AirworthinessSoftware Engineering Directorate
DISTRIBUTION STATEMENT B: Distribution authorized to U.S.Government Agencies and their contractors (Premature Dissemination, 11 April 2012). Other requests for this document shall be referred to US Army AMRDEC/SED-Aviation Division RDMR-BAV .

UNCLASSIFIED2 FLARE.pptx
UNCLASSIFIED
IntroductionProblem StatementProposed Solution
Fuzzy Logic Approach to Risk Estimation (FLARE)Using FLARE
Scoring ObjectivesProcessing ScoresEstimating Risk Possibility
Summary
FLAREOutlineFLAREOutline

UNCLASSIFIED3 FLARE.pptx
UNCLASSIFIED
Standard hardware and operations risk assessments include both the hazard severity and the mishap event likelihood
However, a widely accepted process for estimating software “risk” is not a standard activity in system level risk assessments
Predicting system level risk in terms of the composite of hardware, operations, and software risks is a desirable, but difficult objective, given the vagaries of a software risk assessment
This presentation proposes a fuzzy logic based approach to address the software risk assessment deficiency in the system level risk assessment.
FLAREIntroduction
FLAREIntroduction
UNCLASSIFIED4 FLARE.pptx
UNCLASSIFIED
FLAREProblem Statement
FLAREProblem Statement
Assessing hazard severity in linguistic terms (e.g. catastrophic, critical, etc.) is a straightforward activity, however, estimating the likelihood of a software safety failure is not a trivial process
Therefore, the typical software safety assessment is evidence/artifact driven and it’s results reflect the analyst’s confidence or belief in the “goodness” of the software’s safety characteristics relating to software failures
In other words, most software safety assessments are based on individual decisions analysts make
The analyst’s confidence or “belief” is the basis for estimating software safety risk

UNCLASSIFIED5 FLARE.pptx
UNCLASSIFIED
FLAREProblem Statement
FLAREProblem Statement
The Software System Safety discipline has adopted a safety assessment process for analysts that use both software hazard analysis objectives and software development objectives
These two sets of objectives are designed to reduce the likelihood of software safety failures
The objective produce the analyst’s primary evidence/artifacts and they are used to increase/decrease the analyst’s belief that the software has reduced/increased likelihood of failure
The problem with this process is the absence of an estimate for the likelihood of software safety failures and the difficulty of combining software “risk” with hardware/operations risk estimates
UNCLASSIFIED6 FLARE.pptx
UNCLASSIFIED
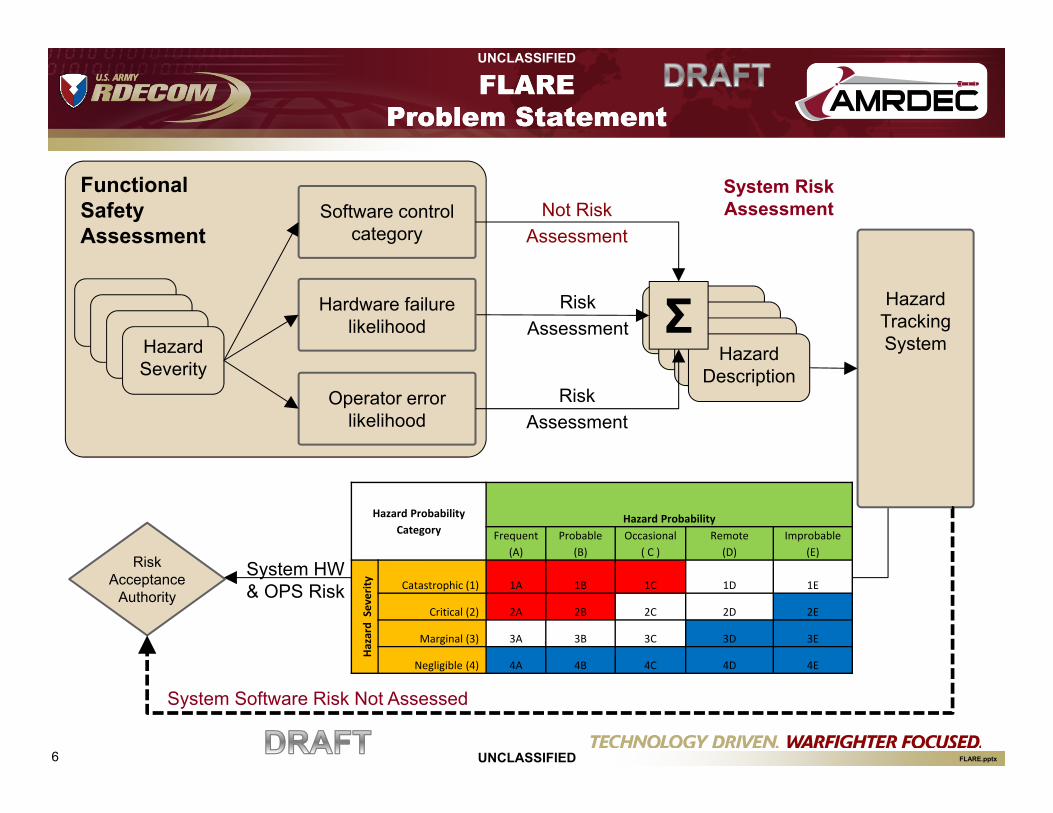
FunctionalSafetyAssessment
Hazard Description
Not RiskAssessment
FLAREProblem Statement
FLAREProblem Statement
Risk Acceptance
Authority
Σ
Software control category
Hardware failure likelihood
Operator error likelihood
System HW & OPS Risk
RiskAssessment
RiskAssessment
Hazard Tracking System
System Risk Assessment
System Software Risk Not Assessed
Hazard Severity
Hazard ProbabilityCategory
Hazard ProbabilityFrequent
(A)Probable
(B)Occasional
( C )Remote(D)
Improbable(E)
Hazard Severity Catastrophic (1) 1A 1B 1C 1D 1E
Critical (2) 2A 2B 2C 2D 2E
Marginal (3) 3A 3B 3C 3D 3E
Negligible (4) 4A 4B 4C 4D 4E

UNCLASSIFIED7 FLARE.pptx
UNCLASSIFIED
The software safety assessment process is best described as qualitative and the assessment results derive from the analyst’s cognition.
The challenge, therefore, was to formalize a generalized process which maps the analyst’s cognition, as it relates to “belief” in software safety assurance, to bounded likelihood categories (not discrete numeric estimates)
An advantage of the process would allow the likelihood of a software safety failure event to be described in familiar linguistic terms such as “frequent”, “occasional”, or “improbable”.
FLAREProposed Solution
FLAREProposed Solution

UNCLASSIFIED8 FLARE.pptx
UNCLASSIFIED
The proposed process is a “next step” toward maturing the software safety assessment process that provides a best estimate of the qualified software contribution to the system level risk.
Since the current approach to software safety assessment includes the same severity component used in HW and Ops, our “goal” is to qualitatively represent the “likelihood” of a software safety failure in order to better estimate the software’s contribution to system level risk.
This presentation describes a qualitative fuzzy logic approach for estimating the likelihood of software safety failures.
FLAREProposed Solution
FLAREProposed Solution

UNCLASSIFIED9 FLARE.pptx
UNCLASSIFIED
FunctionalSafetyAssessment
Hazard Description
FLAREProblem Statement
FLAREProblem Statement
Risk Acceptance
Authority
Σ
Software control category
Hardware failure likelihood
Operator error likelihood
System Risk (SW, HW, OPS)
RiskAssessment
RiskAssessment
Hazard Tracking System
System Risk Assessment
Hazard Severity
FLARE
Qualitative RiskAssessment
Hazard ProbabilityCategory
Hazard ProbabilityFrequent
(A)Probable
(B)Occasional
( C )Remote(D)
Improbable(E)
Hazard Severity Catastrophic (1) 1A 1B 1C 1D 1E
Critical (2) 2A 2B 2C 2D 2E
Marginal (3) 3A 3B 3C 3D 3E
Negligible (4) 4A 4B 4C 4D 4E
UNCLASSIFIED10 FLARE.pptx
UNCLASSIFIED
IntroductionProblem StatementProposed Solution
Fuzzy Logic Approach to Risk Estimation (FLARE)Using FLARE
Scoring ObjectivesProcessing ScoresEstimating Risk Possibility
Summary
FLAREOutlineFLAREOutline

UNCLASSIFIED11 FLARE.pptx
UNCLASSIFIED
Fuzzy numbers represent a possibility distribution over a real number line.
Possibility distributions capture what is possible versus what is probable.
However, in cases where probability is not available, possibility theory offers a framework to model the data limitations and manipulate them to develop boundaries for decisions.
FLARE employs fuzzy numbers to model the analyst’s beliefs.
These fuzzy numbers are manipulated by fuzzy logic to arrive at bounded decisions.
The FLARE process does not “magically” provide “good” decisions from an imperfect data set, merely traceable possibility boundaries.
Fuzzy Logic Approach to Risk Estimation (FLARE)
Fuzzy Logic Approach to Risk Estimation (FLARE)
UNCLASSIFIED12 FLARE.pptx
UNCLASSIFIED
Fuzzy logic concepts and operations employed in FLARE help to characterize and manage the qualitative characteristics found in software safety assessments.
The FLARE process associates qualitative belief in software safety assurance to a Software Risk Possibility (SRP) matrix.
FLARE provides a method for “assessment of confidence” by the analyst for each safety-significant requirement and function as required by MIL-STD-882E
Confidence in this context is not the same as mathematical confidence interval Here, it is a qualitative measure of analyst “belief” that satisfactory compliance with specific objectives will improve the “software safety goodness”, and thereby reduce the likelihood of software safety failures. For the remainder of this presentation, we will use “belief” in lieu of “confidence” to avoid confusion with probability terminology.
Fuzzy Logic Approach to Risk Estimation (FLARE)
Fuzzy Logic Approach to Risk Estimation (FLARE)
UNCLASSIFIED13 FLARE.pptx
UNCLASSIFIED
The set of hazard analysis and software development objectives prescribed by a given SwCI linguistic category (e.g. A, B, C, or High, Medium, Low) presently produce necessary and sufficient evidence to prove to the safety personnel that the software safety assurance meets the SwCI safety goals for the category
The software safety analyst is responsible for assessing the veracity of the evidence submitted as proof
Uncertainties in the assessment process may be due to: (1) human factors, and (2) inadequate data
These sources of uncertainty are not addressed in the FLARE process
Instead, FLARE, focuses on standardizing the aggregation of the assessment results from individual evidence items and analyses
Fuzzy Logic Approach to Risk Estimation (FLARE)
Fuzzy Logic Approach to Risk Estimation (FLARE)

UNCLASSIFIED14 FLARE.pptx
UNCLASSIFIED
The analyst’s “belief” in software safety assurance is assumed to be a qualitative estimate of the likelihood for a safe response to software errors.
FLARE does not specify how the safety analyst must reach their assessment only that they can and do make such an assessment.
Fuzzy Logic Approach to Risk Estimation (FLARE)
Fuzzy Logic Approach to Risk Estimation (FLARE)

UNCLASSIFIED15 FLARE.pptx
UNCLASSIFIED
IntroductionProblem StatementProposed Solution
Fuzzy Logic Approach to Risk Estimation (FLARE)Using FLARE
Scoring ObjectivesProcessing ScoresEstimating Risk Possibility
Summary
FLAREOutlineFLAREOutline
UNCLASSIFIED16 FLARE.pptx
UNCLASSIFIED
FLARE is based on the following assumptions:
(1) As each objective is completed, with sufficient quality, software safetyassurance is increased/decreased, which directly correlates to an increasedbelief in a safe/unsafe response to software errors
(2) Completion of all the prescribed objectives, with sufficient quality, willrepresent all due diligence required to result in the desired software safetyassurance
(3) The qualitative estimate for likelihood of software safety failures depends onthe specific objectives completed, the quality of the evidence, and theobjective’s contribution to software safety assurance.
Using FLAREUsing FLARE

UNCLASSIFIED17 FLARE.pptx
UNCLASSIFIED
• The FLARE process has three high level steps (see Figure 3):(1) Scoring objectives: Each compliance evidence artifact is assessed against
the objective’s requirements. Three assessment scoring criteria are used for each artifact: (a) Completeness, (b) Quality, and (c) Contribution. Completeness is an assessment of the percentage of key information provided by each of the evidence artifacts. Quality is an assessment of the goodness of each artifact. The Contribution criteria is an assessment of what extent the objective contributes to changing the likelihood of software safety failures.
(2) Processing Scores: The scores for each objective are numeric based inputs. These inputs are processed through a fuzzy logic transformation system to result in a range of possible values for the likelihood - Likelihood Range (P).
(3) Estimating Risk Possibility: The Likelihood Range is paired with the hazard severity category to estimate the Software Risk Possibility (SRP) (e.g. High, Medium, or Low).
Using FLAREUsing FLARE

UNCLASSIFIED18 FLARE.pptx
UNCLASSIFIED
Evidence Artifacts
SoftwareRisk
Possibility
Aggregation
Application of Fuzzy
Rules
Analyst Scores
%C1
%Q
%C2
Rule #1
Rule #2
Rule #3
Rule #4
Rule #5
…
Rule #n
ΣLikelihood
Range
Information flows from left to right.
Processing Scores
Hazard Severity
X
Estimating Risk Possibility
ScoringObjectives
Using FLAREUsing FLARE
UNCLASSIFIED19 FLARE.pptx
UNCLASSIFIED
• This section illustrates the FLARE method using the following information set:
– Hazard Description:• Source: Failure condition that prevents continued safe flight and
landing, or results in loss of aircraft.• Mechanism: Undetected incorrect flight information.• Outcome: Death or permanent total disability; system loss
– Software Contribution: Yes– Severity Category: Catastrophic– Software Control Category: Autonomous– Software Hazard Criticality Index: High (1[I])– Level-Of-Rigor (LOR): High (or SwCI-A) (requires significant analysis
and testing resources)
Using FLAREUsing FLARE

UNCLASSIFIED20 FLARE.pptx
UNCLASSIFIED
• The Program Manager Handbook for Flight Software Airworthiness providesobjectives that must be fulfilled.
• Our example data would require all 108 possible objectives be accomplishedto ensure SwCI-A compliance.
• In this context, compliance means complete and high qualityevidence/artifacts that establish levels of belief that software error leading tosoftware safety failures have been eliminated or acceptably mitigated.
• The FLARE process is used to evaluate each objective independently.
• For brevity, only one objective is further examined here.
Using FLAREUsing FLARE

UNCLASSIFIED21 FLARE.pptx
UNCLASSIFIED
For the first step in the fuzzy process, the analyst must score each software safety assurance objective by assessing the percent Complete, the percent Quality, and the percent Contribution to software safety assurance.
The assessment could be in linguistic terms (e.g. bad, okay, great) or exact values or interval based values (e.g. between 20 and 30%). All of these expressions of assessment can be represented as fuzzy numbers. The FLARE process example illustrates with exact values.
Each software safety assurance objective plays an independent role of varying degree in the software safety assessment process.
Fuzzy Logic requires a numerical input that allows a continuous progression from “worst” to “best”.
The approach chosen to rating Completeness, Quality, and Contribution is to apply percentages ranging from 0% to 100%.
Using FLAREScoring Objectives
Using FLAREScoring Objectives

UNCLASSIFIED22 FLARE.pptx
UNCLASSIFIED
Using FLAREScoring Objectives
Using FLAREScoring Objectives
List of Objectives SwCI Level Complete (%) Quality (%) Contribution (%)
Objective 1 A 25 50 96
Objective 2 A 43 87 75
Objective 3 A 89 12 15
. . . . . . . . . . . . . . . . . . . .
Objective n A 77 95 45
Example of scoring objectives
Function of SwCI level
Determined by the SCHI for a given SCSF (or hazard)
Software Safety Analyst’s scores based on review of compliance evidence

UNCLASSIFIED23 FLARE.pptx
UNCLASSIFIED
Using FLAREScoring Objectives
Using FLAREScoring Objectives
Compliance Consideration
Scoring Guidance Scoring Range
GeneralScoring results in a percent compliance value for a given compliance consideration where 0% is “worst” and 100% is “best”.
N/A
Completeness ( C )
Consider what key information is required to completely meet the requirements, or fully satisfy the objective. What percentage of the key information is addressed in the evidence? No key information would result in a score of 0% while all key information would result in a score of 100%.
0% <= C <= 100%
Quality (Q)
Consider the goodness, or grade, of the key information provided in the evidence. Do not consider the quality of key information not provided. Only consider the key information actually provided as evidence. Extremely low quality results in a score of 0% while extremely high quality results in a score of 100%.
0% <= Q <= 100%
Contribution (P)Assume the evidence provided is 100% complete and 100% quality. To what extent does the SwCI objective directly impact software safety assurance? No impact would result in a score of 0% while a very large impact would result in a score of 100%.
0% <= P <= 100%
UNCLASSIFIED24 FLARE.pptx
UNCLASSIFIED
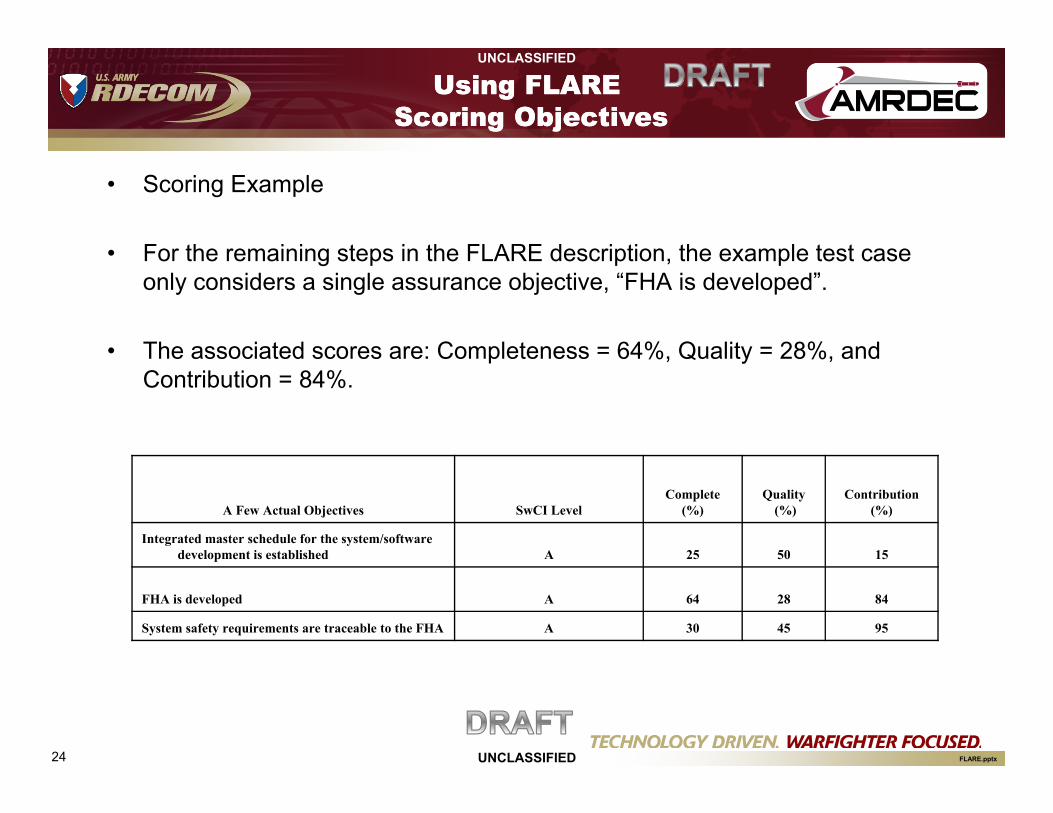
• Scoring Example
• For the remaining steps in the FLARE description, the example test case only considers a single assurance objective, “FHA is developed”.
• The associated scores are: Completeness = 64%, Quality = 28%, and Contribution = 84%.
A Few Actual Objectives SwCI LevelComplete
(%)Quality
(%)Contribution
(%)
Integrated master schedule for the system/software development is established A 25 50 15
FHA is developed A 64 28 84
System safety requirements are traceable to the FHA A 30 45 95
Using FLAREScoring Objectives
Using FLAREScoring Objectives

UNCLASSIFIED25 FLARE.pptx
UNCLASSIFIED
Using FLAREProcessing Scores
Using FLAREProcessing Scores
•Fuzzy sets and fuzzy numbers are used to represent “possible” values either as discrete items in a set or as continuous numeric values.
•The idea of what is “possible” is important to FLARE since there is some research that suggests that analysts assess possibilities in problems with uncertainty.
• Given that FLARE uses analyst assessments, representing and manipulating “possibility” seems natural.
•Fuzzy logic provides methods for performing logical operations on these fuzzy values and a fuzzy calculus can provide methods for performing math operations on fuzzy numbers.••Each fuzzy set can be identified by a linguistic variable scale to facilitate human interaction.
•Odd numbers of values in the scales are used to permit a middle ground to be stated.
UNCLASSIFIED26 FLARE.pptx
UNCLASSIFIED
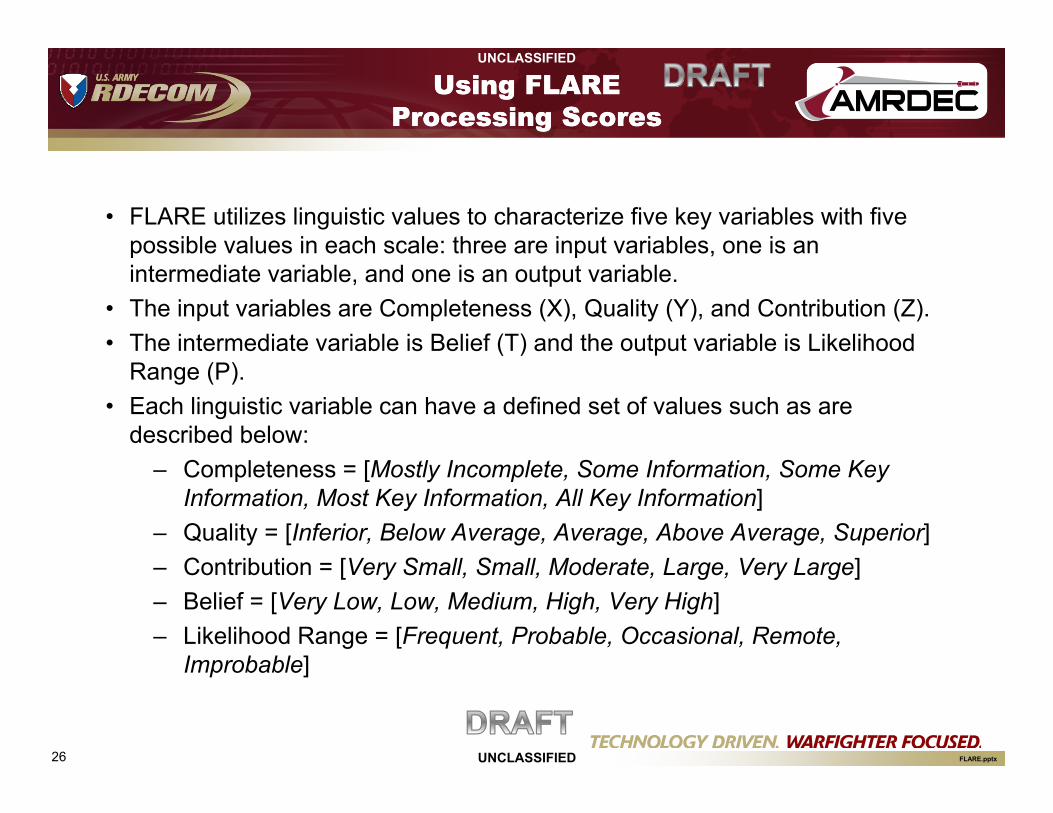
• FLARE utilizes linguistic values to characterize five key variables with five possible values in each scale: three are input variables, one is an intermediate variable, and one is an output variable.
• The input variables are Completeness (X), Quality (Y), and Contribution (Z). • The intermediate variable is Belief (T) and the output variable is Likelihood
Range (P). • Each linguistic variable can have a defined set of values such as are
described below:– Completeness = [Mostly Incomplete, Some Information, Some Key
Information, Most Key Information, All Key Information]– Quality = [Inferior, Below Average, Average, Above Average, Superior]– Contribution = [Very Small, Small, Moderate, Large, Very Large]– Belief = [Very Low, Low, Medium, High, Very High]– Likelihood Range = [Frequent, Probable, Occasional, Remote,
Improbable]
Using FLAREProcessing Scores
Using FLAREProcessing Scores

UNCLASSIFIED27 FLARE.pptx
UNCLASSIFIED
Using FLAREProcessing Scores
Using FLAREProcessing Scores
• Using human analyst oriented value ranges described using words like those above or words like “Small” and “Very Small” gives a relative association without defining hard boundaries.
• However, in order to make these relative associations meaningful, they must be associated with numeric sub-ranges of possible values that match reasonable responses from the linguistic population, i.e. the analysts.
• Representation of these responses is accomplished through the development of a range of possible numeric values for each linguistic value.
• In fuzzy logic, this range of possible values is represented by the “membership function”.
• Thus the “membership function” relates the members of a given linguistic value on a numeric value scale.

UNCLASSIFIED28 FLARE.pptx
UNCLASSIFIED
Using FLAREProcessing Scores
Using FLAREProcessing Scores
• In the case of the input variables, Completeness, Quality, & Contribution, thefuzzy value sub-ranges are taken from the full range of possible compliancescores (i.e. 0% to 100%).
• An example membership function for Completeness = “Some Key Information” isshown below.
• Note that the “Some Key Information” membership function will only respond tothe sub-range of analyst’s estimates of Completeness scores ranging from 30%to 70%.
• The shape of this membership function is not a square or rectangle of abruptchange because this function represents a decreasing possibility of membershipin “Some Key Information” as the values move away from 50%.

UNCLASSIFIED29 FLARE.pptx
UNCLASSIFIED
Using FLAREProcessing Scores
Using FLAREProcessing Scores
Contribution Membership Functions
0
0.2
0.4
0.6
0.8
1
0 10 20 30 40 50 60 70 80 90 100
Percent Contribution
Degree
of M
embe
rship Very Small
Small
Moderate
Large
Very Large
Contribution Estima
UNCLASSIFIED30 FLARE.pptx
UNCLASSIFIED
Using FLAREProcessing Scores
Using FLAREProcessing Scores
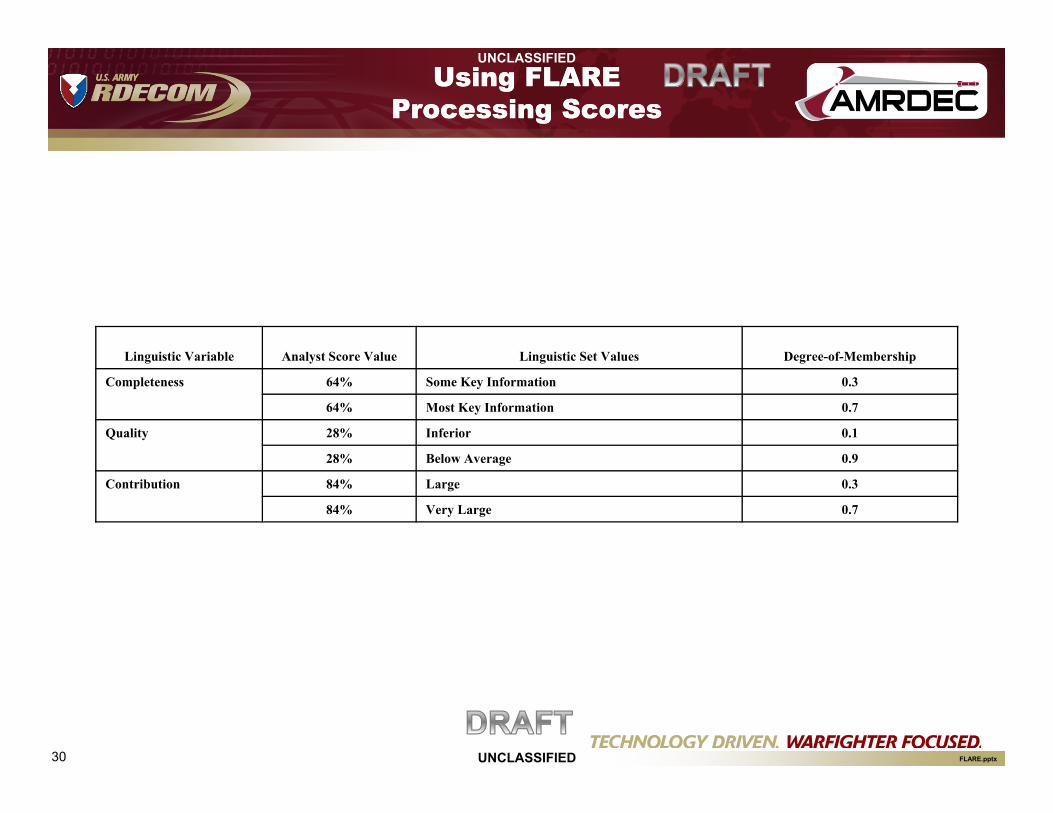
Linguistic Variable Analyst Score Value Linguistic Set Values Degree-of-Membership
Completeness 64% Some Key Information 0.3
64% Most Key Information 0.7
Quality 28% Inferior 0.1
28% Below Average 0.9
Contribution 84% Large 0.3
84% Very Large 0.7
UNCLASSIFIED31 FLARE.pptx
UNCLASSIFIED
Using FLAREProcessing Scores
Using FLAREProcessing Scores
• Examine the Completeness variable.
• Note that the Completeness variable has a degree of membership of 0.3 that completeness is described by the linguistic value “Some Key Information”.
• It also has a degree of membership of 0.7 that Completeness is described by “Most Key Information”.
• FLARE must account for both possible values.
• FLARE uses a fuzzy “rule” approach vice a fuzzy numeric approach to accomplish this.
• The “rules” describe relationships between values and linguistic variables.

UNCLASSIFIED32 FLARE.pptx
UNCLASSIFIED
Fuzzy logic systems use “rules” to describe relationships between the linguistic variables that comprise the FL system (FLS).
In a sense the rules are the logic component of the FLS.
Two rules are used in our fuzzy system. Their general expression in linguistic “if-then” format is shown below:
If Completeness = X and Quality = Y then Belief = T (Expression 1)
If Perfection = Z and Belief = T then Likelihood Range = P (Expression 2)
We have created two rule matrices to define the fuzzy rule responses.
The rule matrices will be employed later in the fuzzy process to estimate our Belief (T) in the compliance evidence and the Likelihood Range (P).
Using FLAREProcessing Scores
Using FLAREProcessing Scores

UNCLASSIFIED33 FLARE.pptx
UNCLASSIFIED
The Belief rule matrix is a mapping of the Completeness and Quality values to a Belief value.
The Likelihood Range rule matrix maps the Belief and Contribution values to the Likelihood Range values
Using FLAREProcessing Scores
Using FLAREProcessing Scores
Very Low (VL) Low (L) Medium (M) High (H) Very High (VH)
Belief (T)
Completeness (X)
Mostly Incomplete Some InformationSome Key
InformationMost key
InformationAll Key
Information
Quality (Y
)
Inferior VL VL VL VL VL
Below Average VL L L L L
Average VL L M M M
Above Average VL L M H H
Superior VL L M H VH
Likelihood Range (P)
Belief (T)
Very Low Low Medium High Very High
Contribution (Z
)
Very Small O R R R I
Small O O R R I
Moderate P O O R I
Large P P O R I
Very Large F P O R IFrequent (F), Probable (P), Occasional (O), Remote (R), Improbable (I)
UNCLASSIFIED34 FLARE.pptx
UNCLASSIFIED
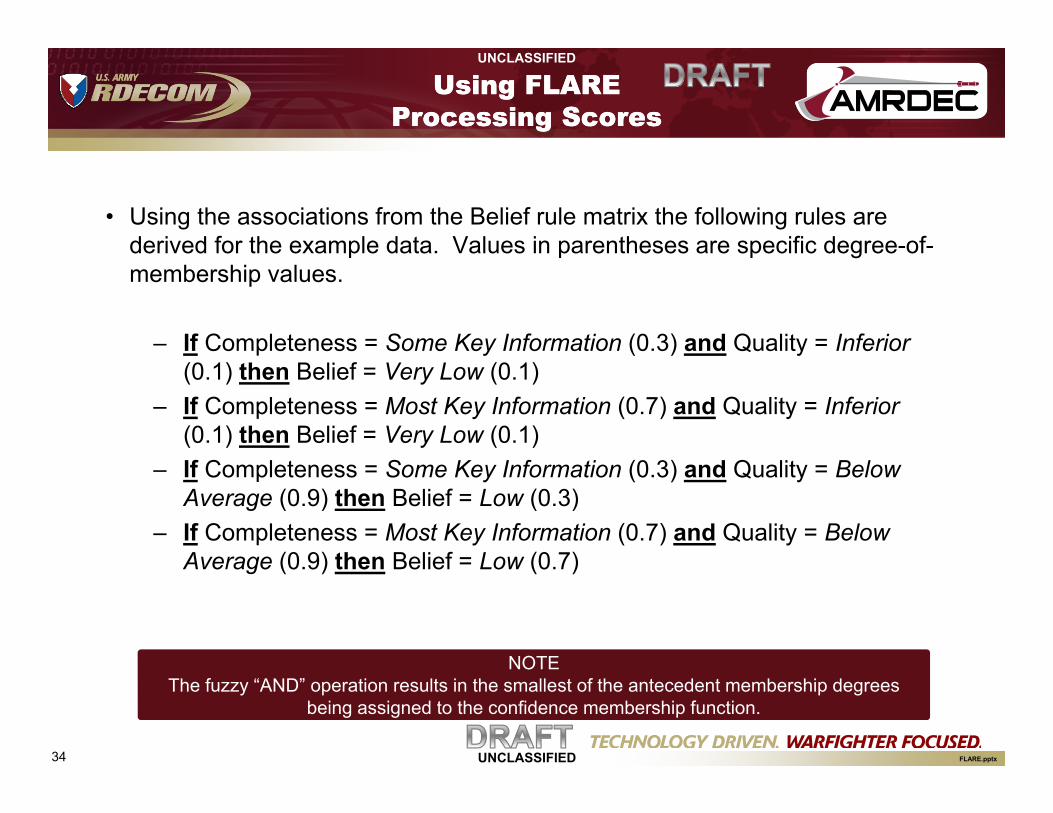
• Using the associations from the Belief rule matrix the following rules are derived for the example data. Values in parentheses are specific degree-of-membership values.
– If Completeness = Some Key Information (0.3) and Quality = Inferior (0.1) then Belief = Very Low (0.1)
– If Completeness = Most Key Information (0.7) and Quality = Inferior (0.1) then Belief = Very Low (0.1)
– If Completeness = Some Key Information (0.3) and Quality = Below Average (0.9) then Belief = Low (0.3)
– If Completeness = Most Key Information (0.7) and Quality = Below Average (0.9) then Belief = Low (0.7)
Using FLAREProcessing Scores
Using FLAREProcessing Scores
NOTEThe fuzzy “AND” operation results in the smallest of the antecedent membership degrees
being assigned to the confidence membership function.
UNCLASSIFIED35 FLARE.pptx
UNCLASSIFIED
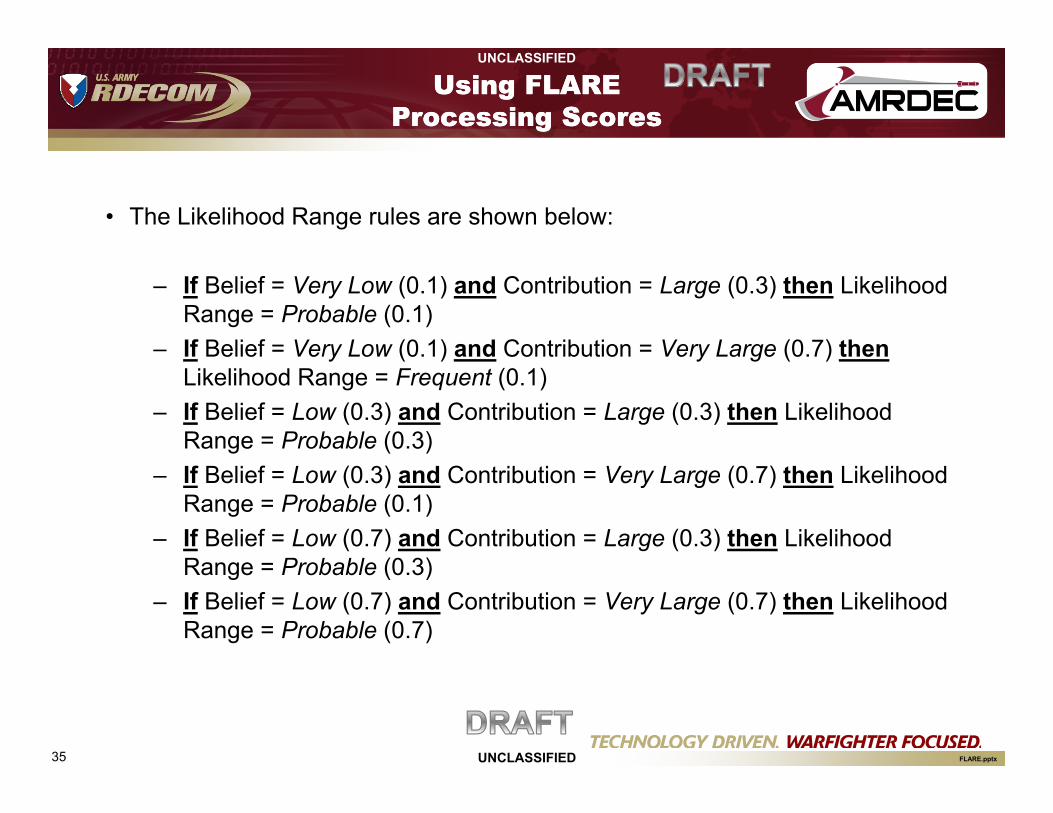
• The Likelihood Range rules are shown below:
– If Belief = Very Low (0.1) and Contribution = Large (0.3) then Likelihood Range = Probable (0.1)
– If Belief = Very Low (0.1) and Contribution = Very Large (0.7) thenLikelihood Range = Frequent (0.1)
– If Belief = Low (0.3) and Contribution = Large (0.3) then Likelihood Range = Probable (0.3)
– If Belief = Low (0.3) and Contribution = Very Large (0.7) then Likelihood Range = Probable (0.1)
– If Belief = Low (0.7) and Contribution = Large (0.3) then Likelihood Range = Probable (0.3)
– If Belief = Low (0.7) and Contribution = Very Large (0.7) then Likelihood Range = Probable (0.7)
Using FLAREProcessing Scores
Using FLAREProcessing Scores

UNCLASSIFIED36 FLARE.pptx
UNCLASSIFIED
Figure below shows the membership functions for Likelihood Range.
Note that this is a decreasing value size logarithmic scale on the positive X-axis.
The sub-ranges for the membership functions are derived from MIL-STD-882E
Using FLAREProcessing Scores
Using FLAREProcessing Scores
UNCLASSIFIED37 FLARE.pptx
UNCLASSIFIED
Using FLAREProcessing Scores
Using FLAREProcessing Scores
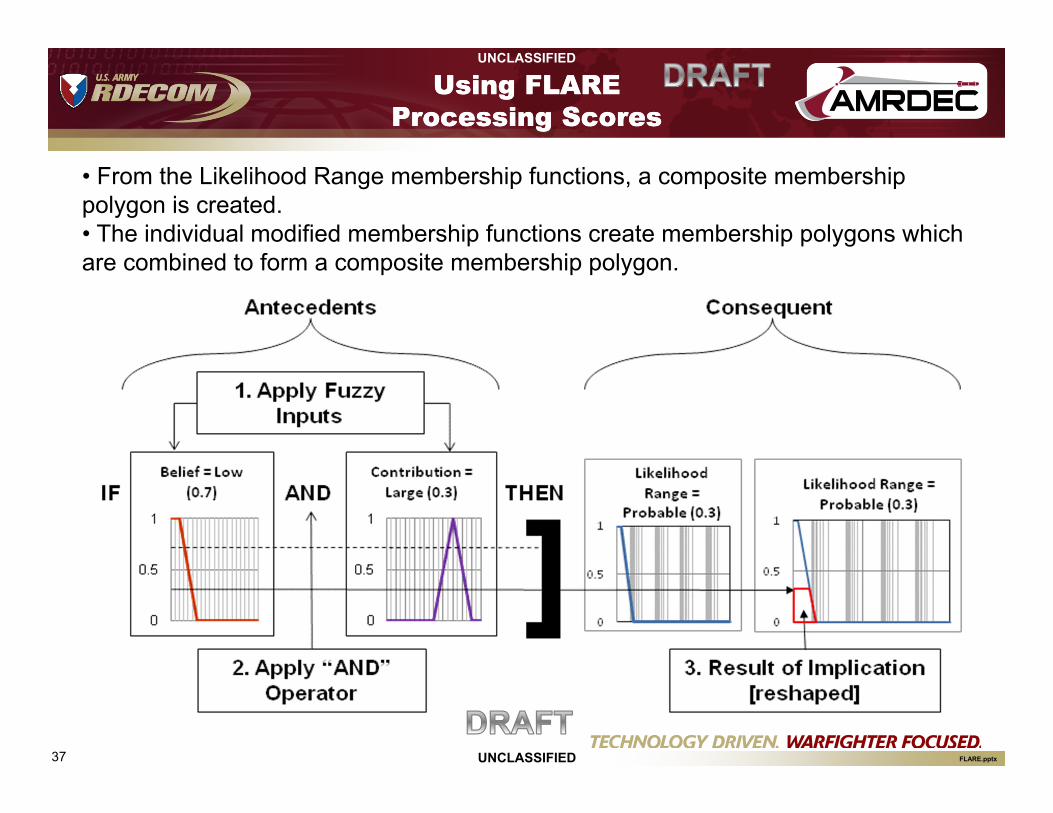
• From the Likelihood Range membership functions, a composite membership polygon is created. • The individual modified membership functions create membership polygons which are combined to form a composite membership polygon.

UNCLASSIFIED38 FLARE.pptx
UNCLASSIFIED
From the individual Likelihood Range membership functions we create a composite membership polygon using the modified boundaries of the individual membership functions.
The highest membership of the Frequent membership function is 0.1 and for the Probable function is 0.7. No other functions were intersected.
The individual modified membership functions create membership polygons which are combined to form a composite membership polygon.
The composite membership polygon is the dotted black line.
Using FLAREProcessing Scores
Using FLAREProcessing Scores

UNCLASSIFIED39 FLARE.pptx
UNCLASSIFIED
• The FLARE process uses a conservative approach and chooses the Likelihood Range value with the highest degree-of-membership, i.e. the most possible, to estimate the likelihood for software safety failure.
• If the degrees-of-membership are equal, FLARE chooses the left-most membership function (highest likelihood) on the graph.
• The result for the example data is Likelihood Range = “Probable”
Using FLAREProcessing Scores
Using FLAREProcessing Scores
Example Objective SwCI
Completeness (X) (%)
Quality (Y) (%)
Contribution (Z) (%)
Likelihood Range (P)
FHA is developed A 64 28 84 Probable

UNCLASSIFIED40 FLARE.pptx
UNCLASSIFIED
• In order to express this likelihood in terms of qualitative risk the likelihood must be paired with the SwCI severity.
• The FLARE team is currently examining approaches for this calculation. This section discusses one approach currently being evaluated.
• Using Likelihood Range value “Probable” and the Severity Category of “Catastrophic” from the example data the Software Risk Possibility (SRP) is 1B.
• The color coding in the SRP table corresponds to risk acceptance levels High (red), Serious (orange), Medium (yellow), and Low (green)..
Using FLAREEstimating Risk Possibility
Using FLAREEstimating Risk Possibility
Software RiskPossibility (SRP)
Likelihood Range (P)
Frequent(A)
Probable(B)
Occasional ( C )
Remote(D)
Improbable(E)
SHCI Severity
Catastrophic (1) 1A 1B 1C 1D 1E
Critical (2) 2A 2B 2C 2D 2E
Marginal (3) 3A 3B 3C 3D 3E
Negligible (4) 4A 4B 4C 4D 4E
UNCLASSIFIED41 FLARE.pptx
UNCLASSIFIED
Using the FLARE process allows the compliance evidence for each assurance objective to be assessed independently from all other objectives.
This in turn allows the analyst to portray the specific objectives which need the most attention.
For example, if all the objectives for the example hazard information are assessed the results would provide the SRP value and qualitative risk for each objective.
The qualitative software risk information can be portrayed with intrinsic resource allocation priorities for risk reduction activities.
Using FLAREEstimating Risk Possibility
Using FLAREEstimating Risk Possibility

UNCLASSIFIED42 FLARE.pptx
UNCLASSIFIED
In the table below, we assume two out of the 108 objectives contribute “Frequent” likelihood of software safety failures and 106 objectives contribute “Improbable” likelihood.
Since “Catastrophic” severity and “Frequent” likelihood indicate the overall risk is “High”, the program office (PO) will need to reduce the “Frequent” likelihood for two specific objectives to the “Improbable” range in order to accept the residual risk without higher command approval.
With this method, the PO can target unique risk reduction actions to specific assurance objectives based on the analysis details.
Using FLAREEstimating Risk Possibility
Using FLAREEstimating Risk Possibility
Software RiskCategory (SRC)
Likelihood Range (P)
Frequent(A)
Probable(B) Occasional ( C )
Remote(D)
Improbable(E)
SHCI Severity Catastrophic (1) 2 0 0 0 106
Critical (2) 0 0 0 0 0
Marginal (3) 0 0 0 0 0
Negligible (4) 0 0 0 0 0

UNCLASSIFIED43 FLARE.pptx
UNCLASSIFIED
All the Likelihood Range values in the example need to be “Improbable” atthe least in order to lower the overall qualitative SRP to Medium (yellowcolored blocks).
The tables below show the risk gaps in terms of percent Complete andpercent Quality.
Using FLAREEstimating Risk Possibility
Using FLAREEstimating Risk Possibility
Example Objective
SwCI Level Complete (%) Quality (%) Contribution (%) Likelihood Range SRP Qualitative Risk
FHA is developed A 64 28 84 Probable 1B High
Example Objective
SwCI Level Complete (%) Quality (%)
Contribution (%) Likelihood Range SRP Qualitative Risk
FHA is developed AIncrease score from
64 to 81Increase score from 28 to 81 84 Improbable 1E Medium
UNCLASSIFIED44 FLARE.pptx
UNCLASSIFIED
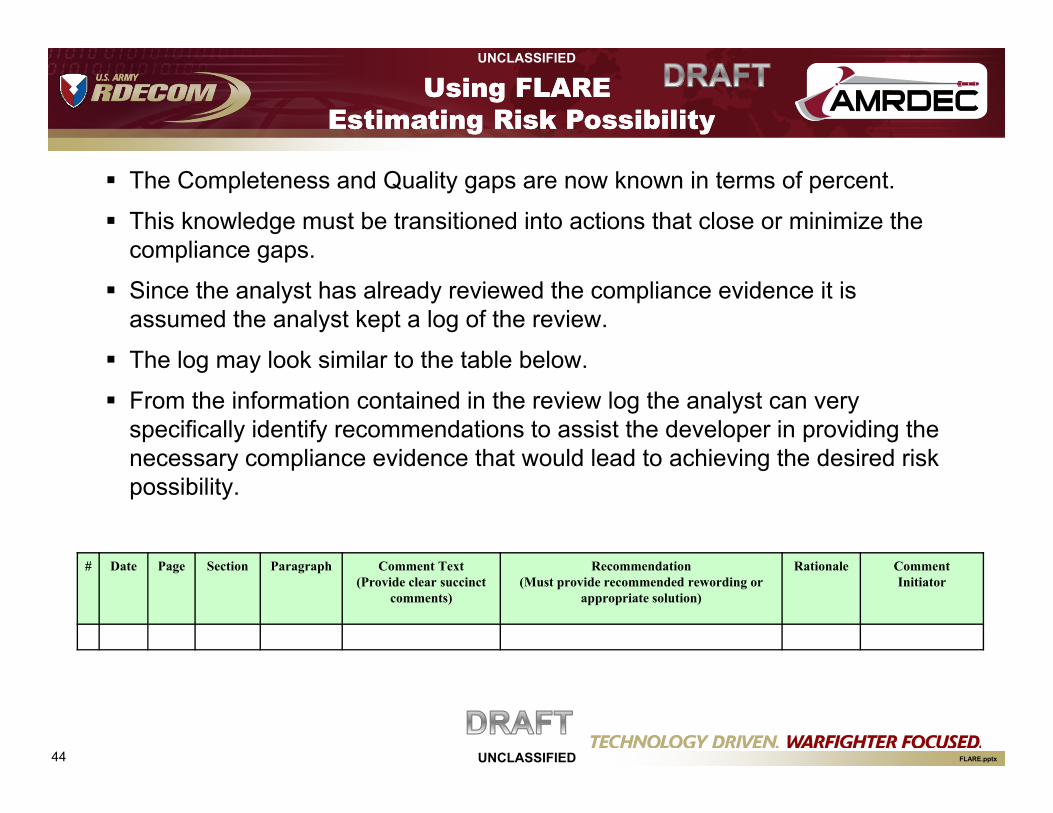
The Completeness and Quality gaps are now known in terms of percent.
This knowledge must be transitioned into actions that close or minimize the compliance gaps.
Since the analyst has already reviewed the compliance evidence it is assumed the analyst kept a log of the review.
The log may look similar to the table below.
From the information contained in the review log the analyst can very specifically identify recommendations to assist the developer in providing the necessary compliance evidence that would lead to achieving the desired risk possibility.
Using FLAREEstimating Risk Possibility
Using FLAREEstimating Risk Possibility
# Date Page Section Paragraph Comment Text (Provide clear succinct
comments)
Recommendation(Must provide recommended rewording or
appropriate solution)
Rationale Comment Initiator
UNCLASSIFIED45 FLARE.pptx
UNCLASSIFIED
• The FLARE process incorporates and uniquely handles four difficult issues that plague software system safety hazard analyses:
– Estimating software failure probability is very difficult and expensive, – Decisions are subjective, – Data are imprecise, and – Software safety risk is never quantified or qualified.
• Two key advantages of FLARE are:– Specific (highly focused) risk reduction activities can be recommended
to the PO and/or developer – Qualitative software risk possibility can be compared on par with
hardware and operations risk estimates.
• Almost every step in the FLARE process can be tailored to a program’s unique requirements
• The FLARE process is easily automated.
FLARESummary
FLARESummary
UNCLASSIFIED46 FLARE.pptx
UNCLASSIFIED
During the development of the basic FLARE process, the team encountered several items that require additional examination.
Among the high interest items are the analyst’s belief in the rules stated previously. This is distinct from the belief in the data sets and it requires additional steps to account for this factor. These steps are not addressed above.
A second high interest item is utilization of a fuzzy mathematical approach as an alternative to the rule based approach shown here.
Develop consistent criteria for assessing percent Complete and percent Quality.
Develop standardized values for percent Contribution using SME input.
Assess whether the Likelihood Range membership with the highest membership degree should represent the Likelihood Range or should the priority be area of the membership polygon?
FLAREFuture Direction
FLAREFuture Direction