soil quality assessment in black soils of veppanthattai of
TRANSCRIPT

An Asian Journal of Soil ScienceVolume 8 | Issue 1 | June, 2013 | 1-11
Soil quality assessment in black soils of Veppanthattai ofPerambalur district, Tamil Nadu
RAJESHWAR MALAVATH AND S. MANI
HIND AGRICULTURAL RESEARCH AND TRAINING INSTITUTE
MEMBERS OF RESEARCH FORUM :
Received : 12.11.2012; Revised : 01.02.2013; Accepted : 01.03.2013
SummaryA detailed study on soil quality assessment in black soils of Veppanthattai of Perambalur district, Tamil Naduwas carried out with the objective to assess the available nutrients and their relationship with variousphysical, physiochemical properties and nutrients status in surface and subsurface soils. Soil samples werecollected at a depth of 0-15cm and 15-30cm for analysis. The soils were moderately alkaline to stronglyalkaline in reaction and non-saline in nature, low to medium in organic carbon and high in cation exchangecapacity. The available N, P, K and S ranged from 120.0-235, 21.0-34.0, 120.0-268.0 kg ha-1, and 33.6-49.1mg kg-1, respectively. The available Zn, Cu, Mn and Fe and B varied from 0.72-3.97, 0.84-1.71, 7.29-15.84,2.06-7.45 and 1.47-2.37 mg kg-1 in surface soils, respectively. The surface soils (0-15 cm) are low inavailable N, medium to high in available P, medium in available K and high in available S. Further, the soilswere deficient in available Fe, deficient to sufficient in available Zn and Cu, high in available Mn and B in thesurface samples. The pH had significantly positive correlation with EC and exchangeable Ca (r = 0.392**and 0.240*) and it was negatively correlated with organic carbon, N, P, S and Zn (r = -0.291*, -0.228*, -0.304**,-0.392** and 0.345**), respectively. The organic carbon had significantly positive correlationwith available N. P, K, S, Zn, Cu, Mn, Fe and B (r = 0.796**, 0.810**, 0.575**, 0.869**,0.663**,0.458**,395** 0.442**, and 0.719**) and it was significantly negative correlated with exchangeable Ca,Mg, Na, and CEC (r=-0.543**, -0.241*, -0.262* and -0.372**), respectively.
Key words : Black soil, Soil quality, Physical, physico-chemical properties, Available nutrients, Correlation
How to cite this article : Malavath, Rajeshwar and Mani, S. (2013). Soil quality assessment in black soilsof Veppanthattai of Perambalur district, Tamil Nadu. Asian J. Soil Sci., 8(1): 1-11.
Research Article
Corresponding author :RAJESHWAR MALAVATH,Department of Soil Science andAgricultural Chemistry, AgriculturalCollege and Research Institute,(TNAU) COIMBOTRE (T.N.) INDIAEmail: [email protected]
Co-authors :S. MANI, Department of SoilScience and Agricultural Chemistry,Agricultural College and ResearchInstitute, (TNAU) COIMBOTRE (T.N.)INDIA
IntroductionThe soil fertility status exhibits the status of different
soils with regard to amount and availability of nutrientsessential for plant growth. The crop growth and yield largelydepend upon potent ial of soil r esources and theircharacteristic provides water, nutrients and anchorage forthe growth and yield of crops. Soil fertility is an importantfactor, which determines the growth of plant. Soil fertilityis determined by the presence or absence of nutrients i.e.macro and micronutrients. Out of the 16 plant nutrients N,P, K, S, zinc, copper, iron, manganese, molybdenum, chlorineand boron are essential for plant growth in high and minutequantity. The availability of nutrients is particularlysensitive to changes in soil environment. The factors that
affect the contents of such nutrients are organic matter,soil pH, lime content, sand, silt, and clay contents revealedfrom different research experiments. The detail field wisestudy of physico-chemical characteristics, available macro,secondary and micronutrients status in the surface andsub surface soils aid in determining the soils potential,which are essential for better scientific utilization of landuse planning for crop growth. Keeping in view abovepoints, the detailed micro level study was conducted toassess the physical, physico-chemical characteristics andavailable nutrient status of red and lateritic soil. In orderto provide a base line data and information, the detailedfield wise study was taken at Cotton Research Station,Veppanthattai of Perambalur district of Tamil Nadu

HIND AGRICULTURAL RESEARCH AND TRAINING INSTITUTE 2 Asian J. Soil Sci., (June, 2013) 8 (1) :
Resource and Research MethodsLocation and site characteristic of study area :
The Perambalur is a centrally located, inland district ofTamil Nadu, spread over an area of 3690 km2, bounded byCuddalore district in the North, Tiruchirappalli district in theSouth, Thanjavur in the East and Namakkal and Tiruchirappallidistricts in the West. It lies between 100 53' and 11o 31' ofNorth latitude and 78 0 38' and 79 o 31' of East longitude. Thedistrict lies in the southern plateau and Hill zone of agro-climate regional planning with characteristics of semi-aridclimate. It is a dry, sub humid coastal plain of Tamil Naduincluding Cauvery delta zone with a growing period of 150-180 days and moderately large moisture availability. The totalnormal rainfall in the district is about 908 mm, little less thanthe state average of 946.9 mm. Out of the total rainfall, 52 percent is received during North East monsoon (October toDecember) and 35 per cent during South West monsoon (Juneto September) and the remaining 13 per cent during winterand summer months. The mean annual temperature is above280 C and the difference between the mean summer (April toJune) and mean winter temperature (November to February)is less than 50 C. The hot months are April, May and June withthe maximum temperature ranging from 380 C to 400C and thecool months being January and February with the minimumtemperature ranging from 200 C to 210 C.
The main mandate of the Cotton Research Station,Veppanthattai of TNAU functioning from 09.05.2007 is todevelop suitable cotton hybrids/varieties for the regions, withthe long term objectives of increasing the productivity andquality of cotton, to develop suitable cotton based croppingsystem for the region and impart training to the farmers onhybrid seed production. The Research station extending overan area of 22.16 ha bounded in between 11 o.32656’ N latitudeand 78 o.83239’E longitudes and situated at an altitude of 149m above mean sea level. Physiographically the land wascharacterized by flat terrain level to nearly level. The soils ofthe research station were very deep, calcareous, clayey,moderately well drained with slow permeability and lowhydraulic conductivity. The soil moisture control section weredry for more than 90 cumulative days or 45 consecutive daysin the months of summer solstice and qualifies for Ustic soilmoisture regime.
The natural vegetation existing in the study area weregrasses, shrubs, thorny bushes such as Cynodon dactylon,Cyprus rotundus, Butea frondosa, Dalbergia latifolia,Azadirachta indica, Tectona grandis, Terminalia tomertoseand Acacia spp. Prosopis juliflora, Cacia sp., broad leaf weedssuch as Selotia, Parthenium, Euforbia sps., etc.
In order to delineate the detailed field wise morphological,physico-chemical characteristics, available nutrients statusin the surface and sub surface soils, 38 surface (0-15 cm) and38 sub-surface (15-30 cm) soil samples were collected from 5
different blocks of research station. Five to six pits were dugfor each sample in every field. From each pit sample wascollected at a depth of 0-15cm and 15-30cm. A compositesample of about 1kg was taken through mixing of representedsoil samples. The soil samples were air-dried in shade,processed and screened through a 2 mm sieve. After sievingall the samples were packed in the polythene bags for analysis.
Methods used for analysis :The soil samples representing each of the fields were
characterized for important physical, physico-chemicalproperties using standard procedures. Particle size analysiswas done according to international pipette method (Piper,1966), bulk density (Blake and Hartze, 1986), water holdingcapacity (Sankaram, 1966), soil pH and EC was determined in1:2.5 soil water suspensions. exchangeable cations (Jackson,1973), cation exchange capacity (Chapman, 1965), organiccarbon and free calcium carbonate were determined (Walklyand black, 1934 and Piper, 1966) . The available nitrogen wasdetermined by kjeldal method, available phosphorus wasestimated by spectrophotometer (Olsen method) andpotassium by flame emission method (Jackson, 1973). Availablesulphur in the soil was extracted using 0.15% CaCl
2 solution
(Williams and Steinbergs,1959). The available micronutrientswere determined using the method given by Lindsay andNorvell (1978).Hot water soluble (HWS) boron was determinedby using method as described by Jackson, (1958).
Research Findings and DiscussionThe results of the present study as well as relevant
discussions have been presented under following sub heads:
Soil characteristics :The soils distinguished by high amounts of shrink-swell
clays resulting in deep, wide cracks in the dry seasons.Shrinking of the drying soil mass induces cracks which havea polygonal appearance. Vertically oriented cracks expose largeblocks or prisms at the surface part of the soil. The cracks arewide, about 3 to 8cm, and become progressively deeper as thesoil dries out. The surface soils show a self-mulching. Theswell-shrink soils on wetting develop a characteristic microrelief consisting of low mounds and shallow depressions.
Physical characteristics :Physical characteristics of soil are presented in Table
1.The clay, silt and sand content ranged from 58.1 to 64.1, 14.4to 19.6 and 18.0 to 26.3 per cent in surface soils and 60.2 to67.2,13.2 to 18.1 and 18.7 to 23.4 per cent subsurface soils,respectively. Clay was more or less uniformly distributed withinthe surface and subsurface soils. The low proportion of sandand silt in these soils might be related to the parent material inwhich the soils develop. The bulk density values ranged from
RAJESHWAR MALAVATH AND S. MANI
1-11

HIND AGRICULTURAL RESEARCH AND TRAINING INSTITUTE 3 Asian J. Soil Sci., (June, 2013) 8 (1) :
SOIL QUALITY ASSESSMENT IN BLACK SOILS OF VEPPANTHATTAI OF PERAMBALUR DISTRICT, TAMIL NADU, INDIA
1-11
HIND AGRICULTURAL RESEARCH AND TRAINING INSTITUTE 4 Asian J. Soil Sci., (June, 2013) 8 (1) :
RAJESHWAR MALAVATH AND S. MANI
1-11

HIND AGRICULTURAL RESEARCH AND TRAINING INSTITUTE 5 Asian J. Soil Sci., (June, 2013) 8 (1) :
SOIL QUALITY ASSESSMENT IN BLACK SOILS OF VEPPANTHATTAI OF PERAMBALUR DISTRICT, TAMIL NADU, INDIA
1-11
HIND AGRICULTURAL RESEARCH AND TRAINING INSTITUTE 6 Asian J. Soil Sci., (June, 2013) 8 (1) :
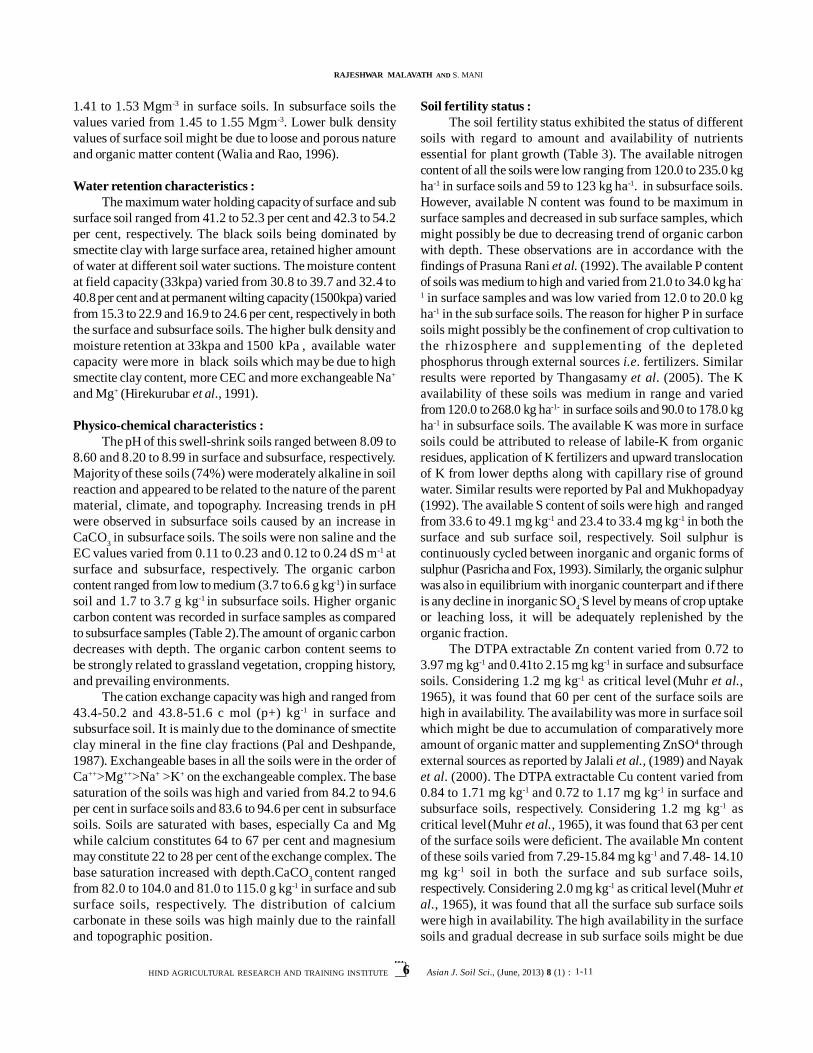
1.41 to 1.53 Mgm-3 in surface soils. In subsurface soils thevalues varied from 1.45 to 1.55 Mgm-3. Lower bulk densityvalues of surface soil might be due to loose and porous natureand organic matter content (Walia and Rao, 1996).
Water retention characteristics :The maximum water holding capacity of surface and sub
surface soil ranged from 41.2 to 52.3 per cent and 42.3 to 54.2per cent, respectively. The black soils being dominated bysmectite clay with large surface area, retained higher amountof water at different soil water suctions. The moisture contentat field capacity (33kpa) varied from 30.8 to 39.7 and 32.4 to40.8 per cent and at permanent wilting capacity (1500kpa) variedfrom 15.3 to 22.9 and 16.9 to 24.6 per cent, respectively in boththe surface and subsurface soils. The higher bulk density andmoisture retention at 33kpa and 1500 kPa , available watercapacity were more in black soils which may be due to highsmectite clay content, more CEC and more exchangeable Na+
and Mg+ (Hirekurubar et al., 1991).
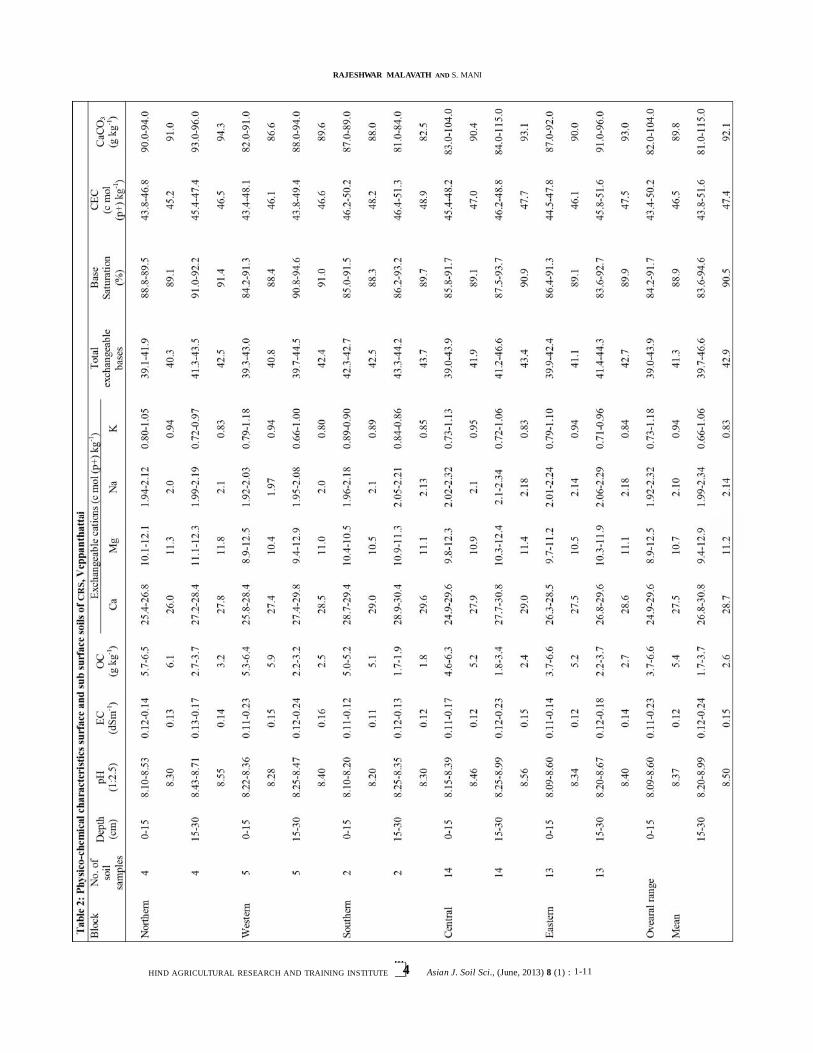
Physico-chemical characteristics :The pH of this swell-shrink soils ranged between 8.09 to
8.60 and 8.20 to 8.99 in surface and subsurface, respectively.Majority of these soils (74%) were moderately alkaline in soilreaction and appeared to be related to the nature of the parentmaterial, climate, and topography. Increasing trends in pHwere observed in subsurface soils caused by an increase inCaCO
3 in subsurface soils. The soils were non saline and the
EC values varied from 0.11 to 0.23 and 0.12 to 0.24 dS m-1 atsurface and subsurface, respectively. The organic carboncontent ranged from low to medium (3.7 to 6.6 g kg-1) in surfacesoil and 1.7 to 3.7 g kg-1 in subsurface soils. Higher organiccarbon content was recorded in surface samples as comparedto subsurface samples (Table 2).The amount of organic carbondecreases with depth. The organic carbon content seems tobe strongly related to grassland vegetation, cropping history,and prevailing environments.
The cation exchange capacity was high and ranged from43.4-50.2 and 43.8-51.6 c mol (p+) kg-1 in surface andsubsurface soil. It is mainly due to the dominance of smectiteclay mineral in the fine clay fractions (Pal and Deshpande,1987). Exchangeable bases in all the soils were in the order ofCa++>Mg++>Na+ >K+ on the exchangeable complex. The basesaturation of the soils was high and varied from 84.2 to 94.6per cent in surface soils and 83.6 to 94.6 per cent in subsurfacesoils. Soils are saturated with bases, especially Ca and Mgwhile calcium constitutes 64 to 67 per cent and magnesiummay constitute 22 to 28 per cent of the exchange complex. Thebase saturation increased with depth.CaCO
3content ranged
from 82.0 to 104.0 and 81.0 to 115.0 g kg-1 in surface and subsurface soils, respectively. The distribution of calciumcarbonate in these soils was high mainly due to the rainfalland topographic position.
Soil fertility status :The soil fertility status exhibited the status of different
soils with regard to amount and availability of nutrientsessential for plant growth (Table 3). The available nitrogencontent of all the soils were low ranging from 120.0 to 235.0 kgha-1 in surface soils and 59 to 123 kg ha-1. in subsurface soils.However, available N content was found to be maximum insurface samples and decreased in sub surface samples, whichmight possibly be due to decreasing trend of organic carbonwith depth. These observations are in accordance with thefindings of Prasuna Rani et al. (1992). The available P contentof soils was medium to high and varied from 21.0 to 34.0 kg ha-
1 in surface samples and was low varied from 12.0 to 20.0 kgha-1 in the sub surface soils. The reason for higher P in surfacesoils might possibly be the confinement of crop cultivation tothe rhizosphere and supplementing of the depletedphosphorus through external sources i.e. fertilizers. Similarresults were reported by Thangasamy et al. (2005). The Kavailability of these soils was medium in range and variedfrom 120.0 to 268.0 kg ha-1- in surface soils and 90.0 to 178.0 kgha-1 in subsurface soils. The available K was more in surfacesoils could be attributed to release of labile-K from organicresidues, application of K fertilizers and upward translocationof K from lower depths along with capillary rise of groundwater. Similar results were reported by Pal and Mukhopadyay(1992). The available S content of soils were high and rangedfrom 33.6 to 49.1 mg kg-1 and 23.4 to 33.4 mg kg-1 in both thesurface and sub surface soil, respectively. Soil sulphur iscontinuously cycled between inorganic and organic forms ofsulphur (Pasricha and Fox, 1993). Similarly, the organic sulphurwas also in equilibrium with inorganic counterpart and if thereis any decline in inorganic SO
4-S level by means of crop uptake
or leaching loss, it will be adequately replenished by theorganic fraction.
The DTPA extractable Zn content varied from 0.72 to3.97 mg kg-1 and 0.41to 2.15 mg kg-1 in surface and subsurfacesoils. Considering 1.2 mg kg-1 as critical level (Muhr et al.,1965), it was found that 60 per cent of the surface soils arehigh in availability. The availability was more in surface soilwhich might be due to accumulation of comparatively moreamount of organic matter and supplementing ZnSO4 throughexternal sources as reported by Jalali et al., (1989) and Nayaket al. (2000). The DTPA extractable Cu content varied from0.84 to 1.71 mg kg-1 and 0.72 to 1.17 mg kg-1 in surface andsubsurface soils, respectively. Considering 1.2 mg kg-1 ascritical level(Muhr et al., 1965), it was found that 63 per centof the surface soils were deficient. The available Mn contentof these soils varied from 7.29-15.84 mg kg-1 and 7.48- 14.10mg kg-1 soil in both the surface and sub surface soils,respectively. Considering 2.0 mg kg-1 as critical level(Muhr etal., 1965), it was found that all the surface sub surface soilswere high in availability. The high availability in the surfacesoils and gradual decrease in sub surface soils might be due
RAJESHWAR MALAVATH AND S. MANI
1-11

HIND AGRICULTURAL RESEARCH AND TRAINING INSTITUTE 7 Asian J. Soil Sci., (June, 2013) 8 (1) :
to its presence in the reduced forms in surface and subsurfacesoils and higher biological activity and organic carbon in thesurface soils. These observations are in agreement with thefindings of Murthy et al. (1997) and Nayak et al. (2000).According to critical limit (6.4mg kg) in calcareous soils theDTPA extractable Fe content found to be deficient and variedfrom 2.06-7.45 mg kg-1 and 1.17-4.67 mg kg-1 soil in both thesurface and sub surface soils, respectively. It was high in thesurface soils when compared to the sub surface soils whichmight be due to accumulation of humic material in the surfacesoils besides prevalence of reduced conditions in sub surfacesoils.The findings are in agreement with the findings of Prasadand Sakal (1991).The hot water soluble boron content variedfrom 1.47-2.37 mg kg-1 and 0.99-1.76 mg kg-1 soil in both thesurface and subsurface soils, respectively. Considering thecritical limit of 0.46 mg kg-1, the soils were very low inavailability of boron. It was high in the surface soils when
Table 4 : Nutrient index values of available nutrients status in surface soils of CRS, VeppanthattaiNutrient index values and fertility ratings
BlocksN P K S Zn Cu Mn Fe B
Northern 1.00 2.75 2.00 3.00 3.00 3.00 3.00 1.25 3.00
Western 1.00 2.80 2.00 3.00 3.00 2.40 3.00 1.00 3.00
Southern 1.00 3.00 2.00 3.00 2.50 1.00 3.00 1.00 3.00
Central 1.00 2.78 2.00 3.00 1.50 1.71 3.00 1.00 3.00
Eastern 1.00 3.00 2.00 3.00 2.53 1.00 3.00 1.00 3.00
Overal NIV 1.00 2.86 2.00 3.00 2.26 1.66 3.00 1.02 3.00
Northern Very low Very high Marginal Very high Very high Very high Very high Very low Very high
Western Very low Very high Marginal Very high Very high High Very high Very low Very high
Southern Very low Very high Marginal Very high high Very low Very high Very low Very high
Central Very low Very high Marginal Very high Low High Very high Very low Very high
Eastern Very low Very high Marginal Very high High Marginal Very high Very low Very high
Overal fertility ratings Very low Very high Marginal Very high Adequate Low Very high Very low Very high
Table 5 : Nutrient index values of available nutrients status in subsurface soils of CRS, VeppanthattaiNutrient Index values and fertility ratings
BlocksN P K S Zn Cu Mn Fe B
Northern 1.00 2.00 1.75 3.00 1.25 2.50 3.00 1.00 3.00
Western 1.00 2.00 1.40 3.00 1.00 2.60 3.00 1.00 3.00
Southern 1.00 2.00 2.00 3.00 2.00 1.00 3.00 1.00 3.00
Central 1.00 2.00 1.64 3.00 1.43 1.00 3.00 1.00 2.93
Eastern 1.00 2.00 1.77 3.00 1.00 1.00 3.00 1.00 3.00
Overal NIV 1.00 2.00 1.68 3.00 1.24 1.37 3.00 1.00 2.97
Northern Very low Marginal Marginal Very high Very low High Very high Very low Very high
Western Very low Marginal Low Very high Very low High Very high Very low Very high
Southern Very low Marginal Marginal Very high Marginal Very low Very high Very low Very high
Central Very low Marginal Low Very high Low Very low Very high Very low Very high
Eastern Very low Marginal Marginal Very high Very low Very low Very high Very low Very high
Overal fertility ratings Very low Marginal Marginal Very high Very low Low Very high Very low Very highSoil fertility ratings: > 1.33 – Very Low; 1.33 – 1.66 – Low, 1.67 – 2.00 – Marginal, 2.0 – 2.33 – Adequate ; 2.33 – 2.67 – High; < 2.67 – Very high.
compared to the sub surface soils which might be due toaccumulation of organic matter.
Nutrient index values and soil fertility ratings :The nutrient index value was worked out to know the
fertility rating of available macro and micronutrients in thesurface and sub surface soils (Table 4 and 5). Based on nutrientindex values and soil fertility ratings, the soil samples foundto be very low of N (1.00) and Fe (1.02 and 1.00), low in Cu(1.66 and 1.37) in both the surface and sub surface soils,respectively. Marginal values recorded in availability of K(2.00 and 1.68), very high and marginal (3.00 and 2.00) inavailability of P, very high of S, Mn and B (3.00) in surface andsubsurface soil, respectively. High to very high fertility ratingof Mn in the soils could be attributed to the oxidation ofdivalent Mn++ to trivalent Mn+++ by certain fungi and by theorganic compounds synthesized by microorganisms and
SOIL QUALITY ASSESSMENT IN BLACK SOILS OF VEPPANTHATTAI OF PERAMBALUR DISTRICT, TAMIL NADU, INDIA
1-11

HIND AGRICULTURAL RESEARCH AND TRAINING INSTITUTE 8 Asian J. Soil Sci., (June, 2013) 8 (1) :
Table 7 : Correlation between soil physico-chemical properties and available nutrientsExchangeable cations Availale macronutrients Availale micronutrients
pH EC OCCa Mg Na K
CEC CaCO3 N P KAvailable
S Zn Cu Mn Fe B
pH 1 .392** -.291* .240* .223 .176 .018 .195 .183 -.228* -.304** -.128 -.392** -.345** .015 -.086 -.156 -.131
EC 1 -.400** .309** .050 -.005 -.217 .278* .019 -.507** -.440** -.464** -.381** -.231* .092 .049 -.036 -.374**
OC 1 -.543** -.241* -.262* -.098 -.372** -.212 .796** .810** .575** .869** .663** .458** .395** .442** .719**
Ca 1 .038 .177 .024 .644** .142 -.463** -.566** -.283* -.501** -.349** -.366** -.403** -.409** -.394**
Mg 1 -.100 -.170 .270* .354** -.272* -.309** -.238* -.272* -.109 -.018 .195 -.040 -.175
Na 1 .498** .218 .184 -.130 -.187 .041 -.271* -.153 -.384** -.462** -.392** -.208
K 1 .095 .127 .149 .027 .268* .036 -.063 -.515** -.544** -.298** -.030
CEC 1 .128 -.320** -.450** -.271* -.347** -.212 -.261* -.239* -.229* -.283*
CaCO3 1 -.213 -.219 -.154 -.201 -.150 -.167 -.109 .003 -.080
N 1 .713** .683** .737** .448** .183 .162 .199 .729**
P 1 .664** .780** .584** .259* .224 .399** .747**
K 1 .638** .467** .113 -.078 .122 .650**
S 1 .737** .397** .289* .397** .760**
Zn 1 .305** .255* .450** .439**
Cu 1 .502** .467** .314**
Mn 1 .539** .216
Fe 1 .272*
B 1* and ** Indicate significance of value at P=0.05 and 0.01, respectively
Table 6 : Correlation between soil physical properties and organic carbonSand Silt Clay B.D OC Pore space 33 kpa (F.C) 1500 kpa (W.P) AWC W.H.C
Sand 1 -.292* -.586** -.037 .042 .138 -.315** -.275* -.233* -.271*
Silt 1 -.604** -.380** .640** .636** -.335** -.285* -.260* -.272*
Clay 1 .353** -.577** -.654** .546** .471** .414** .456**
B.D 1 -.542** -.501** .337** .245* .327** .355**
OC 1 .857** -.314** -.239* -.288* -.308**
Pore space 1 -.340** -.243* -.337** -.357**
33 kpa 1 .895** .706** .695**
1500 kpa 1 .315** .309**
AWC 1 .986**
W.H.C (%) 1FC- Field Capacity WP- Wilting point AWC-Available water content MWHC-Maximum water holding capacity* and ** Indicate significance of value at P=0.05 and 0.01, respectively
plants (Vijayakumar et al., 2011).
Correlation studies :Simple linear correlation studies of nutrient availability
were made with various physico-chemical characteristics insurface and subsurface soils and presented in Table 6 and 7,respectively.
Relation between soil physical properties and organic carbon:Correlation co-efficients between physical properties and
organic carbon of soils revealed that (Table 5) the sand was
negatively correlated with silt, clay, water retention at fieldcapacity, available water content and maximum water holdingcapacity (r =-0.292*, -0.586**, -0.315**- 0.275*, -0.233* and -0.271*, respectively) and it was positively correlated withorganic carbon and pore space but not significant. The siltnegatively correlated with clay, bulk density, water retentionat field capacity, wilting point, available water content andmaximum water holding capacity (r = -0.604**,-0.380**-0.335**,-0.285*,260* and -0.272*) and it was positivelycorrelated with organic carbon and pore space (r = 0.640**and 0.636**), respectively. The clay content was positively
RAJESHWAR MALAVATH AND S. MANI
1-11

HIND AGRICULTURAL RESEARCH AND TRAINING INSTITUTE 9 Asian J. Soil Sci., (June, 2013) 8 (1) :
correlated with bulk density, water retention at field capacity,wilting point, available water content and maximum waterholding capacity (r = 0.353**,0.546**, 0.471**0.414**and0.456**) and it was negatively correlated with organic carbon,and pore space (r = -0.577**and-0.65**).
The bulk density significantly positively influenced bywater retention at field capacity, wilting point, available watercontent and maximum water holding capacity (r =0.337**,0.245*, 0.327**and 0.355**) and it is negativelycorrelated with organic carbon and pore space (r= -0.501**and 0.337**), respectively. The porosity was negativelycorrelated with water retention at field capacity, wilting point,available water content and maximum water holding capacity(r = -0.340**, -0.243**, -0.337** and0.357**), respectively.The water retention at field capacity is positively correlatedwith wilting point, available water content and maximum waterholding capacity (r = 0.895**, 0.706**and 0.695**),respectively.
Relation between physico-chemical properties and nutrientavailability of soils :
The pH had significantly positive correlation with ECand exchangeable Ca (r = 0.392** and 0.240*) and it wasnegatively correlated with organic carbon, N, P, S and Zn (r =-0.291*, -0.228*, -0.304**,-0.392** and 0.345**), respectively(Kumar and Babel, 2011) The pH had positive correlationbut not significant with CEC, CaCO
3, exchangeable cations
(Mg, Na and K) and Cu and negatively correlation withavailable Mn, Fe and B. The EC had significantly positivecorrelation with exchangeable Ca and CEC (r = 0.309** and0.278*) and it was significantly and negatively correlatedwith organic carbon, N, P, K, S Zn and B (r = -0.400**, -0.507**,-0.440**,-0.464**, -0.381**, -0.231* and-0.374**),respectively. The EC had positive correlation but notsignificant with exchangeable cation Mg, CaCO
3, Cu and
Mn and negative correlation with exchangeable K and Fe.Similar results were studied by Sadashiva et al. (1995) andPatiram et al. (2000). The organic carbon had significantlypositive correlation with available N. P, K, S, Zn, Cu, Mn,Fe and B (r = 0.796**, 0.810**, 0.575**, 0.869**,0.663**,0.458**,395** 0.442**, and 0.719**) and it was significantlyand negatively correlated with exchangeable Ca, Mg, Na,and CEC (r = -0.543**, -0.241*,-0.262* and-0.372**),respectively. The OC had negative correlation but notsignificant with exchangeable cation K, and CaCO
3.
The exchangeable Ca had significantly positivecorrelation with CEC (r = 0.644**) and it was significantly andnegatively correlated with available N. P, K, S, Zn, Cu, Mn, Feand B (r = -0.463**, -0.566**,-0.283** 0.501**, -0.349**,-0.366** 0.403**, -0.409** and-0.394**), respectively. The Cahad positive correlation but not significant with exchangeablecation, Mg, Na and K. The exchangeable Mg was significantlypositive correlation with CEC and CaCO
3 (r = 0.270* and
0.354**) and it was significantly and negatively correlatedwith available N. P, K and S (r = -0.272*, -0.309**,-0.238* and0.272*), respectively. The Mg had negative correlation butnot significant with exchangeable cation Na, K, available Zn,Cu, Fe and B. The exchangeable Na had significantly positivecorrelation with exchangeable K (r = 0.498**) and it wassignificantly and negatively correlated with available S, Cu,Mn and Fe (r = -0.271*, -0.384**,-0.462*, and -0.392**),respectively. The Na had positive correlation but notsignificant with CEC, CaCO
3 and available K and non
significant negative correlation with available N. P, Zn and B.The exchangeable K was significantly positive correlation withavailable K (r = 0.268*) and it was significantly and negativelycorrelated with available Cu, Mn and Fe (r = -515**, -0.544**and -0.298**), respectively and had positive correlation butnot significant with CEC, CaCO
3 and available N, P and S.
Availability of nutrients such as N, P, K, S, Cu, Mn, Feand B in the soils was significant negatively influenced byexchangeable CEC (r= -0.320**, -0.450**, -0.271*, -0.347**, -0.261*,-0.239*, -0.229* and 0.283*), respectively and it waspositive non-significant with CaCO
3was and negative with
Zn (= -212). Similar results was reported by Chaudhari etal.(2012).The CaCO
3 was non-significant negatively correlated
with available N, P, K, S, Zn, Cu, Mn and B. These results aresimilar to those of Sudhir et al. (1997) .
T he availability of N positively correlated with availableP, K, S, Zn, and B (r=0.713**, 0.683**, 0.737**, 0.448** and0.729**) and had positive correlation but not significant withavailable Cu, Mn and Fe. The availability of P was positivelycorrelated with available K, S, Zn, Cu, Fe and B (r=0.664**,0.780**, 0.584**, 0.259*,0.339** and 0.747**) and hadpositive correlation but not significant with availableMn(r=0.224). The availability of K positively correlated withavailable S, Zn, and B (r=0.638**, 0.467** and 0.650**) andhad positive correlation but not significant with available Cuand Fe and negative with Mn. The availability of S wassignificantly and positively correlated with available Zn, Cu,Mn, Fe and B (r=0.737**, 0.397**, 0.289*, 0.397** and0.760**), respectively.
The availability of Zn was significantly and positivelycorrelated with available Cu, Mn, Fe and B (r=0.305**, 0.255*,0.450** and 0.439**), respectively. The availability of Cu wassignificantly was positively correlated with available Mn, Feand B (r=0.502**, 0.467** and 0.314**), respectively. Theavailability of Mn was significantly and positively correlatedwith available Fe (r=0.539**) and positive correlation but notsignificant with available B (r=0.216).The availability of Fewas significantly and positively correlated with availableB(r=0.272*).
Constraints and management :Soils are very deep, calcareous, clayey and moderate to
moderately well drained with slow permeability and low
SOIL QUALITY ASSESSMENT IN BLACK SOILS OF VEPPANTHATTAI OF PERAMBALUR DISTRICT, TAMIL NADU, INDIA
1-11
HIND AGRICULTURAL RESEARCH AND TRAINING INSTITUTE 10 Asian J. Soil Sci., (June, 2013) 8 (1) :
hydraulic conductivity. Leaching of soluble weatheringproducts is limited, the contents of available calcium andmagnesium are high and the pH is usually above 8.0. Soilshave swell shrink characteristic and crack during summer. Themoisture retention capacity is high. The early rainfall entersinto the soil through cracks and once the cracks are closedthe water stagnation occurs due to slow permeability. As therainfall is high during rainy season, runoff and erosion are themain problems. Soils are prone to water erosion due to theirslow infiltration. Once the soil is thoroughly wetted and thecracks are closed the rate of water infiltration becomes almostzero. These soils need proper surface drainage during rainyseason. As the available moisture capacity of the subsurfacesoils is high, the soils have potential for double cropping.Improved management practices have good potential toenhance productivity on these soils.
Addition of river sand :Addition of river sand at 100 t ha –1 and application of
100 cart loads of red loam soil.
Deep ploughing :Deep ploughing the field with mould board plough or
disc plough during summer enhances the infiltration andpercolation.
Broad bed and furrow system :To overcome the problem of water logging during rainy
season, the broad bed and furrow system is suggested. Broadbed and furrow system manage the surface drainage duringrainy season cropping. The raised beds should be 1.2 m wideand 15 cm high and with two furrows of 30 cm width on eitherside to drain out excess of water. The broad bed and furrowsystem needs a graded slope of land, 0.8 to 2.0% and it isformed across the slope. The furrows should lead to a maindrain at the end of the field. The advantage of these systemsis that, it aids in excellent root growth, vigorous plant growthand greener foliage than the flat bed and also reduces theweed problem.
Green manuring :Pre-monsoon sowing of green manures and
incorporation at flowering stage will enhance the nitrogenavailability and improves the soil physical, chemical andbiological environment.
Application of organic manures :Farmyard manure, composted coirpith or pressmud at
25 t ha-1 per year conserves soil moisture, adds micronutrients,enhances aeration and improves the physical properties ofthe soil, Therefore,15-20 tonnes of well decomposed farmyardmanure is added while preparing the land a month beforesowing the seed.
Crop rotation:Growing legume plants tend to take up more cations in
proportion to anions. As a consequence, H+ ions are excretedfrom their roots to maintain the electrochemical balance withintheir tissues. This leads to reduces in soil pH. Hence, croprotation is mandatory.
Seed-cum-fertilizer drill :With seed cum fertilizer drill the seeds are sown along
with basal placement of fertilizers over a well prepared bed toensure proper seed placement and a good crop stand forcotton, cereals and legumes. It will useful for maintainingtimeliness of planting at reduced cost of operation.
Conclusion :The soils are deep and ideal for cultivation of cotton,
sorghum, soybean, greengram and blackgram, moderatelysuitable for redgram and marginally suitable for sesamum inKharif season under rainfed condition. Under irrigatedcondition, soils are high to moderately suitable for cultivationof sunflower, safflower, sesamum, sorghum, maize, greengram,blackgram, pearlmillet and onion in Rabi season. These soils aredeficient in nutrients like N, Fe and Cu. High soil productivitycould be achieved by improving field drainage, decreased runoff,soil erosion in rainy season, dry sowing ahead of the monsoon,providing of irrigation facilities in Rabi season, developmentand use of high-yielding varieties/hybrids, enrichment of organicmatter, maintenance of enhanced soil fertility, using improvedseed-cum-fertilizer drills to ensure proper seed placement forlegumes and cereal crops and a good crop stand, appropriateplant protection and timely harvesting was essential to sustainthe soil health as well as crop yields .
Acknowledgement :The authors are thankful to authorities of Tamil Nadu
Agricultural University, Coimbatore for their technical supportduring the course of investigation.
Literature CitedBlake, G.R. and Hartze, K.H. (1986). Bulk density In: Methods ofsoil analysis part I (ed A Klute). American Society of AgronomyIncorporation WRISCONSIN,USA. 377-382pp.
Chapman, H.O. (1965). Cation exchange capacity. In: Methods ofsoil analysis Part-II (ed CA Black). American Society of AgronomyIncorporation.WISCONSIN,USA.pp 891-901.
Choudhari.,P.R., Ahire., D. and Vidya D.A. (2012). Correlationbetween physico-chemical properties and available nutrients in sandyloam soils of Haridwar. J.Chemical, Biol.Physical Sci., 2: 1493-1500.
Hirekurubar, B. M., Doddamani, V. S. and Satyanarayana, T. (1991).Some physical properties of Vertisols derived from different parentmaterials. J. Indian Soc. Soil Sci., 39: 242-245.
RAJESHWAR MALAVATH AND S. MANI
1-11

HIND AGRICULTURAL RESEARCH AND TRAINING INSTITUTE 11 Asian J. Soil Sci., (June, 2013) 8 (1) :
Jackson, M.L. (1973). Soil chemical analysis. Prentice Hall of India.
Jackson, M.L.(1958). Soil chemical analysis. Prentice Hall. Inc.Eagle Wood Cliffs. N.J. pp. 372-374.
Jalali, V.K.,Talib, A.R. and Takkar, P.N. (1989). Distribution ofmicronutrients in some bench mark soils of Kashmir at differentaltitudes. J.Indian Soc. Soil Sci., 37 :465- 469.
Kumar, M. and Babel, A.L. (2011). Available micronutrient statusand their relationship with soil properties of Jhunjhunu Tehsil,District Jhunjhunu, Rajasthan, India. J. Agric. Sci., 3(2).
Lindsay, W.L. and Norvell, W.W. (1978). Development of DTPAsoil test for zinc, iron, manganese and copper. Soil Sci. Soc. AmericaJ., 42:421-428.
Muhr, G.R., Dutta, N.P. and Sankara Subramanoyey (1965). Soiltesting in India. NEW DELHI, INDIA. USAID.p.120.
Murthy, I.Y.L.N., Sastry, T.G., Datta, S.C., Narayanaswamy, G.and Rattan, R.K. (1997). Distribution of micro nutrient cations inverisols derived fro different parent materials. J. Indian Soc. SoilSci., 45: 577-580.
Nayak,D.C., Mukopadyay, S. and Deepak Sarkar (2000).Distribution of some available micronutrients in alluvial soils ofArunachal Pradesh in relation to some characteristics. J. Indian Soc.Soil Sci., 48: 612-614.
Pal, D.K. and Deshpande, S.B. (1987). Genesis of clay minerals ina red and black complex soils of southern India. Clay Res., 6: 6–13.
Pal, S.K. and Mukhopadyay, A.K. (1992). Distribution of differentforms of potassium in profiles of some Entisols. J. Indian Soc.SoilSci.,40:371- 373.
Piper, C.S. (1966). Soil and plant analysis. Hans Publishers, Bombay(M.S.) INDIA.
Prasad, R. and Sakal, R. (1991). Availability of Fe in calcarcoussoils in relation to soil properties. J. Indian Soc. Soil Sci., 39: 658-661.
Prasuna Rani, P., Pillai, R.N., Bhanuprasad, V. and VenkataSubbaiah, G.V. (1992).Clay mineralogy of Alfisols and associatedsoils of Kavali area under somasila project in Andhra Pradesh. J.Indian Soc. Soil Sci., 4: 893-896.
Pasricha, N.S. and Fox, R.L. (1993). Plant nutrient sulphur in thetropics and subtropics. Adv. Agron., 50:209-269.
Patiram, R., Upadhyaya, C., Singh, C.S., Munna, R. and Ram, M.(2000). Micronutrient cation status of mandarin (Citrus reticulataBlanco) orchards of Sikkim. J. Indian Soc. Soil Sci.,48(2): 246-249.
Sankaram, A. (1966). A laboratory manual for agriculturalchemistry. Published by Jaya Sing Asia Publishing House Bombay(M.S.) INDIA.56p.
Sadashiva, V., Prabhuraj, D.K. and Murthy, A.S.P. (1995). Statusof micronutrients in soils of Kabini Command Area (India). Univ.Agric. Sci., Bengaluru, 24(3): 41-43.
Sudhir, K., Gowda, S.M.M. and Siddaramappa, R. (1997).Micronutrient status of an Alfisol under long term fertilization andcontinuous cropping. Mysore J. Agric. Sci., 31(2): 111-116.
Thangaswamy,A.,Naidu, M.V.S.,Ramavatharam, M.and Raghavareddy, C.(2005). Characterization, classification and evaluation of soilresources in Sivagiri Micro-watershed of Chittoor District in AndhraPradesh for sustainable land use planning J. Indian Soc. Soil Sci.,53:11-21.
Vijaykumar, R., Arokiyaraj, A. and Martin Devaprasath, P. (2011).Nutrient strength and their relationship with soil properties of naturaldisaster proned coastal soils, J.Chem. Pharm. Res., 3(3): 87-92.
Walia, C.S. and Rao,Y.S. (1997). Characteristics and classificationof some soils of Trans-Yamuna plains. J. Indian Soc. Soil Sci., 45:156-162 .
Walkly, A. and Black, I.A. (1934). An examination of the Dogiareffmethod for determining soil organic matter and a proposedmodification of the chromic acid titration method. Soil Sci., 37:29-33.
Williams, C.H. and Steinbergs, H. (1959). Soil sulphur fractions aschemical indices of available sulphur in some Australian soils.Australian Agric. Res.,10: 340-352.
**************
****
SOIL QUALITY ASSESSMENT IN BLACK SOILS OF VEPPANTHATTAI OF PERAMBALUR DISTRICT, TAMIL NADU, INDIA
1-11