solar home and jobs opportunity act
TRANSCRIPT

Solar Home and Jobs Opportunity Act: Delivering Ratepayer Benefits through the Renewable Portfolio Standard
A proposal to the Energy & Technology Committee February 10, 2015
In support of Governor Malloy’s proposed legislation regarding the Solar Home Renewable Energy Credit (SHREC), the Connecticut Green Bank (Green Bank) engaged the Connecticut Center for Economic Analysis (CCEA), a University Center located within the School of Business at the University of Connecticut (UCONN) to provide a thorough analysis of the economic impact of the Residential Solar Investment Program (RSIP) to date and of the recommended policy. Created in 1992, CCEA specializes in economic impact and policy analysis studies. It has conducted hundreds of studies involving the Connecticut economy. Results:
The expansion of RSIP under the SHREC policy will not only create jobs but will also result in greater spending power for individuals and increased economic activity across Connecticut.
SHREC will allow the solar market to continue to grow, resulting in creation of over 6,300 private sector jobs.
SHREC will increase personal disposable income on Connecticut residents by $537 million. Methodology: Green Bank asked CCEA to estimate the economic impacts of solar photovoltaic (PV) deployment under the RSIP on the state’s economy as well as the economic impact of (1) expanded PV deployment under the SHREC scenario (2) deployment under the current RSIP policy . CCEA used a dynamic Regional Economic Modeling Inc. (REMI) model of the state’s economy to arrive at the results. Green Bank assisted the CCEA analysis by projecting residential PV deployment in the current policy environment, a total of 90.8 MW from 2015 by 2022, and a scenario under the SHREC of 250 MW, which would reach the proposed minimum target in the new policy.

Connecticut Green Bank’s Residential Solar Investment Program: Economic Impact Analysis of Existing Commitments and Future
Scenarios
Prepared by: Peter Gunther, Senior Research Fellow, CCEA
Fred Carstensen, Director, CCEA and
William Waite, Managing Director, Semnia LLC
For: Mackey Dykes, Vice President and Chief Operating Officer, Connecticut Green Bank
February 9, 2015

Connecticut Center for Economic Analysis Page 2 of 15 University of Connecticut
TABLE OF CONTENTS
Table of Contents ............................................................................................................................ 2
Introduction .................................................................................................................................... 3
Key Economic Terms ....................................................................................................................... 4
Inputs, Assumptions and Adjustments ........................................................................................... 5
Inputs and Assumptions .............................................................................................................. 5
Adjustments ................................................................................................................................ 6
Economic Impact Analysis ............................................................................................................... 7
Evaluation of Current Program ................................................................................................... 7
Evaluation of Future Scenarios ................................................................................................... 8
Conclusion ..................................................................................................................................... 11
Appendix 1 – About CCEA ............................................................................................................. 12
Appendix 2 – Input Data from the Green Bank ............................................................................ 13
Endnotes ....................................................................................................................................... 14
FORWARD-LOOKING STATEMENTS This report contains forward-looking statements regarding economic and financial metrics. Herein, we do not use the term “forward-looking statements” as it is specifically understood within the Private Securities Litigation Reform Act of 1995. However, we use the term in a similar manner, in so far as forward-looking statements involve uncertainties because they relate to events, and depend on circumstances, that have yet to occur, but will or may happen in the future. Forward-looking statements are subject to risks and uncertainties, which could cause actual results to differ, possibly materially, from those anticipated and presented herein. Forward-looking statements are based on the authors’ beliefs, established economic principles, and data from CPV and other accessible, reliable sources, as well as assumptions made by the authors and the base-case scenario contained in the REMI model. When used herein, the words “forecast,” “estimate,” “anticipate,” variations of such words, and similar expressions, are intended to identify forward-looking statements. However, throughout this report, all economic impacts that have not yet been realized – that is, numbers that are not purely historical – as well as conclusions, recommendations, and the like that are based on such results, should be understood to be or involve forward-looking statements. Factors that could cause forward-looking statements to differ from actual results include but are not limited to: revisions to extant data series; alterations to federal, state, and municipal fiscal policies; timing of specific investments and/or expenditures; demographic growth; legal and regulatory developments; availability of new technologies; natural disasters, adverse weather conditions, and any other force majeure event. All forward-looking statements made in this report are qualified by the cautionary statements in this section. The authors cannot guarantee that the results we anticipate (and present herein) will be realized, or even if realized, will have the expected consequences to, or effects on, the State of Connecticut’s or local municipalities’ economic situation. Forward-looking statements made in this report apply only as of the date of this report. While the authors may elect to update forward-looking statements, we specifically disclaim any obligation to do so after the date of this report.

Connecticut Center for Economic Analysis Page 3 of 15 University of Connecticut
INTRODUCTION
The Connecticut Green Bank (“the Green Bank”) engaged the Connecticut Center for Economic
Analysis (“CCEA”) to study the impacts of its Residential Solar Investment Program (“RSIP” or “the
RSIP initiative”) on the State’s economy. CCEA used PI+ CT V1.5 of Regional Economic Modeling
Inc.’s (“REMI”) county-leveli model (“the REMI model”), other authorities, and input from the
Green Bank to obtain the results presented herein.
This impact analysis retains the REMI outlook embedded in the model as the base-case and adds
to it the economic impact of RSIP recipients. While REMI adjusts its base-cases over time with
the evolution of the economy driven by forces that lie outside of the model – such as price shifts
in internationally determined oil prices – CCEA’s emphasis herein is on the differences between
the base-case data and REMI results inclusive of the RSIP, rather than underlying variations of
the forecast per se.
This report is organized into the following sections:
KEY ECONOMIC TERMS: Contains definitions and descriptions of key economic metrics used
in this report.
INPUTS, ASSUMPTIONS AND ADJUSTMENTS: Describes the key inputs CCEA obtained from the
Green Bank (and, where appropriate, other sources) as well as the underlying
assumptions used in conducting the analysis.
ECONOMIC IMPACT ANALYSIS:
o EVALUATION OF CURRENT PROGRAM: Presents the findings from CCEA’s study of the
impact of the Green Bank’s current RSIP commitments – specifically those made
to mid-November of 2014 – for both (i) what has been built and (ii) the projects
expected to be built and operating by end of June 2016 (aka, those to which the
Green Bank has made commitments).
o EVALUATION OF FUTURE SCENARIOS: Examines the economic impacts from 2016
through 2041 of two options – (i) a business-as-usual (“BAU”) case, and (ii) a high
(“High”) scenario – for extending the RSIP
CONCLUSION: Summarizes CCEA’s overall findings.

Connecticut Center for Economic Analysis Page 4 of 15 University of Connecticut
KEY ECONOMIC TERMS
While every effort has been made to make the contents of this paper as accessible as possible,
due to the nature of this study, references to certain (technical) economic concepts are
necessary. This section presents definitions and descriptions of key terms used.
Jobs: “A job is defined as an uninterrupted period of work with a particular employer.
Jobs are therefore employer based, not position-based. If a respondent indicates that he
or she left a job but in a subsequent survey returned to the same job, it is counted as a
new job.”ii Similarly if two employers each create a job the total number of jobs generated
is two. Because many jobs are part time, the number of jobs in the economy exceeds the
number of fulltime equivalent (FTE) employment. In this analysis, we consider three job
classifications:
o Direct jobs are those created by the organization or organizations responsible for
generating an economic stimulus (e.g., construction jobs with a prime contractor,
employees of a new business, etc.).
o Indirect jobs are those created by the supply chain involved in delivering goods
and services to the organization or organizations that generated the stimulus (e.g.,
jobs with secondary contractors, suppliers of materials, etc.).
o Induced jobs are those created as the result of expenditures from direct, indirect,
and other induced employees (e.g., jobs at restaurants, grocery stores,
recreational tourism, etc.).
Job-years are the number of annual jobs created by the project summed over each year.
Personal Income is the sum of compensation to employees plus proprietors’ income plus
current transfer receipts, minus government contributions for domestic social insurance.
o Disposable Personal Income: Personal income less personal taxes. In other
words, disposable personal income is what a household has discretion to spend
after paying primarily personal taxes on Personal Income.
Personal Income Taxes includes income taxes paid directly to each order of government
by households but excludes corporate taxes and sales taxes.iii
o Of the $35.66 billion paid by Connecticut citizens in personal current taxes in 2013,
$8.12 billion (22.8%) accrued to the state of which $7.93 billion was in personal
income taxes, $183.6 million for motor vehicle licenses and $12.3 million other,
mostly hunting, fishing and boating licenses. These shares among governments
can vary over time. However, such shares are fairly stable assuming that federal
and state income tax rates remain in the same proportion.

INPUTS, ASSUMPTIONS AND ADJUSTMENTS
INPUTS AND ASSUMPTIONS
1) The Green Bank is funded by transfers from electrical utilities based on a 1 mill rate on all
electricity sales in Connecticut of which one third is used for RSIP with an additional $2.1
million annually of that charge assumed to support RSIP administrative costs. Only
transactions related to the RSIP are included in this analysis.
2) Projects involving household adoption of solar are partially financed by the Green Bank,
and from federal government personal income tax rebatesiv; the remaining systems
investments are paid by individual householders. Where known, household financing is
by type of arrangement.v
a. For existing/current program:
i. From 2012 to the end of June 2016, leasehold payments are $90 per month
over 20 years on 3,137 systems. Of the monthly lease fee, 20% is allocated
to annual inspections, maintenance and repairs. All other systems are
assumed to require the same level of repair and maintenance.
ii. Smart-E Loans were made on 113 systems and while having varying lengths
of maturityvi have been modelled as mortgages at 5.99% per annum with
a 10-year term.
iii. The 2,312 systems on which financing is unknown were assumed to be paid
for out of household income in the year of purchase.vii
iv. Of the project commitments made by the Green Bank but not completed
by 2014, 48% are expected to be finished in 2015 and the remainder by
the end of June 2016.
b. For future scenarios, those utilizing the:
i. Homeowner Performance Based Incentive (“HOBPI”): 1. 30% of total annual installations; and 2. Paid for out-of-pocket by consumers.
ii. Performance Based Incentive (“PBI”): 1. All are owned by a leasehold company paid for out of monthly
charge payable by the householder, consistent with the status quo, of $90 per month for each 7 KW system; and
2. Of the monthly payment, $7 is allocated for maintenance and repair, with fees increasing 2.9% annually over 20 years.
Connecticut Center for Economic Analysis Page 6 of 15 University of Connecticut
iii. Under both incentive payments (HOPBI and PBI), Green Bank credits are paid to the system owner, i.e. the homeowner under HOPBI and the leasehold company under PBI.
3) In keeping with current practices, commercial project financing used by households is
assumed to be provided by financial intermediaries outside the State.viii
4) Production from installed solar systems is assumed to decline by 0.5% annually.ix
5) The value placed on CO2eq emissions is $30.x
6) CCEA modelled sales generated from solar to enter the grid at peak rates ($0.125 per
KWh)1, and that homes with solar remain on the grid to draw down electricity at base rate
which is about $0.09 per KWh, slightly below flat rates in 2014.
7) CCEA has studied the impact that two different future scenarios will likely have based on
input from the Green Bank. The key inputs for this section are the capacity installation
targets.2 The two variations involve with additions to plated capacity cumulated 2016-
2022 of:
a. The business-as-usual (“BAU”) case with a total of 90.8 MW;
b. A high (“High”) case at 250 MW.
ADJUSTMENTS
The REMI analysis of this program’s impact is a complicated one, because there are several
economic adjustments that are involved with the adoption of residential photovoltaic (PV)
systems to augment/supplement the use of power from the grid. Among the adjustments are:
1. The increased rate of one mill is applied to the vast majority of all electrical consumption
in the state and transferred by the utilities to the Green Bank, limited in this analysis to
the 33% of the single mill used in RSIP plus the administrative costs of the RSIP.
2. Solar purchases initially curtail other household discretionary expenditures during
installation and households’ shares for financing of the solar systems. However, in
subsequent years, the presence of a photovoltaic (“PV”) system frees household
discretionary income for adaptors due to savings on electricity.
1 Connecticut Light and Power (“CL&P”) current peak rate for residential power. 2 A breakdown of the annual figures provided by the Green Bank can be found in Appendix 2.

Connecticut Center for Economic Analysis Page 7 of 15 University of Connecticut
3. CCEA distinguished the installation of solar from normal residential construction by
allocating costs to: non-residential construction (60%); primary metal manufacture (25%);
electronics manufacturing (5%); and, scientific professional and technical services (10%).
4. Reduced pollution generates amenity values based on the clean generation of solar
compared to the average green-house gas (“GHG”) emissions. CCEA’s use of average GHG
savings understates these amenity advantages because electrical utilities place a priority
on curtailing generation from old coal and older oil and gas plants first because they are
more expensive to operate and produce the highest levels of GHGs.xi For that reason,
CCEA’s use of average levels of pollution will likely understate savings in GHGs at the
margin.
5. Even though household systems were sized, in part to accommodate electric vehicles
where householders owned them, the impact of electronic vehicles (“EVs”) in generating
saving of GHGs and particulate matter (“PM”) were excluded from the analysis in order
to focus on the adoption of PV systems, leading to a further understating of the total
impacts. This approach essentially assumes householders’ dual decisions to adopt PV and
EVs are independent.3
ECONOMIC IMPACT ANALYSIS
EVALUATION OF CURRENT PROGRAM
CCEA analyzes the aforementioned adjustments combined with expanded investment in the
benefits of more cleanly generated electricity and additional revenues and/or avoided electricity
purchases which, after financing, supplement household discretionary income. A summary of
the quantitative findings from this part of CCEA’s analysis – that is, the impact of the Green Bank’s
commitments to mid-November of this year – is as follows:
1. Private sector job-years generated from 2012 to 2037 are estimated to be 1,768 – or,
approximately 40 jobs per MW of name-plate installed capacityxii – of which 1,710 were
in the private sector:
a. Total annual job creation impacts peak during at the height of installation in 2013
at 224;
3 Based on different scenarios analyzed during this study, CCEA research indicates that adoption of EVs would have a material impact. While outside the scope of this report, the data suggests that additional analysis is warranted on the effect EV adoption has and will continue to have.

Connecticut Center for Economic Analysis Page 8 of 15 University of Connecticut
b. During the post-construction adjustment period, net job losses, never exceed 63
annually in 2017. From 2019 post-construction job losses are more than offset by
operating gains with annual job impacts peaking at 88 in 2034. Thereafter, there
is a gentle decline due to the 0.5% mild deterioration of solar system efficiencies.
2. Disposable personal income impacts in current dollars, indicative of additional market
choices for consumers, rise by $126 million over the period – approximately $2.8 million
per MW of name-plate installed capacity – and in excess of $8.4 million annually attained
during peak installation in 2013 and from 2030 onward.
3. The larger economy, resulting from the RSIP program, generates $8.2 million for state
personal income taxes and another $7.0 million in state sales taxes over the entire
period.xiii
EVALUATION OF FUTURE SCENARIOS
The twenty-year timeframe for full repayment of funding for PBI systems means that systems
installed in the last half of 2016 will be fully paid out by mid-2036 so that the those households’
discretionary income will be freed-up from then onward and similarly for subsequent
installations to 2022 with annual lags out to 2042, when all systems covered in the 2016-2022
tranche will be fully paid.
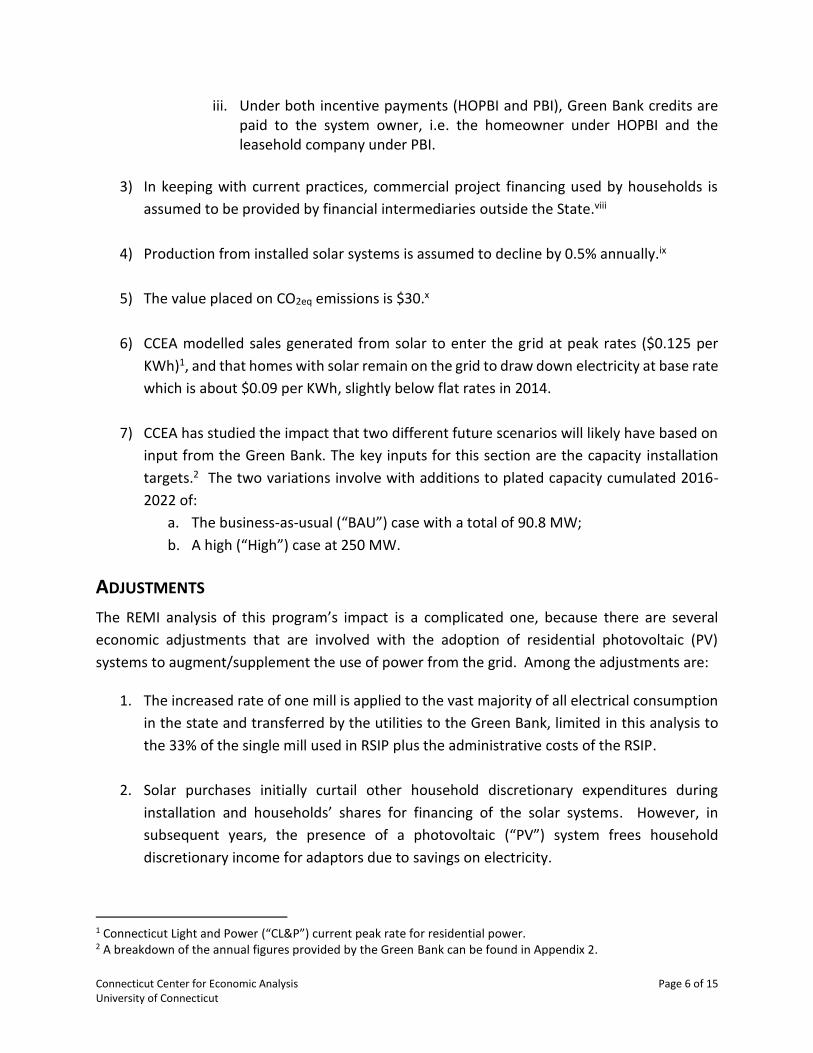
The general patterns of economic impacts over time are illustrated in Chart 1, which shows Job
Impacts, and Chart 2, which presents results regarding Personal Income.
Chart 1 indicates that positive impacts during the construction phase of the program are eroded
with the cessation of installations, but recover as systems are paid-off and net benefits to
household consumption is realized. Job impacts peak in the high case at 422 in 2018, but slump
to -183 by 2024 as adjustments are made to the cessation of installations. Subsequently, based
on the benefits of solar, the economy resurges to about 200 jobs annually prior to another rise
as system payments are completed.

Connecticut Center for Economic Analysis Page 9 of 15 University of Connecticut
Chart 1 Employment Impacts – 2016-2042 (Number of Jobs)
Chart 2 presents the impacts on personal income in millions of current dollars. As the data
indicate, the benefits to personal income follow a similar trend to the data in Chart 1, which
shows incremental employment. However, personal income increases even more substantially
following the post-construction adjustment. Pursuant to post construction adjustments, the
higher scenarios also outperform the BAU case. Once through the post-installation adjustments,
the high scenario impacts on personal income in current dollars continue to rise over time,
beyond the impacts attained during construction.
In keeping with the previous summary of findings, these future perspectives are summarized over
the same length of time, in this case from 2016 to 2042 in Table 1.
Connecticut Center for Economic Analysis Page 10 of 15 University of Connecticut
Chart 2 Impacts on Personal Income – 2016-2042 (Millions Current-$)
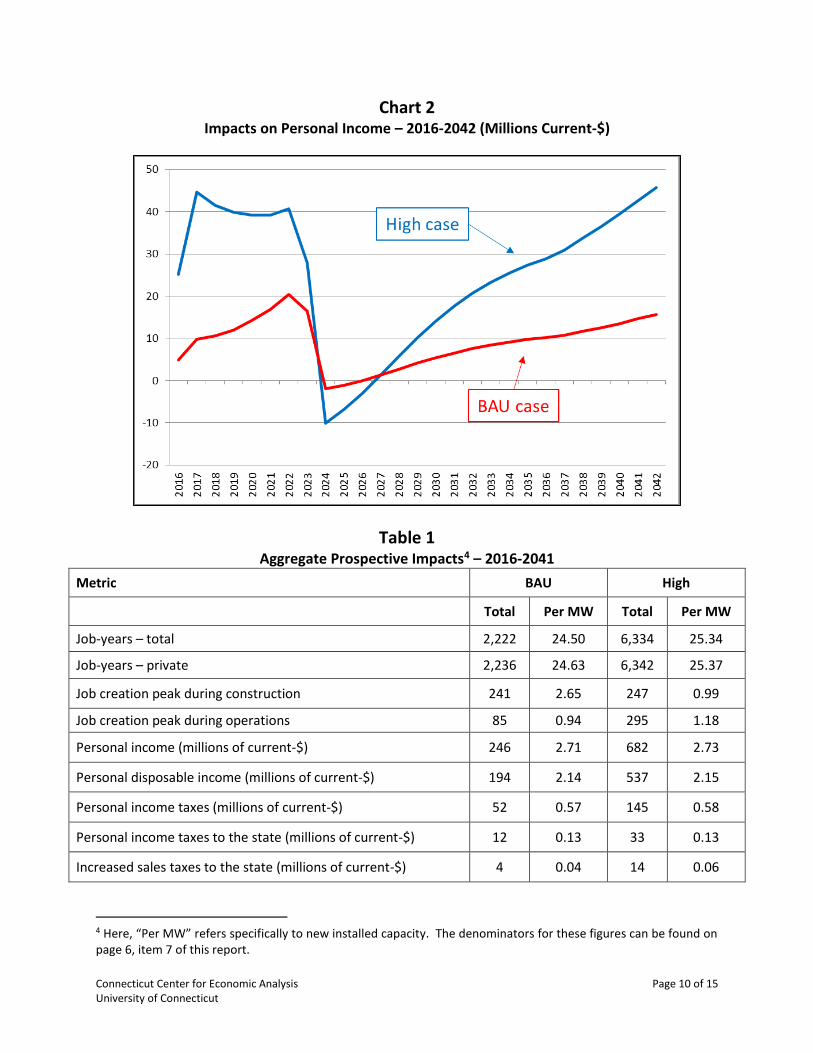
Table 1
Aggregate Prospective Impacts4 – 2016-2041
Metric BAU High
Total Per MW Total Per MW
Job-years – total 2,222 24.50 6,334 25.34
Job-years – private 2,236 24.63 6,342 25.37
Job creation peak during construction 241 2.65 247 0.99
Job creation peak during operations 85 0.94 295 1.18
Personal income (millions of current-$) 246 2.71 682 2.73
Personal disposable income (millions of current-$) 194 2.14 537 2.15
Personal income taxes (millions of current-$) 52 0.57 145 0.58
Personal income taxes to the state (millions of current-$) 12 0.13 33 0.13
Increased sales taxes to the state (millions of current-$) 4 0.04 14 0.06
4 Here, “Per MW” refers specifically to new installed capacity. The denominators for these figures can be found on page 6, item 7 of this report.

Connecticut Center for Economic Analysis Page 11 of 15 University of Connecticut
CONCLUSION
CCEA’s study confirms that (i) the RSIP initiative has been economically beneficial to the State of
Connecticut, and (ii) that expansion of this program will be similarly advantageous. In fact, as the
results in Table 1 indicate – specifically the figures for personal income and disposable personal
income – expansion of RSIP will not only create jobs, but will also result in greater spending power
for individuals and increased economic activity across Connecticut.
While all of the metrics analyzed indicate the economically beneficial nature of the RSIP initiative
– both in the current and some future iteration – the fact that the program enhances personal
disposable income as much as it does is perhaps most striking. Since personal disposable income
is a measure of how much money consumers have to spend (or invest) after they pay taxes, that
metric is a particularly important one when analyzing any state-wide, regional, or national
program.

Connecticut Center for Economic Analysis Page 12 of 15 University of Connecticut
APPENDIX 1 – ABOUT CCEA
The Connecticut Center for Economic Analysis (CCEA) is a University Center located within the
School of Business at the University of Connecticut (UCONN).
CCEA specializes in economic impact and policy analysis studies as well as advising clients
regarding business strategy, market analysis, and related topics. CCEA focuses particular
attention on the economic and business dynamics of Connecticut, for which it maintains a license
to the dynamic REMI model of the state’s economy.
CCEA was created in 1992 to serve the state’s citizens by providing timely and reliable
information regarding Connecticut’s economy and to evaluate the potential impacts of proposed
policies and strategic investments. By mobilizing and directing the expertise available at the
UCONN, state agencies, and the private sector, CCEA aims to equip the public and decision
makers with transparent analyses to facilitate systematic, thoughtful debate of public policy
issues.
CCEA has conducted hundreds of studies involving the Connecticut economy, at both the state
and local levels. Copies of its studies and reports that are available to the general public, can be
found at http://ccea.uconn.edu/. For additional information about CCEA, please contact
Professor Fred Carstensen (860.305.8299, [email protected]).

Connecticut Center for Economic Analysis Page 13 of 15 University of Connecticut
APPENDIX 2 – INPUT DATA FROM THE GREEN BANK
Fis
cal
Years
20
15
20
16
20
17
20
18
20
19
20
20
20
21
20
22
Tota
l
Targ
et
MW
Sch
ed
ule
(B
AU
)3.8
77
9.0
69
10.4
69
11.9
74
13.5
84
15.2
64
17.0
84
9.4
52
90.8
HO
PB
I In
cen
tiv
e (
$/k
W)
$607.5
0$516.3
8$860.6
3$688.5
0$550.8
0$440.6
4$330.4
8$247.8
6
PB
I In
cen
tiv
e (
$/k
Wh
)$0.0
720
$0.0
576
$0.0
823
$0.0
699
$0.0
595
$0.0
476
$0.0
357
$0.0
268
Ap
pro
ved
Sy
ste
ms
554
1,2
96
1,4
96
1,7
11
1,9
41
2,1
81
2,4
41
1,3
50
12,9
68
HO
PB
I S
yste
ms (
30%
)166
389
449
513
582
654
732
405
3,8
90
PB
I S
yste
ms (
70%
)388
907
1,0
47
1,1
97
1,3
58
1,5
26
1,7
08
945
9,0
77
To
tal H
OP
BI
Cap
acit
y (
kW
)1.2
2.7
3.1
3.6
4.1
4.6
5.1
2.8
27.2
To
tal P
BI
Pro
du
cti
on
(M
WH
)22,5
90
52,8
48
61,0
06
69,7
76
79,1
57
88,9
47
99,5
53
55,0
79
528,9
55
To
tal In
cen
tiv
e
$2,3
32,9
32
$4,4
48,9
45
$7,3
88,2
37
$7,5
64,0
88
$7,4
42,4
36
$6,9
82,3
27
$6,1
38,9
66
$2,6
70,3
28
$44,9
68,2
58
HO
PB
I$706,5
04
$1,4
04,9
22
$2,7
02,9
98
$2,4
73,2
56
$2,2
44,6
42
$2,0
17,7
96
$1,6
93,7
89
$702,8
37
$13,9
46,7
43
PB
I$1,6
26,4
28
$3,0
44,0
24
$4,6
85,2
39
$5,0
90,8
31
$5,1
97,7
94
$4,9
64,5
31
$4,4
45,1
77
$1,9
67,4
91
$31,0
21,5
15
Targ
et
MW
Sch
ed
ule
- H
igh
15.2
50
31.8
16
33.2
16
34.7
21
36.3
31
38.0
11
39.8
31
20.8
25
250.0
HO
PB
I In
cen
tiv
e (
$/k
W)
$607.5
0$516.3
8$860.6
3$688.5
0$550.8
0$440.6
4$330.4
8$247.8
6
PB
I In
cen
tiv
e (
$/k
Wh
)$0.0
720
$0.0
576
$0.0
823
$0.0
699
$0.0
595
$0.0
476
$0.0
357
$0.0
268
Ap
pro
ved
Sy
ste
ms
2,1
79
4,5
45
4,7
45
4,9
60
5,1
90
5,4
30
5,6
90
2,9
75
35,7
14
HO
PB
I S
yste
ms (
30%
)654
1,3
64
1,4
24
1,4
88
1,5
57
1,6
29
1,7
07
893
10,7
14
PB
I S
yste
ms (
70%
)1,5
25
3,1
82
3,3
22
3,4
72
3,6
33
3,8
01
3,9
83
2,0
83
25,0
00
To
tal H
OP
BI
Cap
acit
y (
kW
)4.6
9.5
10.0
10.4
10.9
11.4
11.9
6.2
75.0
To
tal P
BI
Pro
du
cti
on
(M
WH
)88,8
64
185,3
97
193,5
55
202,3
25
211,7
07
221,4
96
232,1
02
121,3
54
1,4
56,8
00
To
tal In
cen
tiv
e
$9,1
77,5
14
$15,6
07,5
27
$24,5
02,7
14
$21,3
22,7
64
$18,5
89,5
68
$15,5
59,3
46
$12,2
28,2
59
$4,7
95,1
28
$121,7
82,8
21
HO
PB
I$2,7
79,2
93
$4,9
28,6
63
$8,5
75,9
01
$7,1
71,5
78
$6,0
03,2
99
$5,0
24,7
22
$3,9
48,9
83
$1,5
48,5
35
$39,9
80,9
74
PB
I$6,3
98,2
21
$10,6
78,8
64
$15,9
26,8
14
$14,1
51,1
86
$12,5
86,2
69
$10,5
34,6
24
$8,2
79,2
76
$3,2
46,5
94
$81,8
01,8
47

Connecticut Center for Economic Analysis Page 14 of 15 University of Connecticut
ENDNOTES
i The REMI model is the primary tool CCEA uses for conducting long-term economic impact analyses. The REMI model is a multi-sector, dynamic, equilibrium impact model of Connecticut so that inputs and impacts are specific at the state level. The program measures total economic changes over time by comparing a baseline forecast (one in which there is no change) to an alternative scenario or scenarios via changing direct impacts generated by the company’s project such as generation of direct industry jobs and development of new capital assets. Because the variables in the REMI system are inter-related, a change in any one variable affects many others. For example, if wages rise in one sector, the relative costs of producing a certain output (or outputs) change, and could potentially cause the producer to substitute capital for labor. The change in the capital-labor ratio potentially impacts input demands, which affect jobs, wages, migration and other variables throughout the economy. Such “chain-reactions” propagate across all sectors in the model over time. For additional information regarding the model, visit: http://www.remi.com/the-remi-model.
County-level break-outs are based on annual data of where current and future projects have been and are to be located. Due to the Green Bank’s initial marketing targeting of Middlesex, it played an inordinately large role beginning in 2012, but its share of RSIP declines to be in-line with state income shares by 2016. The 2016 shares among counties are expected to remain stable from that time onward. The numbers presented herein are aggregated statewide. Outcomes were calculated and are available on a county-by-county basis, but are not part of this overview at the state level. ii U.S. Department of Labor, Bureau of Labor Statistics (BLS): “Number of Jobs Held, Labor Market Activity, and Earnings Growth among the Youngest Baby Boomers: Results from a Longitudinal Study.” http://www.bls.gov/news.release/pdf/nlsoy.pdf. iii BEA, National Accounts. In assessing impacts dynamically, the difference between personal income and personal disposable incomes can also be impacted by adjustments to the economy for inflation. http://www.bea.gov/iTable/iTable.cfm?ReqID=9&step=1#reqid=9&step=3&isuri=1&903=58 iv The federal tax subsidy of 30% of installation costs net of any other assistance is maintained until December 31, 2016 when it ends, as per the terms of the current legislation. Based on the likely impact that this federal tax incentives have on the affordability of residential solar adoption, further analysis of the impacts that changes to – including the outright removal of – this legislation will have on the RSIP program is warranted. v While some households may have used alternative sources of financing (unknown to the Green Bank), the assumption here is that they did not, but paid for their systems using discretionary income and/or savings. This assumption may understate how many systems were financed, as well as the total amount of borrowing taking place, because, unknown to the Green Bank, households could have utilized other borrowing facilities, such as private-equity lines, personal credit, or the like. vi Terms actually vary from 7, to 12 years, so 10 years is a middle way assumption. vii The assumed break-down between out-of-pocket purchases and financed ones implies that discretionary income in the year of purchase takes a sizable hit, which, for modeling purposes, constrains householders’ remaining discretionary income and dampens the positive impacts from construction of the systems. While financing the system foreshortens those impacts (by reducing up-front costs), it also adds total expense over the 20 year period due to interest costs on the debt. Installations are assumed to be put in place throughout the year with growth in installations being relatively flat throughout the year. As a result of this approach the financing for the last installations begins in mid-2012 and ends in mid-2016. viii To the extent that some homeowner financing may occur in the state, via the Green Bank and others, impact results from REMI are conservative.
Lease payments to out-of-state companies significantly impact the economic dynamics determining when homeowners under PBI realize unencumbered benefits from installing the systems. That is not to say gross savings in electricity costs and avoided environmental damage are not fully realized from the completion of the installations. Those savings are at least partially offset from the homeowner’s perspective by covering the household’s share of the systems costs.
While shorter financing periods would increase annual costs of repayment, they would also shift revenues from financial intermediaries (aka, the company to which lease payments are made) to resident owners, which

Connecticut Center for Economic Analysis Page 15 of 15 University of Connecticut
would add stimulus from consumer savings thereby accelerating Connecticut growth. Should Connecticut financial intermediaries participate in the program, Connecticut impacts would expand.
CCEA ran several comparison scenarios involving different financing scenarios, the results of which are not presented herein as this analysis lies beyond the scope of this study. While the specific results vary with each set of variables analyzed, overwhelmingly the data supports the conclusion that financial intermediation – which, in this setting, refers specifically to the holding of the lease – by companies within Connecticut would result in a meaningful improvement to the economic benefits of the RSIP initiative. ix Based on estimates from the Green Bank. x This value is above current market costs of about $5 (as determined by RGGI, http://www.rggi.org/) due in part at least to the failure of cap-in-trade systems to become more fully developed. Technical Support Document: Social Costs of Carbon for Regulatory Impact Analysis - Under Executive Order 12866 Interagency Working Group on Social Cost of Carbon, United States Government p. 3. “A domestic social cost of carbon (SCC) value of $33/tonne in 2007 is meant to reflect the value of damages in the United States resulting from a unit change in carbon dioxide emissions.” Adjusted $33 in 2007 for inflation to 2010 and converting from tons to tonnes (metric tons) obtains $38.98/tonne and further adjusted by increases in the CPI to November 2014 yields the $45.85 above. This rate is above most traded rates. The $30 figure is about two-thirds of this U.S. administrative research, which encompasses health impacts and other social costs.
The National Research Council of National Academies, Hidden Costs of ENERGY, Unpriced Consequences of Production and Use found that aggregate damages from 409 U.S mainland coal generating plants in 2005 was $62 billion or $165 million per average facility: 498 gas generating located 48 states caused damages of $749 million or about $1.49 million on average. At highly efficient facilities, damages were as low as 5/100th of a cent per KWh, albeit damages from gas generating facilities general average $0.11 to $0.16 per KWh. (pp. 7-8) The Committee utilized $30 tonne of greenhouse gas (GHG) as its middle marginal cost estimator. (pp. 20) The Committee’s upper bound was $100/tonne of GHG.
Immediately after the systems come on-line, amenity benefits are generated by reductions in CO2eq emissions as well as cuts in fine particulate matter (PM), a cause of respiratory diseases. CO2eq benefits are measured from avoided omissions in fossil-fuel generated electricity. CO2eq reductions have been modeled as amenity benefits. The benefits of reduction in PM are captured in the social value placed on the CO2eq. It makes little difference if the monetized amenity values are passed on to solar adopters or not.
xi Currently, Connecticut internally uses fossil fuels, nuclear and, to a limited extent, small hydro generators and renewables as primary fuels (http://www.eia.gov/state/maps.cfm?v=Electricity) for electricity generation while purchasing the remainder on the grid; that power comes mainly from aging fossil-fuel facilities. ISO-New England has identified significant electric generation – more than 4,000 MW of capacity – at risk of retirement by 2020. (http://www.ferc.gov/CalendarFiles/20140610083119-Brandien,%20ISO%20New%20England.pdf)
During peak summer months of July and August in 2014, Connecticut generation reached 6,506 GWH, of which the primary fuels were natural gas (3,155 GWH), nuclear (3,001 GWH), Biomass (126 GWH), Conventional Hydro (52 GWH), coal (49 GWH), petroleum liquids (15 GWH), pumped storage (1 GWH) and other (107 GWH). For the same two months, New England generated 21,525 GWH, for which the primary fuels were gas (11,345 GWH), nuclear (6,680 GWH), Biomass (1,346 GWH), Conventional Hydro (1,223 GWH), petroleum liquids (69 GWH), coal (288 MWH), other renewables (313 GHW), pumped storage for peak generation (83 GWH), and other (345 GWH). (http://www.eia.gov/electricity/data/browser/)
As older, less-efficient facilities are shuttered, both their electrical output and emissions will cease; the pace of that transition will depend on future growth in demand for electricity and the rate at which new generation comes on-line. A full quantitative analysis of the economic impacts from different generating facilities going off-line (and being augmented by solar power generation) is beyond the scope of this report, particularly as other factors would come into play – weather patterns, for instance. xii Using 44.647 MW as the divisor, as is done with regard to personal disposable income. xiii While the current official rate is 6.35%, there are variations on that ranging from free to higher rates on some products and services. The rate used here is an effective one of 4% covering the impacts on personal consumption expenditures based on my memory of a CCEA study. An alternative approach to depreciation straight lined over 20 years would require a higher rate of 3.5%.