solar-powered venturi aeration for semi-intensive tilapia ... · 3.0 solar/battery powered venturi...
TRANSCRIPT

Solar-Powered Venturi Aeration for Semi-intensive Tilapia Aquaculture in Developing Countries
March 2015
BEE 470 – Final Design Report
- Senior Design Group 5

i | P a g e
Abstract
We have designed an economically advantageous aeration system for a small tilapia aquaculture pond
located in developing equatorial countries. Currently little to no aeration is used in these regions resulting
in lower fish densities, higher risk of losing a crop, and consequently lower profits. Our aeration system
needed to provide enough oxygen to both increase the number of fish in the pond and reduce the risk of
losing fish due to low oxygen conditions.
The aeration systems analyzed were vertical pumps, pooled step cascades, paddlewheels, venturi aerators,
and diffusors. The power systems analyzed were line, human, wind, solar/compressed air, solar/battery,
and gas generators. All systems were compared to each other on the basis of functional, technical,
environmental, social, and economic aspects. While many of these systems would work in our target
environment, a venturi aerator paired with a solar/battery system is the recommended alternative.
In order to test the validity this alternative we developed a 1:400 scale model. While the model system
was capable of delivering dissolved oxygen, there were too many uncontrollable variables and unforeseen
testing environmental conditions for the results of our tests to be indicative of the performance of our full
system. The scale model had a Kla of 0.3. There is little existing data for venturi Kla but a higher
performance is expected from the full size system.
The full size venturi solar/battery system will proved the desired 800 g of oxygen per day at a cost of
$0.49/kg O2 with a capital cost of $1067. The system provided several secondary benefits such as pond
mixing and resiliency to changing environmental conditions. This provides the additional safety required
considering the risks at high fish densities.

ii | P a g e
Table of Contents List of Figures ............................................................................................................................................. iii
List of Tables .............................................................................................................................................. iii
List of Acronyms ........................................................................................................................................ iii
1.0 Introduction ........................................................................................................................................... 1
1.1 Design Problem ................................................................................................................................. 1
1.2 Background ....................................................................................................................................... 1
1.2.1 Aquaculture ................................................................................................................................ 1
1.2.2 Environmental & Social ............................................................................................................ 1
1.2.3 Aeration ...................................................................................................................................... 2
2.0 Technical Alternatives .......................................................................................................................... 2
2.1 Criteria for Evaluation ..................................................................................................................... 2
2.2 Power System .................................................................................................................................... 4
2.2.1 Line Power .................................................................................................................................. 4
2.2.2 Human Power ............................................................................................................................. 4
2.2.3 Wind Power ................................................................................................................................ 4
2.2.4 Solar/Compressed Air ................................................................................................................ 5
2.3 Oxygen Delivery ................................................................................................................................ 6
2.3.1 Paddlewheels .............................................................................................................................. 6
2.3.2 Pooled Circular Stepped Cascade............................................................................................. 6
2.3.3 Diffusion ...................................................................................................................................... 7
2.3.4 Vertical Pumps ........................................................................................................................... 7
3.0 Solar/Battery Powered Venturi Aerator ............................................................................................. 8
3.1 Technical Constraints ..................................................................................................................... 11
3.1.1 Concerns Addressed ................................................................................................................ 12
3.1.2 Demonstration Model & Testing ............................................................................................ 13
3.2 Economic Considerations ............................................................................................................... 14
3.3 Environmental Considerations ...................................................................................................... 16
3.3.1 Production ................................................................................................................................ 17
3.3.2 Operation .................................................................................................................................. 17
3.3.3 Post Design Life ........................................................................................................................ 18
3.4 Social Considerations ...................................................................................................................... 18
3.4.1 Government .............................................................................................................................. 19
4.0 Design Summary ................................................................................................................................. 19
Appendices ................................................................................................................................................. 24

iii | P a g e
List of Figures Figure 1: Pond set up with two aeration modules ........................................................................................ 9
Figure 2: Aeration module ......................................................................................................................... 10
Figure 3: Venturi nozzle - Mazzei Injectors model 1078 .......................................................................... 10
List of Tables Table 1: Matrix of Power Systems showing overall scores. ........................................................................ 6
Table 2: Matrix of Aerators showing overall scores .................................................................................... 8
Table 3: Aerator capital cost breakdown per component ........................................................................... 15
Table 4: Power system capital cost breakdown per component ................................................................. 15
Table 5: Net Present Value (NPV) of system ............................................................................................ 16
List of Acronyms DO – Dissolved Oxygen FAO – Food and Agriculture Organization of the United Nations FCR – Feed Conversion Ratio Kla – Mass Transfer Coefficient of Oxygen NPC – Net Present Cost OTR – Oxygen Transfer Rate PCSC – Pooled Circular Stepped Cascade PTO – Power Take-Off SAE – Standard Aeration Efficiency SOTR – Standard Oxygen Transfer Rate USAID – United States Agency for International Development

1 | P a g e
1.0 Introduction
1.1 Design Problem
Our team has been commissioned by Dr. Hillary Egna, director of Aquafish Innovations at Oregon State
University to design an aeration system for use in warm water pond aquaculture in developing countries.
She has asked that our system be self-contained as access to line power is unreliable and brown outs are
common; it must be robust, requiring minimal maintenance; and it must be priced appropriately for small
scale farmers. Our initial objective is to design a system for implementation in Kenya, though we are
optimistic that the system will be robust enough for various developing nations. However, the power
system most suited to Kenyan implementation may not be as good an alternative in other regions.
The pond for which we are designing is a common size and shape in our target region. It is a tilapia pond
with a 200 m2 surface area, a water depth of 1.5-2 m, and a total volume of 300-400 m3. Under current
practices, farmers achieve approximately 3 tilapia per cubic meter; with aeration this density can more
than double to 7 tilapia per cubic meter. These ponds have no water flow and will have a significant algae
population which is a source of food for the tilapia.
1.2 Background
1.2.1 Aquaculture
Aquaculture is the farming of fish, crustaceans, and mollusks for human consumption or recreation. This
practice dates as far back as 500 B.C.E. where the Chinese documented methods of cultivating fish.
Currently about 27% of fish consumed globally is farmed (Campbell and Pauly, 2013). While most of this
global aquaculture production occurs in developing nations, aquaculture accounts for less than 1% of the
protein production in Kenya ( Kaliba et al., 2007). Kenya has implemented systems to encourage growth
in aquaculture resulting in a 10% annual increase in national production over recent years (Bostock et al.,
2010).
1.2.2 Environmental & Social
Aquaculture has been encouraged by many nations for its sustainability and high rates of return. The FAO
and the USAID each have extensive reports on the implications of aquaculture for developing nations,
especially their economies, as well as follow up programs on the implementation of these systems (FAO,
2005:AquaFish, 2014). Tilapia is often chosen to be grown in aquaculture systems for its resilience. They
feed on various organisms from plants to insects, including algae and aquatic insects but can also be fed
high protein fish feed. They have a low FCR of about 1.6; this means it takes 1.6 kilograms of feed to
produce one kilogram of fish. This is a sustainable FCR when compared to that of cattle which is around
10 (Siddiqui et al. , 1988). Pond aquaculture is sustainable because it is a closed system. In a closed

2 | P a g e
system waste is recycled by organisms such as algae which in turn produce food for the fish. This creates
less need for external resources such as space, water, or nitrogen; no additional space is needed to
produce crops as feed or to manage the waste; by cleaning itself, the system does not require a continuous
supply of clean water, fish waste decreases the amount of fertilizer needed to grow algae as a food source.
1.2.3 Aeration
Aeration is the process of adding oxygen to water. Aeration is used worldwide in waste treatment plants
as high oxygen content in the water encourages the growth of the numerous microorganisms needed for
the processes that cause degradation of wastes. It is also used in intensive aquaculture systems to increase
the maximum fish density in a pond. Most aeration techniques are similar; the goal is to increase the
surface area and time of contact between water and air. Standard forms include fountains, bubblers, and
surface agitators. In a pond system algae and tilapia live symbiotically, however, without sunlight the
algae stop producing oxygen while both the algae and the fish continue to use up oxygen. At night, this
results in insufficient levels of dissolved oxygen in the water for the tilapia. Without an aeration system
to offset this respiration, the tilapia density is restricted to 3 tilapia per m3. With moderate aeration the
density can more than double to 7 Tilapia per m3.
2.0 Technical Alternatives In the absence of line electricity, our design includes a power system as well as a source of aeration. Since
the function of the power system is independent of the aerator, power systems and aeration systems were
analyzed separately. This was done by comparing the systems based on important design or functional
criteria with a decision matrix or score card. From the top rated alternatives of each group, the most
compatible overall design was chosen.
2.1 Criteria for Evaluation
Each set of alternatives was analyzed according to five categories: functionality, technical, environmental,
social, and economic. Various criteria were scored in each category including some distinct to each
matrix (aerator effects on algae or a power system’s location suitability). The overall categories were each
weighted against each other. Criteria within each category were then weighted against the other criteria
within that category and the category total was normalized to the category weight.
Functionality was weighted at 35% of the total score. This category considered the major details of the
system’s applicability to our target environment. For example, one criteria considered in this category for
power systems was local suitability. Solar powered systems scored quite well due to the regular day
lengths and high average solar radiation level. However, wind power scored poorly due to the low
average wind speed in inland Kenya where most aquaculture is currently practiced.

3 | P a g e
Similarly, economics accounted for 35% of the total score. This is one of the most important design
challenges. If costs are unreasonable for our target customer then the system cannot and will not be
implemented. The topics addressed in this category were capital cost including installation of the system,
operational costs, and replacement costs. For example, batteries have limited functional lifespans and are
comparatively expensive to purchase and replace so it was important to address this when grading
systems that incorporated batteries.
The Environmental, Social, and Technical categories each received 10% weighting. The low weight of
these categories does not mean they are unimportant; they are simply not categories or criteria that will
render the system entirely unsuitable. For example, farmer acceptance from the social category: all
systems could be made acceptable, some would require less convincing or education and some are more
familiar to farmers. The technical category differed from functionality in that it examined the state of the
technology; level of development and scalability as opposed to the use for our specific application. Newer
technologies or systems that have little documentation regarding their use in aquaculture may score lowly
in this category. However, that doesn’t mean it is inherently inappropriate for our target usage. As such,
this category was given a low overall weight. Subtle characteristics of each system are compared in these
lower weight categories.
Each alternative was designed to meet the same criteria for ease of comparison. Aerators were designed to
supply 2 mg/l of oxygen to the pond over a 4 hour period of operation resulting in an oxygen transfer rate
of 0.2 kg/hr. The transfer efficiency at the worst case situation for the pool of 25ºC and 4 mg/l of
dissolved oxygen is 40.5% of standard transfer rates and aeration efficiencies, this efficiency would go up
at lower temperatures and down at higher DO concentrations. This efficiency and needed actual oxygen
transfer were used to design all aerator alternatives. Similarly all power systems were designed for a set
energy need of 2 kW-hr. This is the energy applied to the aerator and did not account for any losses
within the power system itself, such as with battery charging or inverter efficiencies, these were
accounted for in designing the poser system to output the above need. The starting value of 2 kW-hr was
based on the need determined by initial aerator design calculation averages. These values may not be
those used in the final design but allowed for comparison between alternatives for the purpose of analysis
and determining the best alternative.

4 | P a g e
Table 1: Matrix of Power Systems showing overall scores can be found at the end of section 2.2. Table
2: Matrix of Aerators showing overall scores can be found at the end of section 2.3. The complete
matrices with criteria scores can be found in Appendix C.
2.2 Power System
2.2.1 Line Power
Very few private citizens in rural Kenya are on the grid (Lee et al., 2014). Many, however, are not off
grid but fall under a new definition of “under grid” living within 600 m of a power line. This is the result
of a concerted effort by the Kenyan government over the last decade to connect all of Kenya by getting all
public buildings, schools, clinics, etc., on the national grid (Lee et al., 2014). For these “under grid”
homes and businesses it is significantly less expensive than originally believed to obtain a connection to
the national power supply, around $400. Kenya Power also works with other agencies and countries to
provide easy, low interest loans to individuals seeking to use this source of consistent energy. Once
connected, energy costs are very low, $1.33 a month connection fee and $0.03 a kW-hr (Kenya Power,
2014). The grid has also improved in recent years in consistency, there are still brown outs but they are
becoming shorter and rarer.
This alternative scored the highest of all alternatives in the Power System matrix. However, it was not
considered as a power system for our final design. We wished to know what the cost would be so it could
be provided to clients and customers while having a fully developed, self-contained alternative as a main
power system option.
2.2.2 Human Power
This method placed fifth out of six when ranked via the decision matrix, it had very high annual costs and
no real benefits to the farmer. The system consisted of a bike and a converter that would translate the
mechanical energy of pedaling into electrical energy to power the aerator pump or motor. In order to keep
the capital cost down biking was to be done at night to prevent the need for batteries to store power until
the aerator was used. A total of 10 hours of biking generating 200 W (Martin, 2012) would be needed to
produce the 2 kW-hr the power systems were compared for. The minimum wage for unskilled labor was
$0.54 per hour in 2013 (Mywage.org, 2014). At this wage, paying for the needed 10 hours a night of labor
would cost $162 a month and $2000 if run every day for a year. This cost is higher than the value of the
aeration based on the value of fish.
2.2.3 Wind Power
Wind turbines are a good sustainable energy source option because they are a renewable energy that does
not require additional inputs once operational. Turbine sizes range from 0.3 kW to 8000 kW. Western

5 | P a g e
Kenya has enough wind to power a 300 to 500 W wind turbine if placed at a great enough height. The
radii of these turbines range between 1 and 1.5 m; this creates a sweep area between 3.14 and 7.07 m2.
This area is correlated to the wind power density of a given location; this value increases with height as
wind speed increases. The largest constraints with wind turbines are their inefficiencies at converting this
wind power. While the wind power density of western Kenya is roughly 80 W/m2 (at 40 m hub height),
turbine efficiencies are around 30% (Hirahara et al., 2015); a 300 W system with 1.5 m radius could
feasibly produce about 170 Watts of power. In some places, including Kenya, there is less wind at night.
If power is needed at night then the turbine can be connected to batteries as needed. Two sources of
difficulty are the height needed and the level of locational dependency.
A large benefit of a wind turbine is its lifespan and minimal maintenance. Once installed and operational
the only maintenance needs include inspection on the blades and bolts and greasing as necessary. With
the ability to also withstand substantial storms, the lifespan of a wind turbine is about 20 years.
(Energy.gov, 2014). The electronics for these systems are relatively straight forward and do not add to the
cost which is about $1.20 per watt of the turbine. The metal required for supporting the tall structure is
about the price of the turbine. Creating concrete foundations and raising the tower are the most intensive,
and expensive, aspects of a turbine installation. Aside from this difficulty, renewable energies are still
welcomed by residents of rural Kenya (Kenya.gov, 2014).
2.2.4 Solar/Compressed Air
The biggest disadvantage of a battery system is the recurring cost for replacing them. A potential
alternative form of energy storage is to compress air. In accordance with the ideal gas law, it is possible to
store the same mass of air in a significantly smaller volume if brought up to a high pressure. This system
consists of a solar array, a compressor, and a high pressure air tank. The compressor runs during the day
when solar radiation is prevalent. There are a few important disadvantages to this system. First, it is only
compatible with diffused air aeration. Secondly, there is the high capital investment required to purchase
high volume pressure tanks in the 200 psi range. Third, it takes more work to pump a volume of air to 200
psi than any of our other systems. As such, a higher power compressor is needed. Lastly, the volume of
air you need to store becomes unreasonable if your aeration method has poor Oxygen Transfer Efficiency.
Despite these disadvantages, the technology scored quite well in our matrix. The lack of recurring cost,
minimal maintenance, and the lack of need for large battery arrays allowed it to stay competitive.
Ultimately the high installation cost made this option unrealistic for developing nations even though it
scored high overall.

6 | P a g e
Table 1: Matrix of Power Systems showing overall scores.
Weight Solar Air
Solar Battery Human Wind Diesel Line
Functionality 35 26.6 29.4 25.0 23.1 29.4 25.4
Technical 10 9.5 9.5 9.3 9.0 9.3 9.3
Environmental 10 9.8 8.0 9.6 9.6 5.6 8.2
Social 10 8.1 7.0 5.4 8.2 5.8 7.1
Economic 35 23.8 18.9 20.3 18.9 23.8 29.4
Overall 100 77.8 72.8 69.5 68.8 73.8 79.4 Our chosen design for power systems was Solar Battery. This system and its benefits will be described in
detail in section 3.0.
2.3 Oxygen Delivery
2.3.1 Paddlewheels
The most commonly used aerators are paddlewheels (Tucker, 2005). These have paddles located on a
cylinder that rotates to splash the water and create bubbles increasing the surface area and contact time of
the water and air, causing oxygen transfer. Paddlewheels have been adapted for use with PTO, diesel or
gas engines, and electric motors. Aeration efficiencies vary with changes in structure including changes in
diameter, depth, paddle size and shape, and rotation speed. One intensive study determined that the
paddles should reach 10-15 cm into the water, the hub should have a 0.9 m diameter, and the paddles
should have a width of 10-15 cm and should be staggered around the hub. With these specifications SAE
could range between 2.0 and 2.5 kg O2/kW-hr (Tucker, 2005).
Maintenance needs are higher than other aerators. However, they are quite robust; they have been in
production for many years and their designs have been refined. They are mass produced and there are
multiple suppliers to Africa making them reasonably accessible to rural areas. The largest maintenance
would be associated with a diesel engine power source. Electric motors require less maintenance and are
more efficient (Bankston et al., 1995).
2.3.2 Pooled Circular Stepped Cascade
A method for employing circular stepped cascade aeration was developed in 2010 and further modified in
2013 with the design of PCSCs (Kumar et al. , 2013). These methods involve a six tiered system with
water pumped through the middle and allowed to fall over the steps, PCSCs have barriers on the edges of
each step to modify the flow path and retain the water longer. PCSCs have been found to have SAEs
exceeding 3 kg O2/kW-hr with increasing SAE as the radius of the cascade base increases. A Standard

7 | P a g e
Oxygen Transfer Rate (SOTR) of 0.161 kg O2/ hr was observed by the designers in a 1.2 m base radius
system with a flow rate of 600 l/min (Kumar et al. 2013). These systems have a low outlay cost and low
maintenance costs due to only have one motorized component, the pump.
The system designed to employ this aeration method involved three independent units consisting of a 1.2
m cascade with two pumps each with a flow rate one third that of the design tests, 200 l/min. This is
because pumps with a higher flow rate are larger, more expensive, often need more maintenance, and
draw higher powers. The SOTR adjusts linearly as the flow rate is change, meaning each cascade in this
system will have an SOTR of 0.107 kg O2/ hr. When adjusted for temperature and dissolved oxygen
concentration our goal OTR, 0.2 kg O2/ hr, is not met. However, if run for 6 hours the system would
provide the 2 mg/l DO specified for our designs. Each pump is $200 and each cascade is $50, with
additional piping and connection costs the total system cost is $1400.
This system ranked quite high in our Alternatives Matrix, it is our second choice aerator design due to its
low maintenance needs and comparatively low capital costs.
2.3.3 Diffusion
Diffused air aeration systems function by pumping air through a porous media at the bottom of a pond.
These small bubbles rise through the water column and oxygen diffuses through the surface boundary into
the water. Diffusion systems are extremely dependent on the depth of the aerator and the size of the
bubbles. Large pore diffusion systems see oxygen transfer efficiencies of less than 5% while finer pore
systems can reach 10-15% efficiency per meter depth (Sanitaire, 2014). However, micropore diffusors
can expect oxygen transfer efficiencies of 40% to 50% at 1 m depth and upwards of 80% at 6 m depth
(Point Four Systems, 2014). This comes with higher initial cost and pressure requirements. Diffusion has
advantages including that it is pumping air instead of water, it is capable of aerating water through the
entire water column, and does not have any moving parts outside of those in the pump.
2.3.4 Vertical Pumps
Vertical pump aerators in their most simple form are a submerged electric motor with an attached
impeller suspended just under the water’s surface using floats. These pumps are often in the 0.5 to 5
horsepower range running at 115/220 V. Vertical pumps are not good at circulating deep water as they
pull water from the surface and throw it into the air around the pump; the same water is often pumped
repeatedly. This prevents good lateral distribution of oxygenated water and does not prevent stratification
(Rogers, 2010).
Since vertical pump aerators move water, it is important to look at both how much water moves through
them and how well that water is aerated. For example, the 0.5 HP Splash 2001 pump manufactured by

8 | P a g e
Creel Pump, Inc. cycles approximately 2 m3/minute (Creel Pump, Inc., 2001). Given a pond volume of
400 m3, it would take this pump only 125 minutes to cycle through a volume of water equivalent to the
pond’s volume, however much of this water would not be pumping for the first time and some water
would not pass through the pump. While processed water volume is comparable among models on a per
horsepower level, the SAE between manufactures fluctuate significantly. In 1987, Boyd and Ahmad
tested the SAE of a variety of aeration methods for the purpose of catfish farming (Boyd and Ahmad,
1987). Among the test subjects were 6 vertical pumps ranging from 0.33 to 10 HP. Calculated SAE for
the pumps ranged from 0.73 kg O2/kW-hr to 1.5 kg O2/kW-hr (Boyd and Ahmad, 1987). There was no
correlation between size and SAE some models just performed poorly. In another paper, Boyd cited the
average SAE of vertical pump aerators to be 1.4 kg O2/kW-hr with a 15 pump sample size (Boyd, 1998).
Pump details were not given. Creel lists the SAE of their Splash 2001 as 2.7 kg O2/kW-hr (Creel Pump,
Inc., 2001). While it could be that the technology really has improved this much over the years it is likely
that the Creel will not operate at advertised values in a real environment.
Table 2: Matrix of Aerators showing overall scores
Weight Paddle Wheel
Vertical Pump PCSC Diffuse
(Battery) Diffuse (Air) Venturi
Functionality 35 26.2 27.5 28.5 31.1 31.1 31.1
Technical 10 8.5 8.3 8.0 9.0 9.0 8.0
Environmental 10 7.0 6.3 9.5 6.1 6.1 5.9
Social 10 7.2 6.3 7.3 7.0 7.0 6.9
Economic 35 22.4 23.8 22.4 23.8 19.6 29.4
Overall 100 71.2 72.1 75.7 77.0 72.8 81.3
Our chosen design was a Venturi aeration system. This system and its benefits will be described in detail in section 3.0.
3.0 Solar/Battery Powered Venturi Aerator
The chosen alternative is a solar powered venturi aerator. The aeration system will consist of two
separate, identical units. This is to create a continuous circulation loop as well as double the total oxygen
added. This set up can be seen in Figure 1. Customers could purchase the units independently and have a
half-sized aeration system if that met their needs and budget. Each unit consists of a submersible pump,
connecting pipes, and two venturi nozzles set in parallel as shown in Figure 2. The nozzles will be
Mazzei Injectors model 1078 (Figure 3). The pump will be a Tunze Turbelle Stream 6125. The pump
moves 12000 L/hr and draws 22W. Based on flow rate and nozzle characteristics this system should have
an Oxygen Transfer Rate at our pond conditions of 0.2 kg-O2/hr. A modular system was chosen for the

9 | P a g e
ease of scalability, provide more uniform aeration, and to address the limitations of pump and nozzle size.
The power system (one system powering both units) will consist of a 100 watt solar panel charging a
75Ahr 12V battery. The system will also include a DC-AC inverter and a charge controller. Energy need
has been calculated based on the complete system being run for four hours each night.
Figure 1: Pond set up with two aeration modules
Since the power system is designed to be sufficient under lowest monthly average light conditions, the
solar panel will be operating in excess the majority of the year. With charge control technology to ensure
the battery is always charged first, the pump could be run during the day on this surplus energy. This
would increase the DO in the water creating a better environment for the fish. Alternatively, this surplus
could be used to charge small devices like cell phones or lanterns.

10 | P a g e
Figure 3: Venturi nozzle - Mazzei Injectors model 1078
Figure 2: Aeration module

11 | P a g e
3.1 Technical Constraints
The primary technical constraint inherent to warm water aquaculture systems is low oxygen transfer
efficiencies. This is the result of high temperatures that decrease the saturation concentration of oxygen in
the water. Combined with the need to maintain 4 mg/l of DO at all times to ensure fish health, the
gradient is decreased even more. At 25ºC the saturation concentration of oxygen is around 8.6 mg/l. Our
minimum allowable design DO is 4 mg/l, the resultant efficiency of this system compared to a system at 0
mg/l DO is 40% (Boyd, 1998), greatly increasing the transfer rate needed to obtain a desired level of
aeration.
Further efficiency related difficulties are the result of the nature of venturi aerators. These aerators have
highly variable OTRs depending on the internal nozzle dimensions, the flow rate of water, the size and
placing of holes for air entrainment, and the length of the tube after the air enters the flow. OTR also
depends on the number and arrangement of nozzles. All of these characteristics combine to make it
difficult to compute accurately or find specific values for the aeration efficiency of venturi aerators. As a
result, the system must be built above need to account for possible errors in theoretical calculations, at
least until empirical data is gathered for the specific nozzle and configuration.
When using a solar battery system there are several important aspects to consider. The applicability of
solar power is bound by the amount of solar radiation a location receives on a day to day basis. Secondly,
the amount of solar radiation a location receives is dependent on the time of year. Nairobi Kenya gets
upwards of 6000 W-hr/m2-day for many months but in June and July only see on average 4250 Whr/m2-
day (Barman, 2011). In order to ensure functionality of the solar array during all times of the year it must
be sized so the system can function on 4250 W-hr/m2-day. While the wattage rating of a solar panel is
already accounting for the energy conversion efficiency of the technology when exposed to 1000 W/m2 it
is important to note that readily available solar cells are only about 15% efficient (Barman, 2011). Along
with the solar panels a charge controller will be needed to regulate the output going to the batteries.
There are many types of batteries in use today. The two technologies we determined were most likely to
succeed and compared to each other were lead acid-and lithium-ion. Deep cycle lead-acid batteries are
easier and cheaper to purchase and have well established supporting technologies when coming to meters
and regulators but have short cycle lifespans and are sensitive to over discharging. Lithium-ion batteries
deliver a more consistent voltage, are not as vulnerable to damage due to fully discharging, and have
more charge cycles over their operational life than lead-acid batteries. However, they were much more
expensive, required more expensive supporting technology, and in the sizes we required could only be
purchased from a few manufacturers, none of which would be purchasable anywhere but online (Armand

12 | P a g e
and Tarascon, 2008). Due to being more available and the necessity of replacing the batteries every few
years, we chose lead-acid batteries for our design.
A battery system comes with one particularly important benefit when harnessing renewable energy such
as solar; it allows the system to function even if the amount of solar radiation for the day drops below the
designed minimum. The batteries are only going to be 30-40% discharged each night. This means that the
system could run 2 to 3 nights in a row, even with no sun, at the expense of reducing the lifespan of the
batteries. Even a few unusually cloudy days in a row should provide enough of a recharge to prevent
batteries from fully discharging.
3.1.1 Concerns Addressed
Through the development of this design a few key concerns came to our attention regarding the use of a
pump, theft, and environmental factors. The first concern addressed was that of fish safety. Small fish are
susceptible to being injured by the suction and flow of a pump. One mitigating factor is a screen placed
over the pump inlet; however, the strength of the suction may still be enough to overpower the fish.
Adjusting flow rate is a viable solution to this problem. While this may cause a lower DO transfer, the
smaller fish do not demand as much oxygen and with a proper concentration of algae aeration may not be
necessary. The pumps effect on the earthen pond is also of concern. With the pump near the floor of the
pond scouring may occur near the inlet and outlet of the pump. The pond floor also often consists of an
anoxic layer; mixing this into the system will only raise the need for DO. These problems are addressed
by lifting the pump off the pond floor. Our design will have the pump lifted of the pond floor by 0.2
meters, the angle of the nozzle will also be insufficient to cause scour at the outlet.
There is also a concern for pump fouling. The pump’s potential to foul will be reduced by its elevation
above the earthen floor. Additionally, a bend will be placed on the pump’s intake to ensure that the water
is not being taken from the sediment rich floor. Fouling of the air intake must also be avoided. A tube
pointing straight up may get clogged so a bend will be placed in the tube so it is not facing vertically.
With these aspects taken into account, yearly cleaning will be sufficient to keep the pump system working
efficiently.
The surrounding environment also raised concerns. With a system based on solar two things are apparent:
it will only work when the sun is out and expensive equipment will be vulnerable. To address the
fluctuation in solar intensity, the entire system has been design for the worst case scenario. This is in the
months of June through August when the solar intensity is two thirds as much as in peak solar months. If
a storm were to occur, the batteries for the system will last three days without recharging. One of the best

13 | P a g e
ways to account for proper solar intensity is to plan harvests properly. It is left up to the farmer to plan for
fish reaching full size in months of high solar intensity.
The expensive electronics of this system must be protected from theft. Strategic installation will resolve
this issue. The solar panels are the most vulnerable since they must sit out to operate. These can be
installed in such a manner that removal of the panel can only be achieved by its destruction. The rest of
the electronics, including the batteries, will be placed in a metal lock box. The bulk and weight of this
combined set up is a significant theft deterrent. Also by simply being out of sight, the chances of theft are
greatly reduced. A similar benefit will be obtained by the pump since it is submersible and will remain
below the water level.
3.1.2 Demonstration Model & Testing
To prove the viability of our system we designed a 1:400 scale model that utilized the same technology as
our full system. The primary goals of this model were to determine if any unforeseen challenges might
arise in the building and use of our system, prove functionality, and collect data on the aeration efficiency
of venturi aerators. Due to the disparity in scale between the systems, the power system was not directly
scaled down but instead redesigned to be suitable for our model system.
Our model pump system consisted of two different sized Mazzei venturi injectors, a variable speed Jebao
DC-3000 24VDC electric pump, an aluminum chemistry stand to secure the venturi at the desired depth
and angle in the water, flexible vinyl tubing, and PVC pipe.
Our model power system consisted of an Aleko 100 Watt 24V solar panel, two UB12100-S 12V 10 Ah
batteries in series, a Geoking GS-1024 charge controller, three 10 A fuses, a 24V to 5V USB charger, and
a Raspberry Pi single board computer connected to a relay for the purpose of timing when the pump
would run. The entire power system was wired with 12 AWG stranded wire.
Our model pond consisted of a 1 m3 inflatable swimming pool. Many steps were taken in order to make
the testing conditions similar to those of our full scale system target environment. The entire experiment
was conducted in a greenhouse set to 25 ºC. Electric water heaters were used to ensure the pool’s water
maintained a 25 ºC temperature as well. Algae were added to achieve real world concentrations and
sodium sulfite was added to simulate fish respiration at varying biomasses. The largest challenge was that
of daylight; trying to replicate an environment that receives 4.5 to 7 peak solar hours per day in a location
that, on average, only receives 2.5 peak solar hours per day this time of the year. Furthermore, the
greenhouse was covered in 50% shade cloth, further decreasing solar energy input. In order to combat this
challenge, three 400 Watt high pressure sodium grow lights were set up on a 12 hour cycle. The lights
14 | P a g e
were on from 6:00 PM to 6:00 AM so simulated “night” would be during the day, making it easier to
collect readings at the predicted pre-dawn minimums.
There were many unforeseen challenges during testing. First, the limited spectrum of the high pressure
sodium bulbs was not sufficient to charge the batteries via the solar panel even with the natural light
available through the shade cloth. After the power system was moved outside to confirm it was actually
working, the aerator itself was moved to line power to provide a more consistent testing environment.
Furthermore, even with the grow lights it was challenging to get the algae to function in a diurnal cycle.
Even during the simulated day at the lowest fish biomass the DO decreased due to the algae respiring
more than they photosynthesized.
Regardless of the challenges during testing a lot of valuable information on the functionality of venturi
aerators was collected. Variables tested in our experiments were pump flow rates, venturi angle, length of
pipe extending off the venturi, and venturi size. Modifying the venturi angle and length of pipe allows for
air injection deeper into the pond giving the bubbles additional time to diffuse oxygen as they rise. Our
tests concluded that a 0.3 m length of pipe and an angle 25 º down from the surface of the water provided
the best oxygen transfer. Longer lengths of pipe meant more bubbles colliding, forming larger bubbles,
and consequently reducing surface area for diffusion. The amount of air injected was similar between the
two systems but the longer length resulted in a lower Kla.
Of the two injectors tested, the smaller nozzle (584) provided a higher KLa. While the larger injector
circulated a higher volume of water, total air injected and consequently, DO added to the water, were
lower. This was a function of our pump which was unable to test the full breadth of rated flow for the
larger venturi. The smaller venturi was known to be more appropriate for the model system but the full
size nozzle was tested for comparison purposes.
3.2 Economic Considerations
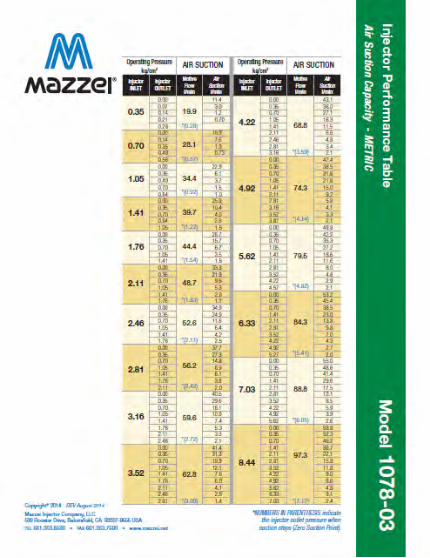
Our venturi system consists of 2 Tunze Turbelle Stream 6125 pumps (Tunze, 2014), each connected to 2
Mazzei 1078 1" diameter venturi injectors (Mazzei Injector, 2014). PVC pipe will be used to bring water
pumped from the bottom of the pond up to and through the venturi nozzles located near the surface of the
pond. The Mazzei injectors are a significant portion of the aerators cost. However, they are also a good
candidate for 3D printing. The aerator capital costs break down is shown in Table 3.

15 | P a g e
Table 3: Aerator capital cost breakdown per component
Component Price 2x Tunze turbelle stream 6125 $412
4x Mazzei 1078 1” injector $208 PVC piping $100
Total $720
Each Tunze pump has a 22 w power draw. With two pumps running for 4 hours that is a 176 W-hr daily
demand. In order to ensure enough stored charge to accommodate for cloudy days we have chosen a 30%
depth of discharge. Since these pumps are 110 V AC and our batteries are 12 V DC we will need to
include an inverter. For our initial design purposes we are calculating with an 80% efficient inverter. That
means our deep cycle lead acid battery must be rated for about 730 W-hr . The UPG UB12750 is rated for
75 A-hr at 12 V (UPG Battery, 2014). Watt-hours can be calculated by Ah x V, giving us a 900 W-hr
rating. That is sufficient for our system. At 30% depth of discharge, we can expect about a 1500 cycle
lifespan on our batteries (Northern Arizona Wind & Sun, 2014). That means they would need to be
replaced at least every 4 years if run every night.
We can estimate the power requirement of our solar array based on the watt-hour demand of our system
divided by the number of peak sunlight hours in the day. Peak sunlight hours are determined by dividing
the amount of solar radiation in a day by 1000 W/m2. Using our minimum case of 4250 W-hr/m2-day
(Barman, 2011) we get 4.25 peak sunlight hours. We assumed that the process of charging the batteries is
75% efficient (Curtis Instruments, 1981). This gives us a watt hour requirement of 235 W-hr. We must
also include the inverter 80% efficiency again for a total of 293 W-hr. 293 W-hr /4.25 hours = 69 watts.
Therefore, a 69 W solar system should be sufficient for this system. Since 69 W is an odd wattage that
would be more expensive than a mass produced size, we will size for a 100 W system. ECO-Worthy
offers 100 W 0.66m2 panels for $82 (eco-worthy, 2014).
A charge controller will also be required in order to ensure that the battery is safely and correctly charged.
The Aleko LM119 12V controller costs $35 and meets our needs (ALEKO). Additional wiring will be
needed to connect everything. We are estimating this at $50. Lastly, an inverter is required to bring the 12
V DC up to the 110 V AC our pumps require. While we have not picked an exact model we anticipate
another $50 for the inverter. The capital cost for the power system break down is shown in Table 4.

16 | P a g e
Table 4: Power system capital cost breakdown per component
Component Price
1x UPG UB12750 75 A-hr 12 V battery $130 1x ECO-Worthy 100 W solar panel $82 1x Aleko LM119 charge controller $35
misc. wiring $50 1x 12 v DC to 110 v AC inverter $50
Total $347
This gives a total capital cost of $1067, assuming we purchase the venturis, with a recurring cost of $130
every 4 years to replace the battery and $412 every 5 years to replace the pumps. Maintenance costs on
this system are minimal. Tunze recommends that the pump be cleaned once a year but it can be done with
only a screw driver (Bulk Reef supply, 2014). With this in mind, an estimated annual maintenance cost of
$15 was determined.
The average inflation rate in Kenya since 2005 is 11% (Kenya Inflation Rate, 2014). As such, we will
apply a discount rate of 15% to evaluate our system over a 10 year period. NPC can be found in Table 5.
Table 5: NPC of system
Year Cost 0 $1067 1 $15 2 $15 3 $15 4 $130 5 $412 6 $15 7 $15 8 $130 9 $15
10 $15 NPC $1443
Over the 10 year life span the system will add 800 g of oxygen per day. That is 800 g/day x 365 days/year
x 10 years for 2920 kg. That means that our system provides oxygen at a price of $0.49/kg O2.
3.3 Environmental Considerations
Most environmental impacts to consider are the result of aquaculture itself and are not dependent on the
method or presence of aeration, though the impacts of the unit are examined. In Kenya the limited
government oversight and lack of funding for conservation efforts have caused problems for natural

17 | P a g e
bodies of water as a result of commercial aquaculture. Over-extraction of water has led to drainage of
wetlands and lakes in several regions causing habitat loss and loss of ecosystem function and services
(Mwanja et al., 2007). This practice is not sustainable. Genetic diversity loss has also been recorded in
some native tilapia populations (Ndiwa et al., 2014), caused by the escape of cultured species from
aquaculture ponds and the capture of native fish for breeding and harvest. A third impact of Kenyan
aquaculture is the potential for parasites in farmed fish to cause human disease. This also occurs with wild
caught fish though and can be prevented by proper storage and cooking (Lima dos Santos and Howgate,
2011).
3.3.1 Production
The environmental impact of added aeration begins with the production of the aeration unit. Plastics like
vinyl tubing, PVC, polypropylene, and those used in the pump housing are derived from crude oil whose
extraction and processing has significant chemical and energy consequences (Baitz 2004). The wiring in
the pump, charge controller, timer, and between systems also have plastics based insulative coatings that
have the same problems (Socolof et al. 2008). The wires themselves are likely copper and, depending on
the level of virgin to recycled metal, also have extraction and processing impacts in the areas of energy
use and chemical release (CopperWire 2005). Solar panels again have impacts due to raw material
extraction; chemical exposure and energy usage are the primary impacts, however, energy use is offset by
panels producing 10-17 times the energy need to build them over their lifetimes (Good Company, 2008).
The batteries are also a significant source of energy consumption and chemical release during their
production, however, it has been shown that lead acid batteries have lower energy use and emissions
during production than nickel, sodium, and lithium based batteries (Lead, 2014).
3.3.2 Operation
The chosen aerator itself will have limited environmental impacts during use. The venturi nozzle and the
pump do not pose any environmental risks during use as a result of their construction and materials. The
greatest impact from a traditional pump is the energy usage, which in this case is low and derived from a
renewable source. The increased circulation and surface agitation will, however, have the positive impact
of preventing algal mats from developing and of making the pond a poor choice for insects to lay eggs
and hatch larvae.
Solar-battery power systems have more impacts than venturi aerators, though still low due to the
renewable nature of solar power. The source of negative impacts is the lead-acid batteries. If left exposed
to poor weather they have the potential to corrode and leak their chemicals into the soil and the pond. This
can lead to a build-up of lead in the environment and in the fish themselves (Van der Kuijp et al., 2013).

18 | P a g e
3.3.3 Post Design Life
The future of each component after it has reached the end of its design life also has the potential to play a
significant role in the system’s environmental impact. The availability of proper waste disposal and
recycling in Kenya is an issue. Items like the pipes and tubing can be recycled but rarely are, if they were
to be repurposed by the farmer or in the village it would have a positive economic and environmental
impact (Baitz 2004). All wiring and electronic components can be resold to a refurbisher but this may be
difficult depending on how isolated the farm is. There is currently very little government control of
electronic waste though it is a listed concern of several governmental departments. If items are not resold
they are likely to simply be dumped where they will release harmful chemicals like mercury, not to
mention the economic loss to the farmer (Mureithi et al. 2008). There has been research into the use of
old solar panels to make new panels showing a two thirds reduction in energy input need, this is an
underutilized possibility that would hopefully grow over the design life of the panel making it a viable
option (Good Company, 2008). There are battery recycling facilities in Kenya and organizations that
collect used batteries (Chloride Exide, 2014).However, the farmer would have to take the initiative to get
these organizations to come, an incentive for this is that there is often money available for recycling as the
recycled items have value. There are also some control and safety issues within these recycling plants,
one in Kenya is facing issues as a result of lead being released into the nearby town, a serious health risk
(Were etal, 2009). All components can be recycled or repurposed decreasing their environmental impact
with a small amount of effort on the part of the farmer.
3.4 Social Considerations
Aquaculture has the potential to increase per capita incomes for all Kenyan households (Kaliba et al.,
2007) Aquaculture provides a sustainable way to grow fish as a farmer and aquaculture farming practices
can be integrated into existing farming systems (Kaliba et al., 2007). Additionally, if men already have
jobs then aquaculture is a viable source of income for Kenyan women. (Ndanga et al., 2013)
Pond aquaculture is more efficient than other farming practices and conserves water compared to other
aquaculture methods. Tilapia are able to convert 1.6 kilograms of feed into one kilogram of fish with one
of the lowest FCR of protein sources for people; this ratio could save thousands of dollars and thousands
of acres of land when compared to cattle’s FCR of 10 (Siddiqui et al, 1988). The pond systems conserve
water through natural recycling of nutrients which algae feed off, in-turn, the fish feed off of the algae.
The Kenyan government and supporting governments know the potential of aquaculture and are actively
researching best practices.

19 | P a g e
3.4.1 Government
Kenyan government has not implemented specific policies or incentives regarding aquaculture, however,
they do realize the potential of aquaculture. The USAID funded an Aquaculture Collaborative Research
Program examining the economic potential of aquaculture and Kenya’s government has been a part of it.
Another ambition of the Kenyan government is to have a power supply to the entire nation. Between a
multitude of plans and policies (Least Cost Power Development Plan, Rural Electrification Master Plan,
Sessional Paper No. 4 of 2004, The Energy Act of 2006, The Feed-in Tariff Policy, The Kenya National
Climate Change Response Strategy, Kenya Vision 2030) it is clear that the Kenyan government is
determined to supply power through consistent means such as renewable energies to all of their citizens
(Kenya Fact Sheet, 2014).
With this attempt to provide electricity to the nation, Kenyan government has focused on large scale wind
farms that enhance the grid. (“Electrifying Kenya”, 2014) Regardless of this, as of 2010, Kenya was the
world leader in the number of solar panels sold per capita. Off-grid solar installations were growing faster
than standard line-in grid connection. To make this process cheaper and even faster the founder of M-
PESA has developed M-KOPA. This program supplies 4-watt rooftop panels with charging capabilities at
discounted prices and with a pay-as-you-go period ("Kenya's M-KOPA", 2014). The M-KOPA system
targets low income earners in Kenya it had 1000 units sold in the first four months of production and is a
growing program.
4.0 Design Summary
A solar battery powered venturi aerator is the recommended design for cost effective aeration of semi-
intensive tilapia aquaculture ponds. The unit is designed for use in developing nations where line power is
not available or not reliable. Line power has the potential to be a less expensive system in locations where
an existing, relatively reliable grid is nearby, a venturi aerator would still be recommended in that case.
The complete unit consists of two pumps and four venturi nozzles set up in two modules at opposite
corners of the pond. A power system consisting of a 100 W solar panel, a charge controller, 75 A-hr
worth of 12 Volt lead-acid battery, a timer, and an inverter will provide energy to run the system for four
hours each night. The unit can be run for longer in systems with more algae or higher fish biomass,
however, if run for longer time periods the batteries will experience deeper discharge and shorter
lifespans. If run for four hours the aeration unit will put in 0.8 kg of O2, increasing the DO by as much as
4 mg/L. Energy beyond that needed to recharge the batteries during the day will provide additional
aeration during the day when available as well as making it possible to charge small household devices.
The system will cost $1067 to install if nozzles are purchased, if the nozzles are printed using a 3D printer
the price could decrease by as much as $200. Small loans are available in many developing nations,

20 | P a g e
including Kenya, for farmers looking to improve their businesses. Recurring costs include $15 annually
for maintenance as well as $130 every 4 years to replace the batteries and $412 every 5 years to replace
the pumps. Resale of the original items for use in less demanding systems could recoup some of the
replacement costs.
21 | P a g e
5.0 References
“1078gph Polypropylene Mazzei Injector - 1".” N.p., n.d. Web. 27 Nov. 2014.
“ALEKO | LM119 12V Charge Controller for Solar Panel.” www.alekoproducts.com. N.p., n.d. Web. 7
Dec. 2014.
Armand, M., and J.-M. Tarascon. “Building Better Batteries.” Nature 451.7179 (2008): 652–657.
www.nature.com. Web. 27 Nov. 2014.
Bankston, J. David, Fred Eugene Baker, and Martin W. Brunson. Open Channel Flow in Aquaculture.
Southern Regional Aquaculture Center, 1995. Google Scholar. Web. 8 Dec. 2014.
Barman, Jonas. “Design and Feasibility Study of PV Systems in Kenya.” Chalmers Univeristy of
Technology (2011): n. pag. Print.
Bostock, John et al. “Aquaculture: Global Status and Trends.” Philosophical Transactions of the Royal
Society B: Biological Sciences 365.1554 (2010): 2897–2912. rstb.royalsocietypublishing.org.
Web. 4 Nov. 2014.
Boyd, Claude E. “Pond Water Aeration Systems.” Aquacultural Engineering 18.1 (1998): 9–40. Web.
Boyd, Claude E, and Taufik Ahmad. “Evaluation of Aerators for Channel Catfish Farming.” Alabama
Agricultural Experiment Station Bulletin 584. Alabama: Auburn University, 1987. 1–52. Print.
Campbell, Brooke, and Daniel Pauly. “Mariculture: A Global Analysis of Production Trends since 1950.”
Marine Policy 39 (2013): 94–100. ScienceDirect. Web. 4 Nov. 2014.
Chloride Exide. "The Longer Lasting Battery" www.cekl.co.ke.
Creel Pump, Inc. “Splash 2001.” Creel Pump, Inc. N.p., n.d. Web. 3 Nov. 2014.
Curtis Instruments. Lead Acid Traction Batteries. Ed. Ken Marsh. Mt. Kisco, N.Y: Curtis Instruments,
1981. Print. Battery Book 1.
eco-worthy. “12V 100w 100 Watt Solar panel|Eco-Worthy.” N.p., n.d. Web. 7 Dec. 2014.
“Electrifying Keyna: How One African Country Is Approaching Renewable Energy Development.”
Renewable Energy World. N.p., n.d. Web. 26 Nov. 2014.
Hirahara, Hiroyuki et al. “Testing Basic Performance of a Very Small Wind Turbine Designed for Multi-
Purposes.” Renewable Energy 30.8 (2005): 1279–1297. CrossRef. Web. 8 Dec. 2014.
“Installing and Maintaining a Small Wind Electric System.” Energy.gov. N.p., n.d. Web. 24 Nov. 2014.
Kaliba, Aloyce R et al. “Economic Profitability of Nile Tilapia (Oreochromis Niloticus L.) Production in
Kenya.” Aquaculture Research 38.11 (2007): 1129–1136. Wiley Online Library. Web. 4 Nov.
2014.
Kaliba, Aloyce R. et al. “Potential Effect of Aquaculture Promotion on Poverty Reduction in Sub-Saharan
Africa.” Aquaculture International 15.6 (2007): 445–459. CrossRef. Web. 26 Nov. 2014.

22 | P a g e
“Kenya Inflation Rate | 2005-2015 | Data | Chart | Calendar | Forecast.” N.p., n.d. Web. 16 Jan. 2015.
“Kenya Power >> Powering People for Better Lives | Kplc.co.ke.” N.p., n.d. Web. 8 Dec. 2014.
“Kenya’s M-KOPA Offers Cheaper Solar Power to Off-Grid Villages.” Renewable Energy World. N.p.,
n.d. Web. 26 Nov. 2014.
Kumar, Avinash, Sanjib Moulick, and Bimal Chandra Mal. “Selection of Aerators for Intensive
Aquacultural Pond.” Aquacultural Engineering 56.0 (2013): 71–78. Web.
Lee, Kenneth et al. Barriers to Electrification for “Under Grid” Households in Rural Kenya. National
Bureau of Economic Research, 2014. Google Scholar. Web. 25 Nov. 2014.
"Life-Cycle Environmental Performance of Silicon Solar Panels." Oregon.gov. GoodCompany.com.
August 2008.
Lima dos Santos, Carlos A.M., and Peter Howgate. “Fishborne Zoonotic Parasites and Aquaculture: A
Review.” Aquaculture 318.3-4 (2011): 253–261. CrossRef. Web. 26 Nov. 2014.
Martin, Melanie J. “Life After Generators.” Alternatives Journal 38.5 (2012): 10–11. Print.
Mureithi, M et al. "E-Waste in Kenya: Baseline Assessment." Waste Management Conference of the
IWMSA. October 2008.
Mwanja, Wilson Waiswa et al. “Status and Impact of Rural Aquaculture Practice on Lake Victoria Basin
Wetlands.” African Journal of Ecology 45.2 (2007): 165–174. Print.
“Mywage.org/Kenya - Kenya, Minimum Wages in Kenya, Labour Institutions Act, Agricultural Industry,
Minimum Wages Nairobi, Minimum Wages Mombasa, Minimum Wages Kisumu, Minimum
Wages in Mavoko, Minimum Wages in Riuru, Minimum Wages in Limuru.” N.p., n.d. Web. 25
Nov. 2014.
Ndanga, Leah Z.B., Kwamena K. Quagrainie, and Jennifer H. Dennis. “Economically Feasible Options
for Increased Women Participation in Kenyan Aquaculture Value Chain.” Aquaculture 414-415
(2013): 183–190. CrossRef. Web. 26 Nov. 2014.
Ndiwa, Titus Chemandwa, Dorothy Wanja Nyingi, and Jean-François Agnese. “An Important Natural
Genetic Resource of Oreochromis Niloticus (Linnaeus, 1758) Threatened by Aquaculture
Activities in Loboi Drainage, Kenya.” Ed. Valerio Ketmaier. PLoS ONE 9.9 (2014): e106972.
CrossRef. Web. 26 Nov. 2014.
Northern Arizona Wind & Sun. “Deep Cycle Battery FAQ.” N.p., n.d. Web. 7 Dec. 2014.
“Point Four Systems - A Water Quality & Instrumentation Company.” N.p., n.d. Web. 27 Nov. 2014.
Rogers, Gary. “Varied Aerator Designs Provide Oxygenation, Mixing In Biofloc Systems.” The Global
Aquaculture Advocate Oct. 2010: 50–51. Print.
Sanitaire. Diffused Aeration Design Guide. Xylem Water Solutions. Web.
23 | P a g e
Siddiqui, Abdul Q., Mohammad S. Howlader, and Ahmad A. Adam. “Effects of Dietary Protein Levels
on Growth, Feed Conversion and Protein Utilization in Fry and Young Nile Tilapia, Oreochromis
Niloticus.” Aquaculture 70.1–2 (1988): 63–73. ScienceDirect. Web. 8 Dec. 2014.
Tucker, Craig. “Pond Aeration.” Southern Regional Aquaculture Center, Publication 3700 (2005): n. pag.
Google Scholar. Web. 4 Nov. 2014.
“Tunze Turbelle Stream 6125.” Bulk Reef Supply. N.p., n.d. Web. 27 Nov. 2014.
“UPG UB-12500 Sealed Lead Acid - AGM Battery.” N.p., n.d. Web. 27 Nov. 2014.
Van der Kuijp, Tsering Jan, Lei Huang, and Christopher R. Cherry. “Health Hazards of China’s Lead-
Acid Battery Industry: A Review of Its Market Drivers, Production Processes, and Health
Impacts.” Environmental Health 12.1 (2013): 61. Print.
Were, Faridah H. et al. “Air and Blood Lead Levels in Lead Acid Battery Recycling and Manufacturing
Plants in Kenya.” Journal of Occupational and Environmental Hygiene 9.5 (2012): 340–344.
Web. 25 Feb. 2015.

24 | P a g e
Appendices
Appendix A – Original Design Problem as stated for BEE 469 Senior Design
Aquaculture is of growing significance in satisfying the need for food. Technically there are many challenges in large-scale aquaculture systems, including water consumption, quality of discharge, and maintenance of conditions for optimal growth of the target species. In this project you will address the technical issue of provision of oxygen to a system raising tilapia for human consumption. The system you are designing should be suitable for a location where line-power electricity is not available. You are to design an oxygen delivery system to be demonstrated in a 2 m^3 tank that will contain 3-5 tilapia throughout their life cycle. Your design should balance cost (initial and operations), environmental sustainability, robustness, and feasibility. You will build your solution and it will be tested under real-world conditions as would be found in Corvallis Oregon in March, and should be shown to be suitable to year-round operation in Corvallis. You will be provided a $500 budget for hardware and shipping required to build your device. All orders must be sent electronically to Kathleen Martin, and be authorized by an instructor. You may make no more than 10 purchases, where a “purchase” is a single list of items to be obtained, or a single submission of receipts to be reimbursed, potentially from multiple vendors (to void excessive burden on Kathleen). For computation of shipping costs, note that the department has Amazon Prime.
Some of the challenges are: 1. Robust operation under highly variable climatic conditions. 2. Wide spatial-temporal variation in oxygen demand. 3. Variation in the configuration of existing aquaculture systems. 4. Many regulatory issues involving multiple Govt. agencies. 5. Multiple stake holders and operators with differing needs and abilities. The overall goal of this project is to design, develop and evaluate different options for aquaculture pond aerators to meet all applicable regulations while minimizing the economic costs and environmental impacts of the proposed design. The proposed design must strive to minimize the need to alter existing aquaculture practices. At a minimum your design must include the following elements: 1. Meet the safety and environmental regulatory requirements. 2. Meet functionality constraints in terms of water usage patterns and existing agricultural practices. 3. Incorporate measures to conserve water, harvest water, improve water reuse/recycle and reduce discharge. 4. Consider climatic factors in your design. 5. Economic considerations in all designs (Capital versus operating costs, comparison to current state of affairs). 6. Scalability to accommodate different funding scenarios. Completion of this project will include the provision of a complete, buildable design with supporting calculations demonstrating feasibility, evaluation of the net present value of the design, and a comprehensive life-cycle analysis.

25 | P a g e
Appendix B – Costs of each system
Power System costs and lifespan
Paddle Wheel Vertical Pump PCSC Diffuse Battery Diffuse Air Venturi
Capital $600 $800 $1350 $1200 $2000 $500 Annual $20 $15 $10 $10 $10 $10
Lifespan high high high high high high
Aerator costs and lifespan
Solar Air Solar Battery Human Wind Diesel Line Capital 4500 1500 150 2200 150 400 Annual 5 350 1950 200 520 40
Replacement never difficult never low low never

26 | P a g e
Appendix C – Full matrices Aerator Matrix Weight Paddle Vertical PCSC DiffuseB DiffuseA Venturi Functionality Robustness 1 10 9 9 9 9 9 Integration with Existing 2 10 10 9 8 8 10
Appropriate for Target Volume 4 3 7 9 9 9 8
Algal Effects - both ways 2 5 5 4 4 4 5
Ease of Harvesting 2 10 10 8 10 10 10 Fish Health 4 10 8 10 10 10 10 Affected Area 4 6 6 6 9 9 10 Power System Adaptability 3 9 9 9 10 10 9
Maintenance 3 7 8 8 9 9 8 Daily Work 2 9 9 9 9 9 9
Total 27 202 212 220 240 240 240 Normalize 35 26.2 27.5 28.5 31.1 31.1 31.1
Technical Developed 1 10 9 8 9 9 8 Scalable 3 8 8 8 9 9 8
Total 4 34 33 32 36 36 32 Normalize 10 8.5 8.3 8.0 9.0 9.0 8.0
Environmental 2.2 1.8 3.2 1.6 1.6 1.6 SAE - brake power 3 6.6 5.4 9.6 4.8 4.8 4.8 Other 1 8 9 9 10 10 9
Total 4 27.8 25.2 37.8 24.4 24.4 23.4 Normalize 10 7.0 6.3 9.5 6.1 6.1 5.9
Social Theft Risk 4 4 4 6 4 4 6 Farmer Acceptance 5 10 8 8 9 9 7 Noise Pollution 1 6 7 9 9 9 10
Total 10 72 63 73 70 70 69 Normalize 10 7.2 6.3 7.3 7.0 7.0 6.9
Economic Capital Costs 2 7 6 3 4 1 8 Operational Costs 2 4 6 8 8 8 8 Lifespan & Replacement 1 10 10 10 10 10 10
Total 5 32 34 32 34 28 42 Normalize 35 22.4 23.8 22.4 23.8 19.6 29.4
Overall 100 71.2 72.1 75.7 77.0 72.8 81.3

27 | P a g e
Power System Matrix Weight
Solar Air
Solar Battery Human Wind Diesel Line
Functionality Robustness 1 4 4 9 7 8 5 Integration with Existing and Aerators 2 4 10 6 10 9 10
Resiliency 4 6 6 8 6 10 7 Locational Suitability 4 10 10 9 3 8 4 Maintenance 2 9 9 8 8 6 10 Daily Work 2 10 10 1 10 8 10
Total 15 114 126 107 99 126 109 Normalize 35 26.6 29.4 25.0 23.1 29.4 25.4
Technical Developed 1 8 8 10 9 10 7 Scalable 3 10 10 9 9 9 10
Total 4 38 38 37 36 37 37 Normalize 10 9.5 9.5 9.3 9.0 9.3 9.3
Environmental Emissions 2 10 10 10 10 1 6 Disposal 2 10 6 9 10 8 10 Other - alternative dependent 1 9 8 10 8 10 9
Total 5 49 40 48 48 28 41 Normalize 10 9.8 8.0 9.6 9.6 5.6 8.2
Social Government Stance 2 7 7 10 9 7 9 Theft Risk 4 7 5 4 10 4 8 Farmer Acceptance 5 9 8 4 7 7 5 Noise Pollution 1 10 10 9 5 4 10
Total 12 97 84 65 98 69 85 Normalize 10 8.1 7.0 5.4 8.2 5.8 7.1
Economic Capital Costs 2 2 5 9 3 9 7 Operational Costs 2 10 6 1 7 4 9 Lifespan & Replacement 1 10 5 9 7 8 10
Total 5 34 27 29 27 34 42 Normalize 35 23.8 18.9 20.3 18.9 23.8 29.4
Overall 100 77.8 72.8 69.5 68.8 73.8 79.4

28 | P a g e
Appendix D – Model Results
Formal Test Results
Hours since
Nightfall
Monday (50g) Tuesday (100g) Wednesday (150g) Thursday (200g) Friday (250g) DO
(ppm) Temp (ºC)
DO (ppm)
Temp (ºC)
DO (ppm)
Temp (ºC)
DO (ppm)
Temp (ºC)
DO (ppm)
Temp (ºC)
2 5.7 24.6 4.5 24.3 1.8 24.7 0.6 24.1 0.4 24 3 6 24.7 4.9 24.6 1.7 24.4 8.8 23.1 1.9 24.3 4 5.7 24.6 4.3 23.6 1.5 24.2 0.2 24.1 2.4 24.6 5 5.6 24.4 4.4 24.5 1.3 24.3 0.3 23.9 2.1 24.5 6 5.5 24.5 4.3 24.6 1.1 24.1 0.2 24.5 1.8 24.4 7 5.5 24.6 5.1 24.1 1.1 23.9 0.7 24.6 2.9 24.3 8 6.1 24.7 5.3 24 1.6 23.9 1.4 24.4 4.6 23.9 9 4.6 24.9 5.6 24.8 3.3 24.3 2.7 24.2 4.8 24.4
10 6.0 24.3 6.2 24.5 4.5 24.1 3.5 24.1 5.2 24.5 11 6.0 24.2 6.6 24.2 5.0 24.0 3.9 24.3 5.0 24.2 12 6.1 24.4 6.4 24.2 3.5 23.6 4.9 24.3 - -
Energy 156 W-hr 184 W-hr 184 W-hr 212 W-hr 212 W-hr Note: Grey writing indicates bad data. Green blocks indicate that the aerator was running.
Situational effectiveness cannot be proven due to the extreme low DOs at nightfall. This was the result of the grow lights not providing enough energy to the algae and an insufficient algae population. We were able, however, to get the DO up to 5 ppm by dawn every day.
Kla Test Results
Speed (pump)
Angle (º)
Length (ft)
Kla (hr-1)
4 25 0 0.2 5 25 0 0.23 6 25 0 0.25 7 25 0 0.28 8 25 0 0.25 7 25 2 0.28 7 25 1 0.3 7 15 1 0.26
The values fall in a narrow range and insufficient time passed during testing for concrete results. The testing model was based off the highest Kla, 0.3. This Kla was the result of pump speed 7 with a 1 ft extension and an angle of 25º. More involved testing would be required for more accurate and precise results that could be extrapolated to a broader set of circumstances.


1/13

2/13

3/13

4/13

5/13

6/13

7/13

8/13

9/13

10/13

11/13

12/13

13/13

Charge Controller
USB Charging Station
Raspberry Pi
Bread Board
Relay
Pump Speed
Controller
12V 10Ah Battery
12V 10Ah Battery
Power Board Diagram:
to solar panel

44 | P a g e
Appendix G – Nozzle Specs

46 | P a g e
Appendix H – Pump Specs
Tunze Turbelle® stream 6125
For aquariums from 400 to 2,000 litres (105 to 525 USgal.) Flow rate: abt. 12.000l/h (3,150 USgal./h) Energy consumption: 22W Voltage / frequency: 230V/50Hz (115V/60Hz) Cable length: 2m (78 in.) Dimensions: diam. 90mm (3.5 in.) Ejection: diam. 63mm (2.48 in.) Magnet Holder with Silence clamp up to a glass thickness of 15mm (1/2")