solar pv in the - researcharchive.vuw.ac.nz
TRANSCRIPT
i
SOLAR PHOTOVOLTAICS IN PACIFIC ISLAND NATIONS:
AN ANALYSIS OF RURAL HOUSEHOLD ELECTRIFICATION STRATEGIES
IN THE RMI AND VANUATU
by
Juliana Ungaro
Thesis
ENVIRONMENTAL STUDIES 593
[2012]
A 90-point thesis submitted to Victoria University of Wellington,
as partial fulfilment of requirements for the degree of
Master of Environmental Studies
School of Geography, Environment and Earth Sciences
Victoria University of Wellington
[May, 2012]

ii

iii
SOLAR PHOTOVOLTAICS IN PACIFIC ISLAND NATIONS:
AN ANALYSIS OF RURAL HOUSEHOLD ELECTRIFICATION STRATEGIES
IN THE RMI AND VANUATU
by
Juliana Ungaro
ABSTRACT
Rural electrification of Pacific Island Countries (PICs) through renewable energy is
necessary for poverty alleviation, energy security, improved health, and to mitigate the
effects of climate change, with solar PV being the preferred technological solution.
However, electrification projects in PICs have had a high rate of failure, which has led to
the adoption of various electrification strategies. This research has analysed the essential
criteria for creating effective and enduring electrification models for rural household-scale
electrification in PICs. A case study on self-initiated solar PV home systems (SHSs)
demonstrated rural end-users‘ ability and desire to maintain SHSs of their own accord,
while at the same time liberating their community of reliance on kerosene. The results
suggested that market solutions that pay sufficient attention to social dimensions of project
design and implementation are more likely to be successful in meeting end-users needs and
providing enduring results. Such approaches have fewer organizational layers, allow for
end-user participation and education, and encourage self-initiative. The need for such social
solutions is well documented in the development literature, yet many of the electrification
programs in PICs did not allocate sufficient funds to understanding and incorporating these
social aspects. This research concludes that a proper balance in the overarching program
design between the technical and social focus of projects is required, as each are equally
important for project effectiveness and durability.
Key words: renewable energy, solar PV household systems, rural electrification methods,
participatory practices, evaluation indicators, Pacific Islands, Vanuatu, Marshall Islands.

iv
Acknowledgments
I would like to express my gratitude to everyone and everything that has helped to
guide and support me during my Masters journey. First, thank you to Wellington with its
late night cafes, yoga studios, mountainous beauty, and numerous beaches, which gave me
inspiring places to both work in and take breaks.
Of course, thank you to my supervisor, Dr. Sean Weaver, for his patience with me
and encouraging words.
Thank you to my family - my Mom, for her always “looking it over one more time,”
and to both of my parents for their endless love and support. And thanks to my brother
Craig, for sharing our Masters journey together from across the world.
Thank you to Island Eco, for their help in carrying out this research -- through
much guidance and assistance with collecting data. And thanks to the respondents in
Vanuatu and the Marshall Islands for their time and honesty, and to my „second family‟ in
Vanuatu - Henry, Fiona, Edna, Julie, Sophie, and Elvina- who helped my love and
understanding of the Pacific to grow.
Also, I would like to thank my many fun-loving and supportive friends who have
been with me the last two years in Wellington: Alejandra, Veruska, Euginia, Fei, Seema,
Alejo, Lukas, Scott, Amar, Shakil, and many others. Finally, I would like to thank Dr. Ray
for the late night laughter, walks on the beach, and metta charges which has kept me both
grounded and energized during this journey.
v
Table of Contents
ABSTRACT and Key Words...........................................................................................................iii
Acknowledgments.............................................................................................................................iv
Acronyms used with the Text...........................................................................................................xi
Chapters:
Chapter 1: Introduction to Renewable Energy in the Pacific Islands
1.1 Renewable Energy Project Challenges........................................................................................ 1
1.2 PIC Renewable Energy Targets....................................................................................................5
1.3 PIC Energy Security......................................................................................................................6
1.4 Renewable Energy Demand: Health, Poverty Eradication, and Climate Change ........................9
1.5 Renewable Energy Supply: Technical Opportunities and Challenges........................................11
1.6 Renewable Energy Project Implementation: Socio-cultural Challenges....................................13
1.7 Implications for this Thesis…………………………………………………………....……….16
Chapter 2: Research Purpose and Aim
2.1 Research Focus: Rural PV Electrification Strategies..................................................................17
2.1.1 Variations in Electrification Models………………………………………….....…………17
2.1.2 Differences in the Electrification Strategies……………………………………......…........19
2.2 Electrification within the Development Context.........................................................................21
2.3 Relevance of this Thesis………………………………………………………………....……..22
2.4 Aim of this Thesis.......................................................................................................................23
2.5 Research Objectives and Questions............................................................................................24
2.6 Structure of the Thesis.................................................................................................................26
Chapter 3: A Review of the Literature on Indicators, Challenges, and Successes
3.1 Overview…………………………………………………………………………....………….27
3.2 Indicators for RE Project Evaluation……………………………………………...…………...27
3.3 Barriers for Rural Electrification……………………………………………………....……….30
3.4 Barriers and Recommendation for Each Indicator…………………………………....………..32
3.4.1 Technical Indicators…………………………………………………………...……………32
3.4.2 Economic Indicators…………………………………………………………....…………...36
3.4.3 Institutional Indicators……………………………………....………………………………38
3.4.4 Social Indicators……………………………………………………….…..………………..41
3.4.5 Cultural Indicators……………………………………………….………...………………..44
3.4.6 Environmental Indicators…………………………………………...………………………45
3.5 Success Factors……………………………………………………...…………………………46
Chapter 4: Research Methodology
4.1 Overview.....................................................................................................................................48
4.2 Literature Review addressing Objective One..............................................................................49

vi
4.3 Documentary Analysis addressing Objective Two.....................................................................49
4.4 Primary Research Country Overviews........................................................................................50
4.5 Questionnaires addressing Objective Three................................................................................52
4.6 Interviews addressing Objective Four.........................................................................................57
4.7 Data Analysis..............................................................................................................................58
4.8 Ethical Issues...............................................................................................................................59
Chapter 5: An Analysis of SHS Projects Implemented in PICs
5.1 A Global Summary of SHS Implementation Models……………....…………………………..60
5.1.1 User-owned systems…………………………………………...……………………………60
5.1.2 RESCOs……………………………………………………….……………………………61
5.2 An Overview of SHS Projects in PICs…………………………………..……………………..62
5.2.1 Private sector………………………………………………………..………………………62
5.2.2 RESCOs……………………………………………………………..……………………...63
5.2.3 Community-based approaches……………………………………..……………………….64
5.2.4 Clean Development Mechanism (CDM)……………………...…………………………….65
5.3 SHS Projects in the RMI………………………………………...……………………………..65
5.3.1 Past Projects…………………………………………………..…………………………….65
5.3.2 Ongoing Projects……………………………………………...…………………………….65
5.4 SHS Projects in Vanuatu……………………………………...………………………………..66
5.4.1 Past Projects………………………………………………..……………………………….66
5.4.2 Ongoing Projects……………………………………………...…………………………….66
5.5 Trends in Project Documents……………………………………...…………………………...67
5.6 Lessons Learned as Stated in PIC Project Documents……………...………………………….70
Chapter 6: The Quantitative Data Results and Analysis
6.1 Results of the Quantitative Questionnaire by Indicators………….......………………………..74
6.2 Conclusions and Implications…………………………………..……………………………...97
Chapter 7: The Qualitative Data Results and Analysis
7.1 Results of the Qualitative Interviews by Indicators………………….……………………….100
7.2 Interviewees‘ Beliefs on Electrification Strategies and Essential Factors…….……………...111
7.3 Implications of the Qualitative Data Analysis……………………………….……………….114
Chapter 8: Recommendations and Discussion
8.1 Recommendations on Electrification Strategies………………..……………………………..116
8.2 Recommendations for Reducing Project Risk……………………..………………………….123
8.3 A Balanced Electrification Strategy……………………………..…………………………….125
8.4 Limitations of the Research…………………………………………...……………………….137
Chapter 9: Conclusions……………………………………...…………………………………..138
References…………………………………………………………………………….......………141
Personal Communication References………………………………………………...………...152
vii
Tables:
Table 1.1.1: Human Poverty Index and Human Development Index for PICs...................................4
Table 1.3.1: The Marshall Islands‘ and Vanuatu‘s retail fuel and electricity prices
and those of nearby developed countries: the United States and Australia
as of mid-2011................................................................................................................................8
Table 1.3.2: Fuel imports as a percent of GDP, in 2002 and 2008.....................................................9
Table 2.1.1.1: A summary of the variations on the two implementation strategies,
as cited in the literature……………………………………………………………...…………..19
Table 3.2.1: Evaluation indicators for case-study evaluation, compiled from the
cited literature………………………………………………………………………........………29
Table 3.5.1: A summary of the success factors cited in the literature by indicator…............……...46
Table 4.1.1: Research Objectives and Corresponding Methods, and the chapter
wherein the methodology is carried out………………………………………......……………..48
Table 4.4.1: A comparison of the RMIs‘ and Vanuatu‘s national statistics and
geography......................................................................................................................................51
Table 4.4.2: Urbanization trends in the Marshall Islands and Vanuatu............................................52
Table 5.6.1: Lessons learned as stated in project documents in PICs……………………..……….71
Table 6.1.1.1: Akhamb‘s 43 SHSs‘ specifications and usage (Q#25)………………………..……76
Table 6.1.4.1: A comparison of the cost per kW hour of the systems managed
by MEC and those installed on Akhamb Island…………………………………………..…….80
Table 6.2.1: Conclusions and implications of the quantitative data analysis…….........……….......98
Table 7.2.1: Interviewees‘ responses to Interview Question 13…………………….……………112
Table 7.3.1: Implications of the Qualitative Data Analysis……………………………..………..113
Table 8.1.1: Positive and negative aspects of each electrification model, based
on the literature, project documents, case studies, and interviews………………...…………..118
Table 8.2.1: Success factors for enduring results……………………………………………..….123
Figures:
Figure 1.1.1: The components of a solar PV home system…………………………………........….2
Figure 1.2.1: Excerpt from the RMI National Energy Policy.............................................................5
Figure 1.3.1: Map of the Oceania region, including the North and South Pacific
Islands............................................................................................................................................7
Figure 1.5.1: Solar module price trends over the past decade..........................................................12
Figure 1.5.2: Examples of pre-wired systems designed for remote settings,
from small to large scale................................................................................................................12
Figure 1.6.1: Suggested socio-cultural factors and solar PV project implications
in rural Vanuatu and RMI communities........................................................................................13
Figure 2.1.1.1: The common features of the RESCO and user-owned electrification
models…………………………...................................................................................……….17
Figure 2.1.1.2: A flow-chart demonstrating the differences between system
procurement by private companies and project development through the
government....................................................................................................................................18
Figure 2.2.1: A Ladder of Citizen Participation................................................................................22
viii
Figure 3.3.1: Barriers cited in the literature for rural RE electrification of PICs….........………….31
Figure 3.4.1.1: A 12-volt DC powered energy efficient TV, which consumes
less power than standard TVs and are ideal for SHS applications…………....…………………34
Figure 3.4.1.2: The Rural Electricity Ladder…………………………………...………………….35
Figure 4.5.1: A map of Namdrik Atoll and its location in the RMI.................................................53
Figure 4.5.2: The cover of the Marshallese Solar Training Manual.................................................54
Figure 4.5.3: A photograph of Akhamb Island, a map of Malekula with Akhamb
Island highlighted, and its location in Vanuatu.............................................................................55
Figure 5.5.1: Positive and Negative Results found in RESCO and User-owned
PIC project documents by the number of occurrences of each indicator......................................69
Figure 6.1.1.1: Which Parts had been Replaced in the SHSs at the Time of
Research (Q#21)……………………………………………………………………....…………75
Figure 6.1.2.1: Other Power Sources Households have in Addition to their
Most Recent SHS (Q#7)…………………………………………………………….....………...78
Figure 6.1.2.2: What Appliance Users Would Like to Add to their SHS (Q#26)……....…………78
Figure 6.1.4.1: Amount Akhamb SHS Owners Spend on their System per Year
(Q#18)……………………………………………………………………………….....………..81
Figure 6.1.5.1: Activities that SHS Owners use their Solar Powered Lights
for by Percentage (Q#9)…………………………………………………....……………………82
Figure 6.1.5.2: Freezer Usage on Namdrik by Percentage (Q#10)……….....……………………..82
Figure 6.1.5.3: Households‘ Primary Source of Income (Q#5)…………………………....………83
Figure 6.1.6.1: User‘s Confidence in being able to Fix or Get Help to Fix
their SHS, by Location (Q#28-30)……………………………………………………....………84
Figure 6.1.6.2: How Well Users feel their SHS has been Maintained (Q#23
and 40)…………………………………………………………………………………...………84
Figure 6.1.6.3: How Well Users feel their Lights have Worked (Q#24 and 41)………..…………85
Figure 6.1.8.1: Did Someone in the Household Participate in the SHS
Installation? (Q#27)…………………………………………………………………...…………86
Figure 6.1.9.1: Number of Men and Women in Total that feel Confident Fixing
a SHS (more than one per family) (Q#45 and 46)……………………………………..………..88
Figures 6.1.10.1: Average Biweekly Income per Household (USD) on Namdrik
Atoll; Average Biweekly Income per Household (USD) on Akhamb Island
(Q#4)……………………………………………………………………………………..……...90
Figure 6.1.10.2: Do you Spend More or Less on your SHS than on your Previous
Power Source? (Q#19)………………………………………………………………..…………90
Figures 6.1.10.3: Namdrik Household Source of Lighting before their IE-installed
SHS; Akhamb Household Source of Lighting before their Most Recent SHS
(Q#8)……………………………………………………………………………………...……..90
Figure 6.1.11.1: The Highest Level of Education of Respondents by Percentage
(Q#6)……………………………………………………………………………………...……..92
Figure 6.1.11.2: How did Respondents that felt Confident Fixing a SHS Learn?
(Q#47)…………………………………………………………………………………...………92
Figure 6.1.12.1: Who Maintains the Previous and Current SHSs in the Two
Case Studies? (Q#14 and 32)………………………………………………………....…………93

ix
Figure 6.1.12.2: Trends in Participation and Ownership……………………………....…………..94
Figure 6.1.13.1: Reasons Respondents Purchased their Most Recent SHS (Q#11)……....……….95
Figure 6.1.13.2: How Willing Users were to Spend Money to Fix their Current
SHS (Q#31)………………………………………………………………………...……………96
Figure 7.2.1: Interviewees‘ responses to Interview Question 12…………………………………111
Figure 8.3.1: A Project Risk Mitigation Framework for identifying threats to
SHSs in PICs, and suggested actions to mitigate these threats………………….……………..127
Photographs:
Photograph 1.2.1: Banner announcing the launch of the Vanuatu National
Energy Roadmap.............................................................................................................................6
Photograph 3.4.2.1: A SHS located at a local school in Vanuatu, which provides
lighting for studying at night………………………………………………………….....……....36
Photograph 3.4.3.1: A training session for women at Utrok Atoll, Marshall
Islands…………………………………………………………………………….....…………...40
Photograph 3.4.4.1: A rural RMI household receives a new solar-powered
refrigerator, which will help to decrease women‘s workload………………….....……………..42
Photograph 3.4.6.1: Erosion poses a serious threat to low-lying islands, and thus
GHG emissions may directly threaten PIC communities……………………………….....….....45
Photograph 4.5.1: A local family with their SHS, and a chief of Akhamb Island
with his solar lantern………………………………………………………………….....………56
Photograph 5.2.2.1: A SHS installed through the EU‘s REP-5 Project………………......……….62
Photographs 6.1.1.1: SHSs installed by IE (top) and managed by MEC (bottom)
on Namdrik Atoll………………………………………………………………………..……….76
Photograph 6.1.8.1: End-users on Namdrik helping with the IE system
installation………………………………………………………………………………….…….87
Photograph 6.1.14.1: The 1.62kW community system installed on Akhamb
Island…………………………………………………………………………………..…………97
Photograph 7.1.1.1: An indoor light being placed outdoors with an undersized
indoor wire powering it………………………………………………………………..………102
Photograph 7.1.4.1: An example of a solar power board………………………………..………104
Appendices:
Appendix 1: Twenty-one PICs and their Renewable Energy Targets............................................153
Appendix 2: PIC electrification characteristics and opportunities for solar power.……......…….154
Appendix 3: Ilskog‘s (2008) thirty-six indicators for evaluating RE projects‘
effects on sustainable development globally…………………………………………..……….156
Appendix 4: Chow‘s (2010) five factors for sustainable development, adapted
from McConville (2006)……………………………………………………………….………158
Appendix 5: Urmee & Harries‘ (2009) indicators for successful program
implementation…………………………………………………………………………..……..159

x
Appendix 6: Questionnaires for SHS users in the case study communities of
Namdrik Atoll and Akhamb Island.............................................................................................160
Appendix 7: Interview questions for key stakeholders in Vanuatu and the
Marshall Islands and the indicators each question addressed.....................................................167
Appendix 8: A summary of the history of SHS projects implemented in the RMI,
based on information in the literature and project documents………………………..………..169
Appendix 9: A summary of the history of SHS projects implemented in Vanuatu,
based on information in the literature and project documents……………………....................172
Appendix 10: A summary of RESCO projects in 3 PICs utilizing SHSs, based on
information in the literature and project documents……………………………………..…….175
Appendix 11: A summary of the private SHS market in PNG, based on information
in the literature and project documents…………………………………………………..…….180
Appendix 12: A summary of the co-operative model implemented in Tuvalu, based
on information in the literature and project documents…………………………………..……181
Appendix 13: Descriptions of four ongoing regional projects and efforts in PICs
which directly affect rural RE electrification…………………………………………..………182

xi
Acronyms used with the Text:
AusAid: Australian Aid Program
CC: Climate Change
CDM: Clean Development Mechanism
CO2: Carbon Dioxide
CO2e: Carbon Dioxide Equivalent
EE: Energy Efficient
EU: European Union
ESMAP: Energy Sector Management Assistance
Program
FSM: Federated States of Micronesia
GEF: Global Environment Fund
GHG: Greenhouse Gases
GSM: Global System for Mobile Communication
GW: Gigawatt
IAEA: International Atomic Energy Association
IDCOL: Infrastructure Development Company Limited
IEA: International Energy Agency
IE: Island Eco
IRENA: International Renewable Energy Agency
kW: Kilowatt
LCDS: Low-carbon Development Strategies
MAEC: Marshalls Alternative Energy Company
MDGs: Millennium Development Goals
MEC: Marshalls Energy Company
MW: Megawatt
NAMAs: Nationally Appropriate Mitigation Actions
NGO: Non-Government Organization
North REP: North Renewable Energy Project
O&M: Operations and Maintenance
ODA: Official Development Assistance
PICs: Pacific Island Countries
PIGGAREP: Pacific Islands Greenhouse Gas
Abatement through Renewable Energy Project
PREFACE: Pacific Renewable Energy France
Australia Common Endeavor
PNG: Papua New Guinea
PV: Photovoltaic
RE: Renewable Energy
REAP: Renewable Energy for rural Access Project
(Mongolia)
REEEP: Renewable Energy and Energy Efficiency
Partnership

xii
REP-5: Renewable Energy Project for Five ACP
Pacific Islands
RESCO: Renewable Energy Service Company
RETs: Renewable Energy Targets
RMI: Republic of the Marshall Islands
RMI ESP: Republic of the Marshall Islands Energy Services Program (Ministry of Research and
Development)
SEC: Solar Energy Company (Kiribati)
SEIAPI: Sustainable Energy Industry Association of the Pacific Islands
SOPAC: South Pacific Applied Geoscience Commission
SHS: Solar (PV) Home System
SPC: Secretariat of the Pacific Community
US: United States
USDA-RUS: United States Department of Agriculture - Rural Utilities Program
VERD: Vanuatu Electricity for Rural Development
VEU: Vanuatu Energy Unit (Ministry of Lands and Natural Resources)
WB: World Bank
W: Watts
WSSD: World Summit on Sustainable Development

1
1.1 Renewable Energy Project Challenges
Beginning in 1999, the Vanuatu Energy Unit (VEU) undertook a pilot project aided
by the Japanese government and installed hundreds of solar photovoltaic (PV) home
systems (SHSs) in communities on three islands (Efate, Malekula, and Umbae) (see a
diagram of a SHS, Figure 1.1.1). The system design was conservative, with the design aim
being to minimize operations and maintenance (O&M) costs (Chow, 2010). The VEU
collected rental fees of $15 USD per month from the beneficiaries, which was used to
maintain and repair the SHSs. Yet, after a few years, many end-users consistently failed to
complete their payments, and after 2005, most had stopped paying altogether, and thus the
VEU could no longer afford to maintain the systems (VEU, Respondent 1, 20111).
The beneficiaries were unsatisfied as the SHSs were not designed to meet all of
their electricity demands, and they provided only limited lighting, with each light‘s
recommended usage being only three hours per day (Chow, 2010). In addition, the users
felt the monthly fee was too high, and as a result the government gave options for lowering
the cost based on the number of lights in use. However, many end-users still failed to pay
regularly as they were concerned about the payments being continuous; they didn‘t
understand the reasons why VEU demanded never-ending payments when the project was
donor-funded. Thus, many end-users preferred to own rather than rent their SHS, and the
government accommodated by announcing that once they had paid $850 USD in total (the
original cost of the system was $1000), the system would be theirs; however, only a few
reached this point as many systems were already non-operational. Furthermore, those that
did purchase their system did not have the knowledge to repair or maintain it, as the end-
users were not trained through the project except in basic system operations (VEU,
Respondent 1, 2011).
1 Personal communication with respondents will hereafter be referenced by the person‘s general role, followed
by ‗Respondent‘ and a numeric identifier, and the year, and with the full citation listed within the references
section of the thesis.
Chapter 1:
Introduction to Renewable Energy in the Pacific Islands

2
Thus, many system breakdowns were due to users‘ failure to pay monthly fees, as
well as the fees under-representing the total cost required for O&M. As a result, the
government did not have enough funds for replacement parts, especially when the batteries
reached their life expectancy (around the five-year mark). In addition, prepayment meters
were installed on the systems on Efate Island, which allowed end-users to pay their
electricity bill in advance for the month much like a prepay mobile phone. However, those
meters needed to be removed after a few years at an additional cost, as the only VEU
technician who understood how to operate the meters relocated without training a
replacement (VEU, Respondent 1, 2011). After the majority of the SHSs failed,
rehabilitation became too expensive for the government, and many end-users bought home
generators as a replacement, despite the fact that they are more costly in the long-term.
Source: Leonics Co. Limited (2009).
A similar story can be told in the Republic of the Marshall Islands (RMI), where
SHSs were installed in remote communities by the Marshalls Energy Company (MEC), the
state-owned utility, starting in 2003. Again, end-users failed to complete their monthly fees
for their rented SHSs, and as a result the government reduced the fee from $12 to $5 per
month, well below the price of O&M. In addition, the government is now allowing end-
users to pay with local resources such as bags of copra (dried coconut meat) in order to try
to encourage the users to pay their fees on time (RMI Energy Services Program (ESP),
Respondent 2, 2011).
At first glance, these accounts may indicate that solar PV is too costly for
electrifying rural Pacific communities, even with subsidies. Yet, other reasons for PV
Figure 1.1.1: The components of a solar PV home system. Systems
generally range from 15 to 200 W in size.

3
project failure can be seen in both these accounts, including: a deficit of in-country trained
personnel, minimal involvement of end-users in project design, systems not satisfying
users‘ energy needs, lack of continual education and training for users, cultural
incompatibility regarding financing, poor communication between stakeholders, and the
electrification strategy not matching user preferences.
Unfortunately, these situations from the RMI and Vanuatu are not uncommon: in
fact, since the 1980s, many renewable energy (RE) electrification projects in Pacific Island
countries (PICs) have had minimal impact and a high rate of failure. A large percentage of
these previous projects were not designed sufficiently to produce enduring outcomes (i.e.,
donor-funded equipment-based demonstrations or lack of planned involvement after
installation) and are now non-operational (Akker, 2006). Despite many lessons learned and
technological improvements over the years, even well-funded and large-impact RE
electrification projects implemented today continue to face durability issues. For example,
the Fiji Renewable Energy Service Company (RESCO) program is one of the latest
attempts in PICs to promote solar-based rural electrification through a rental or fee-for-
service electrification model; yet, major flaws have already been identified, related to poor
stakeholder involvement in project design and lack of government support and ownership
(Dornan, 2011). In short, many of these failed initiatives have been quick technological
fixes that have not addressed the underlying issues required for longevity2.
Solar PV project collapse is an important issue for energy consumers, governments,
and project funders in PICs, as reducing the risk of project failure enhances the quality of
life for users and improves the cost-effectiveness of RE project investments by
governments and donors. Therefore, research on essential practices and appropriate
electrification strategies for SHS projects in the RMI and Vanuatu has the potential to
reduce complications for future electrification. Furthermore, as the RMI‘s and Vanuatu‘s
country profiles and rural energy needs are similar to those of other Pacific Island
Countries (PICs) (see Table 1.1.1), such research on the two nations becomes relevant for
the electrification of other PICs as well.
2 The numerous financial, technical, policy, market, institutional, and informational barriers to implementing
enduring RE projects in PICs, as well as the strategies taken to overcome them thus far, are reviewed in detail
in Chapter 3.

4
Table 1.1.1: Human Poverty Index and Human Development Index for PICs.

5
1.2 PIC Renewable Energy Targets
Despite these overall discouraging experiences described above, the RMI and
Vanuatu national governments recognize the potential of RE in alleviating fuel poverty and
electrifying their rural islands. Thus, the RMI government has set a renewable energy target
(RET) of 20% of electricity produced from renewable sources by 2020. However, many
barriers to achieving this goal have been identified in the RMI National Energy Policy,
such as inadequate training, inconsistencies in government programs, and inappropriate
scales for meeting energy demands (see Figure 1.2.1). In Vanuatu, the national government
is currently developing a National Energy Roadmap, to be completed in 2012 (see
Photograph 1.2.1), while the Vanuatu Power Utility (UNELCO) has set itself a goal of 33%
of its electricity from RE sources by 2013.
Issues and Objectives for Expanded Energy Use of Renewable Energy
Issues:
Lack of information on indigenous renewable energy resources, particularly wind and wave
energy
Inadequate training for those developing RE project proposals, trainers of those who manage
outer island systems and trainers of household users in the proper operation and maintenance
of solar installations
Different and incompatible management systems for various government programs
implementing rural renewable energy installations
High initial costs and, for some RE resources and locations, imprecise knowledge of likely
energy production (e.g. kWh output per year)
Although grid-connected renewable energy may be important in the future, there is very
limited experience with it in the Marshall Islands, with two small grid-connected systems
operating in mid 2009
Outer island household electrification schemes have a ―one size fits all‖ mentality but actual
needs can vary widely
Poor access to land suitable for indigenous energy development
Promoters visiting the RMI sometimes advocating and trying to sell unproven or untried RE
systems or those of doubtful quality. At best this causes confusion and wastes time; at worst it
result in investment of funds for energy projects that cannot provide promised results
Objectives:
Improved capacity within the RMI to plan, develop, implement and manage renewable
energy systems (small and medium-scale rural; large scale urban)
Provision of 20% of electrical energy through indigenous renewable resources by 2020
Outer island energy development to be through indigenous energy sources where technically
practical and economically attractive
Figure 1.2.1: Excerpt from the RMI National Energy Policy.
Source: RMI National Energy Policy (2009).

6
Photograph 1.2.1: Banner announcing the launch of the Vanuatu National Energy Roadmap.
Source: Photography by Juliana Ungaro (2011).
Other PIC governments also recognize the benefits of utilizing their country‘s RE
resources, as can be seen by many of the nations‘ RETs, which are described fully in
Appendix 1. Furthermore, RETs have been established at a regional scale through climate
change (CC) mitigation projects, such as the Pacific Islands Greenhouse Gas (GHG)
Abatement through Renewable Energy Project (PIGGAREP), which aims to use RE to
reduce GHG emissions 33% by 2015 in eleven southern PICs. Additionally, the North
Pacific ACP Regional Energy Project (North REP) has been established in five of the
northern PICs, with similar goals of electrification and mitigation through RE3.
The purpose of these national and regional RETs is three-fold: 1. to decrease
reliance on imported fossil fuels, 2. to provide reliable and affordable electricity to the
region, and 3. to mitigate the regional effects of CC. Thus, RE projects have the potential to
benefit both rural communities and governments alike, making RE project permanence of
interest to multiple sectors.
1.3 PIC Energy Security
Electrification of PICs is necessary for development, as 70% of the 10 million
people living in PICs do not have access to electricity (SPREP, 2010). A substantial portion
of this non-electrified population lives in rural, isolated islands, where grid establishment is
3 The PIGGAREP project is described in detail in Appendix 13 and the North REP project is explained in
Chapter 5.

7
uneconomical and development projects are significantly constrained (Connell & Waddell,
2007). In fact, 55% of PICs‘ population lives in non-urban areas, many of which face
irregular access to transportation, telecommunication, markets, and imported goods and
services (see regional map, Figure 1.3.1) (PRISM, 2010). The ratio of land to sea area for
PICs varies between 0.003-2.45%, which is indicative of the tremendous distances between
islands and the resulting isolation (Maharaj, 1999).
Source: CIA (2009). This map is part of public domain and may be copied without permission.
Figure 1.3.1: Map of the Oceania region, including the North and South Pacific Islands.

8
Fossil fuel and electricity prices in both urban and rural areas in PICs are
significantly higher than those of nearby developed countries (see Table 1.3.1), and
development levels are significantly lower, with an average per capita income of $2,443
regionally (see Table 1.1.1) (UNDP, 1999). Growing populations, coupled with changes in
development levels and lifestyle requirements, have exponentially increased demand-side
power consumption across the region, despite rapidly increasing fuel costs (UNICEF,
2009). The result has caused many to face fuel poverty, unreliable electricity, unpaid
power bills, and disconnection of grid-tied electric supply. The rural regions are especially
susceptible to fuel poverty, as fossil fuels‘ prices in such areas can be nearly double that of
the already expensive urban prices (see Table 1.3.1). However, regional published data on
average household energy expenditures is not available, and thus one can only estimate the
percentage that fuel poverty affects.
Country Petrol
(USD/litre)
Diesel
(USD/litre)
Kerosene
(USD/litre)
Residential
electricity
(USD/kWh)
RMI $1.32 urban
$1.98 rural
$1.27 urban
$1.72 rural
$1.32 urban
$1.72 rural
$0.30-0.33
urban
Vanuatu $1.93 urban
$2.72-3.26
rural
$1.89 urban
$2.72-4.07
rural
$3.24 $0.44-0.70
urban
US $0.89-1.01 $1.00-1.03 Not sold
regularly in
small
quantities
$0.11-0.12
Australia $1.35-1.47 $1.38-1.50 $0.12-0.25
These electricity concerns, combined with rising food, fuel, and transportation
costs, have the potential to contribute to an economic decline across PICs if not confronted
in the near future (UNICEF, 2009). Virtual monopolies of fuel supply leave PICs
additionally vulnerable to market changes. This is especially true as PICs‘ transport and
electricity sectors rely on nearly 100% fossil fuels, and their imports as a percentage of
GDP are increasing rapidly (see Table 1.3.2) (GEF Council, 2005; Jafar, 2000).
Table 1.3.1: The Marshall Islands‘ and Vanuatu‘s retail fuel and electricity prices and those of
nearby developed countries: the United States and Australia as of mid-2011.
Source: KUTh Energy Limited (2009); Origin Energy (2011); Personal Observation (May to
September, 2011); USEIA (2011); Vanuatu‘s Energy Roadmap Launch (2011).

9
Additionally, shortages in global fossil fuel supply are expected to further increase global
oil prices, as it is estimated that a 40-60 year supply of proven oil and gas reserves remain
(BP, 2009). Accordingly, energy security and autonomy are significant driving factors for
reducing fossil fuel consumption and increasing the uptake of RE power generation in
PICs.
1.4 Renewable Energy Demand: Health, Poverty Eradication, and Climate Change
Per capita energy consumption is closely linked to per capita GDP of PIC
economies, resulting in differing energy needs according to varying levels of development.
Currently, many rural communities are reliant upon kerosene lanterns for lighting, and in
some areas diesel generators for electricity, both of which are associated with negative
health effects due to air pollution (Holdren et al., 2000). Furthermore, kerosene lanterns
offer low efficiency and poor quality light, as they give off up to 100 times less light than
electric lights (REN21, 2011).
Demand for RE in PICs is also driven by the underlying goal to meet the basic
needs of the poor, and, therefore, rural electrification strategies must be considered in terms
of the positive effects on marginalized groups. In the World Summit on Sustainable
Development (WSSD), where the Millennium Development Goals (MDGs) were decided
upon, energy services were identified as essential in poverty eradication, with RE being the
most sustainable method of electrification. Electrification has been shown to reduce
Source: Roper (2009)
Table 1.3.2: Fuel imports as a percent of GDP, in 2002 and 2008.
0%
5%
10%
15%
20%
25%
30%
Kiri
bati
Palau
Tonga
FSM
Solom
on Isla
nds
Tuvalu
Samoa
Fiji
Cook
Isla
nds
Vanua
tu
2002
2008

10
poverty through improved economic activity, literacy, education, healthcare, gender
equality, and social benefits; however, these changes are often unpredictable and depend
upon favourable conditions (Cabraal et al., 2005; Chakrabarti, 2002; Martinot et al., 2002).
Furthermore, the regional demand for RE for electrification is derived from PICs‘
extreme vulnerability to the effects of CC, with increasing threats from sea-level rise and
severe weather events, such as earthquakes, cyclones, floods, and droughts. The 2007 IPCC
report predicts global sea levels to rise between 0.28 and 0.43 meters by 2100, which
would result in substantial yet unpredictable changes in PICs coastal areas due to the
redistribution of sediment (IPCC, 2007; Webb & Kench, 2010). These effects are likely to
include saltwater inundation and flooding, deterioration of agriculture and mariculture
viability, decline in coral reef health, damage to existing infrastructure, and depletion of
small islands‘ freshwater lens (Mimura, 1999). Such changes threaten communities‘
livelihoods, and, therefore, sea-level rise poses a threat to PICs‘ economies and societies,
and is likely to result in increased poverty (IPCC, 2007).
In contrast to their vulnerability, PICs do not have a significant carbon footprint,
given their small population (0.1% of the global total) and minimal infrastructure. In fact,
in 2007, energy usage in all of the PICs combined resulted in only 0.04% of global carbon
dioxide (CO2) emitted and only 0.08% of global petroleum consumed (USEIA, 2007).
Therefore, reducing PICs‘ reliance on fossil fuels will not directly prevent the effects of
CC; however, the nations may be able to set an example for more industrialized countries
to decrease their carbon emissions.
The 2009 Cancun Agreements under the UNFCCC included a number of key
elements in relation to mitigation action by developing countries. These included
encouragement to develop low-carbon development strategies (LCDS), and an agreement
that developing countries will take nationally appropriate mitigation actions (NAMAs)
aimed at achieving a reduction in GHG emissions relative to ‗business as usual‘ emissions
by 2020. LCDS and NAMAs present an opportunity for developing countries (‗Non-Annex
1 Countries‘ in the UNFCCC lexicon) to attract climate change mitigation finance, rather
than relying on more traditional official development assistance (ODA) financing for
strategic development in the energy sector.
In the context of LCDS or NAMA development, enduring solar PV projects have
the potential to reduce carbon emissions by displacing fossil energy generation, in

11
particular fossil fuel-powered generators, electricity grids, and kerosene lanterns. This is
because the lifecycle CO2e emissions released by solar PV to produce 1kW of electricity
are approximately 90% less than that released by fossil fuels to produce the same amount
of electricity (Fthenakis et al., 2008; Sovacool, 2008). Similarly, the UK Parliamentary
Office for Science and Technology (2006) calculated the ‗carbon footprint‘ of solar PV to
be approximately 35g CO2 per kWh of electricity at 30 degrees latitude, compared to 15-20
times as much for fossil fuels.
Yet, life cycle emission savings of SHSs for rural electrification can be hard to
predict, as household energy demands often increase with the installation of a SHS; still, a
net decrease in CO2 emissions is likely to occur given the significant disparity.
Additionally, SHSs often replace the desire for rural households to use fossil fuel sources
for their future energy needs (Wade, 2005a).
1.5 Renewable Energy Supply: Technical Opportunities and Challenges
Rapid growth of energy demand, regionally competitive RE prices in comparison
with fossil fuels, the need for energy security, and the regional susceptibility to climate
change makes RE technologies an ideal option for PICs. RE technologies have the potential
to provide rural electrification while at the same time acting as a cleaner, more reliable, and
cost-effective energy service (SPREP, 2010).
In the past two decades, solar PV systems have become the most widely adopted
RE technology for rural electrification in PICs, due to the widespread availability of solar
insolation and the flexibility in scale of the systems. In fact, the literature indicates that
SHSs represent the most cost-effective technological option for remote communities in
PICs and globally, where demand for electricity is low, the population is small, and fuel
costs are high (Chaurey & Kandpal, 2009; Nguyen, 2007; Woodruff, 2007). Furthermore,
the price of solar modules has declined significantly over the past decade (see Figure
1.5.1), with prices having dropped by 20% for each doubling in cumulative production (Jol
et al., 2008). Costs are forecasted to further decline over the next decade, creating a wider
market for solar PV systems in PICs.

12
Additionally, solar systems
have become a more appropriate
technology for rural electrification,
with a large portion of the industry
now designing systems with rural
end-users in mind. For example,
‗pre-wired,‘ ‗plug-and-play,‘ or
‗turn-key‘ systems are offered by
numerous companies for small-
scale lighting and mobile charging
devices to battery charging stations
to stand-alone micro-grids (see
Figure 1.5.2). Many companies
are also now offering equipment specifically designed for harsh tropical and oceanic
conditions, such as sealed inverters, anti-rust mounting frames, marine grade lights and
wires, and maintenance-free batteries, resulting in more reliable solar equipment for PICs.
With appropriate equipment, installation, and maintenance, solar PV systems can be
expected to last 25-30 years, with the batteries requiring replacement approximately every
7-10 years (Lewis, 2007).
Source: Barefoot Power Limited (2011).
Figure 1.5.1: Solar module price trends over the past
decade.
Source: Solarbuzz (2011).
Figure 1.5.2: Examples of pre-wired systems designed for remote settings, from small to
large scale.
Source: D.lite design (2011).

13
Source: Alphatron (2011).
Therefore, given solar PV‘s flexibility in scale and carbon offsetting qualities, as
well as recent improvements in affordability, reliability, and user-friendliness, its usage has
the potential to effectively contribute toward 100% electrification of PICs. However, many
PICs have a long way to go before reaching this goal. PICs‘ current economic and energy
situations and the potential role of solar PV are summarized in Appendix 2.
1.6 Renewable Energy Project Implementation: Socio-cultural Challenges
Any electrification project to be implemented in PICs needs to be mindful of the
socio-cultural context into which the technological solutions will be integrated. This
context differs not only within each nation but also within each island and community, and
thus it is necessary that project designers and implementers are familiar with the social and
cultural dimensions of the beneficiaries. Despite these complexities, there are some general
factors in the rural communities of both the RMI and Vanuatu that have implications for
SHS project design (see Figure 1.6.1). Some factors may not hold true for all communities
in Vanuatu and the RMI, yet it is obvious that there are a range of socio-cultural challenges
that need to be met if technical solutions are to endure.
Figure 1.6.1: Suggested socio-cultural factors and solar PV project implications in rural
Vanuatu and RMI communities.

14
Socio-cultural Factors Solar PV Project Implications
•A solar system often provides power to more people than just those who live in the household.
Extended families often live near each other and share
resources.
•Solar systems that provide power for more than just lighting are often desired.
•Basic wiring is not new to many people.
•End-users would benefit from training specifically focused on SHSs.
Local people are familiar with modern technologies and have experience with
various electrical appliances, yet not necessarily a SHS.
•Training may not be sufficiently understood unless it is conducted in the local language and with the average educational level in mind.
•People may be more responsive to hands-on training.
Education levels and knowledge of the English language are limited for
many people.
• It is important that women and men are trained separately, preferably by a trainer of the appropriate gender.
•Electrical wiring is generally seen as a male task and thus some people may not be interested in women being trained in PV installation.
Women and men often have distinctly separate roles in
society and do not regularly intermix in public.
•Women use the SHSs‘ lights and appliances more often than men.
In general women spend more time in the home, and are often the ones to look
after children.
•Discounts may be expected for equipment.
•Beneficiaries do not have a high level of respect for donated items.
A large amount of aid has been given to both countries,
with many products being given for free or for
discounted rates.
•End-users may have trouble making regular, timely payments.
Income is not generated on a regular schedule for farmers,
fisherman, and handicraft makers, as work is seasonal
and depends on access to markets.
•Although incomes are low in rural areas, the cost of living is also relatively low and can vary seasonally.
Many of the rural communities have access to
local food and building materials, and thus a mixture
of local and imported products are often used.
•The life-cycle cost of items may not be taken into account, and thus the cheaper upfront cost may be preferred.
•Extensive financial planning for the future is not a common practice, and thus people find it a challenge to save for large purchases.
Many people have limited knowledge of bookkeeping
and finances.

15
Many of these factors apply to other PICs as well, and need to be considered in
addition to geographical, institutional, technical, and financial limitations for enduring SHS
project design. However, socio-cultural factors are often overlooked in the regional
literature, or are only briefly mentioned. One exception is an article by Sovacool et al.
(2011), which effectively describes the socio-cultural challenges faced in Papua New
Guinea (PNG), which are similar to those described above. They identified social barriers
for SHS projects to be: unrealistic expectations about SHSs‘ capacity, jealousy, theft and
vandalism, and unfamiliarity with the technology. Their interview results indicated that a
SHS may not work one year later because ―it is seen as belonging to everyone and
therefore no-one‖ and there is a ―complete lack of maintenance culture.‖
Sovacool et al. (2011) further described locals as ―perpetually living in the present,‖
with money not being part of their culture, as they are ―just learning how to use it now.‖ A
survey in the RMI by Empower (2005) supports this, stating villagers were unaware of how
much they spend on daily necessities, could not remember the ages of their parents or
children, or how many years they had attended school. They suggest this is partly due to
the unimportance of enumerating things in a semi-subsistence society. The authors
conclude that poverty in PICs has a nature of its own, as it is not characterized by hunger
and disease, but rather by isolation, low-education levels, communal living, lack of access
•Paid local technicians, those who manage project money, and those with large SHSs may be disrespected or may face theft or vandalism.
Higher income earners and those with superior products,
opportunities, or power may be regarded with jealousy.
•This can be advantageous for widespread dissemination of solar PV, in that once it is accepted and a minimum knowledge level is reached, locals are likely to desire a system themselves.
A mimicking culture exists in that once a new technology or product is used successfully by a few people in a community,
often many others will purchase one too.
•Trained local technicians may not be willing to share their knowledge with others, but rather prefer to create a business fixing others‘ solar systems.
Having unique knowledge is viewed as a secret and a way to
generate income.

16
to modern services, and lack of access to markets (Empower, 2005; Sovacool et al., 2011).
Therefore, attempts to promote SHSs in PICs have suffered as a result of not appreciating
the importance of such socio-cultural factors.
1.7 Implications for this Thesis
This thesis will examine the factors that are necessary to incorporate into SHS
projects, in order to create project permanence in the rural communities of the RMI,
Vanuatu, and other PICs, thus working toward creating more successful rural electrification
programs in the region. The focus will be on the technical, financial, logistical, socio-
cultural, and environmental criteria for increasing the probability of project success, in
terms of results for end-users. The results will have implications for the most compatible
implementation strategies for PICs and other essential success criteria for project
permanence.

17
2.1 Research Focus: Rural PV Electrification Strategies
2.1.1 Variations in Electrification Models:
Historically, rural electrification was considered the responsibility of the
government in developing countries; however, this has been changing over the past few
decades with the involvement of private companies, NGOs, and financing institutions
(Vleuten et al., 2007). Consequently, multiple rural PV electrification strategies have been
established in order to attempt to reduce the failure rate of energy projects, with two broad
supply-side strategies commonly used with SHS projects in PICs (See Figure 2.1.1.1).
• A method wherein one utility, government department, or private company is selected to provide electricity to all customers in a specific geographic region, with monthly fees and operations regulated by the organization.
• Fees are often subsidized by the government or donors to make them affordable to the poor.
• Decision-making and ownership may be centralized within the government or utility responsible for the SHS, or may be decentralized with a company or other organization having responsibility.
• The common element of this model is that systems are not owned by end-users.
The Renewable
Energy Service
Company (RESCO)
model
• A method wherein SHSs are user-owned and operated, and are supplied through a range of organizations, including donors, local and international companies, governments, and non-government organizations (NGOs).
• Training may be provided at the time of installation, after which the end-user is responsible for O&M, with the possibility of warrantees and after-purchase support.
•With project-initiated user-owned systems, often a limited number or type of PV system options are available, whereas with self-initiated user-owned systems (also cash sales), end-users are consulted in system design, or may design their own system.
•SHSs may be subsidized by donors, governments, and banking institutions; otherwise, users must pay the up-front costs of their system and any needed replacement parts.
User-owned RE systems: project-initiated and self-initiated
Chapter 2:
Research Purpose and Aim
Figure 2.1.1.1: The common features of the RESCO and user-owned electrification models.

18
Given the variety of project initiators in both electrification strategies, a relevant
query is whether rural electrification implemented by private companies and NGOs or by
government utilities and donors (following the conventional approach) is more effective in
the long-term (Ilskog, 2008). Another similar question is whether SHSs self-organized by
end-users within the commercial market are more or less effective than those externally
organized within a project framework. The differences between these two models are
described in Figure 2.1.1.2.
Both electrification models have benefits and limitations, with variations existing in
order to adapt to local conditions and overcome negative consequences. Existing variations
on the two overarching dissemination strategies can be seen in Table 2.1.1.1, although for
reasons of comparative analysis, the two models will be the focus of this research.
Figure 2.1.1.2: A flow-chart demonstrating the differences between system procurement by
private companies and project development through the government.
Source: Vleuten et al. (2007).

19
2.1.2 Differences in the Electrification Strategies:
The general aim of the RESCO strategy is to remove the high initial costs
associated with solar PV systems and to make spare parts and technicians readily available
(Beck & Martinot, 2004). Thus, this policy is useful in that costs are dispersed over time,
yet such programs have not always been beneficial in PICs, as a tendency of failure to
make payments and to misuse SHSs have often hindered success (see Chapter 5)
Models Ownership Initiator System
Design
Financing/
Subsidy
Installer Maintenance
and Repair
User-
owned:
Cash sales
End-user End-user End-user
with the
aid of
solar
company
None, or by
the end-user;
often must pay
tax
End-user
or solar
company
End-user or
solar
company
User-
owned:
Donation
End-user Donor Donor
and
supplier/
solar
company
Donor, maybe
a small amount
by end-user,
no tax
Supplier/
solar
company
End-user
User-
owned:
Credit
End-user Varies Varies Donor,
financing
institution,
supplier, or
solar company
Varies Varies
RESCO:
Fee-for-
service
Renewable
Energy
Service
Company
(private)
RESCO RESCO Fee-for-
service, often
aided by
donors and
financing
institutions
RESCO RESCO,
sometimes
train local
technicians
RESCO:
Concession
Government
utility
RESCO
RESCO RESCO Fee-for-
service, often
aided by
donors
channelled
through the
government
RESCO RESCO,
sometimes
train local
technicians
Table 2.1.1.1: A summary of the variations on the two implementation strategies, as cited in
the literature.
Sources: Martinot et al. (2002); Nieuwenhout et al. (2001); Vleuten et al. (2007); Wade (2005a).

20
(UNESCAP, 2001). In part, this is due to inadequacies on the supply-side, where
availability of support, spare parts, and timely maintenance has been an issue, due to
inadequate infrastructure, poor planning, and lack of resources (Dornan, 2011).
The use of this model avoids the need for extensive user education, as users are not
responsible for maintaining or repairing the system. In fact, this strategy often aims to
make the SHS inaccessible to end-users in order to prevent mistreatment, with only the
utility‘s technician having access to the PV equipment; yet alterations and abuse still
frequently occur. Consequently, RESCOs hinder user participation and ownership of the
SHS, in that end-users are not able to design or expand their systems with changing energy
demands, nor are they able to maintain and repair the systems as required (Mala et al.,
2008).
In contrast, the user-owned strategies include varying degrees of owner
participation; yet generally users are consulted in the design process and some form of
training takes place. Thus, through this model, end-users are given ownership over their
SHS, and they are often able to expand, repair, and maintain their system as required. In
fact, private ownership has been shown to ―reduce maintenance costs, overcome tampering,
reduce overuse of the system, and maximize the benefits‖ (Urmee & Harries, 2009).
However, many user-owned systems implemented in the 1980s and 1990s in PICs
had a high failure rate due to:
Lack of a long-term O&M plan
Maintenance costs being left unaddressed
Lack of access to spare parts
Training being inadequate or overlooked
Project implementers being overly optimistic about the skills and reliability
needed for system longevity
Project objectives not being clearly defined in terms of social benefits and
productive users
(Akker, 2006; Jafar, 2000; Urmee et al., 2009)
Many of these inadequacies were attributed to the electrification strategy, and resulted in
the assumption that users were not able to successfully own and maintain a SHS (Jafar,
2000; Liebenthal et al., 1994).

21
Yet, factors involved in implementing successful user-owned SHSs have changed
over time, including:
Local technological knowledge and familiarity with solar PV has significantly
increased
Solar training resources have been improved (including in local languages)
Solar PV technicians and organizations now have extensive regional
experience
Government and donor support for RE has increased due to external factors
PV equipment has improved in quality, affordability, and user-friendliness
Spare parts are more consistently available due to larger markets4
(RMI Entrepreneur, Respondent 3, 2011; SPC, Respondent 4, 2011).
Nevertheless, user-owned SHSs have been predominantly overlooked in recent PIC
electrification projects, despite continual recommendations in the literature for increased
participation, training, and projects centred on community energy needs (Beck & Martinot,
2004; Urmee & Harris, 2009; Yu et al., 1996). Rather, the primary electrification strategy
in PICs continues to be RESCO projects, and is the recommended mode of delivery by
many national and regional PIC organizations (RMI-ESP, Respondent 2, 2011; SPC,
Respondent 4, 2011).
2.2 Electrification within the Development Context
The RESCO model and the self-initiated user-owned model represent two ends of
the participatory development spectrum, with the former being a ‗top-down‘ approach, by
curtailing users‘ involvement in their system design and maintenance, and the latter being a
‗bottom-up‘ approach, with users‘ needs being central. The project-initiated user-owned
model falls within these two extremes, with all three representing a range of participatory
practices, as demonstrated by Arnstein‘s ladder of citizen participation, wherein each rung
corresponds to the extent of citizen participation (see Figure 2.2.1).
The consensus in the literature on development practices suggests that ideally the
level of participation and ownership in development projects should be in the upper levels
of the ladder with ‗partnership‘, ‗delegated power‘ or ‗citizen control.‘ Yet, pragmatically,
4 The last two bullet points are described in detail in Chapter 1.

22
full participation and project ownership by RE users often becomes cumbersome to project
implementers, as such practices are both costly and timely. Thus, it becomes useful to
understand the threshold of diminishing returns, beyond which participatory and ownership
practices are no longer effective in increasing project permanence.
2.3 Relevance of this Thesis
The essential practices and strategies for successfully electrifying rural PIC
communities with SHSs provide the foundation for this research, which tests the hypothesis
that increasing the usage of participatory and ownership practices through a user-owned
electrification model currently has the potential to increase project permanence as a result
of properly addressing users‘ needs. Additionally, this research will help to address the gap
in the literature on PICs regarding rural electrification through user-owned SHSs, as little
information is available on the success of this model in the region. By providing
Figure 2.2.1: A Ladder of Citizen Participation.
Source: Arnstein (1969).

23
recommendations for essential practices and electrification strategies, future project failure
may be reduced through the use of more appropriate project design and consideration of
users‘ needs. In order to make such conclusions transparent, a framework for mitigating
risks and increasing the longevity of PIC electrification projects was developed.
Reducing SHS failure is imperative for rural users, especially for women, who are
the primary users of electrical appliances, as much of their responsibilities are within the
home. Furthermore, environmental benefits increase with project permanence, as future
CO2 emissions are avoided and PV batteries and other equipment are not discarded
unnecessarily. Enduring project outcomes are also advantageous for project development,
implementation, and funding entities, as they are able to gain reputational benefits from
successful projects, and maximize return on investments.
In fact, performance-based funding is becoming increasingly common in donor and
government-funded projects, with funds being released over time, based on the
demonstration of having met key performance indicators, in order to reduce non-
permanence risk. Consequently, non-permanence risk has become a key consideration in
project design by governments, utilities, public and private sector funding agencies, carbon
project designers operating under the Clean Development Mechanism (CDM) of the Kyoto
Protocol, and for voluntary carbon markets. Therefore, an evaluation of the key practices
and strategies for rural electrification of PICs is desirable by multiple stakeholders.
2.4 Aim of this Thesis
The aim of this research is to answer the following question: ―What are the most
important technical, economic, institutional, socio-cultural, and environmental criteria for
increasing the probability of success and longevity of household-scale solar PV initiatives
in remote Pacific Island settings?‖ The intention is to suggest appropriate electrification
strategies and essential practices for project permanence in PICs, through a project risk-
mitigation framework that aims to reduce project failure.

24
2.5 Research Objectives and Questions
Objective 1: To define a comprehensive set of indicators for evaluating rural SHS projects‘
ability to meet users‘ needs and produce enduring outcomes, through reviewing the global
literature on evaluation indicators, barriers, and success factors for rural RE electrification
projects in developing nations.
Research Questions:
1. What does the literature suggest as indicators for evaluating rural RE
electrification projects in developing countries? What is the resulting compilation
of these indicators that are relevant for this research (in that they apply to PICs and
focus on results for end-users)? (Section 3.2)
2. What are the major barriers cited in the literature for rural electrification through
solar PV? (3.3)
3. How do the barriers that directly impact end-users apply to each evaluation
indicator, and what are the recommendations in the literature to overcome them?
(3.4)
4. What are the overall success factors for project longevity, as recommended in the
literature? (3.5)
Objective 2: To determine the success rate of user-owned and RESCO SHS projects,
through examining the strengths and weaknesses of electrification strategies implemented
in PICs and globally, with the findings assembled into a set of lessons learned for each
indicator, as a way to guide solar PV project rollout in PICs.
Research Questions:
1. What variations on the two overarching electrification strategies have been
attempted internationally, and which has proven to be the most successful for
remote communities in developing countries? (5.1)

25
2. What variations on the three overarching electrification strategies have been
attempted in PICs, and what are the positive and negative effects of each model?
(5.2)
3. What electrification strategies have been attempted in the RMI and Vanuatu, and
what is the current context into which the case studies examined fit? (5.3 and 5.4)
4. Which indicators could be considered keystones to producing enduring benefits for
users in PICs, and which indicators are often overlooked by projects? (5.5)
5. What are the strengths and weaknesses of each electrification model in addressing
each indicator in project implementation? (5.5)
6. What are the lessons learned that can be derived from an analysis of PIC project
documents? (5.6)
Objective 3: To evaluate the success rate of two existing household solar PV case studies in
the RMI and Vanuatu, through utilizing the indicators developed in Objective 1.
Research Questions:
1. What are the strengths and weaknesses of each case study as analysed in terms of
the incorporation of the evaluation indicators? (6.1)
2. How do the case studies compare with each other? (6.1)
3. What implications do the case studies have for appropriate electrification strategies
in these locations and in other PICs? (6.2)
4. Which indicators have been crucial in producing enduring benefits for end-users
and which, when omitted, have hindered project success? (6.2)
Objective 4: To determine the viewpoints of solar PV project stakeholders and experts in
the RMI and Vanuatu on the essential factors for project permanence, focusing specifically
on their opinions of appropriate electrification strategies and key criteria that result in
enduring benefits for users.
26
Research Questions:
1. What key features have the stakeholders identified that result in enduring benefits
for users by indicator, and what are the best ways to implement these features in
their opinion? (7.1)
2. What are the beliefs of the stakeholders regarding the most effective
electrification strategies and the most essential criteria for project permanence?
(7.2)
3. What are the lessons learned that can be applied to future PV project development
and electrification in the RMI, Vanuatu, and other PICs in order to reduce project
failure? (7.3)
2.6 Structure of the Thesis
Chapter 1: The introduction, which presented an overview of the Pacific Islands‘ energy
context and the benefits of electrification through SHSs.
Chapter 2: The rationale, the purpose, the objectives, and the corresponding research
questions.
Chapter 3: The literature review, in which a set of evaluation indicators for rural RE
projects is developed and discussed.
Chapter 4: The methodology, which presents the research approach, the data collection
methods and locations, and data analysis strategies.
Chapter 5: The document analysis, which analyses SHS project reports published on the
various electrification methods, through the evaluation indicators developed.
Chapter 6: The research results and analysis of the quantitative data collected from two
solar PV case studies in the RMI and Vanuatu.
Chapter 7: The research results and analysis of the qualitative data collected from experts
and stakeholders involved in solar PV projects in the RMI and Vanuatu.
Chapter 8: The discussion, which discusses key findings and presents a project risk
mitigation framework for solar PV project design.
Chapter 9: The conclusions on essential practices and appropriate electrification strategies
for SHS project endurance in the RMI, Vanuatu, and other PICs.

27
3.1 Overview
Although both the direct and indirect benefits of SHSs have been well-documented
in the short-term, the long-term benefits, in terms of sustainable development for users,
remain unforeseen in PICs and to a large extent globally (Mala et al., 2008; Nieuwenhout et
al., 2001). In fact, most rural SHSs in PICs have not been evaluated in terms of the
appropriateness of the technology or its long-term effects on beneficiaries, nor have there
been extensive comparisons between the various electrification strategies and their
contribution to project permanence (Ilskog, 2008; Mala et al., 2008). Rather, the literature
has generally focused on identifying the numerous barriers, technical options, and donor
experiences for RE technology rollout in PICs, with a focus on recommendations at the
national and regional levels. This chapter will first identify indicators that can serve to
evaluate long-term project success, then cite the multiple barriers and experiences that have
been identified in the global literature based on the indicators, and finally compile a list of
success factors for rural electrification project permanence.
3.2 Indicators for RE Project Evaluation
Systematic evaluations of RE project implications in both the short and long-term
would be helpful to further understand the effects on beneficiaries (Nieuwenhout et al.,
2001). Evaluation indicators have the potential to create an understanding of the strategies
and methods that make solar PV projects sustainable in the long-term. This can result in
reduced program costs and project longevity, through more appropriate technology use,
financing schemes, maintenance strategies, and compatibility with the socio-cultural
context (Ilskog, 2008). In addition, indicators can lead to an improved understanding of the
changing needs of rural electrification over time.
The use of indicators for evaluating rural electrification has been rare, with a few
exceptions in the literature. Lists of indicators have been developed by different
organizations, such as the World Bank (WB), the International Energy Agency (IEA), the
Chapter 3:
A Review of the Literature on Indicators, Challenges, and Successes

28
International Atomic Energy Association (IAEA), and the Energy Sector Management
Assistance Program (ESMAP); however, these indicators are often general in design, do
not always apply to PICs, and often are aimed at the national and regional levels rather than
addressing the local context (Ilskog, 2008).
Indicators have been developed in the literature on rural electrification by the
following:
Ilskog (2008), who created thirty-six indicators for sustainability evaluations of
projects worldwide (see Appendix 3).
Mala et al. (2008), who developed five indicators (suitability, effectiveness,
livelihood resilience, livelihood diversification, and environmental protection)
to evaluate the contribution of projects towards sustainable livelihoods.
Chow (2010), who applied social, economic, and environmental sustainability
indicators to various stages of project life-cycles (see Appendix 4).
The World Bank (2003), who developed indicators for project evaluations by
donors.
Yu et al. (1997), who developed a framework for RE policy-making.
Urmee & Harries (2009), who formulated indicators for evaluating project
implementing agencies based on research in the Asia-Pacific region (see
Appendix 5).
Indicators were then applied to evaluate projects by Chow (2010); by Ilskog &
Kjellstrom (2008); by Urmee & Harries (2009); by the World Bank (2003); and by Yu et
al. (1997). Factors for evaluating projects‘ results for end-users were also used by Mala et
al. (2009) and Urmee et al. (2009), with a focus on the Pacific region, yet these factors
were not designed to be comprehensive.
Many of the indicators cited are focused on the implementing institution and the
compatibility at the national level (Ilskog, 2008; Urmee & Harries, 2009; World Bank,
2003; and Yu et al., 1997). Furthermore, the compatibility of projects with the socio-
cultural aspects of beneficiaries is generally overlooked, with Chow (2010) and Yu et al.
(1997) being the major exceptions. Thus, there is a noticeable gap in the literature
regarding comprehensive indicators for evaluating the effects of electrification on

29
beneficiaries in PICs. Still, previously developed indicators provide a strong basis for
formulating such evaluation indicators.
Table 3.2.1 attempts to compile those indicators previously cited in the literature,
with the incorporation of cultural factors and a focus on results for end-users in PICs, in
order to formulate indicators appropriate for evaluating the case studies examined in this
research (addressing Research Objective 1). End-users are focused on, as it is essential to
analyze the importance of energy services to end-users, given that this is the key focus of
all rural electrification projects (Vleuten et al., 2007). Each indicator is designed to address
the factors which may potentially lead to project disruptions and collapses (Ilskog, 2008).
They include an evaluation of the technical, economic, and institutional sustainability of
the project, the accessibility of the project by most social groups, the cultural compatibility,
and the impact on other sectors, such as education or the environment.
Categories Description Evaluation Indicators
Technical Focus on maintaining energy
services during the system‘s
lifespan through appropriate
equipment use, effectiveness, and
expansion.
1. Appropriate equipment use
2. Effectiveness in meeting
users’ needs
3. Ability to satisfy expanding
energy demands
Economic Focus on the appropriateness of the
system‘s cost, including subsidies,
operational costs, and parts
replacement.
4. Cost-effectiveness
5. Effectiveness in changing
community livelihoods
Institutional Focus on quality and the ability of
the organization/ project to offer
training and support to end-users for
the lifespan of their systems.
6. Availability of resources and
support
7. Availability of system
components
8. Capacity building
Social Focus on equitable distribution of
the benefits offered by
electrification, and the societal
familiarity with technology.
9. Gender inclusiveness
10. Affordability
11. Familiarity with the
technology
Cultural Focus on the compatibility of the
project within the cultural context,
12. Participation and ownership
13. Willingness to pay
Table 3.2.1: Evaluation indicators for case-study evaluation, compiled from the cited literature.
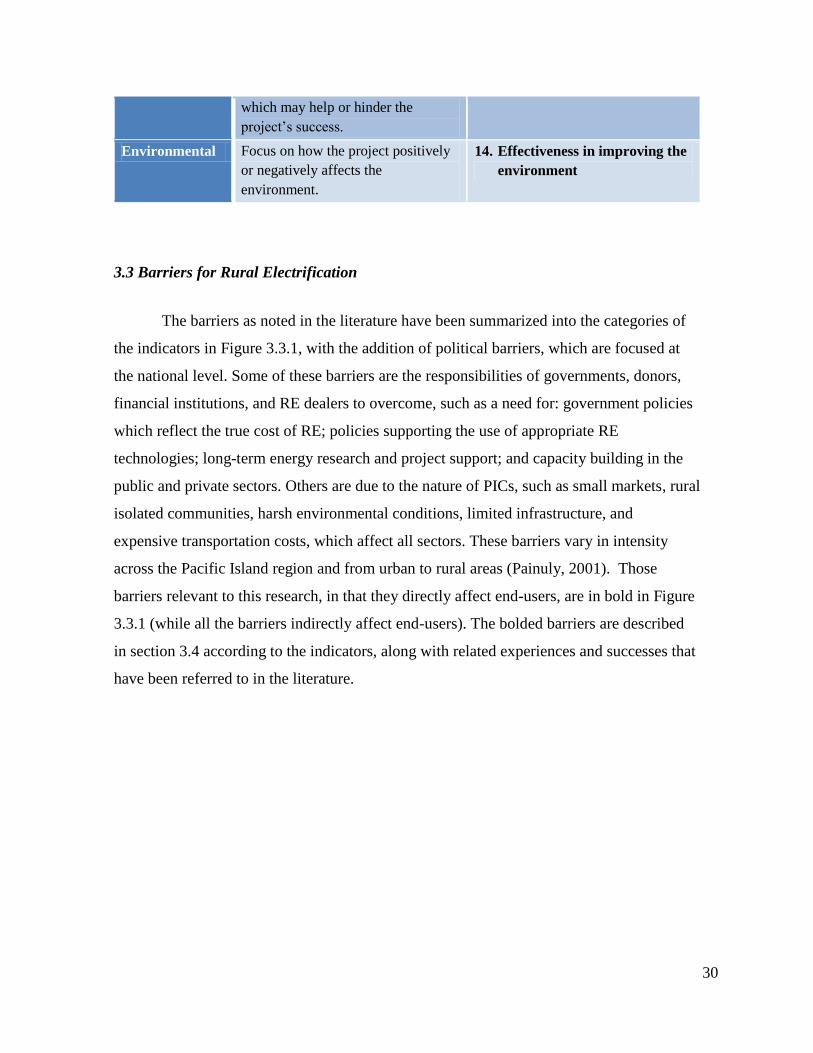
30
which may help or hinder the
project‘s success.
Environmental Focus on how the project positively
or negatively affects the
environment.
14. Effectiveness in improving the
environment
3.3 Barriers for Rural Electrification
The barriers as noted in the literature have been summarized into the categories of
the indicators in Figure 3.3.1, with the addition of political barriers, which are focused at
the national level. Some of these barriers are the responsibilities of governments, donors,
financial institutions, and RE dealers to overcome, such as a need for: government policies
which reflect the true cost of RE; policies supporting the use of appropriate RE
technologies; long-term energy research and project support; and capacity building in the
public and private sectors. Others are due to the nature of PICs, such as small markets, rural
isolated communities, harsh environmental conditions, limited infrastructure, and
expensive transportation costs, which affect all sectors. These barriers vary in intensity
across the Pacific Island region and from urban to rural areas (Painuly, 2001). Those
barriers relevant to this research, in that they directly affect end-users, are in bold in Figure
3.3.1 (while all the barriers indirectly affect end-users). The bolded barriers are described
in section 3.4 according to the indicators, along with related experiences and successes that
have been referred to in the literature.
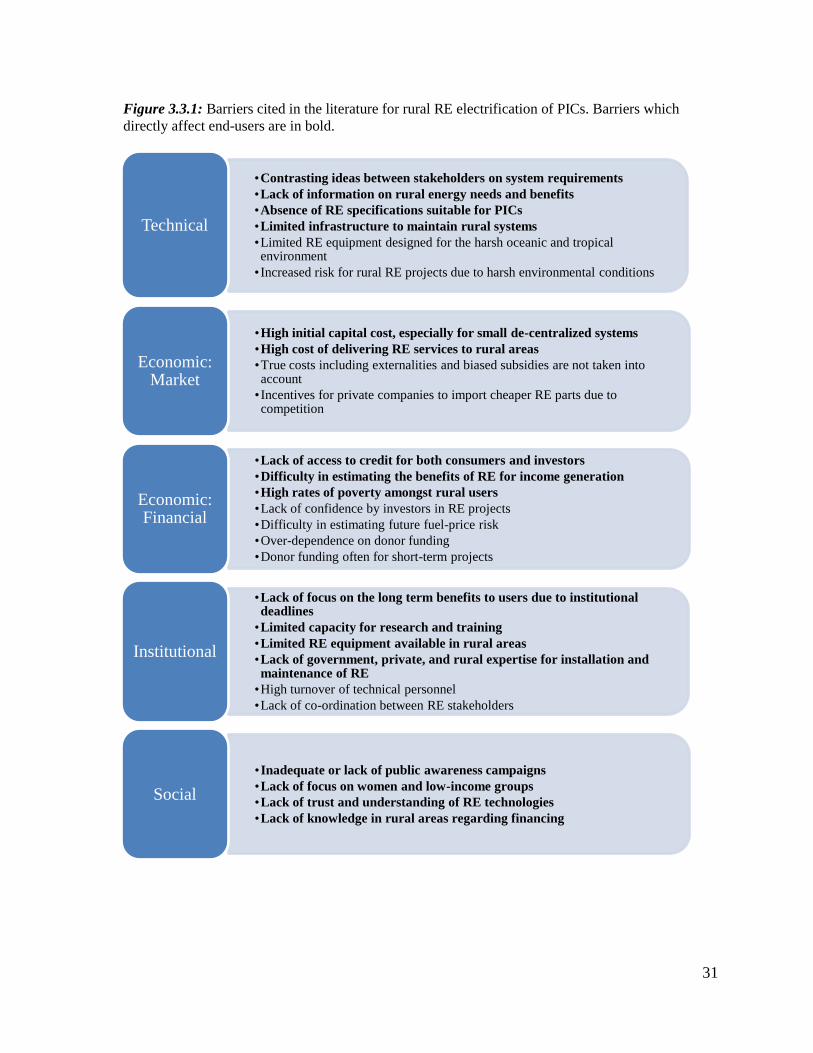
31
•Contrasting ideas between stakeholders on system requirements
•Lack of information on rural energy needs and benefits
•Absence of RE specifications suitable for PICs
•Limited infrastructure to maintain rural systems
•Limited RE equipment designed for the harsh oceanic and tropical environment
• Increased risk for rural RE projects due to harsh environmental conditions
Technical
•High initial capital cost, especially for small de-centralized systems
•High cost of delivering RE services to rural areas
•True costs including externalities and biased subsidies are not taken into account
• Incentives for private companies to import cheaper RE parts due to competition
Economic: Market
•Lack of access to credit for both consumers and investors
•Difficulty in estimating the benefits of RE for income generation
•High rates of poverty amongst rural users
•Lack of confidence by investors in RE projects
•Difficulty in estimating future fuel-price risk
•Over-dependence on donor funding
•Donor funding often for short-term projects
Economic: Financial
•Lack of focus on the long term benefits to users due to institutional deadlines
•Limited capacity for research and training
•Limited RE equipment available in rural areas
•Lack of government, private, and rural expertise for installation and maintenance of RE
•High turnover of technical personnel
•Lack of co-ordination between RE stakeholders
Institutional
•Inadequate or lack of public awareness campaigns
•Lack of focus on women and low-income groups
•Lack of trust and understanding of RE technologies
•Lack of knowledge in rural areas regarding financing
Social
Figure 3.3.1: Barriers cited in the literature for rural RE electrification of PICs. Barriers which
directly affect end-users are in bold.

32
3.4 Barriers and Recommendations for Each Indicator
3.4.1 Technical Indicators:
1. Appropriate equipment use:
Although allowing end-users to choose the best electricity solutions for their needs
has been reported as a success factor, this is rarely the case in SHS projects that are
externally driven (Urmee et al., 2009; Vleuten et al., 2007). Barriers to appropriate
equipment use include contrasting values between donors, governments, and other
international organizations, who often believe the highest quality equipment is necessary in
order to ensure longevity, as compared to RE companies and end-users, who are more
concerned about its functioning adequately and its cost.
Yet, quality control is essential as consumers lack knowledge regarding quality RE
equipment, and some entrepreneurs will try to cut costs by selling poor or faulty equipment
•Cultural biases against women being involved in electrification
•Cultural biases favour short-term thinking
•Jealousy, theft, and vandalism
Cultural
•Lack of funding and organization to set up battery recycling
•Lack of data on CO2 reductions as a result of rural RE implementation
Environmental
•High import tax on RE and equipment
• Ineffective or lack of policies and incentives directed at RE
•Policies biased towards fossil fuels
•Lack of policies regarding standards and labelling for RE and energy-efficient equipment
•Lack of government capital to implement and maintain RE projects
Political
Sources: Akker (2006); Beck & Martinot (2004); Jafar (2000); Martinot et al. (2002); Painuly (2001);
Sovacool et al. (2011); Urmee et al. (2009); Urmee & Harries (2009); van Alphen et al. (2008);
Vanuatu‘s Energy Roadmap Launch (2011); Wade et al. (2004); Yu et al. (1997).

33
and not providing after-sales service (Urmee & Harries, 2009; Vleuten et al., 2007). Poor
quality parts, poor installation and maintenance, and systems being sold by imparting
unrealistically high expectations to users all have been cited as barriers to project success
and durability (Martinot & Reiche, 2000). Thus, equipment standards and certifications for
dealers, as well as after-sales service and education of consumers, are necessary to ensure
appropriate project design. The Sustainable Energy Industry Association of the Pacific
Islands (SEIAPI), created in 2009, was designed with this issue in mind, and has been
working to standardize installation and equipment standards, and train RE stakeholders
around PICs.
2. Effectiveness in meeting users‟ needs:
It has been noted that an objective assessment of users‘ needs, as well as various
design options for solar PV projects, is often absent (Jafar, 2000). Urmee & Harries (2009)
support this claim through a survey that indicates that project designers rarely base their
programs on lessons previously learned or on specific benefits for end-users, despite a
consensus of their value in the literature. For example, user choice in SHS size is often
very restricted in donor-funded projects, and the focus is mainly on providing lighting,
whereas many end-users have reported other services, specifically television and mobile
charging, to be as much if not more of a priority (Nieuwenhout et al., 2001). Yet, adequate
data on end-user priorities and preferences are often absent, and many project designers are
unable to obligate the time or funds to carry out an analysis of end-user priorities and
preferences, despite data that shows that doing so increases a system‘s reliability, lifespan,
and overall benefits (Urmee et al., 2009). Sovacool et al. (2011a) suggests an alternative,
in that projects should provide options of solar lanterns and a range of SHS sizes in order to
allow the benefits to be both affordable and based on users‘ needs. Fortunately, SHSs have
the unique ability to meet users‘ specific energy requirements at the speed and manner
specific for each household (Smith, 2000).
Meeting end-users‘ requirements also depends on adequate training in order to
dispel unrealistic expectations of the services provided by SHSs. Many rural users think
that even a small SHS provides enough electricity to power a TV, freezer, computer,

34
photocopy machine, etc. (Sovacool et al., 2011). This misunderstanding is derived from a
lack of knowledge about how much energy a SHS can produce versus how much energy an
appliance consumes. Combined with this is a lack of understanding of the benefits of
energy-efficient (EE) products, which may consume less than 50% of the energy than that
of normal appliances (see Figure 3.4.1.1). The energy efficiency of products in developing
countries is generally poor; yet, the efficiency is slowly improving following the
affordability of technological improvements in industrial countries (Jochem, 2000).
As a result, users have been found to be
more satisfied with larger SHSs, which have
been found to be more cost-effective and are
less limited in their applications (Nieuwenhout
et al., 2001). This is especially needed as in
most PICs, a large degree of communal control
is retained over resources, and therefore the
benefits of SHSs are often shared (Yu et al.,
1997). Thus, conservative systems-sizing and
increased awareness of the limits of a SHS and
the consequences of overusing it (i.e., battery
failure) have the potential to increase users‘
satisfaction with their systems.
3. Ability to satisfy expanding energy demands:
Many SHS projects have not taken expanding energy demands into consideration
even though rural electricity requirements are growing. For example, Gustavsson (2007)
illustrated that SHS users acquire a growing number of appliances over time, and often
exceed the capacity of their SHS. Therefore, SHSs need to be designed to cater to ever-
changing needs. One technical option to compensate for this is to increase the number of
panels and batteries over time as needed, and to take possible expansion into consideration
when sizing other system components initially. Another option is to train users not only
Source: Twelve-volt travel (2012).
Figure 3.4.1.1: A 12-volt DC powered
energy efficient TV, which consumes
less power than standard TVs and are
ideal for SHS applications.
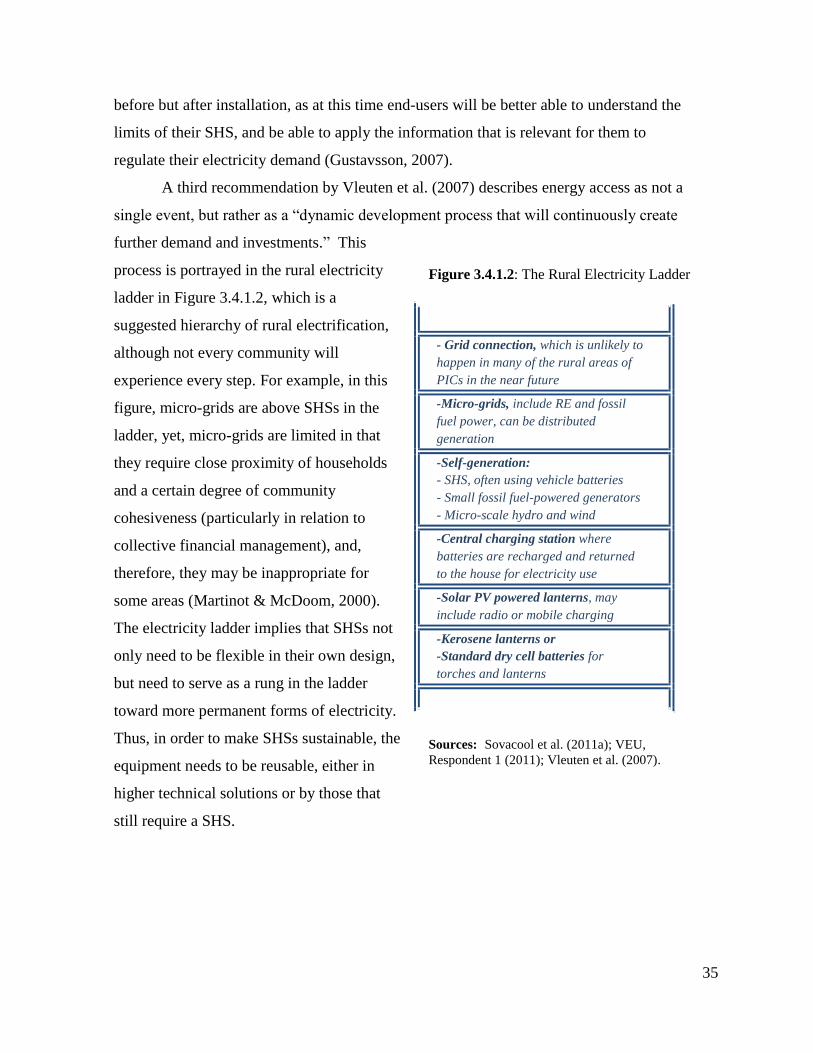
35
before but after installation, as at this time end-users will be better able to understand the
limits of their SHS, and be able to apply the information that is relevant for them to
regulate their electricity demand (Gustavsson, 2007).
A third recommendation by Vleuten et al. (2007) describes energy access as not a
single event, but rather as a ―dynamic development process that will continuously create
further demand and investments.‖ This
process is portrayed in the rural electricity
ladder in Figure 3.4.1.2, which is a
suggested hierarchy of rural electrification,
although not every community will
experience every step. For example, in this
figure, micro-grids are above SHSs in the
ladder, yet, micro-grids are limited in that
they require close proximity of households
and a certain degree of community
cohesiveness (particularly in relation to
collective financial management), and,
therefore, they may be inappropriate for
some areas (Martinot & McDoom, 2000).
The electricity ladder implies that SHSs not
only need to be flexible in their own design,
but need to serve as a rung in the ladder
toward more permanent forms of electricity.
Thus, in order to make SHSs sustainable, the
equipment needs to be reusable, either in
higher technical solutions or by those that
still require a SHS.
- Grid connection, which is unlikely to
happen in many of the rural areas of
PICs in the near future
-Micro-grids, include RE and fossil
fuel power, can be distributed
generation
-Self-generation:
- SHS, often using vehicle batteries
- Small fossil fuel-powered generators
- Micro-scale hydro and wind
-Central charging station where
batteries are recharged and returned
to the house for electricity use
-Solar PV powered lanterns, may
include radio or mobile charging
-Kerosene lanterns or
-Standard dry cell batteries for
torches and lanterns
Sources: Sovacool et al. (2011a); VEU,
Respondent 1 (2011); Vleuten et al. (2007).
Figure 3.4.1.2: The Rural Electricity Ladder

36
3.4.2 Economic Indicators:
4. Cost-effectiveness:
Unfavourable financial, institutional, and regulatory environments, along with
market distortions, suggest that government involvement is required to promote and
support RE deployment (Painuly, 2001). Government‘s failure to address market barriers
can result in unnecessarily high prices for PV equipment and reduce its cost-effectiveness
(van Alphen et al., 2007). For example, the Vanuatu government recently made the import
duty on solar PV batteries equal to vehicle batteries, stating that it was challenging for
customs officials to recognize the difference between the battery types (Vanuatu
Entrepreneur, Respondent 5, 2011). Such a law can decrease PV uptake and discourage
users from replacing their batteries with higher quality ones when needed.
Beck & Martinot (2004), Martinot et al. (2001), and Urmee & Harries (2009)
indicate that programs which include users in their maintenance programs and develop end-
user awareness have fewer technical problems and
lower operating costs per system. In fact, Urmee et
al. (2009) reported that 90% of system
implementers of a successful program in
Bangladesh agreed that O&M costs had been
reduced due to customer consultation and by
allowing users to own their systems.
Overall projects that utilized local RE
dealers often are more cost-effective as local
competition between dealers comes into play,
and funds are often more limited, resulting in
dealers providing the most cost-effective option
for their customers. On the other hand, RESCO
projects are frequently more costly due to high
quality imported parts, contracting out
equipment supply to overseas companies, and
Photograph 3.4.2.1: A SHS located at
a local school in Vanuatu, which
provides lighting for studying at night.
Source: Photography by Juliana
Ungaro (2011).

37
costly fee collection and maintenance programs. One method to lessen the cost of
collecting fees has been to install prepayment meters on each SHS, which enables users to
pay monthly fees themselves rather than rely on the visits of technicians. However, these
meters have had many technical difficulties in PICs, and at times have ended up increasing
rather than deceasing project costs (Wade, 2005a).
5. Effectiveness in changing community livelihoods:
Mala et al. (2009) and Ilskog & Kjellstrom (2008) concluded that SHSs may not be
a feasible option for generating household income. Similarly, a study by Urmee & Harries
(2009) indicated that programs‘ implementers thought that while SHSs increased gender
equality, social activities, access to information, and total working hours, they did not
significantly affect employment or income.
In contrast, Mapako & Prasad (2007) found that both the number of enterprises and
employees increased significantly as a result of rural electrification in Zimbabwe.
Additionally, Chakrabarti (2002) showed significant positive educational, economic, and
health impacts four years after rural electrification in India, and Mala et al. (2008) cited
convenience, increased employment, reduction in work hours, and reduction of urban drift
as benefits in Kiribati (see educational benefits, Photograph 3.4.2.1).
Martinot et al. (2002) suggest economic development from SHSs is more likely to
occur in communities where the economy is already expanding, which may explain why
opinions are varying. Additionally, Vleuten et al. (2007) concluded income-generating
activities utilizing electricity take time to develop, yet over time PV will effectively
contribute to changing livelihoods. Furthermore, Cabraal et al. (2005) suggests that without
electricity there are limits to any type of economic growth in rural areas. Thus, rural
electrification projects should be coupled with economic development endeavours in order
to have a higher chance of increasing local employment (Sovacool et al., 2011a). Still,
more studies are needed to address the long-term effects of SHSs on community
livelihoods.
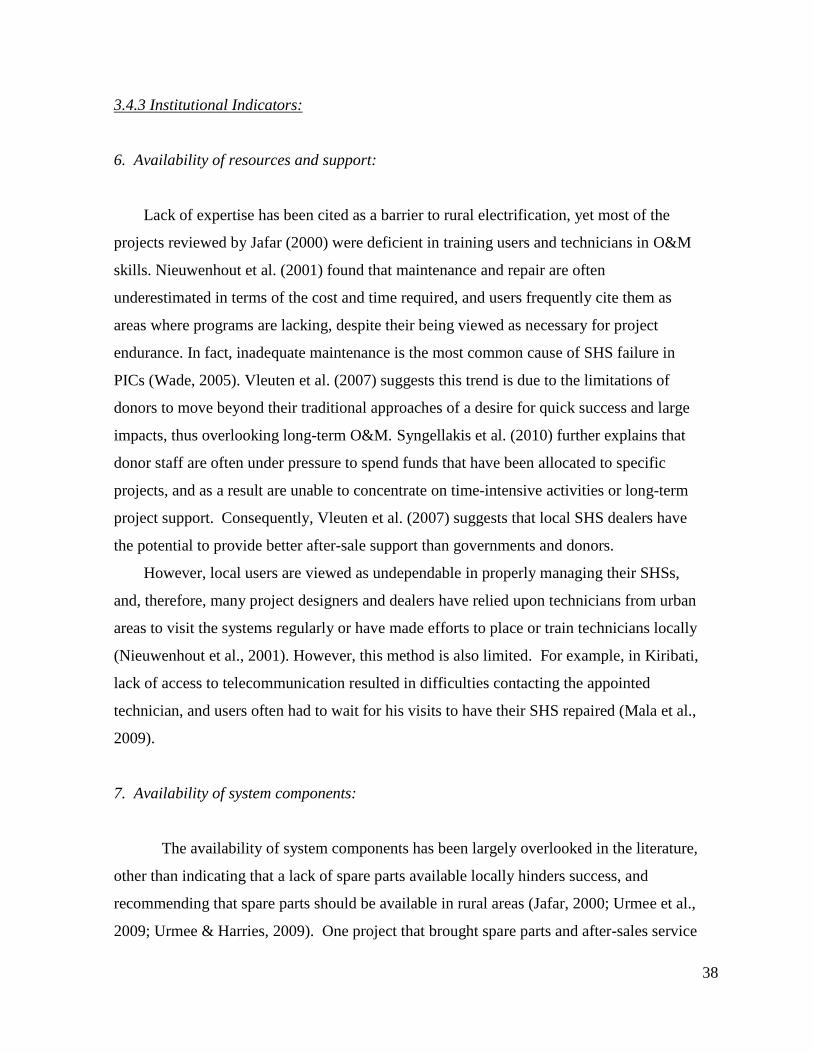
38
3.4.3 Institutional Indicators:
6. Availability of resources and support:
Lack of expertise has been cited as a barrier to rural electrification, yet most of the
projects reviewed by Jafar (2000) were deficient in training users and technicians in O&M
skills. Nieuwenhout et al. (2001) found that maintenance and repair are often
underestimated in terms of the cost and time required, and users frequently cite them as
areas where programs are lacking, despite their being viewed as necessary for project
endurance. In fact, inadequate maintenance is the most common cause of SHS failure in
PICs (Wade, 2005). Vleuten et al. (2007) suggests this trend is due to the limitations of
donors to move beyond their traditional approaches of a desire for quick success and large
impacts, thus overlooking long-term O&M. Syngellakis et al. (2010) further explains that
donor staff are often under pressure to spend funds that have been allocated to specific
projects, and as a result are unable to concentrate on time-intensive activities or long-term
project support. Consequently, Vleuten et al. (2007) suggests that local SHS dealers have
the potential to provide better after-sale support than governments and donors.
However, local users are viewed as undependable in properly managing their SHSs,
and, therefore, many project designers and dealers have relied upon technicians from urban
areas to visit the systems regularly or have made efforts to place or train technicians locally
(Nieuwenhout et al., 2001). However, this method is also limited. For example, in Kiribati,
lack of access to telecommunication resulted in difficulties contacting the appointed
technician, and users often had to wait for his visits to have their SHS repaired (Mala et al.,
2009).
7. Availability of system components:
The availability of system components has been largely overlooked in the literature,
other than indicating that a lack of spare parts available locally hinders success, and
recommending that spare parts should be available in rural areas (Jafar, 2000; Urmee et al.,
2009; Urmee & Harries, 2009). One project that brought spare parts and after-sales service

39
closer to the end-user was the Renewable Energy for rural Access Project (REAP) project
in Mongolia, which expanded SHS retail centres into rural areas (Sovacool et al., 2011a).
Still, it is high-risk and low-return for dealers and utilities to have multiple retailers in rural
areas, and thus external support is needed for the creation of such infrastructure.
Another program used the technological solution entitled SIMbaLink, which is a
device which connects to SHSs and allows solar dealers to remotely monitor installed
systems (Schelling et al., 2010). This technology allows technicians to understand how a
SHS is malfunctioning, and then they can send the required replacement part without
requiring a maintenance visit, thus reducing costs. Such a device also has implications for
training users on how to properly manage their available electricity (Schelling et al., 2010).
However, the data for this device is transmitted over GSM (Global System for Mobile
Communication) networks, and thus it is limited to only certain regions in PICs.
8. Capacity building:
A study by Urmee & Harries (2009) of rural electrification programs in Asia-
Pacific indicated that capacity building was provided to both technicians and system users
only 15% of the time, despite a lack of technical skills being identified as hindering
program success. Mario (2003) also found that in PICs, capacity building programs have
been delivered in an unplanned and informal way, due to the absence of a long-term
training plan, and have been focused on the energy sector, with little training for private
companies or users.
Capacity building is a long-term task and thus long-term program goals and
institutional support need to be available at all levels. Martinot et al. (2002) highlighted
this, suggesting that the amount of RE installed is insignificant, compared to sustainable
and replicable business, credit, and implementation models. Capacity building was
successfully carried out at the dealer level in Bangladesh, through providing financing, and
technical, logistical, promotional, and training assistance to the organizations (Urmee et al.,
2009). Yu et al. (1996) and Yu & Taplin (1997) echo the need for such projects, which
increase human resource capacity nationally, rather than relying on external experts.
Capacity building on the rural level has also been proven to be successful, such as in a

40
RESCO project in Zambia, which found that training decreased end-users‘ overuse of their
SHSs (Krithika & Palit, 2011).
At the local level, Sovacool et al. (2011) indicates that training provides the biggest
challenge to PNG SHS initiatives, yet it has not been done. They suggest training, if done
correctly, should take up to 90% of project efforts, as it ―is laborious, time consuming,
long-term, hard, and essential.‖ Chow (2010) summarized the need for local capacity
building in Vanuatu by attributing project success to its ability to increase end-users‘
understanding, ability, and desire to carry out O&M requirements, as current levels are
inadequate overall.
A variety of training methods can be used to impart needed skills to end-users,
including hands-on trainings, workshops, newspaper articles, TV programs, DVDs, radio
programs, brochures, manuals, websites, and text messages, yet funding is required for all
of these techniques (see Photograph 3.4.3.1) (Sovacool et al., 2011). The cost of capacity
building has been justified in projects globally; however, local dealers often are unable to
spend significant funds on training because it provides minimal return, and donors often are
unable to obligate long-term funding or funding with uncertain returns (Wade, 2005).
Furthermore, donor-funded capacity building has been uncoordinated with other training
and has lacked follow-up (Wade, 2005). Thus, while it is acknowledged that local capacity
building is needed, it is rarely carried out to the degree required.
Photograph 3.4.3.1: A training session for women at Utrok Atoll, RMI.
Source: Photography by Juliana Ungaro (2011).
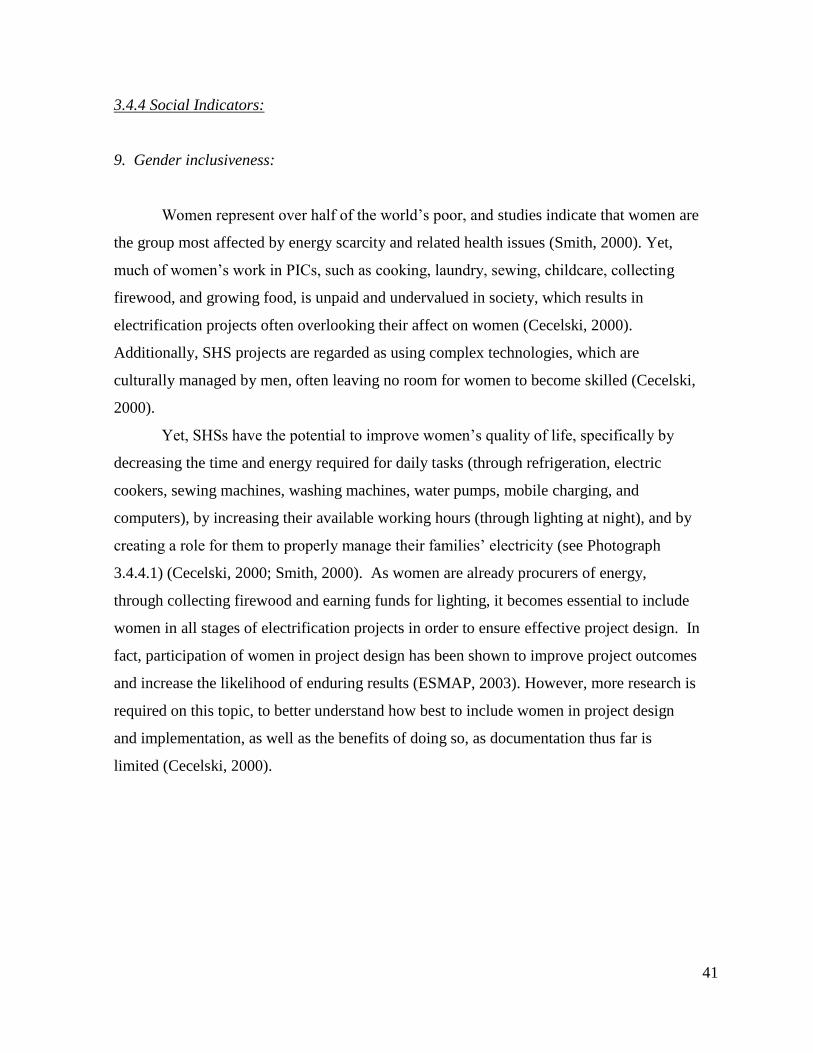
41
3.4.4 Social Indicators:
9. Gender inclusiveness:
Women represent over half of the world‘s poor, and studies indicate that women are
the group most affected by energy scarcity and related health issues (Smith, 2000). Yet,
much of women‘s work in PICs, such as cooking, laundry, sewing, childcare, collecting
firewood, and growing food, is unpaid and undervalued in society, which results in
electrification projects often overlooking their affect on women (Cecelski, 2000).
Additionally, SHS projects are regarded as using complex technologies, which are
culturally managed by men, often leaving no room for women to become skilled (Cecelski,
2000).
Yet, SHSs have the potential to improve women‘s quality of life, specifically by
decreasing the time and energy required for daily tasks (through refrigeration, electric
cookers, sewing machines, washing machines, water pumps, mobile charging, and
computers), by increasing their available working hours (through lighting at night), and by
creating a role for them to properly manage their families‘ electricity (see Photograph
3.4.4.1) (Cecelski, 2000; Smith, 2000). As women are already procurers of energy,
through collecting firewood and earning funds for lighting, it becomes essential to include
women in all stages of electrification projects in order to ensure effective project design. In
fact, participation of women in project design has been shown to improve project outcomes
and increase the likelihood of enduring results (ESMAP, 2003). However, more research is
required on this topic, to better understand how best to include women in project design
and implementation, as well as the benefits of doing so, as documentation thus far is
limited (Cecelski, 2000).

42
10. Affordability:
The affordability of SHSs for rural families is often derived from diverting earnings
from other needs, as they do not often have significant savings (Mala et al., 2009). Many
donor-funded projects assume that users cannot afford to spend more on energy than their
current expenditures (Martinot & Reiche, 2000). Research indicates that end-user income
levels and the prices of the SHSs they purchase do not generally correspond, although the
incomes of owners are normally above average (Nieuwenhout et al., 2001). Thus, much of
the literature cites limited availability of financing, through access to credit for end-users,
to be a barrier for making SHSs available to low-income groups (Beck & Martinot, 2004;
Urmee et al., 2009).
This is especially true for self-initiated projects, as high investment requirements
can create market failure (van Alphen et al., 2008). For example, Sovacool et al. (2011)
pointed out that many people in PNG do not consider the cost over time, as they have a
limited understanding of savings, credit, interest, or even the meaning of money, making
the preliminary cost of a SHS inhibiting. Thus, financial literacy and access to financing
may be more of a barrier to affordability than the actual cost to end-users.
Photograph 3.4.4.1: A rural RMI household receives a new solar-
powered refrigerator, which will help to decrease women‘s workload.
.
Source: Photography by Juliana Ungaro (2011).
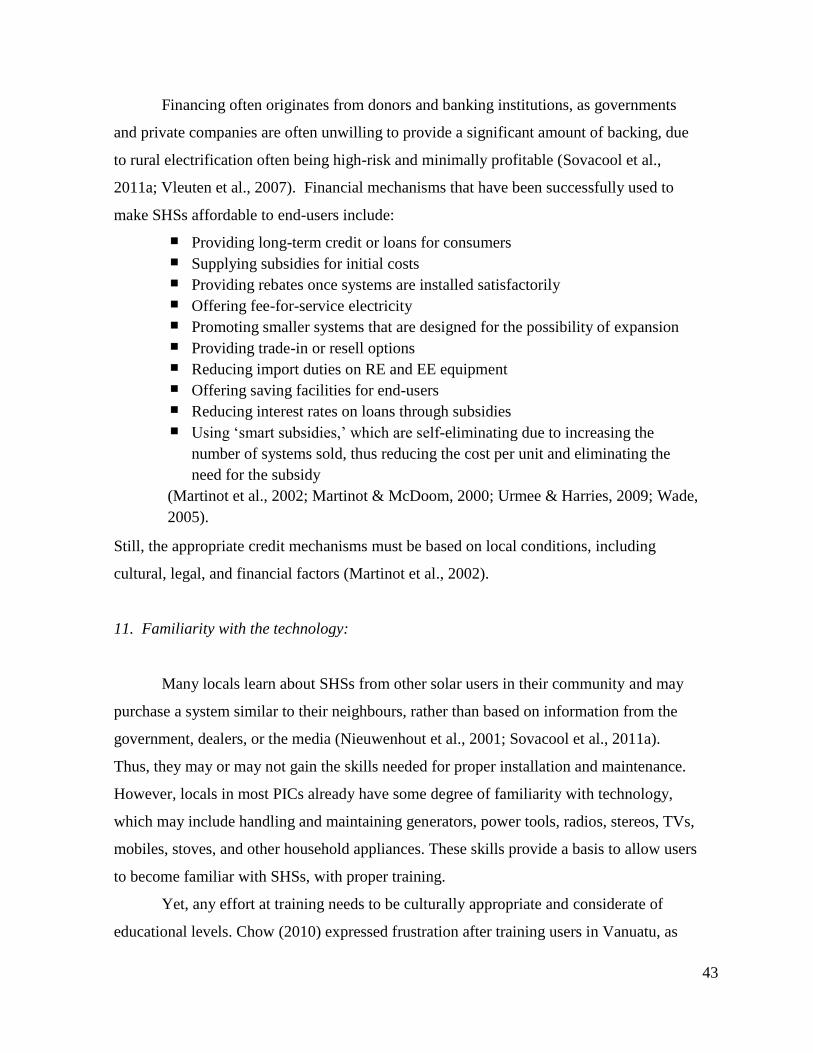
43
Financing often originates from donors and banking institutions, as governments
and private companies are often unwilling to provide a significant amount of backing, due
to rural electrification often being high-risk and minimally profitable (Sovacool et al.,
2011a; Vleuten et al., 2007). Financial mechanisms that have been successfully used to
make SHSs affordable to end-users include:
Providing long-term credit or loans for consumers
Supplying subsidies for initial costs
Providing rebates once systems are installed satisfactorily
Offering fee-for-service electricity
Promoting smaller systems that are designed for the possibility of expansion
Providing trade-in or resell options
Reducing import duties on RE and EE equipment
Offering saving facilities for end-users
Reducing interest rates on loans through subsidies
Using ‗smart subsidies,‘ which are self-eliminating due to increasing the
number of systems sold, thus reducing the cost per unit and eliminating the
need for the subsidy
(Martinot et al., 2002; Martinot & McDoom, 2000; Urmee & Harries, 2009; Wade,
2005).
Still, the appropriate credit mechanisms must be based on local conditions, including
cultural, legal, and financial factors (Martinot et al., 2002).
11. Familiarity with the technology:
Many locals learn about SHSs from other solar users in their community and may
purchase a system similar to their neighbours, rather than based on information from the
government, dealers, or the media (Nieuwenhout et al., 2001; Sovacool et al., 2011a).
Thus, they may or may not gain the skills needed for proper installation and maintenance.
However, locals in most PICs already have some degree of familiarity with technology,
which may include handling and maintaining generators, power tools, radios, stereos, TVs,
mobiles, stoves, and other household appliances. These skills provide a basis to allow users
to become familiar with SHSs, with proper training.
Yet, any effort at training needs to be culturally appropriate and considerate of
educational levels. Chow (2010) expressed frustration after training users in Vanuatu, as

44
some users did not understand how to read the charge controller after its being explained
twice, and others had lost their operation manuals. Possible causes for this could be a lack
of interest by users, the timing of the training (perhaps before installation), the language
used, the method of training (hands-on, power point, etc.), the incongruence between the
manual and reading levels, and an unfamiliarity with keeping track of paperwork. Rather,
in order for training to be successful, it must be based on the end-user‘s level of
technological familiarity.
3.4.5 Cultural Indicators:
12. Participation and ownership:
Urmee & Harries (2009) indicate that only 25% of solar PV program implementers
considered that involving users was important in their program design. Thus, there has been
a trend for project ideas to originate externally, rather than through end-user needs‘
assessments and community opinions (Jafar, 2000). Sometimes this has resulted in
recipients not being committed to project outcomes, and the equipment being stolen,
abused, or abandoned (Jafar, 2000).
A study from Mongolia suggests participation of both the private sector and end-
users in rural electrification leads to project success (Sovacool et al., 2011a). Inclusion of
end-users fosters a sense of ownership, which has been shown to reduce cases of
mistreatment, overuse, and neglect (Urmee et al., 2009). Nieuwenhout et al. (2001)
expands on this by suggesting that users feel more responsible for SHSs that are self-
initiated and for which they have contributed a significant percentage of the cost. Wade
(2005) agrees, suggesting users need to be self-designated, as there needs to be a
commitment of end-users to properly operate and maintain their systems. SHSs are unique
in that they allow energy services to be close to the end-user, making it possible for users to
have full control of their electricity, from design to consumption, if projects allow for such
(Smith, 2000).
13. Willingness to pay:

45
Ilskog & Kjellstrom‘s (2008) research shows that rural users are willing to pay a
significant amount for electricity through SHSs if they are highly satisfied with the
electricity. Furthermore, user-satisfaction affects the rate at which end-users pay back
loans (Nieuwenhout et al., 2001). Satisfaction, and thus willingness to pay, is based on
users‘ expectations, desires, and ease of use, whereas users‘ ability to pay is affected by
income levels, access to financing, and financial discipline (Chow, 2010; Nieuwenhout et
al., 2001).
Thus, cultural factors have an effect on willingness to pay, as demonstrated by Mala
et al. (2009) in their analysis of the Kiribati RESCO project. In this project, users were
required to pay $9 per month (50% was subsidized), which was on average less than their
previous energy expenditures on fuels. However, users were required to pay the RESCO
fee on a monthly basis, whereas previously their fuel costs were paid in small amounts on a
daily basis. This change made the fee unaffordable to many, as it did not fit in with their
cultural norms.
3.4.6 Environmental Indicators:
14. Effectiveness in improving the environment:
SHSs have significant potential to improve
the environment by CC, through replacing and
dissuading future use of harmful fossil fuels (see
Photograph 3.4.6.1). This positive effect has been
accepted as one of the advantages of using SHSs,
and is often mentioned in the literature, although
the amount of CO2 emissions avoided by
implementing SHSs has been measured
infrequently.
However, other environmental effects,
including the disposal of defunct solar batteries and
Photograph 3.4.6.1: Erosion poses a
serious threat to low-lying islands,
and thus GHG emissions may directly
threaten PIC communities.
.
Source: Photography by Juliana
Ungaro (2011).
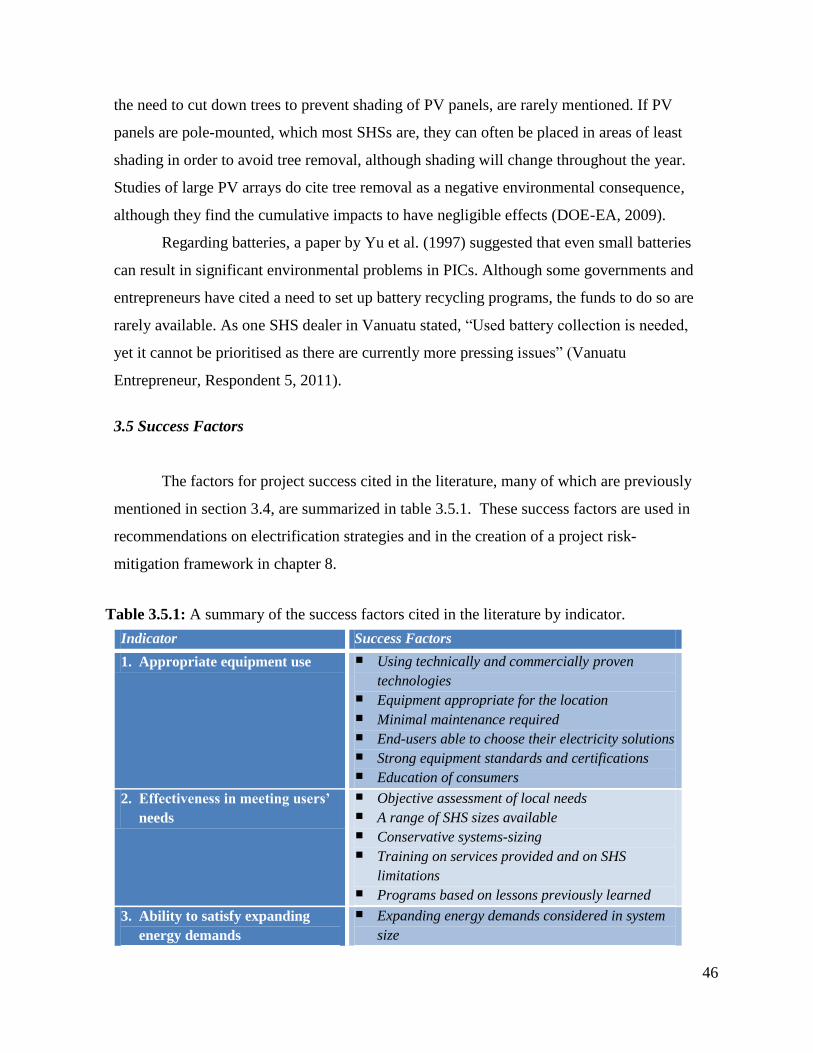
46
the need to cut down trees to prevent shading of PV panels, are rarely mentioned. If PV
panels are pole-mounted, which most SHSs are, they can often be placed in areas of least
shading in order to avoid tree removal, although shading will change throughout the year.
Studies of large PV arrays do cite tree removal as a negative environmental consequence,
although they find the cumulative impacts to have negligible effects (DOE-EA, 2009).
Regarding batteries, a paper by Yu et al. (1997) suggested that even small batteries
can result in significant environmental problems in PICs. Although some governments and
entrepreneurs have cited a need to set up battery recycling programs, the funds to do so are
rarely available. As one SHS dealer in Vanuatu stated, ―Used battery collection is needed,
yet it cannot be prioritised as there are currently more pressing issues‖ (Vanuatu
Entrepreneur, Respondent 5, 2011).
3.5 Success Factors
The factors for project success cited in the literature, many of which are previously
mentioned in section 3.4, are summarized in table 3.5.1. These success factors are used in
recommendations on electrification strategies and in the creation of a project risk-
mitigation framework in chapter 8.
Indicator Success Factors
1. Appropriate equipment use Using technically and commercially proven
technologies
Equipment appropriate for the location
Minimal maintenance required
End-users able to choose their electricity solutions
Strong equipment standards and certifications
Education of consumers
2. Effectiveness in meeting users’
needs
Objective assessment of local needs
A range of SHS sizes available
Conservative systems-sizing
Training on services provided and on SHS
limitations
Programs based on lessons previously learned
3. Ability to satisfy expanding
energy demands
Expanding energy demands considered in system
size
Table 3.5.1: A summary of the success factors cited in the literature by indicator.
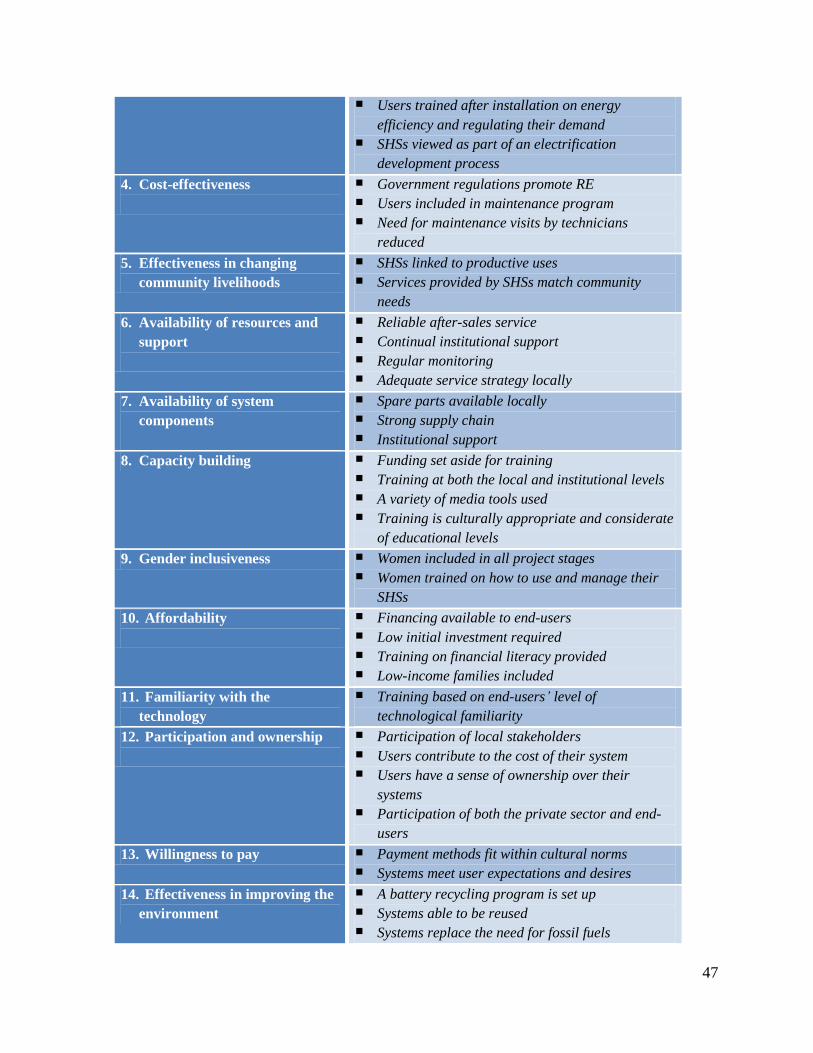
47
Users trained after installation on energy
efficiency and regulating their demand
SHSs viewed as part of an electrification
development process
4. Cost-effectiveness
Government regulations promote RE
Users included in maintenance program
Need for maintenance visits by technicians
reduced
5. Effectiveness in changing
community livelihoods
SHSs linked to productive uses
Services provided by SHSs match community
needs
6. Availability of resources and
support
Reliable after-sales service
Continual institutional support
Regular monitoring
Adequate service strategy locally
7. Availability of system
components
Spare parts available locally
Strong supply chain
Institutional support
8. Capacity building Funding set aside for training
Training at both the local and institutional levels
A variety of media tools used
Training is culturally appropriate and considerate
of educational levels
9. Gender inclusiveness Women included in all project stages
Women trained on how to use and manage their
SHSs
10. Affordability
Financing available to end-users
Low initial investment required
Training on financial literacy provided
Low-income families included
11. Familiarity with the
technology
Training based on end-users‟ level of
technological familiarity
12. Participation and ownership
Participation of local stakeholders
Users contribute to the cost of their system
Users have a sense of ownership over their
systems
Participation of both the private sector and end-
users
13. Willingness to pay Payment methods fit within cultural norms
Systems meet user expectations and desires
14. Effectiveness in improving the
environment
A battery recycling program is set up
Systems able to be reused
Systems replace the need for fossil fuels
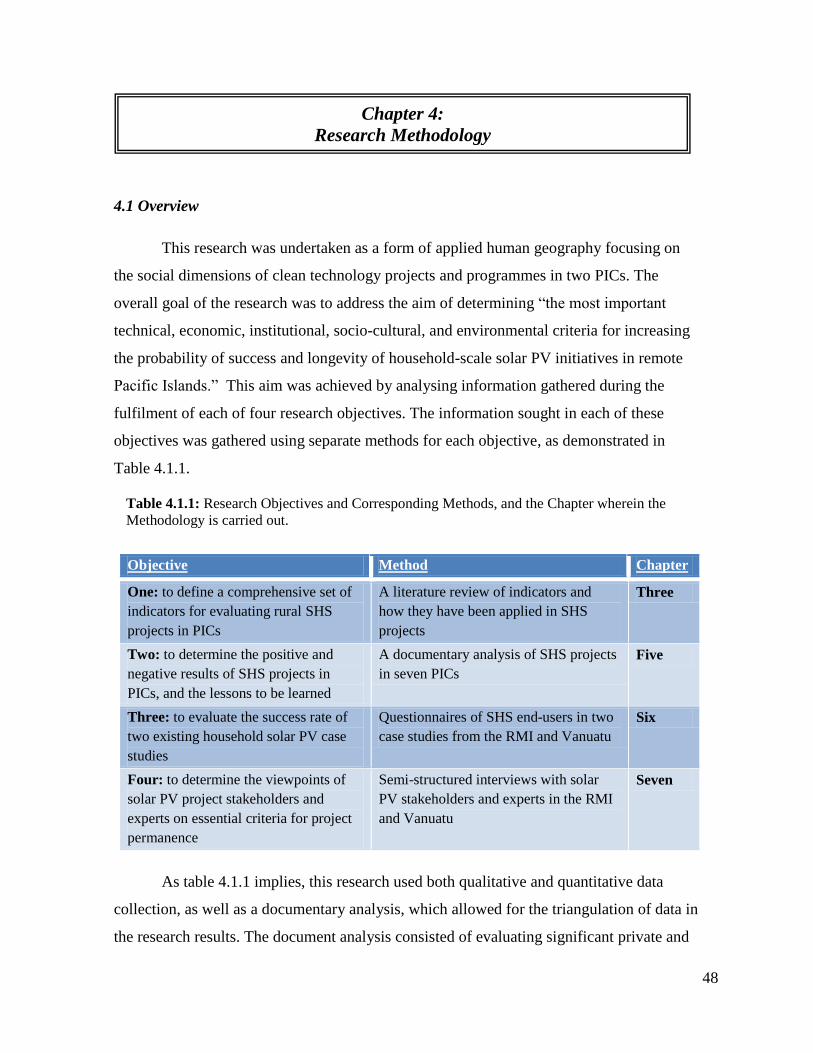
48
Table 4.1.1: Research Objectives and Corresponding Methods, and the Chapter wherein the
Methodology is carried out.
4.1 Overview
This research was undertaken as a form of applied human geography focusing on
the social dimensions of clean technology projects and programmes in two PICs. The
overall goal of the research was to address the aim of determining ―the most important
technical, economic, institutional, socio-cultural, and environmental criteria for increasing
the probability of success and longevity of household-scale solar PV initiatives in remote
Pacific Islands.‖ This aim was achieved by analysing information gathered during the
fulfilment of each of four research objectives. The information sought in each of these
objectives was gathered using separate methods for each objective, as demonstrated in
Table 4.1.1.
Objective Method Chapter
One: to define a comprehensive set of
indicators for evaluating rural SHS
projects in PICs
A literature review of indicators and
how they have been applied in SHS
projects
Three
Two: to determine the positive and
negative results of SHS projects in
PICs, and the lessons to be learned
A documentary analysis of SHS projects
in seven PICs
Five
Three: to evaluate the success rate of
two existing household solar PV case
studies
Questionnaires of SHS end-users in two
case studies from the RMI and Vanuatu
Six
Four: to determine the viewpoints of
solar PV project stakeholders and
experts on essential criteria for project
permanence
Semi-structured interviews with solar
PV stakeholders and experts in the RMI
and Vanuatu
Seven
As table 4.1.1 implies, this research used both qualitative and quantitative data
collection, as well as a documentary analysis, which allowed for the triangulation of data in
the research results. The document analysis consisted of evaluating significant private and
Chapter 4:
Research Methodology

49
donor-funded SHS project reports in seven PICs, in order to answer the research questions
under Objective Two. Primary data was obtained from two selected rural case studies in the
RMI and Vanuatu through questionnaires designed to address research Objective Three,
and through semi-structured interviews carried out in the urban areas of each nation
following research Objective Four. Evaluation indicators developed through the literature
review (see Chapter 3) were used to evaluate the interviews, questionnaires, and project
documents, thus resulting in comparative outcomes. The results were used to determine
essential practices and recommended electrification strategies for SHS projects in PICs,
which then aided in the development of a project risk mitigation tool for PV rollout.
4.2 Literature Review addressing Objective One
To determine the evaluation criteria for the project reports, case studies, and
interviews, a literature review was carried out examining off-grid RE electrification
projects in PICs and in developing countries worldwide. This included the literature on
rural RE evaluation indicators, barriers to RE implementation in PICs and
recommendations to overcome them, and overall success factors, thus answering the
research questions under Objective One. The compilation of indicators from the literature
resulted in the development of evaluation criteria in order to assess which factors were
critical in successful project design (see indicators Table 3.2.1). These indicators were then
applied to the project documents and the primary data collected from the selected case
studies and interviews. The indicators were divided into the overarching topics of technical,
economic, institutional, social, cultural, and environmental, in order to simplify analysis.
4.3 Documentary Analysis addressing Objective Two
The document analysis first examined the literature on the successes and failures of
various electrification methods implemented in developing countries globally, in order to
provide a context for examining project documents from PICs. Thirty project reports and
documents from PICs‘ private, governmental, and donor organizations were examined,
thus addressing the research questions under Objective Two. Many project documents
were examined at once, as it was taken into consideration that projects‘ documents are

50
often the opinion of one person or organization at one point in time, and therefore may not
address the full effects of a project.
SHS projects implemented in Fiji, Kiribati, Tonga, PNG, Tuvalu, Vanuatu, and the
RMI were studied in depth, as well as regional reports relating to implementing SHSs.
These countries were selected as they have the most experience with solar PV for rural
electrification in PICs, and represent a large variety of electrification models. The RMI
represents a RESCO managed by a government utility, Kiribati and Fiji represent a RESCO
managed by a private company with government input, and Tonga represents de-
centralization of the RESCO with management by a community committee. Kiribati‘s
program was successful overall, whereas Fiji‘s program faced numerous issues. PNG
contains the largest private sector for SHSs in PICs, and Vanuatu represents a country
whose primary implementation model changed from RESCOs to user-owned systems over
the past decade. Particular attention was paid to historical and ongoing projects in the RMI
and Vanuatu in order to provide background information for the case-study analysis.
Following the analysis, the lessons learned as stated in all of the project documents were
assembled into a chart.
It would have been desirable to focus equally on the private sector for reasons of
comparative analysis; however, very little information is available in the literature or
project documents regarding the number, size, or longevity of user-owned SHSs installed
in PICs. In addition, RESCOs are the preferred implementation model for many PICs, and
thus they are the focus of many project documents. Therefore, this analysis has included
more RESCO projects, yet patterns in the successes and failures of each model can still be
seen. These patterns were developed through enumerating the evaluation indicators
addressed by the project results of each electrification model. Therefore, this document
analysis provided insights into the potentials and limitations of various electrification
methods for Vanuatu, the RMI, and other PICs.
4.4 Primary Research Country Overviews
The primary data from the RMI was collected during the period of February-April
2011, while the data in Vanuatu was collected during October 2011. The RMI and

51
Vanuatu were selected because they have a long history with solar PV, with both user and
utility owned SHSs, electrification highly reliant on international aid, and extremely
isolated islands, many of which are still in need of electrification (see Table 4.4.1). Their
levels of development are similar, with the RMI ranking slightly above Vanuatu in their
Human Development Index and Human Poverty Index for PICs (see Table 1.1.1). Further
similar qualities include high unemployment rates and uneven income distribution, with a
relatively high level of poverty in the rural islands (UNDP, 1999).
In addition, their urban areas have comparable populations, with the two nations
facing a high rate of population growth and urbanization (see Tables 4.4.2), and the RMI
also undergoing high rates of emigration to the US. The urban areas of both nations are
electrified by a single utility company through diesel-powered generators, with electricity
prices per kilowatt-hour being extremely high, and Vanuatu‘s being among the highest
globally (see Table 1.3.1).
Indicator RMI Vanuatu
Geography 29 coral atolls with hundreds of
islets and five single islands
An archipelago of 83 islands
Capital Latitude 7 degrees North 17 degrees South
Capital Population 30,000 residents 44,040 residents
Climate and landscape Tropical, low-lying coral atolls Tropical, volcanic mountains,
fringing reefs
Land area 181 sq. km. 12,190 sq. km.
Population 59,667 234,023
GDP $161.7 million $647 million
Per capita income $2,258 $1,339
Fuel % of total imports 20% 18%
Annual population
growth rate
2.14% (lower due to emigration) 2.5%.
Percent electrified 32% 33%
Table 4.4.1: A comparison of the RMIs‘ and Vanuatu‘s national statistics and geography.
Sources: RMI National Energy Policy (2009); Trading Economics (2011); Trading Economics
(2011a); USDOS (2011); USDOS (2011a); Vanuatu‘s Energy Roadmap Launch (2011).

52
VANUATU URBAN MIGRATION TRENDS:
Source: UN Habitat (2005).
4.5 Questionnaires addressing Objective Three
The research on the two selected case studies was carried out in the rural villages of
Namdrik Atoll in the RMI and Akhamb Island in Vanuatu. These communities were
chosen because of their unique history with solar PV (described below), their remote
locations and small populations (under 800 inhabitants in each) and their combined display
of the three implementation strategies described in Chapter 2 (RESCO, project-initiated
user-owned, and self-initiated user-owned).
Namdrik Atoll is a small atoll in the Ralik Chain of the RMI, consisting of two
islands with its total land area being only 2.8 square kilometres, and its lagoon
encompassing an area of 8.4 square kilometres (see Figure 4.5.1). It has a population of 772
people with 118 homes (MEC, 2005), and was first electrified in 1996 by Marshalls
Alternative Energy Company (MAEC), which installed 80W SHSs to all households using
a RESCO model. However, most of these systems failed, and in 2001, the Pacific
Renewable Energy France Australia Common Endeavor (PREFACE) project funded
Urban migration trends in the Republic of the Marshall Islands (RMI)
Source: RMI census (1999).
Tables 4.4.2: Urbanization trends in the Marshall Islands and Vanuatu.

53
rehabilitation, with the Marshalls Energy Company (MEC) taking over the RESCO in 2004
(See Appendix 8 for full details). These systems are to be replaced in 2012 through the
European Unions‘ North REP project (RMI Utility Company, Respondent 19, 2012).
In 2010, a private solar company, Island Economic and Environmental Co. (Island
Eco) installed thirty-three 320W SHSs with refrigeration units on Namdrik Atoll, with 75%
of the funding being provided by the United States Department of Agriculture Rural Utility
Service (USDA-RUS) and 25% by local community members. The Namdrik Atoll local
government was also involved, and aided the beneficiaries in financing their portion of the
project, as well as paying for some logistical costs. Many of the household members were
involved in the installation, and a local language training book, the Marshallese Solar
Manual, was provided to project participants (see Figure 4.5.2). The SHSs are owned by
the solar company for the first two years after installation, in order to further train end-
users and ensure that the systems are working properly, after which the users will own the
systems, following a project-initiated user-owned model.
Source: CIA (2009a).
Figure 4.5.1: A map of Namdrik Atoll and its location in the RMI.
Source: Minton (2007).
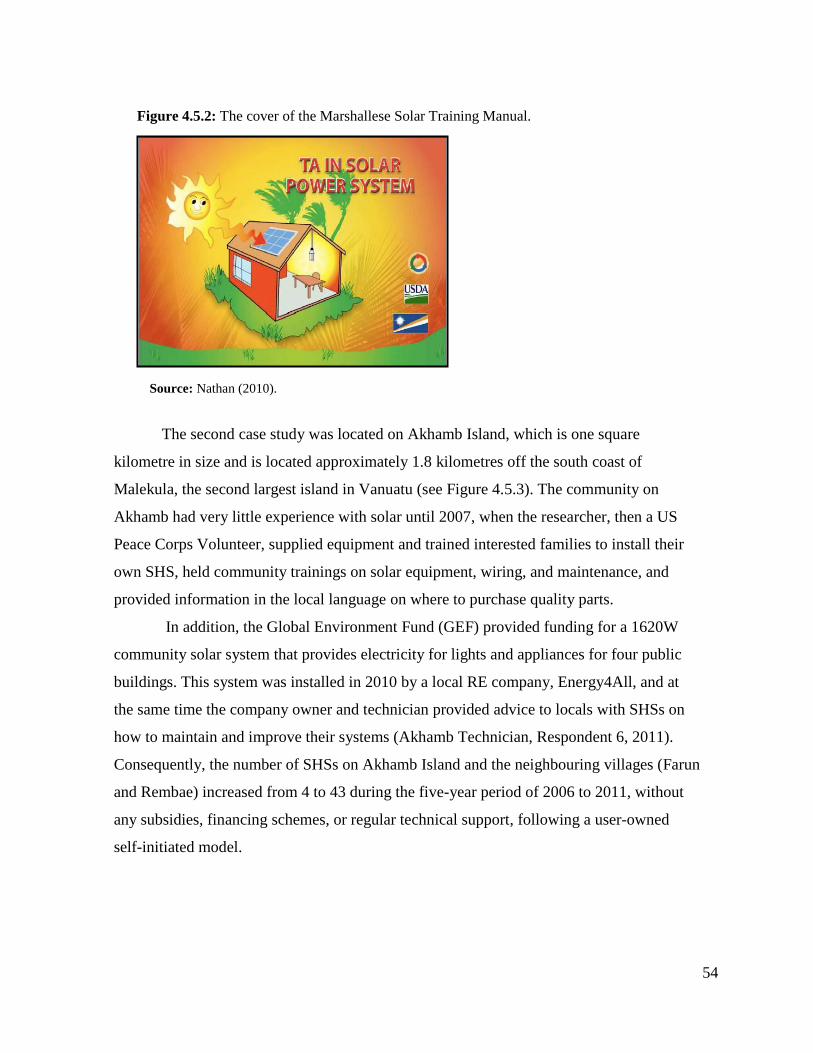
54
The second case study was located on Akhamb Island, which is one square
kilometre in size and is located approximately 1.8 kilometres off the south coast of
Malekula, the second largest island in Vanuatu (see Figure 4.5.3). The community on
Akhamb had very little experience with solar until 2007, when the researcher, then a US
Peace Corps Volunteer, supplied equipment and trained interested families to install their
own SHS, held community trainings on solar equipment, wiring, and maintenance, and
provided information in the local language on where to purchase quality parts.
In addition, the Global Environment Fund (GEF) provided funding for a 1620W
community solar system that provides electricity for lights and appliances for four public
buildings. This system was installed in 2010 by a local RE company, Energy4All, and at
the same time the company owner and technician provided advice to locals with SHSs on
how to maintain and improve their systems (Akhamb Technician, Respondent 6, 2011).
Consequently, the number of SHSs on Akhamb Island and the neighbouring villages (Farun
and Rembae) increased from 4 to 43 during the five-year period of 2006 to 2011, without
any subsidies, financing schemes, or regular technical support, following a user-owned
self-initiated model.
Figure 4.5.2: The cover of the Marshallese Solar Training Manual.
Source: Nathan (2010).

55
In addition, an Australian Aid (AusAid) program provided a subsidy for solar-
powered lanterns and collaborated with local NGOs to make the lanterns available in
Akhamb and other communities (see Photograph 4.5.1 and Appendix 9 for full details). As
a result of the lanterns and SHSs, as of January 2010, kerosene ceased to be sold or used on
Akhamb Island and in the neighbouring communities. It is likely that this is the first
community in Vanuatu to no longer rely on imported kerosene for lighting, as the national
government, NGOs, and solar companies interviewed were not aware of any other
community that had reached this milestone.
Figure 4.5.3: A photograph of Akhamb Island, a map of Malekula with Akhamb Island
highlighted, and its location in Vanuatu.
Sources: Malekula map - Wikimedia Commons (2006); photograph above by Juliana Ungaro; Vanuatu
map - CIA (2009b).

56
Quantitative questionnaires were utilized in order to analyse the needs and
preferences of the SHS end-users in the two case studies, with questions being analogous,
resulting in comparable data. The surveys had a comparative design, which aimed to
generate insights into existing theories on the methods of electrification through contrasting
findings, as well as to give insights into essential practices for project durability. This
approach was appropriate for the purpose of understanding in detail the experiences and
preferences of rural Marshallese and Ni-Vanuatu regarding SHS design, implementation,
and maintenance.
In the case of this research, this approach allowed the researcher to seek
quantifiable information from all of the households with SHSs in the two selected
communities, although not all of the questionnaires were returned or fully completed. In
Namdrik Atoll, self-completion questionnaires, written in both Marshallese and English,
were given out to all households with SHSs, and end-users were given three weeks to
return them. The questionnaires were reviewed by locals for clarity before being dispersed.
Using this method, only 18 out of 33 were returned fully complete. In Vanuatu, a different
approach was taken, as the researcher was fluent in the local language. Thus, the
Photograph 4.5.1: A local family with their SHS, and a chief of Akhamb Island with his solar
lantern.
Source: Photography by Juliana Ungaro (2011).

57
questionnaires could be administered verbally by visiting each household with a SHS. It is
likely that this method provided higher quality answers as respondents were able to seek
clarification, and 39 out of 43 houses were able to be fully surveyed (four of the
respondents were unavailable at the time of data collection). Yet, both questionnaires
provided indicative data, and did not aim to obtain statistically significant results, due to
the purpose of the questionnaire and the size of the sample, and thus useful conclusions can
be drawn from both data sets.
The questionnaires were specifically designed to answer the research questions
under Objective Three, with each question addressing at least one evaluation indicator. The
full questionnaire and the indicators which each question corresponds to are described in
Appendix 6. To simplify analysis, the questionnaires contained all closed-ended questions,
with the option for respondents to choose ‗other‘ and insert their own answer in several
questions. Some questions asked respondents to choose all answers that applied, to choose
the most relevant answer, or asked for ranking of the value of a statement, from ‗not
important‘ to ‗very important‘. These various types of questions resulted in interval,
ordinal, nominal, and dichotomous variables (Bryman, 2008, p. 321).
4.6 Interviews addressing Objective Four
Qualitative semi-structured interviews were conducted in the capitals of each
nation: Port Vila (Vanuatu) and Majuro (RMI). These were carried out at the local and
national governmental levels, as well as in the private sector and with aid donors.
Purposive sampling was utilized to select the respondents, all of whom were identified as
holding key positions in the RE fields. Contact was made prior to executing the interviews.
Port Vila has seven solar PV companies, two NGOs, the National Energy Unit, and
an AusAid organization office that are currently involved in rural electrification through
solar PV. All but one solar company owner, both NGOs, two government representatives,
a representative from AusAid, and an outer island solar technician were interviewed. The
researcher was familiar with several solar company owners through previous experience,
and snowball sampling was utilized in order to identify other interviewees. In addition,
Vanuatu‘s Energy Roadmap Launch Conference was attended by the researcher, and the
information that was presented regarding Vanuatu‘s energy context is cited in this research.

58
In the RMI, more time was available so initial scoping exercises were carried out in
order to identify key respondents, which included conversations with the national energy
office, local government officials, a private solar company owner, and the RMI‘s national
President. Additionally, an energy internship was carried out by the researcher in the RMI,
which gave insight into the Island Eco project on Namdrik and its energy situation.
Through this internship, regional information was acquired via a scoping conversation with
the Secretariat of the Pacific Community (SPC). Energy stakeholders in Majuro are
comprised of one private solar company, the national Resource and Development Office
under which the Energy Service Programme (ESP) is located, the national utility company,
many local atoll government leaders, and one NGO. A representative from the solar
company, three local government representatives, and one national government
representative were interviewed.
All of the interview questions were designed in advance; however, topics were
flexible and able to be modified within the conversation in order to obtain more detailed
information on emerging issues and also to make them more appropriate for the particular
context and interviewee (Robson, 1993). This allowed for interviewees to state their
opinions in depth on the topic at hand. Questions covered topics such as the interviewee‘s
experience with RE, including implementation and maintenance strategies and lessons
learned, their opinions on the importance of user training and involvement, essential
practices that they have identified, and their trust in RE technologies. All of the interview
questions were specifically designed to answer the research questions under Objective
Four, with interview Questions 12 and 13 specifically addressing research Question 2. In
addition, each interview question corresponded to at least one evaluation indicator (see
Appendix 7).
4.7 Data Analysis
The quantitative data analysis utilized univariate and bivariate analysis in order to
identify patterns in the data. The responses were first coded, and then entered into a
widely-used statistical computer program entitled Statistical Package for Social Sciences

59
(SPSS), in order to identify patterns, compare variables, calculate averages, and display the
quantitative information graphically (see Chapter 6).
The qualitative data analysis used an inductive approach through an iterative
process, oscillating back and forth between data and theory (Bryman, 2008, p. 545). This
‗Grounded Theory‘ approach to data analysis was used as a strategy for generating theory
from data, where data collection, analysis, and the resulting conclusions are closely related.
In the case of this research, this approach enabled the researcher to organise disaggregated
or incomplete pieces of information into codes to categorise data (open code), put it in a
different way (axial code), and interrelate or validate it (selecting code) (Bryman, 2008, p.
543). Therefore, patterns could be identified in the data, allowing for the generation of the
theories (see Chapter 7).
Both the qualitative and quantitative data results were then compared by indicator
to the lessons learned through the literature review and to the success factors determined by
the documentary analysis, in order to draw conclusions regarding appropriate electrification
methods and critical practices for solar PV projects in PICs. These conclusions were used
to create a project risk mitigation framework for solar PV project rollout, which provides
insights into good practice guidance for project design, implementation, and maintenance
(see Chapter 8).
4.8 Ethical Issues
The Victoria University‘s Human Ethics Committee granted approval for this
research. Each respondent was given information prior to the interview or questionnaire
about the thesis purpose and methods, and interviewees were given the chance to state their
preferences for confidentiality. As a result of some preferences, the names of respondents
are not mentioned in this thesis, only their positions and the nation in which they are
located.

60
5.1 A Global Summary of SHS Implementation Models
5.1.1 User-owned systems:
At the end of 2010, approximately 40 GW of solar PV had been implemented
worldwide (REN21, 2011). Estimates of the largest examples of SHS installations globally
include:
More than 500,000 in Africa as of 2007
More than 125,000 in Sri Lanka as of 2010
More than 600,000 SHSs and 800,000 solar lanterns in India as of 2010
More than 400,000 SHSs in north-western China (purchased through
China‘s Renewable Energy Development Project) (REN21, 2011).
An estimated one-third of the SHSs installed in developing countries are funded by donors
and two-thirds have been supplied by commercial dealers (Nieuwenhout et al., 2001).
Successful SHS commercial markets world-wide include those found in Kenya,
Morocco, Sri Lanka, India, Western China, and Zimbabwe (Vleuten et al., 2007). Surveys
of self-initiated SHSs in Kenya suggest systems are 25W on average and are 80-90%
operational, which is average or better than average for developing countries (Nieuwenhout
et al., 2001). A survey by Nieuwenhout et al. (2001) indicates that many users prefer a
market-based approach, as 93% of respondents in Namibia and 95% in Swaziland prefer to
own rather than rent a SHS.
Many donors and governments also acknowledge the role of the private sector as a
key element in driving development and designing creative electrification solutions
(Vleuten et al., 2007). Thus, for more than a decade, donor-initiated user-owned projects
have become popular, focusing on enhancing market forces to promote electrification
through increased access to financing (REN21, 2011). However, at times this model has
confused markets and even served as competition for dealers (Vleuten et al., 2007). One
successful method to overcome this has been to fund local financing institutions that are
Chapter 5:
An Analysis of SHS Projects Implemented in PICs

61
committed to rural RE projects, which in turn provides financing to private companies,
concessionaires, NGOs, and microfinance groups involved in the solar market. This
occurred in the Infrastructure Development Company Limited (IDCOL) program in
Bangladesh, where a local financial institution supported by donors provided refinancing,
channelling of grants, setting of equipment standards, and capacity building for 30 local
organizations who have now sold over 750,000 SHSs (Krithika & Palit, 2011; REN21,
2011). Similarly, rapid market growth occurred in Sri Lanka as a result of such a program,
where donors and local financial institutions supported the private sector by providing
credit to end-users and strengthening their organization (Krithika & Palit, 2011).
Grants and loans, which aid public and private organizations directly, have also
become a common method to support SHS markets globally. Furthermore, some projects
have financed rural electrification by combining grid extension and off-grid electrification
into the same project, as off-grid electrification projects are often too small and too risky to
be considered for substantial financial loans (REN21, 2011).
5.1.2 RESCOs:
Examples of RESCOs implemented worldwide include those in Zambia, Mali,
Senegal, Sri Lanka, Dominican Republic, and the Comoros Islands (Krithika & Palit, 2011;
REN21, 2011). The RESCO in Mali and Senegal was run directly by the government
utility, whereas the RESCO in Zambia was implemented by the government but run by the
private sector. Initially, the RESCO in Zambia served most of the population; however,
research indicates that many users without a steady source of income have been
disconnected due to defaulting on fees, and mainly government workers remain (Krithika
& Palit, 2011). This fading interest of end-users over time has been noted in a number of
RESCO projects globally, and was seen in both countries examined in this research
(Vleuten et al., 2007).
Furthermore, even if users do continue to make timely payments, in many RESCOs
the fees are too low to cover the equipment and maintenance costs of the SHS. Rather, such
projects are often subsidized in order to include low-income users, and fees are often set
based upon affordability (Martinot & Reiche, 2000). This can be viewed as a strength in
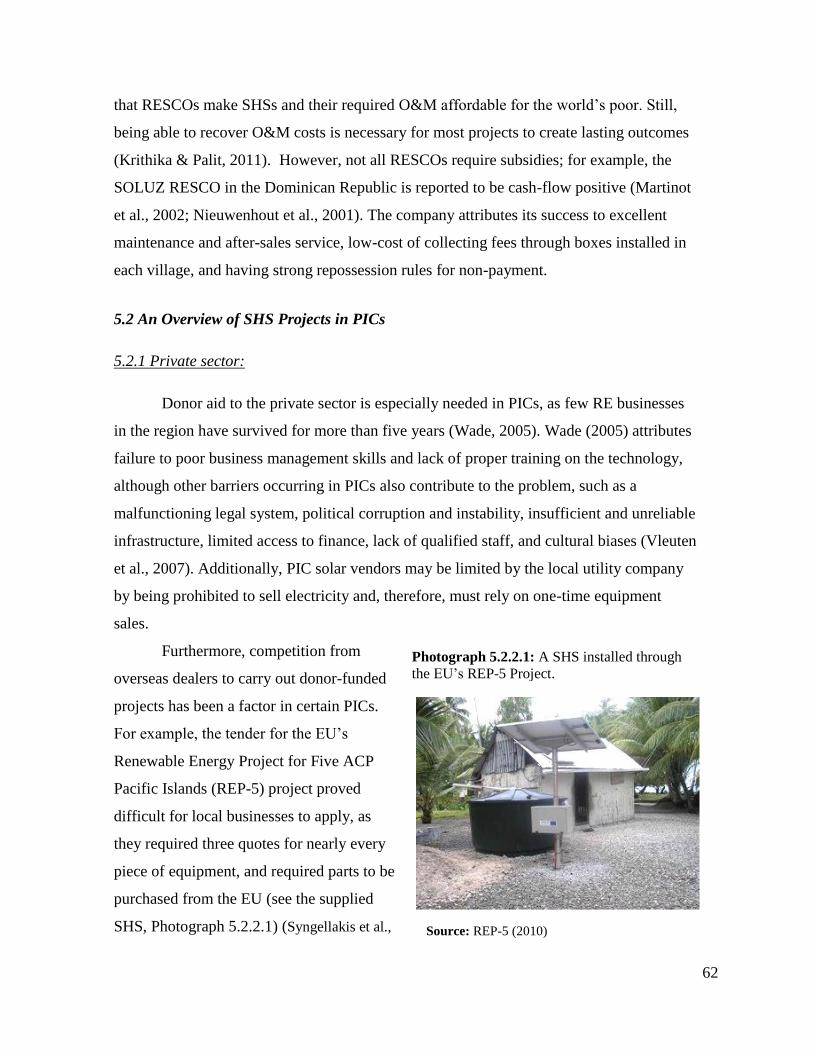
62
that RESCOs make SHSs and their required O&M affordable for the world‘s poor. Still,
being able to recover O&M costs is necessary for most projects to create lasting outcomes
(Krithika & Palit, 2011). However, not all RESCOs require subsidies; for example, the
SOLUZ RESCO in the Dominican Republic is reported to be cash-flow positive (Martinot
et al., 2002; Nieuwenhout et al., 2001). The company attributes its success to excellent
maintenance and after-sales service, low-cost of collecting fees through boxes installed in
each village, and having strong repossession rules for non-payment.
5.2 An Overview of SHS Projects in PICs
5.2.1 Private sector:
Donor aid to the private sector is especially needed in PICs, as few RE businesses
in the region have survived for more than five years (Wade, 2005). Wade (2005) attributes
failure to poor business management skills and lack of proper training on the technology,
although other barriers occurring in PICs also contribute to the problem, such as a
malfunctioning legal system, political corruption and instability, insufficient and unreliable
infrastructure, limited access to finance, lack of qualified staff, and cultural biases (Vleuten
et al., 2007). Additionally, PIC solar vendors may be limited by the local utility company
by being prohibited to sell electricity and, therefore, must rely on one-time equipment
sales.
Furthermore, competition from
overseas dealers to carry out donor-funded
projects has been a factor in certain PICs.
For example, the tender for the EU‘s
Renewable Energy Project for Five ACP
Pacific Islands (REP-5) project proved
difficult for local businesses to apply, as
they required three quotes for nearly every
piece of equipment, and required parts to be
purchased from the EU (see the supplied
SHS, Photograph 5.2.2.1) (Syngellakis et al.,
Photograph 5.2.2.1: A SHS installed through
the EU‘s REP-5 Project.
Source: REP-5 (2010)
63
2010). In addition, local RE entrepreneurs are often overlooked by donor-funded projects,
and such projects can undermine local market initiatives to the point of putting local
dealers out of business (Vleuten et al., 2007). A solar PV company in the RMI described
this experience of needing to diversify their products in order to stay in business, due to
competition from externally-funded projects supplying SHSs at a subsidized rate through
overseas companies (RMI Entrepreneur, Respondent 3, 2011). Furthermore, consumers
have come to expect subsidized costs as a result of donor aid, and may refuse to pay market
prices, thus undercutting local dealers (Martinot et al., 2002).
The Kiribati Solar Energy Company (SEC) was unsuccessful with private sales of
SHSs to end-users from1984-1989 (specifics are described in Appendix 10). This is often
cited as an example of why private markets are not the most-effective method of
electrification in PICs (Nieuwenhout et al., 2001; Wade, 2005). Yet, as noted in Chapter 1,
cost, quality, and user-friendliness of SHSs have dramatically changed in the past 20 years,
as have users‘ familiarity with technology. Furthermore, there are a number of experiences
in PICs that have shown that the involvement of local companies is an efficient and
effective way to transfer technology, especially in Vanuatu, Fiji, and PNG. However, very
little information is available in the literature or project documents regarding the number,
size, or longevity of SHSs installed through the private sector in PICs, and thus the success
of self-initiated user-owned projects in PICs is hard to quantify. The documented positive
and negative experiences and lessons learned from the commercial market in PNG are
described in detail in Appendix 11.
5.2.2 RESCOs:
RESCOs are the preferred option for many PICs, such as Fiji, Kiribati, Tonga, the
Federated States of Micronesia (FSM), and the RMI, with Kiribati and Fiji‘s RESCOs
being managed by local entrepreneurs acting as service companies, while FSM and the
RMI‘s RESCOs are managed by government-run utility companies (Wade, 2005). Tonga‘s
RESCO utilized a different approach, in that village-based Solar Energy Committees were
set up to handle program and financial decisions, fee collections, and basic O&M, with the
government energy sector providing only technical backup and supply of spare parts.

64
However, RESCOs in PICs continue to face difficulties, especially with fees failing to
cover the cost of the program, slow and ineffective maintenance programs, and users
overusing the systems as they are rewarded for system failure by receiving new equipment
(Dornan, 2010; Wade, 2005a). In addition, RESCOs often rely on overseas dealers for
equipment supply, sometimes resulting in difficulties after installation in obtaining spare
parts and technical assistance (Yu & Taplin, 1997). This was the case in the RMI, where
spare lamps for the hundreds of SHSs installed by the government-run RESCO were
unavailable nationwide at the time of this research.
Kiribati‘s SEC has been the exception, in that it has been fully functional since
1992, and has grown significantly as a result of successful management and donor support.
It has now electrified nearly 4,000 households in Kiribati, with SHSs powering lights and
radios. A summary of the history of RESCO electrification projects in Fiji, Kiribati, and
Tonga, as recorded in project documents to date, as well as their positive and negative
results and lessons learned, are described in more detail in Appendix 10.
5.2.3 Community-based approaches:
Co-operative management of SHS electrification was attempted in Tuvalu with the
Tuvalu Solar Energy Co-operative, which was subsidized by grants, with systems
maintained by locally-trained technicians. However, problems with money management
caused the co-operative to dissolve after 10 years, which highlighted a major weakness of
co-operative management, in that financial discipline is too weak. As a result, co-operative
management has not been readily accepted in PICs or globally (Wade, 2005). The details of
the project in Tuvalu are illustrated in Appendix 12.
Another community-based approach has been ‗focal point‘ electrification, in which
solar PV gives power to community facilities, such as a community laundromat or
entertainment centre, rather than to individual homes. This model was used in Namdrik
Atoll in the RMI for six community refrigeration systems; however, as no community
building was available for the systems, they were installed in the chiefs‘ houses (Empower,
2005). Community members were uncomfortable entering the chiefs‘ houses to use the
systems, and thus the systems were used mainly by the chiefs‘ families (see a full

65
description of the project in Appendix 8). This model also has been ineffective in other
sites, as maintenance of the systems has generally been poor due to a lack of clear
ownership and responsibility for O&M.
5.2.4 Clean Development Mechanism (CDM):
Carbon credits are a growing source of project finance among developing countries
globally; however, no SHS projects have been carried out under the CDM in PICs. It has
been suggested that small-scale community-level CDM projects are the most likely to
result in poverty alleviation and livelihood changes (Subbarao, 2010). At the same time, the
small scale is one of the biggest challenges for implementing CDM projects in PICs, in
order to overcome project development and transaction cost barriers. However, there is still
a significant potential for PIC SHS projects to be executed under the CDM.
5.3 SHS projects in the RMI
5.3.1 Past Projects:
The RMI has a long history of rural electrification through solar PV, which is
portrayed more fully in Appendix 8. Most of the recent projects have been implemented
through a RESCO model managed by the Marshalls Energy Company (MEC), and some
have been met with limited success. The only existing private company focused on RE is
Island Eco (IE), which has been selling solar lanterns and SHSs to individuals since 2001.
The current status of their electrification project on Namdrik Atoll is described in detail in
Chapter 6.
5.3.2 Ongoing Projects:
The EU‘s North REP project is the follow-up to its REP-5 electrification project for
the North Pacific Islands. Under the North REP project, 1,500 SHSs are to be installed in
the RMI of 200W each, powering 5 lights per system (SPC, 2011). In addition, 700 of the

66
SHSs are to have inverters for powering AC appliances. Equipment is to arrive in Majuro
in the middle of 2012, after which it will be installed in the outer islands by MEC, with
O&M being managed by them as well, through a RESCO scheme.
5.4 SHS Projects in Vanuatu
5.4.1 Past Projects:
The Vanuatu Energy Unit (VEU) experimented with the RESCO model for rural
electrification from 1999 to 2005, and was met with limited success (see Appendix 9). One
reason for this was a lack of VEU staff to manage the project and promote RE (Matakiviti,
2006). After 2005, the private RE market gained strength and has been the primary installer
of SHSs since, with nine RE companies and NGOs currently active in Port Vila.
Microfinance to increase affordability of these systems has not been common, and
currently only one microfinance organization, Vanwoods, has partnered with one NGO to
provide financing to end-users (AusAid, Respondent 7, 2011).
5.4.2 Ongoing Projects:
The AusAid funded Vanuatu Electricity for Rural Development (VERD) Program
will run for six years, starting in 2012 or 2013, and will partner with the new Rural Energy
Unit, which is being established through Vanuatu‘s National Energy Plan. The aim of
VERD is to have 80% of rural households use solar PV as their dominant light source at the
close of the program (AusAid, 2011). This will be carried out through a ‗rural lighting
subsidy scheme,‘ which aims to: 1. Increase the affordability of small SHSs by subsidizing
the initial cost; 2. Provide funds for pre-qualified vendors to help ease market constraints
and create economies of scale; and 3. Provide incentives to help strengthen supply chains
around Vanuatu. Thus, the project includes scope for market expansion while providing
support and certifications for Vanuatu‘s private sector (AusAid, 2011). Also, a promotional
campaign will be run to make users aware of the VERD program and which SHSs are

67
eligible for subsidies, which include household SHSs up to 30W (for lighting only)
(AusAid, Respondent 7, 2011).
End-users will be encouraged to use systems responsibly, and will agree to have
certain responsibilities for O&M. The project will provide education for users on system
capacity and proper O&M, and will specifically target women to operate systems, as
VERD has observed that they are generally more responsible than men in managing SHSs
(AusAid, 2011). A call centre will be available to aid users in repair, and systems will
initially be under warrantee (AusAid, Respondent 7, 2011). In addition, vocational
programs for training solar technicians will be set up in both the capital and rural areas.
Other ongoing regional projects and efforts are summarized in Appendix 13.
5.5 Trends in Project Documents
Project documents on the history of SHS electrification in seven PIC countries were
examined, and are described in Appendices 8-12. The positive and negative results of
projects that utilized a RESCO or user-owned model were categorized by indicators, with
the co-operative approach excluded because it is not common or proven to be successful in
PICs. Figure 5.5.1 demonstrates the number of occurrences of each indicator by
electrification model. More RESCOs were considered than user-owned projects as it is the
preferred electrification method in many PICs, and therefore they are more
comprehensively documented. Therefore, conclusions cannot be drawn regarding one
method as being preferable over another in terms of the number of positive and negative
results, but, rather, the strengths and weaknesses of each model can be seen through trends.
These trends include:
Cost-effectiveness and availability of resources and support were the most
cited issues overall, indicating that they are seen as essential for project success
Participation and ownership were also often mentioned, in regards to the need
for transparency and inclusion of all stakeholders from the project development
stage

68
Both project models did not often consider their ability to satisfy expanding
energy demands, user familiarity with the technology, gender inclusiveness, or
effectiveness in improving the environment, leaving room for improvement
Many RESCOs cited poor availability of resources and support, poor
availability of system components, and poor willingness to pay by users in
PICs; user-owned projects were stronger in the last two of these fields, with
both types of projects lacking in providing resources and support, often due to
long distances of projects from technicians and managing organizations
RESCOs were strong in affordability, whereas user-owned projects were
neutral in this regard, which was expected based on subsidies for RESCOs and
costs for users being extended over time
User-owned systems were strong in their effectiveness in changing community
livelihoods, whereas this was often overlooked by RESCOs, which follows as
user-owned systems vary in size and are able to join with local business efforts
more easily
Both RESCO and user-owned projects often are not very cost-effective, often
due to equipment failures and systems needing to be subsidized
Capacity building was often overlooked in both RESCOs and user-owned
projects, resulting in negative results and sometimes project failure

69
0
2
4
6
8
10
12 N
um
ber
of
Occ
urr
ence
s
Positive and Negative Results found in RESCO and User-owned Projects
Positive Effects Found in RESCO Projects
Negative Effects Found in RESCO Projects
Positive Effects Found in User-owned Projects
Negative Effects Found in User-owned Projects
Figure 5.5.1 Positive and Negative Results found in RESCO and User-owned PIC
project documents by the number of occurrences of each indicator.

70
5.6 Lessons Learned as Stated in PIC Project Documents
The lessons learned through examining the project documents for seven PICs, as
well as other more general documents regarding experiences with rural electrification in
PICs, are summarised in Table 5.6.1. Some of these lessons may appear to be conflicting
due to differing opinions; however, they are appropriate to the electrification model
examined. Lessons that were cited twice or more are italicised, and can be considered
essential in project design. In summary, the topics that were often repeated include the need
to:
have transparency and non-conflicting interests from all parties
oversize systems and use high-quality technologies proven for PICs
have options for system sizes that can be increased according to demand
have a reliable maintenance plan with spare parts available locally
make systems affordable for users by spreading costs over time
have projects that are cash-flow positive for the long-term, to avoid reliance on
subsidies
provide training for users, and for other project stakeholders as well
consider users with irregular incomes, as they have trouble paying regular
monthly fees
provide O&M and contact information for users in the local language, and
attach it to the systems

71
Indicator Lessons Learned
1. Appropriate
equipment use
End-users may purchase undersized systems and cheap replacement components if given the choice
Prepayment meters appear to be a good concept in theory, but in practice they require skilled personnel to
maintain them
High quality and maintenance-free batteries are needed to avoid issues with servicing and increase longevity
Complex technologies and untested equipment for PIC environments may create maintenance issues
Outdoor lights are important for remote islands and should be considered in system design
2. Effectiveness in
meeting users’
needs
Though it is desirable to standardise equipment in order to create economies of scale, this should not come before
appropriate system use
Systems should be oversized, as end-users often share the services provided, which is part of the Pacific culture
The conservative nature of people in PICs and their general reluctance to change make it difficult to introduce
new technologies and operational structures
Lessons learned in earlier projects should be consistently applied to later projects, yet this requires a clear
national policy for electrification
3. Ability to satisfy
expanding energy
demands
Providing only one system size does not account for increasing energy demands, and can result in dissatisfaction
Demand for consumer electronics and appliances in PICs is increasing, following global markets, and SHSs
should be designed to accommodate this
Providing the same-sized systems for all households promotes inequity rather than fairness, as the poor often
cannot keep up with payments and may be disconnected, causing embarrassment. Options in system sizes would
solve this issue, especially if end-users are allowed to adjust the size of the system they are renting based on
changes in income.
4. Cost-effectiveness Oversize systems makes economic sense, in order to reduce the need for expensive battery replacements
Disconnected systems need to be relocated to avoid project inefficiency
Fees need to be set according to project costs, rather than according to previous energy expenditures or income
levels, unless projects plan to be subsidized for their duration; this will help prevent distortions in the market
RESCO projects can become an economic burden for the managing organization if they fail
One company was successful using elders as technicians, as they were more respected in the community and
therefore more able to collect fees
5. Effectiveness in
changing
community
Many projects supply systems that only provide lighting and sometimes power a radio or a mobile, thus limiting
possibilities for productive uses
Projects that provide the same sized systems hinder the employment of SHSs for productive uses
Table 5.6.1: Lessons learned as stated in project documents in PICs.

72
livelihoods Employing rural organizations and increasing their business capacity can increase community livelihoods
6. Availability of
resources and
support
Both installers and maintenance technicians should be based within the project country
Communication between end-users and the managing organization/ vendor needs to be easily available and
systematic
An abundance of skilled personnel aids in project endurance
Technicians need to be located near to the systems they maintain in order to improve efficiency and reduce costs
Wages for technicians need to be fair, and provided on an incentive basis
A lack of a long-term O&M policy leads to project failure
The RESCO model increases longevity by providing regular O&M
Project policies regarding fees, disconnection, and O&M need to be consistent locally and nationally to prevent
unfairness
All manuals and information need to be translated into the local language and made accessible for users; this
may include a maintenance checklist, graphical instructions, and contact numbers for support
7. Availability of
system components
Strong supply lines need to be developed to replenish spare parts
Project fees should include costs of spare parts for unexpected technical problems
Spare components need to be available locally to avoid delays in maintenance
8. Capacity building Training is required at all levels for management, technicians, and end-users
Training end-users can increase project longevity
All rural users need to be able to maintain their SHSs, as they may not have regular access to after-sales service
due to the remoteness of PICs
Some technicians felt their training was not adequate, reflecting the need for practical training that meets their
educational levels
Active government support is required if they are involved in electrification projects, which is not always possible
due to under-resourced and under-staffed offices
9. Gender
inclusiveness
Women end-users may be more responsible than men as SHSs managers, and need to be targeted for training
The energy sector in PICs is male-dominated, indicating a need for training for women at all levels
10. Affordability People with regular incomes are much more likely to pay monthly fees on time
Cash-flow is generally irregular and needs-based, and therefore many rural end-users struggle to pay monthly
fees and prefer smaller, more regular payments
RESCOs in some PICs have been collecting less than half of target payments, as households are not motivated to
pay ongoing fees
SHSs are still not affordable nor a priority for many low-income families
Solar lanterns may be more affordable options than small SHSs for lighting
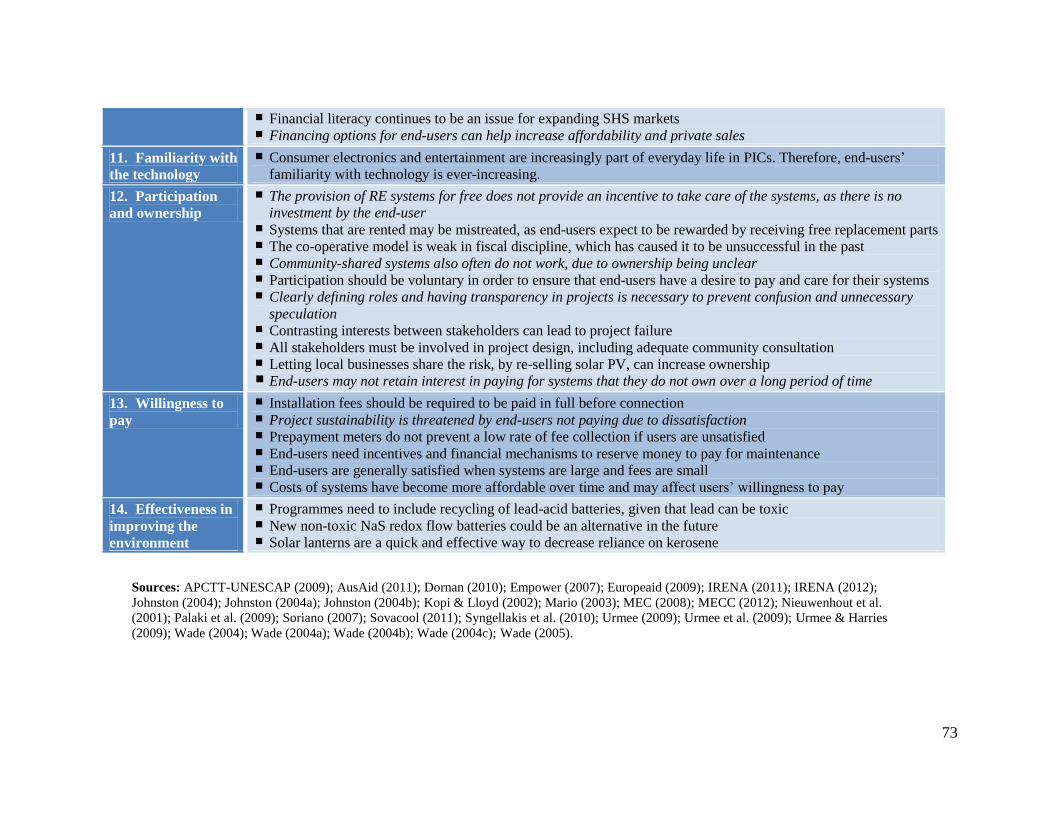
73
Financial literacy continues to be an issue for expanding SHS markets
Financing options for end-users can help increase affordability and private sales
11. Familiarity with
the technology
Consumer electronics and entertainment are increasingly part of everyday life in PICs. Therefore, end-users‘
familiarity with technology is ever-increasing.
12. Participation
and ownership
The provision of RE systems for free does not provide an incentive to take care of the systems, as there is no
investment by the end-user
Systems that are rented may be mistreated, as end-users expect to be rewarded by receiving free replacement parts
The co-operative model is weak in fiscal discipline, which has caused it to be unsuccessful in the past
Community-shared systems also often do not work, due to ownership being unclear
Participation should be voluntary in order to ensure that end-users have a desire to pay and care for their systems
Clearly defining roles and having transparency in projects is necessary to prevent confusion and unnecessary
speculation
Contrasting interests between stakeholders can lead to project failure
All stakeholders must be involved in project design, including adequate community consultation
Letting local businesses share the risk, by re-selling solar PV, can increase ownership
End-users may not retain interest in paying for systems that they do not own over a long period of time
13. Willingness to
pay
Installation fees should be required to be paid in full before connection
Project sustainability is threatened by end-users not paying due to dissatisfaction
Prepayment meters do not prevent a low rate of fee collection if users are unsatisfied
End-users need incentives and financial mechanisms to reserve money to pay for maintenance
End-users are generally satisfied when systems are large and fees are small
Costs of systems have become more affordable over time and may affect users‘ willingness to pay
14. Effectiveness in
improving the
environment
Programmes need to include recycling of lead-acid batteries, given that lead can be toxic
New non-toxic NaS redox flow batteries could be an alternative in the future
Solar lanterns are a quick and effective way to decrease reliance on kerosene
Sources: APCTT-UNESCAP (2009); AusAid (2011); Dornan (2010); Empower (2007); Europeaid (2009); IRENA (2011); IRENA (2012);
Johnston (2004); Johnston (2004a); Johnston (2004b); Kopi & Lloyd (2002); Mario (2003); MEC (2008); MECC (2012); Nieuwenhout et al.
(2001); Palaki et al. (2009); Soriano (2007); Sovacool (2011); Syngellakis et al. (2010); Urmee (2009); Urmee et al. (2009); Urmee & Harries
(2009); Wade (2004); Wade (2004a); Wade (2004b); Wade (2004c); Wade (2005).

74
6.1 Results of the Quantitative Questionnaire by Indicators
The following results are based on answers to questionnaires from 18 respondents
from Namdrik Atoll, RMI, regarding a RESCO and project-initiated user-owned project,
and 39 respondents from Akhamb Island, Vanuatu, regarding their self-initiated user-
owned SHSs5.
1. Appropriate equipment use:
Ninety-two percent of the 43 SHSs installed between 2005 and 2011 on Akhamb
Island were working properly at the time of research (Q#13&20)6. For those that were not
working, one owner had sent his module to be fixed by a solar company in Port Vila, and
two owners were saving up funds to replace broken modules, as they were bought from a
solar vendor in Port Vila that had been selling used, faulty panels. In addition, nine
inverters had needed to be replaced, probably due to their being poor quality or not
designed for the environment (Q#21) (see Figure 6.1.1.1). Such experiences demonstrate
the need for more appropriate PV equipment use, through the creation of certifications and
standards for equipment and vendors.
Only 26% of end-users on Akhamb were using a deep-cycle battery (designed for
solar PV); the others were using vehicle batteries, due to their cheaper cost (Q#25).
However, these batteries also have a much shorter lifespan, which is probably the reason
why four batteries have needed to be replaced already. AusAid (2011) suggested that a
possible solution to encourage the use of deep-cycle batteries would be to subsidize their
price.
The average specifications of the SHSs on Akhamb are illustrated in Table 6.1.1.1
(Q#25). These systems were sized relatively well in terms of the ratio of module sizes to
5 See Chapter 4 for background information on the projects.
6 This indicates the question number(s) in the questionnaire from which the information was gathered.
See Appendix 6 for the full text of the questionnaire.
Chapter 6:
The Quantitative Data Results and Analysis

75
batteries, although some systems were undersized for the power requirements, which also
may have contributed to battery failures. However, many owners said that they would like
to add modules to their SHS to prevent overuse, and buy batteries designed for solar PV
when their current batteries fail.
All of the surveyed SHSs installed by Island Eco (IE) on Namdrik Atoll were
working at the time of research (Q#20). Additionally, 83% of the surveyed systems
rehabilitated in 2001 through the PREFACE project, and managed by MEC since 2004,
were working (Q#37) (See Photographs 6.1.1.1). Both systems used high quality parts as
compared to Akhamb, although some of the PREFACE equipment still needed replacing.
In fact, only four years after refurbishment, it was reported that some of the batteries were
beginning to fail (Empower, 2005).
These systems managed by MEC are 80W and powered 3 lights (MEC, 2005). The
systems installed by IE were 320W, powering 2 lights and a freezer (Q#25&43). Both
systems were well-designed to power the appliances intended; however, many end-users
were found to be using additional appliances with both of the systems, thus leading to
system overuse (Empower, 2005; RMI Entrepreneur, Respondent 3, 2011). Thus, the
quality of equipment did not help to overcome maintenance issues faced from system
overuse, which was seen in all models.
0
5
10
15
20
25
30
Pe
rce
nta
ge
Which Parts had been Replaced in the SHSs at the Time of Research
Namdrik
Akhamb
Figure 6.1.1.1 (Q#21):

76
Average watts of modules 66W
Range of watts of modules 15-270 W
Average battery amperage 111 Amp hours
Average number of lights 2.3 lights
Percentage of systems with a television 67%
Percentage of systems with a stereo 23%
Percentage of systems with a computer 8%
Percentage of systems with a printer 8%
Percentage of systems with a freezer 3%
Photographs 6.1.1.1: SHSs installed by IE (top) and managed by MEC (bottom) on Namdrik
Atoll.
Table 6.1.1.1: Akhamb‘s 43 SHSs‘ specifications and usage (Q#25).
Sources: Photography by Ned Nathan (2011).

77
2. Effectiveness in meeting users‟ needs:
One hundred percent of respondents from both communities reported that they
preferred to be able to design and alter their systems, with all of the respondents on
Akhamb Island having designed their own SHS (Q#15&51). Although this was not the case
with the end-users of the IE systems, IE did conduct a survey of user-preferences, and
based their system design on users‘ stated preferences for refrigeration and lighting (RMI
Entrepreneur, Respondent 3, 2011).This contrasted with the PREFACE-installed systems
on Namdrik Atoll, which despite some community consultation, did not include end-users
preferences in the final system design (Q#33) (Wade, 2004a). This may have caused many
end-users to both alter their systems by adding inverters and appliances, and be unwilling
to pay fees (Empower, 2005).
Solar PV is the main source of power in both communities, with only 3% of
respondents having generators for backup power, and many respondents on Namdrik
having two SHSs, due to the presence of two projects that served different needs (Q#7) (see
Figure 6.1.2.1). One hundred percent of respondents in both case studies indicated that
having a SHS was very important to their family, and that they trusted solar PV as a
reliable power source (Q#52&53). Therefore, SHSs appear to be a satisfactory and trusted
technology to meet end-users‘ electricity needs.
On Namdrik, end-users expressed the most interest in gaining access to more
lighting, a television, and a washing machine, indicating that the number of lights provided
by the two projects were not enough for some households (Q#26) (see Figure 6.1.2.2).
Television was an expected response, as neither project was designed to power them, and
the literature suggests television is the most desired appliance beyond lighting.
Additionally, the high demand for IE‘s systems, considering their cost, indicates that
refrigeration was a sought-after service which met many users‘ needs.
More lighting and television was also desired by end-users on Akhamb, followed
by a freezer, stereo, computer, and power tools in descending order. Some users on
Akhamb indicated that they were planning to purchase more lights or the appliance of their
choice, and some had considered expanding their system to fit the additional power
requirements.

78
Overall, lighting and television were the most desired result of electrification in the
case studies, followed by refrigeration and other appliances, depending on end-users‘
occupations and interests. SHSs need to incorporate these preferences, as otherwise they
risk dissatisfying end-users, and users will alter and overuse their systems to meet their
needs.
0
5
10
15
20
25
30
35
Nu
mb
er
of
Ho
use
ho
lds
Other Power Sources Households have in Addition to their Most Recent SHS
Namdrik
Akhamb
0 2 4 6 8
10 12 14 16 18 20
What Appliance Users would Like to Add to their SHS
Namdrik
Akhamb
Figure 6.1.2.2 (Q#26):
Figure 6.1.2.1 (Q#7):

79
3. Ability to satisfy expanding energy demands:
Neither of the projects implemented on Namdrik were designed to accommodate
expanding energy demands. This was especially problematic with the PREFACE systems,
as electricity demands quickly increased after installation (Empower, 2005). However, the
aim of the IE systems was to provide refrigeration to households that desired it, rather than
to provide electrification, and thus systems were of adequate size to meet this need without
expansion (RMI Entrepreneur, Respondent 3, 2011). Still, SHS end-users on Namdrik who
desired power for additional services needed to purchase their own additional energy
source (or alter one of the systems, against the managing organizations‘ recommendations)
(Q#16&34).
This was not the case on Akhamb, as systems were initially designed by users to
power the appliance of their choice, based on their ability to pay. Some systems were even
designed with expanding needs in mind, depending on the SHS supplier (Vanuatu
Entrepreneur, Respondent 8, 2011). In addition, one SHS owner resold his system locally
and purchased a new system in order to expand his household‘s energy supply. Therefore,
the systems on Akhamb did take expanding energy demands into account in two different
ways. Overall, the case studies indicate that projects that are user-initiated are more likely
to satisfy expanding energy demands and, therefore, more likely to satisfy end-users.
4. Cost-effectiveness:
Users were paying $12/month to MEC to rent the systems on Namdrik, or $144 per
year, which was later reduced to $5 temporarily (Q#35). With the IE project, users were
paying $1750 for the initial cost, equal to 25% of the total price of the systems; however,
the cost of maintenance has yet to be quantified as the systems were installed in 2010. The
Namdrik local government provided financing to end-users, by allowing households to
reimburse them for the initial cost over time, in order to increase affordability.
When comparing the costs, initially the IE systems appeared more costly than the
MEC systems; however, this is an unfair comparison because the IE systems had provided
320W systems with refrigeration, a sought-after appliance in remote tropical atolls and one
that can contribute to productive uses. The system cost included maintenance for the first

80
two years, beyond which ownership is transferred to users, who will then have to cover the
costs. In contrast, the 80W systems managed by MEC are mainly for lighting, yet fees
include maintenance and component costs. In addition, no tax or import duty was paid by
PREFACE on the equipment or spare parts, whereas the IE systems included tax and
import duty, thus making the IE systems more costly.
On Akhamb, 67% of end-users were paying between $0-100 per year to maintain
their systems, most of which was spent directly on spare parts (see Figure 6.1.4.1) (Q#18).
Owners who were unsure how to fix their systems may seek advice from a local technician;
however, this cost was minimal ($2-5 per visit). The other 33% included those who had
purchased poor quality parts or had more than one part break within a year. However, the
average size of the systems installed on Akhamb (66W) was smaller than the other two
projects, and they had been installed an average of 2.1 years ago (as of October 2011), and
thus maintenance costs may still increase.
A comparison of the cost-effectiveness of the MEC-managed systems and the
systems installed on Akhamb is made in Table 6.1.4.1 (IE was left out as maintenance cost
data is unavailable). This table indicates that since end-users on Akhamb are able to
purchase parts directly, with a variety of solar vendors to choose from, and the cost of
paying a local technician to visit is minimal, the systems on Akhamb have the potential to
be the most cost-effective if managed correctly. In addition, it shows that the cost of
maintaining a SHS is similar to that of grid-supplied residential power in Port Vila.
Given the current costs for users, all three systems are cost-effective in their own
right, as one includes maintenance, one provides refrigeration, and one allows users to
spend their money directly on components. However, if the subsidies on the Namdrik
projects are removed (the SHSs on Akhamb were not subsidized), the self-initiated systems
appear to be the most cost-effective.
Project MEC Akhamb
Average array output 80W 66W
Average solar hours per day 6 hours 6 hours
Total kWhrs available per 175.2 kWhrs/yr 144.5 kWhrs/yr
Table 6.1.4.1: A comparison of the cost per kW hour of the systems
managed by MEC and those installed on Akhamb Island.

81
year
Yearly average cost (including subsidies)
$144 $95 (85 parts and 10 for technician)
Estimated per kWhr charge $0.82/kWhr $0.66/kWhr
5. Effectiveness in changing community livelihoods:
Lighting was used for a variety of activities on both Akhamb and Namdrik (see
Figure 6.1.5.1). The most regular use was for ‗studying,‘ followed by ‗reading,‘ ‗eating,‘
and ‗cooking,‘ with 80% or more of respondents in both communities employing their
lights for these reasons (Q#9). Other purposes included ‗making something to sell,‘
‗selling something at night,‘ carrying out ‗business-related work,‘ holding ‗evening
meetings,‘ and for ‗household security.‘ Over 80% of users on Akhamb and nearly 60% on
Namdrik were ‗making something to sell,‘ which commonly referred to women weaving
handicrafts at night. ‗Selling something at night‘ and undertaking ‗business-related work‘
also occurred regularly in both communities. All of these responses indicate that SHS lights
are already being used for productive purposes in both communities, and have undoubtedly
contributed to improving community livelihoods.
The freezers installed on Namdrik were also being used for productive purposes, as
89% of respondents indicated that they were ‗storing something to sell locally,‘ and 83%
indicated that they were ‗storing something to export to Majuro‘ (Q#10). This reflects the
primary source of income on Namdrik, which is farming and fishing (Q#5) (see Figure
33%
33%
16%
15%
3%
Amount Akhamb SHS Owners Spend on their System per Year
$ 0-49
$ 50-99
$ 100-149
$ 150-199
$ 200-249
$ 250+
Figure 6.1.4.1 (Q#18):

82
6.1.5.3). Thus, crops, meat, and fish can be frozen until it is purchased locally or until
transport is available to export it to Majuro. In addition, meat, vegetables, and infant food
can be imported and stored (RMI Entrepreneur, Respondent 3, 2011). Similar uses could
apply to Akhamb Island with refrigeration, as they had similar primary income sources.
SHS owners on Akhamb were already using a variety of appliances, including a
computer, printer, and freezer, which indicate productive uses of the electricity beyond uses
for lighting (see Table 6.1.1.1). Therefore, SHSs in both communities are already
contributing towards increasing users‘ incomes and changing community livelihoods,
despite the newness of two of the three projects.
0
20
40
60
80
100
Pe
rce
nta
ge
Activities that SHS Owners use their Solar Powered Lights for by Percentage
Namdrik
Akhamb
0
20
40
60
80
100
Food storage for this house
Food storage for another house
To store something to sell
To sell something to export
Pe
rce
nta
ge
Freezer Usage on Namdrik by Percentage
Figure 6.1.5.2 (Q#10):
Figure 6.1.5.1 (Q#9):

83
6. Availability of resources and support:
Figure 6.1.6.1 illustrates end-users‘ level of confidence that someone in their
household is able to fix their SHS, and their confidence in the technical support available in
their community and capital city (Q#28-30). Eighty-two percent of SHS owners on
Akhamb felt confident that someone in their community would be able to fix their system if
they could not, which was notable as none of the local technicians on Akhamb had been
properly trained in solar PV. Yet, confidence regarding access to technical support in Port
Vila was divided, and depended on the vendor, and whether or not they felt comfortable
seeking help, as many owners felt inhibited due to the reserved nature of their culture.
Overall, on Akhamb, 87% of respondents stated that their system was maintained
‗very well,‘ and 90% stated that their lights had been working ‗very well‘: an indication
that the SHSs have been properly functioning (Q#23&24). Thus, self-organized technical
support appears to be working well for the community.
In Namdrik, there were lower levels of confidence in technical support both locally
and nationally. With their most recent SHSs, this was possibly due to: 1. the system‘s
complexity, 2. IE not stationing a technician locally, and 3. a lack of spare parts available
locally.
The end-users of the MEC-managed systems that were not working at the time of
research all cited the reason for failure to be ―the person who was supposed to repair the
0 2 4 6 8
10 12 14 16
Nu
mb
er
of
Pe
op
le
Households' Primary Source of Income
Namdrik Atoll
Akhamb Island
Figure 6.1.5.3 (Q#5):

84
system wasn‘t available,‖ suggesting limited availability of resources and support (Q#39).
In fact, 94% of respondents cited that this system was poorly maintained and 83% of
respondents stated that their lights have not worked well: an indication that the SHSs have
not been properly functioning (Q#40&41). However, it must be considered that these
systems are older, and that fee payment rates have not been satisfactory, contributing to
limited funds for technical support and components. All considered, the data indicates that
end-users considered the user-owned systems on Namdrik and Akhamb to have been better
maintained than the rented RESCO systems.
0 10 20 30 40 50 60 70 80 90
100
Akhamb own
household
Namdrik own
household
Akhamb community
Namdrik community
Vanuatu capital
RMI capital
Pe
rce
nta
ge
User's Confidence in being able to Fix or Get Help to Fix their SHS, by Location
no
a little bit
somewhat
yes
0
20
40
60
80
100
not well somewhat well
very well
Pe
rce
nta
ge
How Well Users feel their SHS has been Maintained
Namdrik- MEC system
Akhamb- user installed
Figure 6.1.6.2 (Q#23 and 40):
Figure 6.1.6.1 (Q# 28-30):

85
7. Availability of system components:
On Akhamb Island, one technician was acting as a local solar vendor, by reselling
SHSs and components that are shipped from a dealer in the capital on a credit basis. This
has greatly increased the availability of spare parts on the island, and at the same time has
resulted in a new local business (Akhamb Technician, Respondent 6, 2011).
A similar arrangement has not happened on Namdrik, and end-users are required to
acquire components, such as spare lamps, themselves, as they are not covered under system
maintenance policies. This was often problematic with the MEC-maintained systems, as
those specific lamps were not available nationally in either 2011 or in 2005 (Empower,
2005). For equipment that is covered by the projects, end-users must rely on technicians‘
visits to supply the components and repair the systems. Consequently, SHS components
appear to be more readily available on Akhamb Island as compared to Namdrik.
8. Capacity building:
On Akhamb Island, 59% of respondents had attended a training session in 2009 on
the equipment, installation, and maintenance of an 80W SHS (Q#44). In this training, a
system was assembled from scratch and the importance of maintenance and basic
troubleshooting was explained. In addition, many end-users had been given technical
0
20
40
60
80
100
not well somewhat well
very well
Pe
rce
nta
ge
How Well Users feel their Lights have Worked
Namdrik- MEC system
Akhamb- user installed
Figure 6.1.6.3 (Q#24 and 41):

86
advice from a visiting solar technician in 2010, who had installed a community solar
system.
On Namdrik Atoll, only 11% of respondents indicated that they had attended a
training session. However, 77% had participated in the installation of their new SHS
installed by IE, which was encouraged and served as training for end-users (Q#27) (See
Figure 6.1.8.1 and Photograph 6.1.8.1). This was similar to rates on Akhamb, as, in total,
84% of SHS owners had participated in their systems‘ installation.
Ninety-five percent of respondents on Akhamb and 100% on Namdrik indicated
that they would like to attend a SHS training session if one was available in their
community (Q#48). Additionally, 95% of SHS users in Akhamb and 94 % in Namdrik
indicated that it was very important for them to be able to repair and maintain their own
system (Q#50). Therefore, although some training efforts have been made, more capacity
building is desired by end-users and is required for users to feel confident repairing and
maintaining their SHSs.
0
20
40
60
80
100
no a little bit yes
Pe
rce
nta
ge
Did Someone in the Household Participate in the SHS Installation?
Namdrik- IE system
Akhamb- user installed
Figure 6.1.8.1 (Q#27):

87
9. Gender inclusiveness:
On Akhamb Island, 28 out of 40 respondents were men, as the questionnaire was
carried out by visiting each house, and therefore whoever was available would respond
(Q#1). However, if both partners were home, it was generally the man who chose to speak,
and often the woman would express that she wasn‘t very knowledgeable about SHSs.
Furthermore, the percentage of women that felt confident in being able to repair a SHS was
much lower than that of men (2 women versus 27 men) (see Figure 6.1.9.1) (Q#45&46).
On Namdrik, 17 out of 18 respondents were men, as families had time to choose a
respondent. Yet, in these responses, a higher percentage of women compared to men (6
women versus 16 men) expressed confidence in being able to repair a SHS than on
Akhamb.
Also, of the most desired appliances to be powered by a SHS, only the washing
machine, which was mentioned by 5 respondents on Namdrik, and the freezer, which was
mentioned by 8 respondents on Akhamb, would significantly lessen women‘s workload (in
addition to night-time lighting) (Q#26). Thus, currently the main desire for the power
supplied is for activities that are more often utilized by males: including a stereo, computer,
Sources: Photography by Ned Nathan (2011).
Photograph 6.1.8.1: End-users on Namdrik helping with the IE system installation.

88
satellite TV, printer, and power tools. The appliances already used with SHSs on Akhamb
have a similar focus (see Table 6.1.1.1). This differs from the IE project, which did
incorporate both male and female opinions into the goal of providing refrigeration, and has
contributed to lessening women‘s workloads (RMI Entrepreneur, Respondent 3, 2011).
Overall, these results show that women are less involved in solar electrification and
are less confident overall in handling their SHSs than men, although the IE systems were
more gender-inclusive.
10. Affordability:
The average household size of the respondents on Namdrik Atoll was 5.4 people,
whereas on Akhamb Island it was 4.7 people (Q#2). The data on Akhamb is comparable to
that for all of Vanuatu, with an average household size of 4.8 in 2009 (VNSO, 2009). On
Namdrik, the average size was shown to be 6.3 in 2005, so possibly the respondents had
smaller than average families, or family sizes have decreased (Empower, 2005). Either
way, Namdrik Atoll has significantly larger household sizes than Akhamb.
On average, 1.22 people per household were employed on Namdrik, whereas on
Akhamb 2.18 people per household were employed. On Namdrik, this is very low
compared to the average household size, indicating that only 24% of people were employed
(using Empower‘s figure of 6.3), compared to 46% on Akhamb (Q#3).
0
10
20
30
40
50
confident men confident women
Number of Men and Women in Total that feel Confident Fixing a SHS (more
than one per family)
Akhamb
Namdrik
Figure 6.1.9.1 (Q#45 and 46):

89
Empower (2005) measured the average yearly income on Namdrik Atoll to be $660
USD per capita, with a median of $478. The average income per capita in Malampa
Province, where Akhamb Island is located, was calculated to be $1180 USD per year, with
Akhamb presumably being lower than the average because of its rural location (GoV,
2006). Figures 6.1.10.1 show the average biweekly incomes of respondents‘ households,
which was approximately $110 on Namdrik, or $454 per capita per year, and
approximately $150 biweekly on Akhamb, or $831 per capita per year (Q#2&4). With
higher incomes on Akhamb, approximately one-third of households have already been able
to purchase a SHS at the retail cost without financing, with new systems being installed
monthly. Access to financing would likely increase this rate and make systems more
affordable.
However, the initial cost of a SHS may be affordable on Namdrik as well, as the
RMI receives a high amount of ODA per capita ($1,525 versus $460 in Vanuatu in 2010),
in addition to US nuclear compensation funds (OECD-DCD, 2012). Furthermore, in both
communities, income can be generated when needed; however, at the same time, cash can
be very limited and can be slow to be received (Empower, 2005; Akhamb Technician,
Respondent 6, 2011). It follows that many respondents on Akhamb commented that they
preferred to pay for their electricity all at once, through purchasing a SHS, rather than on a
weekly basis as they had done previously with kerosene.
Interestingly, almost all of the respondents felt that having a SHS was cheaper than
their previous energy source (see Figure 6.1.10.2) (Q#19). On Akhamb, community
members suggested that they used to spend $4-7 USD per week on kerosene, or
approximately $300 per year on average. Most respondents had relied primarily on
kerosene (74%) before having a SHS, with a few possessing backup generators and solar
lanterns as well (see Figures 6.1.10.3) (Q#8). While the funds previously allocated to
kerosene per year may not cover the initial cost of a SHS, it would certainly encompass the
maintenance costs of systems on Akhamb, as well as the fees to rent a system from MEC
(Q#18&35). Thus, the SHSs were affordable following either a (subsidized) RESCO
model or user-owned model, although many end-users find it preferable to pay for their
power in portions when funds are available, rather than on a continual basis.

90
Figures 6.1.10.3 (Q#8):
0
20
40
60
80
100
less same more
Pe
rce
nta
ge
Do you Spend More or Less on your SHS than on your Previous Power Source?
Namdrik
Akhamb
Figure 6.1.10.2 (Q#19):
Figures 6.1.10.1 (Q#4):
18%
26%
20%
20%
3% 13%
Average Biweekly Income per Household (USD) on
Akhamb Island
$ 0-49
$ 50-99
$ 100-149
$ 150-199
$ 200-249
$ 250+
22%
28% 28%
11%
11%
Average Biweekly Income per Household (USD) on
Namdrik Atoll $ 0-49
$ 50-99
$ 100-149
$ 150-199
$ 200-249
$ 250+
83%
6% 11%
Namdrik Household Source of Lighting before their IE -
installed SHS
SHS
battery
kerosene
generator
small solar lantern
3%
74%
13%
10%
Akhamb Household Source of Lighting before their
Most Recent SHS
SHS
battery
kerosene
generator
small solar lantern

91
11. Familiarity with the technology:
Table 6.1.11.1 shows the highest level of education found in the surveyed
household (Q#6). Education levels were much higher on Namdrik than on Akhamb on
average, which may increase the ability of end-users to handle a SHS properly, especially if
they had studied a related field.
However, Figure 6.1.6.1 indicates that Namdrik households were unconfident
overall in being able to fix their own SHS, despite being given a solar PV manual in the
local language by IE (Q#28). The number of households that indicated that they had at least
one person who felt confident fixing a SHS verified this finding: only 33% on Namdrik
compared to 62% on Akhamb (Q#45&46). Namdrik respondents‘ answers may have been
due to the complexity of their new 320W SHSs and to a lack of training and experience
maintaining a SHS, compared to Akhamb. Still, it is surprising to find low levels of
confidence among Namdrik end-users, as on average respondents had had experience since
1996 with PV and two systems, compared to Akhamb‘s experience since 2009 on average,
with a single system (Q#12&13).
Question #47 addresses where confident end-users learned their skills from (see
Figure 6.1.11.2). ‗From a friend or family member‘ was the most frequent answer,
followed by ‗from a solar training,‘ ‗helping someone install a SHS,‘ ‗watching someone
install a SHS,‘ ‗repairing my own SHS,‘ and ‗learning from other electronics‘ (in order of
frequency). It follows that many users‘ familiarity with SHS technology increases for every
one person who is taught, as it is evident that information is shared among community
members. Additionally, a community‘s familiarity is only as good as that of the person
with the highest level of knowledge, which was illustrated on Akhamb, with many owners
handling their SHSs in similar ways.

92
12. Participation and ownership:
Figure 6.1.12.1 reveals who was responsible for maintaining SHSs in the three
projects (Q#14&32). On Namdrik, MEC owned and maintained the previous systems since
2004 through a RESCO model, with end-users not being allowed to repair or alter the
systems (although alterations did happen regularly) (Q#34).
0
20
40
60
80
100
Elementary School
Middle School
Secondary College/ University
Pe
rce
nta
ge
The Highest Level of Education of Respondents by Percentage
Namdrik
Akhamb
0
2
4
6
8
10
12
Nu
mb
er
of
Re
spo
nd
en
ts
How did Respondents that felt Confident Fixing a SHS Learn?
Akhamb
Namdrik
Figure 6.1.11.2 (Q#47):
Figure 6.1.11.1 (Q#6):
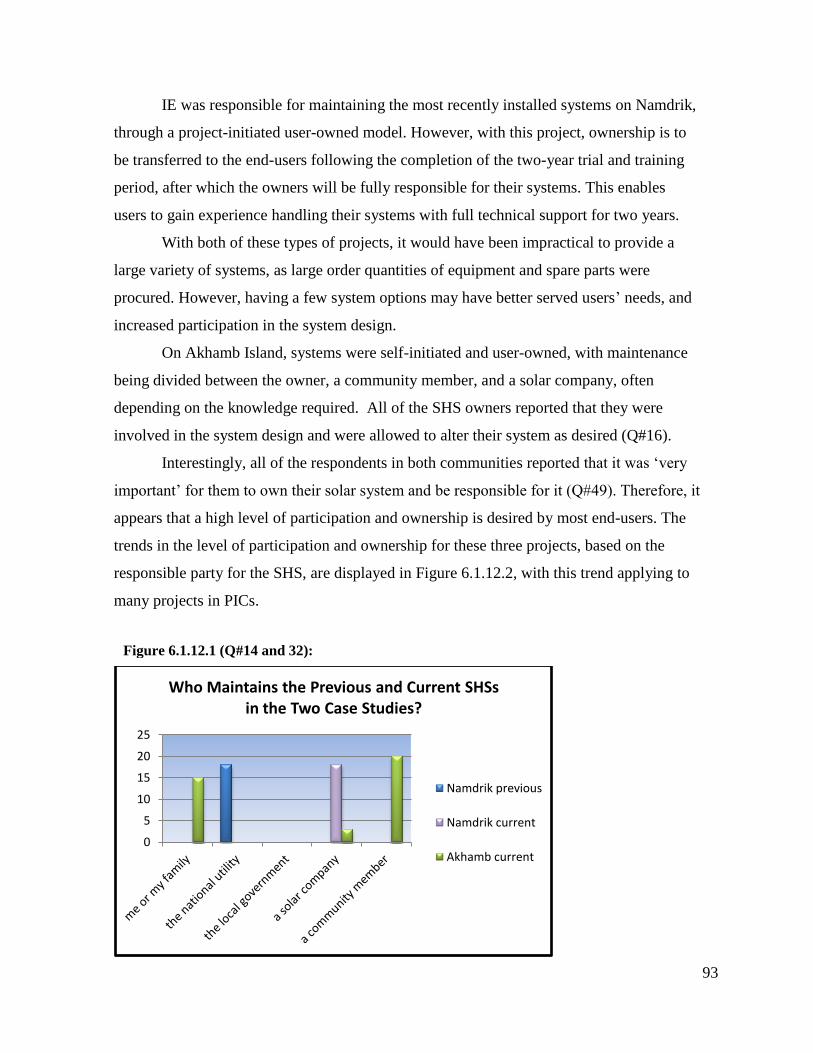
93
IE was responsible for maintaining the most recently installed systems on Namdrik,
through a project-initiated user-owned model. However, with this project, ownership is to
be transferred to the end-users following the completion of the two-year trial and training
period, after which the owners will be fully responsible for their systems. This enables
users to gain experience handling their systems with full technical support for two years.
With both of these types of projects, it would have been impractical to provide a
large variety of systems, as large order quantities of equipment and spare parts were
procured. However, having a few system options may have better served users‘ needs, and
increased participation in the system design.
On Akhamb Island, systems were self-initiated and user-owned, with maintenance
being divided between the owner, a community member, and a solar company, often
depending on the knowledge required. All of the SHS owners reported that they were
involved in the system design and were allowed to alter their system as desired (Q#16).
Interestingly, all of the respondents in both communities reported that it was ‗very
important‘ for them to own their solar system and be responsible for it (Q#49). Therefore, it
appears that a high level of participation and ownership is desired by most end-users. The
trends in the level of participation and ownership for these three projects, based on the
responsible party for the SHS, are displayed in Figure 6.1.12.2, with this trend applying to
many projects in PICs.
0
5
10
15
20
25
Who Maintains the Previous and Current SHSs in the Two Case Studies?
Namdrik previous
Namdrik current
Akhamb current
Figure 6.1.12.1 (Q#14 and 32):

94
13. Willingness to pay:
The most common reason to purchase a SHS on Akhamb was that end-users
thought SHSs would be a cheaper energy source than they had previously used, indicating
that affordability was important (see Figure 6.1.13.1) (Q#11). As most respondents
reported solar to be less expensive than their previous energy source (Q#19), it can be
assumed that many end-users were satisfied with this aspect, and therefore willing to pay
for maintenance. Question #31 confirmed this, as 97% of respondents on Akhamb reported
that they were willing to pay to repair their SHS (see Figure 6.1.13.2).
On Namdrik, the most common reason to purchase the SHS installed by IE was to
improve the user‘s income. As most end-users were benefiting from the productive uses of
their solar-powered freezer (see Figure 6.1.5.2), it can also be assumed that there was
satisfaction regarding this aspect of the IE systems. Question #31 confirms this, based on
the willingness to pay for maintenance, although less strongly than on Akhamb. This more
varied response on Namdrik was probably due to IE‘s policy to pay for maintenance for
two years, and due to respondents being accustomed to a RESCO model where they are not
responsible for maintenance costs.
the national utility a solar company a community member
the user
Par
tici
pat
ion
an
d O
wn
ers
hip
Trends in the Level of Participation and
Ownership Based on the Responsible Party for the SHS
Figure 6.1.12.2: Trends in Participation and Ownership.

95
With the MEC-managed systems, willingness to pay decreased over time, and as of
2005, 45% of end-users were disconnected due to long-term non-payment. This
dissatisfaction was mainly due to users misunderstanding about the system fees, lack of
availability of spare lamps and ballasts, and insufficient system sizes to meet energy
demands (Empower, 2005). Similar issues were still going on at the time of research, with
MEC having a limited capacity for maintenance and lack of communication with rural
islands (RMI National Government, Respondent 12, 2011).
End-users‘ overall satisfaction with solar PV, expressed in Q#52 and 53, indicates
users are very willing to pay for a SHS if it is both affordable and fits their needs. Both the
IE project and the systems installed on Akhamb appear to be fulfilling end-users‘
motivations to purchase a SHS, indicating a willingness to pay for future repairs and
systems. This was not the case with some of the MEC systems, and consequently many
end-users defaulted on payments.
0 2 4 6 8
10 12 14 16 18 20
Thought it would be a
cheaper energy source
We wanted to expand our energy uses
We wanted to use it to
improve our income
Thought it was more
convenient than other
power sources
Reasons Respondents Purchased their Most Recent SHS
Namdrik
Akhamb
Figure 6.1.13.1 (Q#11):

96
14. Effectiveness in improving the environment:
The number of SHSs and solar lanterns7 purchased by Akhamb‘s citizens were
enough to phase out the need for kerosene and most generators. Only three generators
remain to be used occasionally by SHS owners as backup power (see Figure 6.1.2.1).
Kerosene, which was a common source of lighting in 2008 on the island, was no longer
used as of January 2010, and is no longer sold in the community (Q#8). As fossil fuels,
such as kerosene, release 10-20 times more CO2e emissions than the lifecycle emissions of
solar PV8, the carbon footprint of Akhamb Island has been greatly reduced.
Syngellakis et al. (2010) relied on the conservative figure of a 100W SHS saving
475 kgCO2/year. Thus, with a total of 2.855 kW of SHSs installed on Akhamb as of
October 2011, plus a 1.62 kW community solar system, approximately 21,250 kgCO2/year
has been saved as a result of the recent surge in solar PV (see Photograph 6.1.14.1). This
does not include the additional savings from the solar lanterns.
On Namdrik, kerosene and generators were also minimally used for lighting
(Q#7&8), as they have had a history of SHS projects since 1996 (Q#13). However, most of
the initial SHSs failed, with only the modules being reused, resulting in much of the
equipment reaching its intended lifespan, thus reducing its effectiveness in mitigating
climate change (CC). Still, most of the systems installed through both projects on Namdrik
were working at the time of research.
7 These lanterns were funded through AusAid‘s Light Up Vanuatu project; see details in Appendix 9.
8 See Section 1.4 for the full explanation.
0
20
40
60
80
100
no a little bit somewhat yes
Pe
rce
nta
ge
How Willing Users were to Spend Money to Fix their Current SHS
Namdrik
Akhamb
Figure 6.1.13.2 (Q#31):
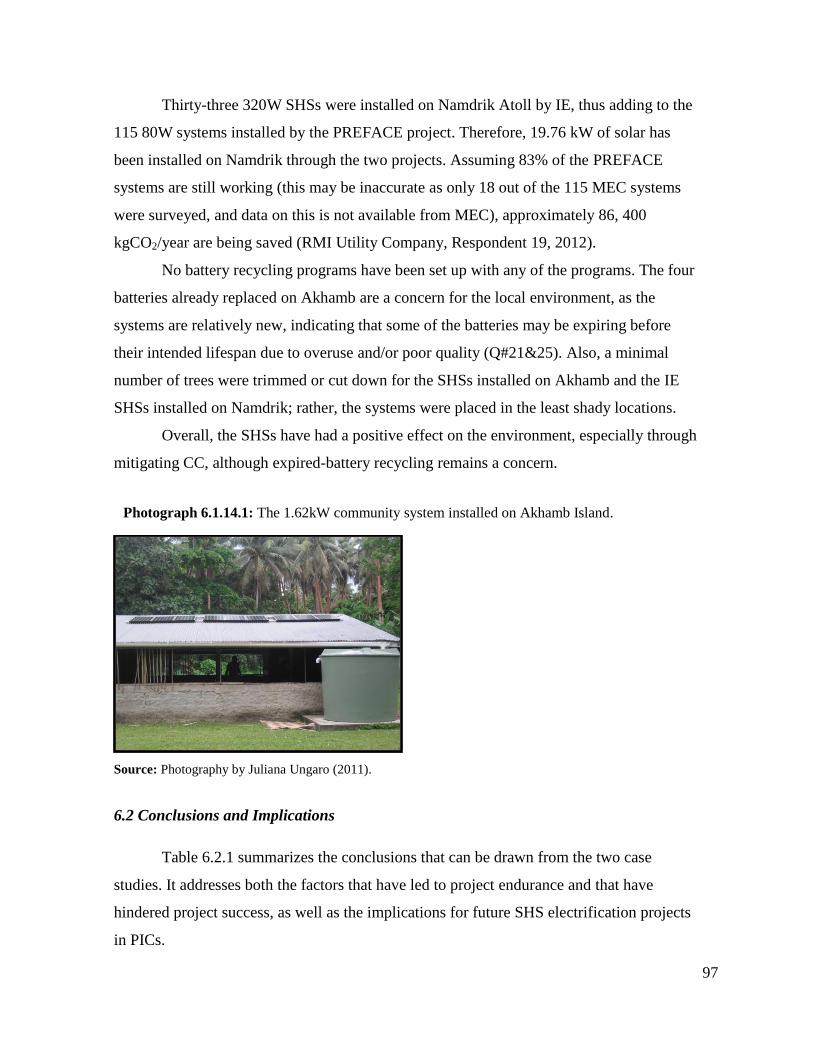
97
Thirty-three 320W SHSs were installed on Namdrik Atoll by IE, thus adding to the
115 80W systems installed by the PREFACE project. Therefore, 19.76 kW of solar has
been installed on Namdrik through the two projects. Assuming 83% of the PREFACE
systems are still working (this may be inaccurate as only 18 out of the 115 MEC systems
were surveyed, and data on this is not available from MEC), approximately 86, 400
kgCO2/year are being saved (RMI Utility Company, Respondent 19, 2012).
No battery recycling programs have been set up with any of the programs. The four
batteries already replaced on Akhamb are a concern for the local environment, as the
systems are relatively new, indicating that some of the batteries may be expiring before
their intended lifespan due to overuse and/or poor quality (Q#21&25). Also, a minimal
number of trees were trimmed or cut down for the SHSs installed on Akhamb and the IE
SHSs installed on Namdrik; rather, the systems were placed in the least shady locations.
Overall, the SHSs have had a positive effect on the environment, especially through
mitigating CC, although expired-battery recycling remains a concern.
Source: Photography by Juliana Ungaro (2011).
6.2 Conclusions and Implications
Table 6.2.1 summarizes the conclusions that can be drawn from the two case
studies. It addresses both the factors that have led to project endurance and that have
hindered project success, as well as the implications for future SHS electrification projects
in PICs.
Photograph 6.1.14.1: The 1.62kW community system installed on Akhamb Island.

98
Indicator Conclusions and Implications
1. Appropriate
equipment use
There is a need for certification and standards for equipment and vendors in order to encourage more appropriate
equipment use in self-initiated projects.
Subsidies may be a solution to promote the use of deep-cycle batteries, with education provided to users on the benefits. Overuse still affects even high quality parts, and therefore is more likely to contribute to project failure.
Overuse continues to be a problem in all electrification models, although user-owned models contain a financial incentive
against it.
2. Effectiveness in
meeting users’
needs
SHSs are a satisfactory and trusted technology to meet end-users‘ needs. Users prefer to be able to design and alter their system; RESCOs do not meet this desire.
Lighting, television, and refrigeration were the most desired services in the case studies.
SHS sizing needs to incorporate users‘ electricity demands, as otherwise users will alter their systems.
Having only one size of a SHS is inappropriate for general electrification and can hinder project success.
Users‘ preferences should be incorporated initially, as lack of participation can lead to miscommunication and systems
and payment methods not matching users‘ needs.
3. Ability to satisfy
expanding energy
demands
Neither the RESCO nor project-initiated systems allowed for system expansion.
The self-initiated systems took changing demands into account in two different ways.
Users‘ electricity demands can increase quickly and hinder success if not allowed for in system design.
4. Cost-
effectiveness
As self-initiated systems allow end-users to purchase parts directly from a variety of solar vendors, they have the potential
to be the most cost-effective.
Subsidies result in economic biases towards project-initiated systems and RESCOs.
Including subsidies, all three projects were cost-effective in their own right if managed correctly.
SHSs have the potential to be similar in cost to grid electricity prices, yet they must provide a variety of services to be
comparable.
SHSs that just provide lighting are expensive options for this service.
5. Effectiveness in
changing
community
livelihoods
SHS lights are effective in allowing for productive uses, especially for handicrafts.
Refrigeration is effective in changing community livelihoods, as users can store, sell, import, and export food.
Self-initiated systems can be specialized to provide services based on users‘ occupations and interests, and thus contribute
to productive uses.
Productive uses can help users to pay for future repair costs.
6. Availability of
resources and
support
Most RESCO and users-owned systems were working properly, indicating adequate technical support.
Self-organized technical support was considered to be more effective than the RESCO‘s support. Users prefer to be able to repair and maintain their own SHSs.
Table 6.2.1: Conclusions and implications of the quantitative data analysis.

99
Users are capable of installing and maintaining systems, with the aid of local technicians.
Many SHS owners were inhibited to approach solar companies, indicating a need for stronger relations.
A lack of resources and support can quickly lead to system failure.
7. Availability of
system components
The self-initiated systems had the best availability of SHS components.
A lack of system components available nationally hindered the RESCO project‘s success.
The supply of components locally provides a local business opportunity.
8. Capacity
building
More capacity building is desired by end-users, and is necessary to increase end-users‘ maintenance capabilities.
Capacity building increases users‘ confidence in repairing their systems.
Training was effective with the self-initiated systems as it increased users‘ confidence levels.
9. Gender
inclusiveness
Women are generally less confident than men in handling their SHSs.
Electrical lighting can increase women‘s incomes, through making handicrafts at night.
Refrigeration serves the needs of both men and women, while reducing women‘s workloads.
Project-initiated systems may better serve women as they can focus on women‘s needs.
10. Affordability SHSs were affordable following either a (subsidized) RESCO model or a user-owned model.
Low-income households may be overlooked by user-owned projects without financing.
End-users found it more affordable to pay for their power in portions when funds are available, rather than on a regular,
continual basis.
The maintenance costs of SHSs are less expensive than the cost of kerosene per year in Vanuatu.
11. Familiarity with
the technology
Information is shared among community members and therefore the community‘s familiarity with SHSs increases for
every one person that is taught.
With SHSs that have limited external support, a community‘s familiarity cannot exceed that of the person with the highest
knowledge level.
End-users are able to quickly become familiar with the basics of maintaining a SHS.
User familiarity with SHSs can affect the longevity of all project types.
12. Participation
and ownership
A high level of participation and ownership is desired by most users.
Self-initiated systems have the highest level of participation and ownership.
13. Willingness to
pay
Users are very willing to pay for a SHS if it is affordable and fits their needs, yet this willingness quickly decreases with
dissatisfaction.
The user-owned projects resulted in a higher willingness to pay due to higher levels of user satisfaction.
14. Effectiveness in
improving the
environment
Overall, SHSs have helped to mitigate CC, through decreasing dependence on kerosene and generators.
Expired-battery recycling remains a concern, especially for poor quality batteries and overused systems.

100
7.1 Results of the Qualitative Interviews by Indicator
The following results are based on replies from 15 interviews with key respondents,
including five government workers, six solar PV entrepreneurs, two NGOs, one donor
agency, and one community solar technician (see Chapter 4 for details).
1. Appropriate equipment use:
Many interviewees, especially government representatives, mentioned that they
trust solar PV technology, view it as a better power source than fossil fuel, and believe it is
clean, cost-effective, and user-friendly (RMI Government, Respondents 10 and 11, 2011).
Furthermore, they believe solar is the future for remote, isolated islands due to the high
price of fossil fuels (RMI Government, Respondents 11 and 13, 2011; RMI National
Government, Respondent 12, 2011).
Regarding appropriate equipment use, one interviewee mentioned that improved
battery technology is needed in order to increase SHSs‘ lifespan, and another mentioned
that DC appliances, now available in PICs, make the need for inverters unnecessary and
decrease power requirements (Vanuatu Entrepreneur, Respondent 5, 2011; Vanuatu NGO,
Respondent 14, 2011). A third mentioned the need to use dry-cell batteries only, in order to
limit the need for maintenance (Vanuatu Entrepreneur, Respondent 15, 2011). Another
viewpoint expressed by a government representative was that local materials should be
used in system design, such as for solar module mounting, in order to increase ease of
maintenance (RMI Government, Respondent 11, 2011).
Yet, concern with appropriate equipment use was expressed, in that some solar
enterprises were selling poor quality equipment (VEU, Respondent 1, 2011). For example,
one vendor in Vanuatu was struggling to sell quality solar modules, when he realized that
many customers were unconcerned about quality; he now provides both high and low
Chapter 7:
The Qualitative Data Results and Analysis

101
quality parts. He reports that his customers ―are glad because the systems are cheap,‖ and
that most have worked well (Vanuatu Entrepreneur, Respondent 15, 2011). Another sells
average quality solar modules in order to keep the price down, as the owner thinks it is
unlikely for SHSs to last more than 10 years in the islands, when the efficiency of such
modules decreases (Vanuatu Entrepreneur, Respondent 8, 2011). Also, inefficient
appliances, such as AC lights and AC refrigerators, or providing hybrid systems with fossil
fuel-powered generators to decrease the initial cost, are a concern (VEU, Respondent 1,
2011).
One vendor carries out a power assessment for every site and installs the SHSs
himself, as he claims that one of the main issues leading to SHS failure is poor design
(Vanuatu Entrepreneur, Respondent 5, 2011). He suggests all vendors in RE should be
certified in the field, possibly with SEIAPI providing training and certifying businesses
according to their guidelines (see Chapter 3). Governments and donors could then promote
these vendors, and encourage others to become certified (Vanuatu Entrepreneur,
Respondent 5, 2011).
Another issue is that end-users do not properly connect their systems or use parts
that are compatible (see photograph 7.1.1.1). An example described by a technician on
Akhamb was that ―one man bought solar equipment and a freezer, but did not ask [a
technician] for advice, and he connected all different-sized panels and batteries, and ended
up breaking the freezer and inverter‖ (Akhamb Technician, Respondent 6, 2011).
In conclusion, there is a need for standards to ensure that acceptable quality
equipment is used, with systems being designed by vendors and technicians, rather than
being pieced together. End-user training is needed to encourage proper equipment usage
and connections.

102
2. Effectiveness in meeting users‟ needs:
There were many issues that the respondents cited as reasons why purchased SHSs
do not meet users‘ needs, including end-users:
Adding wires and appliances/ overusing the system
Not cutting back trees, or placing in a shady spot
Solar modules facing the wrong direction or being angled incorrectly
Rusted connections and modules not being cleaned
Not adding water to wet-cell batteries
Not asking for advice, just replacing parts
Not letting batteries recharge when low
(Vanuatu Entrepreneurs, Respondents 15 and 16, 2011).
All of these issues can be addressed through educating end-users; however, overuse
requires behavioral changes as well, which are slow to achieve.
3. Ability to satisfy expanding energy demands:
One company advised its customers not to purchase large SHSs initially, but rather
to buy SHSs for lighting first and then upgrade (Vanuatu Entrepreneur, Respondent 15,
Source: Photography by Juliana Ungaro (2011).
Photograph 7.1.1.1: An indoor light being placed outdoors with an undersized indoor
wire powering it.

103
2011). His systems are set up so that the consumer can add panels over time. Two other
solar companies also mentioned that their systems are able to be upgraded, either by adding
parts or exchanging old systems for new ones (Vanuatu Entrepreneurs, Respondents 8 and
17, 2011). However, this was not a main concern of interviewees, as they were more
concerned with ensuring lasting results of the initial SHSs.
4. Cost-effectiveness:
Many solar dealers are providing prewired or plug-and-play SHSs, or providing
wiring diagrams for users, which allow end-users to be trained to install their own systems
(RMI Entrepreneur, Respondent 3, 2011; Vanuatu Entrepreneurs, Respondents 8 and 15,
2011; Vanuatu NGO, Respondent 14, 2011). Furthermore, when equipment fails with pre-
wired systems, the power board (containing the controller, inverter, breakers, and
switches), can be shipped to Port Vila for repair (see Photograph 7.1.4.1). This creates
value for money in that technicians do not need to travel to remote islands very often
(Vanuatu Entrepreneur, Respondent 8, 2011).
Another three dealers were travelling to the site and were installing the SHSs
themselves (Vanuatu Entrepreneurs, Respondents 5 and 17, 2011; RMI Entrepreneur,
Respondent 3, 2011). One company gave their customers an option: if the customer wants a
two-year warrantee, they must pay for a technician to travel and install it (Vanuatu
Entrepreneur, Respondent 17, 2011).
One NGO allowed rural businesses and organizations to purchase small SHSs at the
wholesale price when purchasing only 12 units, and provided them with extra components.
This allowed reselling in rural communities, which prevents the need for end-users to travel
to purchase equipment (Vanuatu NGO, Respondent 18, 2011). This model makes systems
more cost-effective for end-users.
In summary, systems that decrease the need to travel are the most cost-effective,
either by teaching users to install their own systems, or by selling systems in remote
communities.

104
5. Effectiveness in changing community livelihoods:
Two respondents commented on the positive lifestyle changes that come with
SHSs, with one explaining that ―before solar this was a dark country with no light at night‖
(Vanuatu Entrepreneur, Respondent 15, 2011). Another added that ―solar is good because
it provides light inside a home that was very dark before. It is easy because when you
come home late at night, you can just flip the switch and at the same time be able to see
clearly‖ (Akhamb Technician, Respondent 6, 2011).
Furthermore, solar ―makes life easy… as you can have access to power for mobile
phones, music, movies, freezers, computers, and you can earn money [through these
appliances]‖ (Akhamb Technician, Respondent 6, 2011). A third interviewee explained
solar PV as ―the gateway‖ for education, health, comfort, and well-being (RMI
Government, Respondent 13, 2011). He further explained that solar can power new
technologies, such as internet for information and communication, GPS for safety for
mariners, and refrigerators for medicines, which are ―important [for the RMI] to keep up
with the world.‖ In addition, it was mentioned that refrigeration allows for food
preservation, importing and exporting food, food storage during storms, storing food for
infants, and selling frozen products locally (RMI Entrepreneur, Respondent 3, 2011).
Source: SolarRay (2012).
Photograph 7.1.4.1: An example of a solar power board.
105
Overall, changing community livelihoods was mentioned by four interviewees, with
more of a focus on lifestyle changes than on improving income levels.
6. Availability of resources and support:
Proper maintenance for SHSs was stated as essential, especially with the harsh
environmental conditions found in PICs (RMI Government, Respondent 11, 2011; RMI
National Government, Respondent 12, 2011). Some respondents cited older projects where
the absence of a maintenance plan led to the systems no longer working (RMI Government,
Respondent 10, 2011; Vanuatu NGO, Respondent 14, 2011). Other opinions on how to
ensure that maintenance is satisfactory included having trained personnel in the field,
proficient leadership, and a ―holistic approach‖ through a ―partnership between the grantee,
grantor, and the community‖ (RMI Entrepreneur, Respondent 3, 2011; RMI National
Government, Respondent 12, 2011; RMI Government, Respondent 13, 2011).
Technical support was provided in a number of ways by SHS vendors, including
having a call centre where technicians are available, vendors calling to check on the status
of systems, having users send in their broken parts, and sending a technician to fix the
systems (Vanuatu Entrepreneurs, Respondents 5, 8, 15 and 16, 2011). Many did all four,
depending on the system and the problem. In addition, many were providing system
warrantees for 1-2 years (Vanuatu Entrepreneurs, Respondents 8, 16, and 17, 2011;
Vanuatu NGO, Respondent 18, 2011).
One company in Vanuatu was using GPS to monitor if its purchased systems were
working or not9. In addition, each system had a memory to record how well the system had
been working, and automatically shut the system down with misuse, while at the same time
invalidating the warrantee (Vanuatu Entrepreneur, Respondent 17, 2011). The issue with
this model is that the SHSs are locked so that the end-user can‘t access the equipment, and
therefore a technician needs to travel to repair the system, making maintenance costly.
In summary, all SHS vendors were providing technical support of their own accord,
most in more ways than one, as they have an interest in systems working effectively and
providing enduring outcomes.
9 This is a technology similar to SIMba Link, which is described in Chapter 3.

106
7. Availability of system components:
Three respondents brought up the issue of spare parts‘ availability. The solar
technician on Akhamb stated that he stocks all of the needed spare parts locally, and has a
battery tester and a generator where he can charge batteries when needed (Akhamb
Technician, Respondent 6, 2011). In addition, one NGO was already providing spare parts
to local businesses and organizations, while another interviewee mentioned the need for
strong supply lines and locally available spare parts (Vanuatu NGO, Respondent 18, 2011;
RMI Government, Respondent 10, 2011). In conclusion, although access to spare parts
locally was considered important, it was not seen as essential.
8. Capacity building:
Capacity building for end-users was seen as important by all respondents, as
―people don‘t have many opportunities to learn about solar in remote communities and they
want to learn more‖ (RMI Government, Respondent 13, 2011). It was suggested that ―101
solar training sessions‖ that are ―more than just a few hours‖ are needed to make sure that
the whole community is on the same level (RMI Government, Respondents 11 and 13,
2011).
Many interviewees suggested that users are capable of understanding the basics of
their system, such as how a SHS works and the limits of the system (Akhamb Technician,
Respondent 6, 2011; Vanuatu Entrepreneur, Respondent 16, 2011; RMI Entrepreneur,
Respondent 3, 2011). One respondent suggested building community capacity through
focusing on the long-term, building on existing skills, providing continuous training and
support, and looking at problems on a case-by-case basis (Vanuatu NGO, Respondent 18,
2011). Another remarked that ―technology in the RMI is developing too fast, and people
aren‘t well trained and educated yet,‖ and, therefore, there needs to be more of a focus on
training (RMI Government, Respondent 11, 2011). He suggested that local governments
should be responsible for coordinating training for their communities, and a training
program should be included in the installation package with SHS projects (RMI
Government, Respondent 11, 2011).

107
Another viewpoint was that although there is a need for training, ―no-one is willing
to fund it‖ (Vanuatu NGO, Respondent 14, 2011). Lack of training has led to many issues,
such as with the VEU systems described in Chapter 1, where end-users who did end up
owning their SHSs did not know how to repair or maintain them (VEU, Respondent 1,
2011). The solar technician interviewed cited a lack of training as a central issue leading to
system failure, in that users don‘t understand their systems (Akhamb Technician,
Respondent 6, 2011).
All of the solar enterprises and NGOs, as well as the rural solar technician
interviewed (nine in all), provide some form of basic training upon purchase. One was
holding a training session for every group of 100 customers (Vanuatu Entrepreneur,
Respondent 15, 2011). Other solar training efforts included: setting up a basic training
course for technicians, writing a set of articles for the newspaper, having a set of radio
broadcasts about solar, and having a microfinance workshop for distributors (Vanuatu
Entrepreneurs, Respondents 5 and 8, 2011; Vanuatu NGO, Respondent 18, 2011).
However, this was not enough to reach the majority of the population, and it was suggested
that RE should be introduced to students in schools (Vanuatu Entrepreneur, Respondent 5,
2011).
A third NGO in Vanuatu, which was not interviewed as it was not involved in
energy issues at the time of research, stated that they would be glad to assist in raising
public awareness on RE (Matakiviti, 2006). This group has been successful in raising
awareness on other environmental issues, through creating a traveling theater production
and through educational films.
In conclusion, training was seen as very important for SHS longevity, with many
grass-root initiatives already taking place, yet with a need for more funding in order to
reach a large percentage of the population. On the end-users side, it was suggested that
users who own their SHS care more about training because they have put a significant part
of their savings into solar (Vanuatu Entrepreneur, Respondent 15, 2011).

108
9. Gender inclusiveness:
Gender inclusiveness was only mentioned by two solar vendors. They suggested
that women generally care more about their SHSs than men, as they spend more time in the
house, and more than half of their customers were women (Vanuatu NGO, Respondent 14,
2011; RMI Entrepreneur, Respondent 3, 2011). However, in general, gender was
overlooked as something that needed to be considered in electrification. Interestingly, 14
out of the 15 interviewees were men, indicating that mostly males hold key positions in the
solar projects and organizations.
10. Affordability:
Many interviewees mentioned the need to decrease the upfront cost of SHSs to
make them affordable. Two suggested that financing was key, and one respondent thought
end-users should ―slowly buy into their system, maybe with a bag of copra (coconut) per
month,‖ and at the same time gain experience in handling their system (RMI Government,
Respondent 11, 2011). One solar dealer in Port Vila had implemented a similar project in a
nearby village, where end-users chose which SHS package they preferred, and the systems
were installed after 50% of the cost was paid, after which users completed the remainder in
installments (Vanuatu Entrepreneur, Respondent 16, 2011). However, he indicated that
this model would be hard to implement in remote islands.
Other respondents stated that the cost of replacing batteries was unaffordable to
end-users, and this caused many systems to fail (Vanuatu Entrepreneur, Respondent 5,
2011). One government representative cited this as a reason why users should rent rather
than own their system (RMI National Government, Respondent 12, 2011). However, a
solar technician on Akhamb claimed that SHSs were affordable, as you do not need to ―pay
for your solar regularly, only every once in awhile, and it is cheaper than generators and
kerosene‖ (Akhamb Technician, Respondent 6, 2011).
Other suggestions of increasing affordability included setting up charging stations
in rural communities, so that locals can have access to power without purchasing a full
SHS (Vanuatu NGO, Respondent 18, 2011). Local organizations could earn money

109
through charging batteries and be responsible for O&M. In addition, providing subsidies to
decrease the cost of equipment was suggested as a way to increase the affordability
(AusAid, Respondent 7, 2011). However, another respondent disagreed, stating she felt
―subsidies provide a false temporary reality,‖ as rural customers will not understand why
equipment prices fall and rise again. Rather, ―it‘s more important to help rural customers
gain access to funds through microenterprise and microfinance‖ (Vanuatu NGO,
Respondent 18, 2011).
Financing, subsidies, and battery-charging stations were all suggested as options for
increasing affordability for end-users, with affordability being a concern to NGOs, dealers,
and government representatives.
11. Familiarity with the technology:
One respondent described how the first solar project on their atoll resulted in locals
feeling comfortable in handling solar systems as a result of experience (RMI Government,
Respondent 13, 2011). He added that ―people [in the RMI] now understand how solar
works.‖ Two solar organizations in Vanuatu and a technician on Akhamb also stated that
many people already have a basic knowledge of their system, and that end-user knowledge
is increasing (Akhamb Technician, Respondent 6, 2011; Vanuatu NGO, Respondent 14,
2011; Vanuatu Entrepreneur, Respondent 15, 2011). Yet, for those that have not reached
that point, there is a need for more training, as ―it works well for everyone to understand
the basics, with technicians understanding more in-depth‖ and be able to assist when
needed (Akhamb Technician, Respondent 6, 2011). In addition, solar technology is
changing, in that it requires less user knowledge and is less expensive (Vanuatu NGO,
Respondent 14, 2011). Thus, it was agreed that familiarity with SHSs is increasing in the
two nations, with end-users in the RMI having reached a higher level of understanding due
to their more extensive history with solar PV.

110
12. Participation and ownership:
Many statements were made to the effect that ―people should own their own
system‖ and have an ―economic stake‖ in it, as ―if people just rent their system they don‘t
have any pride in it‖ (RMI Government, Respondents 10 and 13, 2011; Vanuatu
Entrepreneur, Respondent 8, 2011; Vanuatu NGO, Respondent 14, 2011). One interviewee
continued that this has been shown throughout history, with the private ownership of land
and also with the economic history of socialism, in that shared and free property do not last
because people don‘t respect them (Vanuatu Entrepreneur, Respondent 8, 2011). It was
proposed that private ownership results in SHSs being better managed and more respected,
while one interviewee commented that ―local people should be involved in projects from
start to finish‖ (RMI Government, Respondents 11 and 13, 2011).
Another interviewee felt that private ownership was simpler, as a ―RESCO model
creates headaches collecting fees and going out to rural villages; rather, [self-initiated]
SHSs are best for villages‖ (Vanuatu Entrepreneur, Respondent 8, 2011). In contrast, one
respondent from the RMI suggested that MEC is easiest to work with to manage SHSs, as it
is 100% government-owned (RMI National Government, Respondent 12, 2011).
Additionally, three respondents mentioned that community systems are not an enduring
model, as they are overused and disrespected (RMI Government, Respondent 13, 2011).
Overall, a user-owned model was preferred by interviewees in order to increase end-users‘
respect for their SHSs.
13. Willingness to pay:
It appeared that most interviewees assumed end-users would be willing to purchase
a SHS if it was affordable, as they trusted the technology to provide end-user satisfaction if
used correctly. Thus, willingness to pay was only mentioned once, in that recently
Marshallese have begun to purchase expensive cars and mobile phones, which indicates
that locals now have more cash available, and may be more able to pay for solar PV (RMI
Entrepreneur, Respondent 3, 2011). However, this is not currently the case in Vanuatu.

111
14. Effectiveness in improving the environment:
Climate Change (CC) was only mentioned once by a RMI government
representative who saw it as a huge issue, with RE being a way to ―shout out to the world‖
that PICs are in danger from sea-level rise, and that they care about CC and are trying to
improve the situation (RMI Government, Respondent 11, 2011).
Furthermore, battery collection was mentioned twice, by one interviewee who said
it is needed but costly (Vanuatu Entrepreneur, Respondent 5, 2011), and by a NGO
representative who is setting up battery recycling for solar lanterns and small SHSs
(Vanuatu NGO, Respondent 18, 2011). Overall, environmental consequences of SHSs
were not interviewees‘ main concern.
7.2 Interviewees’ Beliefs on Electrification Strategies and Essential Factors
Figure 7.2.1 shows interviewees‘ responses to Question 12 regarding their opinions
on the most effective electrification strategies. One entrepreneur did not respond clearly,
and therefore was excluded. Table 7.2.1 lists the most essential factors for project
permanence according to interviewees‘ responses to Question 13. Interestingly, training
users well was the most common answer, followed by appropriate equipment used for
island environments, funding available for maintenance, and a capacity for maintenance.
0
1
2
3
4
5
6
RESCO User owned
Nu
me
r o
f R
esp
on
de
nts
The Electrification Strategy favoured by Interviewees
Government
Private entrepreneur
NGO
Technician
Donor
Figure 7.2.1: Interviewees‘ responses to Interview Question 12.

112
Indicator Most Important Factors Stated by
Interviewees
Donor Govern-
ment:
Local &
National
Private
Company
NGO Technician Total
1. Appropriate equipment
use
Correct and quality equipment used
for island environments
1 1 2 1 5
Accredited installers and designers 1 1 2
Solar module placed in a safe and
sunny area
1 1
2. Effectiveness in meeting
users’ needs
Solar must meet the demand of the
users/ a power assessment must be
done
1 1 2
3. Ability to satisfy
expanding energy demands
None 0
4. Cost-effectiveness None 0
5. Effectiveness in changing
community livelihoods
None 0
6. Availability of resources
and support
Capacity for maintenance: better if
handled locally as much as possible,
technical support must be available
1 3 4
Having the right leaders, who have
experience and people look up to
1 1
Table 7.2.1: Interviewees‘ responses to Interview Question 13. The top four responses are in italics.

113
Having communication between
users and suppliers; technical advice
must be available
1 1 2
7. Availability of system
components
Reliable sources of spare parts 1 1 2
8. Capacity building Must train end-users well (hands-on
and in the local language), so that they
have a good understanding of solar
1 4 2 1 1 9
People aware of limitations of solar --
of the power produced and how to
conserve
1 1 2
9. Gender inclusiveness Training both women and men 1 1
10. Affordability Funding available for maintenance/
proper payment model
4 4
Help rural customers gain access to
funds through capacity building
1 1 2
Increase affordability through
subsidies
1 1
11. Familiarity with the
technology
None 0
12. Participation and
ownership
Give ownership to locals 1 1
Share risk with local companies 1 1
13. Willingness to pay None 0
14. Effectiveness in
improving the environment
None 0

114
7.3 Implications of the Qualitative Data Analysis
Table 7.3.1 explains the interviewees‘ conclusive recommendations that can be
applied to future PV project development and electrification.
Indicator Interviewees’ recommendations
1. Appropriate equipment
use
Certifications and standards are needed to ensure
acceptable quality equipment is used.
Systems should be designed by vendors and technicians.
User training is needed to encourage proper equipment
usage.
2. Effectiveness in meeting
users’ needs
Training for end-users is needed for systems to meet users‘
needs.
Overuse requires a behavioral change, and may be slow to
improve.
3. Ability to satisfy
expanding energy
demands
Some solar vendors did take expanding energy demands
into account.
This was not a main concern of interviewees.
4. Cost-effectiveness The most cost-effective systems decrease the need to travel,
by teaching end-users to install their own systems or by
selling systems in remote communities.
For larger systems a technician is often needed for
installation.
Allowing wholesale prices for rural organizations makes
systems more cost-effective, as retail prices can be similar
to urban areas.
5. Effectiveness in changing
community livelihoods
Interviewees focused mostly on changes that do not affect
income levels.
A focus on refrigeration was the exception.
6. Availability of resources
and support
All SHS vendors were providing technical support of their
own accord.
Vendors have an interest in systems working effectively
and enduring, which motivates them to provide support.
7. Availability of system
components
Although access to spare parts locally was considered
important, it was not seen as essential.
8. Capacity building Training was seen as a major need, with many grass-root
initiatives already taking place.
More funding is needed in order for training to reach a
large percentage of the rural population.
Table 7.3.1: Implications of the Qualitative Data Analysis.

115
End-users who own their systems appear to care more
about training, as they have allocated their savings to solar.
9. Gender inclusiveness Interviewees suggested women generally care more about
their SHSs than men.
More than half of vendors‘ customers were women.
Gender was generally overlooked as something that needed
to be considered in electrification.
Most energy stakeholders are male.
10. Affordability Affordability was a concern of most respondents.
Financing, subsidies, and battery-charging stations were
suggested as options for increasing affordability.
11. Familiarity with the
technology
Familiarity with SHSs was viewed as increasing in the two
nations.
End-users in the RMI have reached a higher level of
understanding than in Vanuatu.
12. Participation and
ownership
A user-owned model was preferred by most interviewees,
because it increases end-users‘ respect for their SHSs
through incentives.
13. Willingness to pay Interviewees trusted PV technology to provide user
satisfaction if properly handled.
Willingness to pay was not of major concern.
14. Effectiveness in improving
the environment
Environmental consequences were not interviewees‘ main
concern.

116
This thesis has examined the essential factors for effective rural electrification in
the Marshall Islands, Vanuatu, and other PICs. In this chapter, the aim of this research is
addressed, by providing overarching recommendations on appropriate electrification
strategies, risk mitigation approaches, and criteria for success in order to increase SHS
longevity in PICs. These recommendations have been determined based on the results of
the research questions, which were previously addressed. In addition, a discussion of how
these research findings fit into the larger development context and the limitations of the
research are presented.
8.1 Recommendations on Electrification Strategies
A summary of the positive and negative aspects of two electrification models: self-
initiated SHSs and RESCOs, based on the literature, project documents, case studies, and
interviews, are described in Table 8.1.1. The project-initiated user-owned model has been
omitted, as it covers a wide range of projects, such as Vanuatu‘s VERD project, where aid
and support were channelled to local organizations to provide financing for SHSs under
30W. Island Eco‘s project varied in that aid was given directly to the organization, to
implement systems that were 75% subsidized, all one size, and for a specific purpose.
Although project-initiated user-owned strategies vary in the model used, they fall in-
between self-initiated SHSs and RESCO projects on the participatory development
spectrum, and contain aspects of both projects.
The overall strengths of the RESCO electrification model, as described in Table 8.1.1 are:
Higher quality equipment is used.
Costs are spread out over-time.
Equipment is subsidized, tax-free, and purchased in large quantities, making
equipment more cost-effective.
Systems are checked regularly and maintained by a technician.
Chapter 8:
Recommendations and Discussion
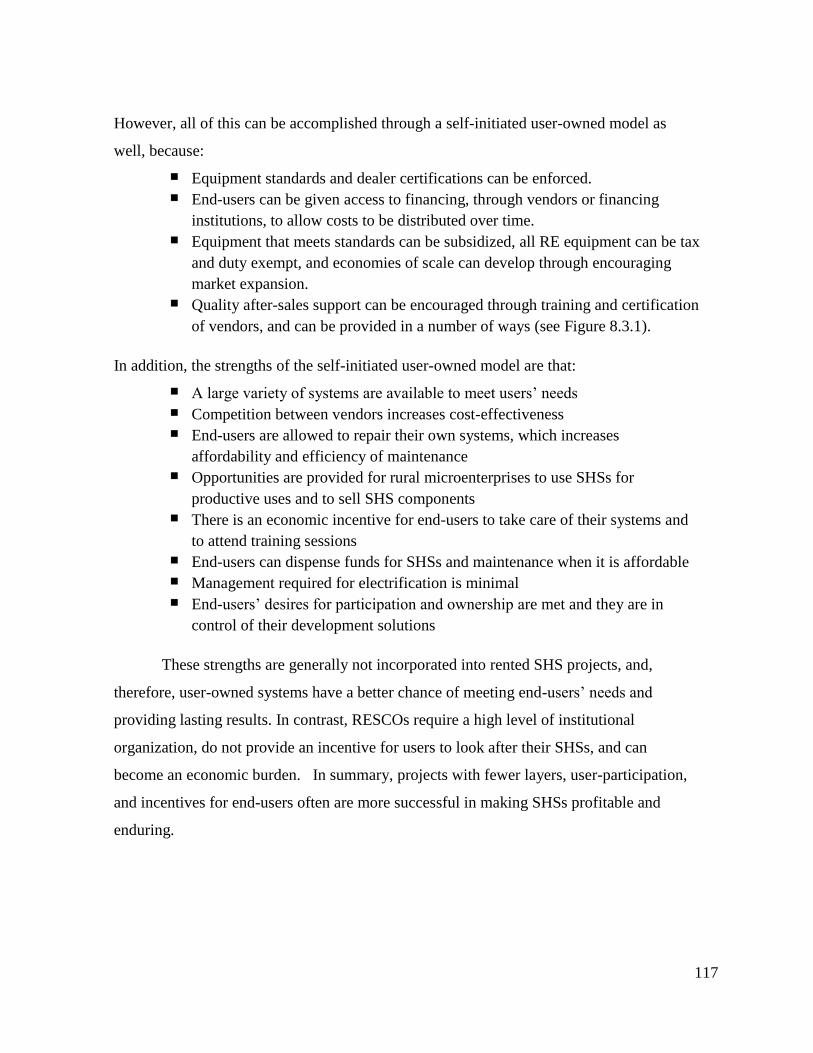
117
However, all of this can be accomplished through a self-initiated user-owned model as
well, because:
Equipment standards and dealer certifications can be enforced.
End-users can be given access to financing, through vendors or financing
institutions, to allow costs to be distributed over time.
Equipment that meets standards can be subsidized, all RE equipment can be tax
and duty exempt, and economies of scale can develop through encouraging
market expansion.
Quality after-sales support can be encouraged through training and certification
of vendors, and can be provided in a number of ways (see Figure 8.3.1).
In addition, the strengths of the self-initiated user-owned model are that:
A large variety of systems are available to meet users‘ needs
Competition between vendors increases cost-effectiveness
End-users are allowed to repair their own systems, which increases
affordability and efficiency of maintenance
Opportunities are provided for rural microenterprises to use SHSs for
productive uses and to sell SHS components
There is an economic incentive for end-users to take care of their systems and
to attend training sessions
End-users can dispense funds for SHSs and maintenance when it is affordable
Management required for electrification is minimal
End-users‘ desires for participation and ownership are met and they are in
control of their development solutions
These strengths are generally not incorporated into rented SHS projects, and,
therefore, user-owned systems have a better chance of meeting end-users‘ needs and
providing lasting results. In contrast, RESCOs require a high level of institutional
organization, do not provide an incentive for users to look after their SHSs, and can
become an economic burden. In summary, projects with fewer layers, user-participation,
and incentives for end-users often are more successful in making SHSs profitable and
enduring.
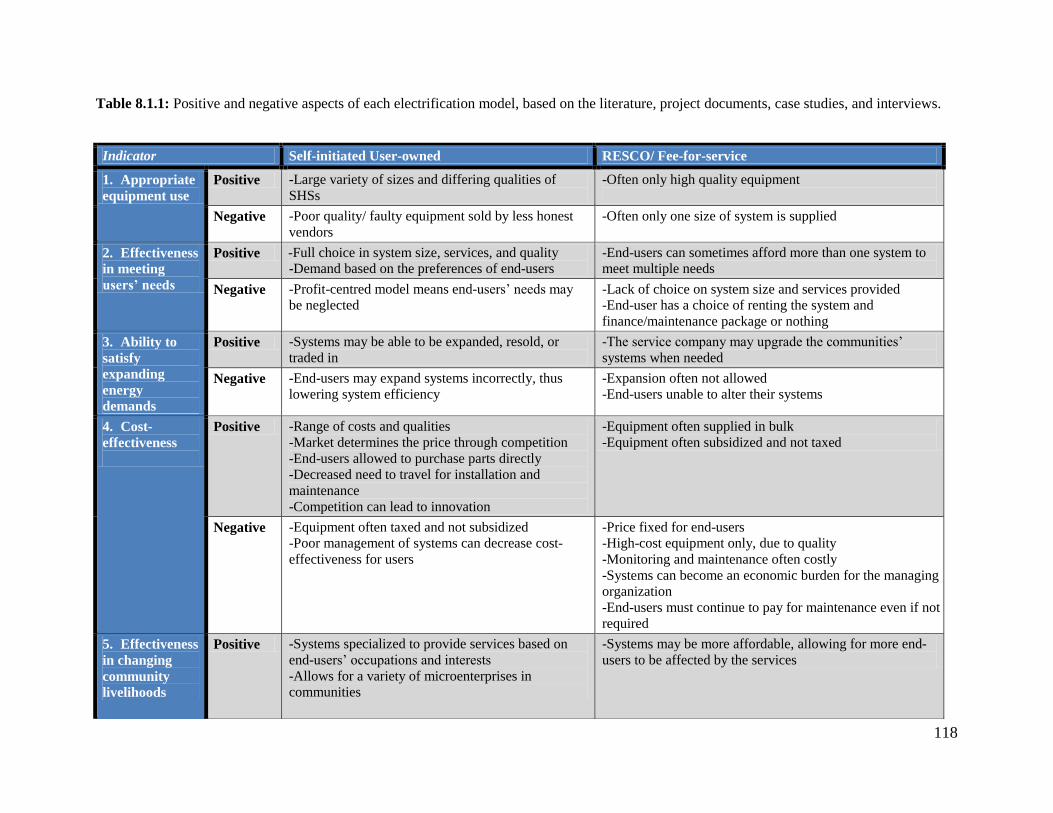
118
Table 8.1.1: Positive and negative aspects of each electrification model, based on the literature, project documents, case studies, and interviews.
Indicator Self-initiated User-owned RESCO/ Fee-for-service
1. Appropriate
equipment use
Positive -Large variety of sizes and differing qualities of
SHSs
-Often only high quality equipment
Negative -Poor quality/ faulty equipment sold by less honest
vendors
-Often only one size of system is supplied
2. Effectiveness
in meeting
users’ needs
Positive -Full choice in system size, services, and quality
-Demand based on the preferences of end-users
-End-users can sometimes afford more than one system to
meet multiple needs
Negative -Profit-centred model means end-users‘ needs may
be neglected
-Lack of choice on system size and services provided
-End-user has a choice of renting the system and
finance/maintenance package or nothing
3. Ability to
satisfy
expanding
energy
demands
Positive -Systems may be able to be expanded, resold, or
traded in
-The service company may upgrade the communities‘
systems when needed
Negative -End-users may expand systems incorrectly, thus
lowering system efficiency
-Expansion often not allowed
-End-users unable to alter their systems
4. Cost-
effectiveness
Positive -Range of costs and qualities
-Market determines the price through competition
-End-users allowed to purchase parts directly
-Decreased need to travel for installation and
maintenance
-Competition can lead to innovation
-Equipment often supplied in bulk
-Equipment often subsidized and not taxed
Negative -Equipment often taxed and not subsidized
-Poor management of systems can decrease cost-
effectiveness for users
-Price fixed for end-users
-High-cost equipment only, due to quality
-Monitoring and maintenance often costly
-Systems can become an economic burden for the managing
organization
-End-users must continue to pay for maintenance even if not
required
5. Effectiveness
in changing
community
livelihoods
Positive -Systems specialized to provide services based on
end-users‘ occupations and interests
-Allows for a variety of microenterprises in
communities
-Systems may be more affordable, allowing for more end-
users to be affected by the services

119
Negative -Low-income end-users may be excluded from
positive livelihood changes
-Systems are generally limited in the services they provide
6. Availability
of resources
and support
Positive -Technical support is generally offered by local
suppliers, as endurance is in their interest
-Many types of support available
-End-users allowed to repair their systems
-Often a warrantee for SHSs is provided
-End-users prefer self-organized maintenance
-Self-organized support is often more efficient
-May train a local technician or a technician may make
regular visits to check and repair SHSs
-Ideally systems are checked regularly
Negative -End-user may need to pay the cost of servicing and
replacement parts, making maintenance costly at one
time
-End-users may inappropriately repair their system,
although doing so is not their interest
-Often overseas suppliers, which may hinder local support
-Service schedules may breakdown due to irregular
transportation and poor communication
-Requires a high level of attention and coordination
-Costly and timely, as SHSs are normally checked monthly
7. Availability
of system
components
Positive -Often spare components can be shipped to end-users
for system repair, increasing efficiency
-Rural microenterprises can sell spare parts
-End-users do not need to be concerned about acquiring
spare components or which ones to purchase
Negative -End-users may not have access to parts for their
system if suppliers are no longer in business
-End-users need to acquire parts themselves
-Replacement components are generally only available from
one organization, and thus parts may not be available
nationally
-Requires regular transportation and supply lines, which are
difficult to organize in PICs
8. Capacity
building
Positive -Often basic training is provided to the customer at
the time of purchase
-Follow-up training may be provided, which is often
needs-based
-End-users who own their systems generally care
more about training
-Generally technicians are trained, and are given some
ongoing technical support
Negative -Training for users and technicians are generally
uncoordinated nationally
-Often minimal training is available for end-users
-Extensive training is discouraged as systems may be locked
to prevent user alterations
9. Gender
inclusiveness
Positive -Often a larger range of services are available, which
may directly help women
-Women have the opportunity to manage their family‘s SHS and learn basic maintenance skills
-Have the opportunity to focus on women‘s needs

120
Negative -Women may need to contribute to the cost of
maintenance or spare parts
-Women may need to contribute to monthly fees
10.
Affordability
Positive -Financing is sometimes available by dealers,
financing institution, or donors
-End-users may organize their own financing or buy
parts over time
-Systems may be more affordable as they are generally
subsidized
-Costs are spread out over time, making initial and
maintenance costs more affordable to end-users
Negative -Low-income households may be overlooked,
without access to financing
-Often end-users pay the full initial price and full
price of maintenance
-Fees are required to be paid regularly, which may be
difficult for those without a steady income
-End-users must continue to pay after they have paid for the
initial SHS cost
-The system can be disconnected if fees are not paid
11. Familiarity
with the
technology
Positive -Increases end-users‘ technological familiarity as a
result of their experience with SHSs
-End-users are not required to be familiar with their systems
Negative -Some user-familiarity is required -End-users do not gain much additional experience
12.
Participation
and ownership
Positive -End-users often participate in all stages of the
electrification process
-Incentive for end-users to properly manage the SHS
-A high level of participation and ownership is
desired by most end-users
-Utilities or companies generally have ownership, which can
improve system maintenance
Negative -End-users may not properly install or maintain their
systems
-End-users do not have ownership of SHSs
-End-users generally do not participate in the electrification
process
-Damage, overuse, and theft is a burden to the RESCO
-No incentive to properly manage the system, as system
failure is rewarded by parts being replaced
13.
Willingness to
pay
Positive -User-owned SHSs are preferred, resulting in a
higher willingness to pay due to higher user-
satisfaction
-Willingness to pay may be high if users are satisfied with
the service provided
Negative -End-users may not be willing to pay for replacement
parts without financing and subsidies
-Customers may not like paying repeatedly for something
that they are not able to own
14.
Effectiveness in
improving the
environment
Positive -The possibility for a variety of system sizes and for
expansion lessens the need for fossil fuel power
-Higher quality batteries may be provided, resulting in less
expired batteries
Negative -Poor quality batteries may be purchased, which fail quickly
-Systems may not meet users‘ needs, resulting in users purchasing back-up fossil fuel generators
121
For countries with ongoing RESCO projects and weak PV markets (such as the
RMI, due to a long history of donor-funded projects), there is merit in continuing with the
same electrification model. In this case, RESCOs should address the fact that incomes are
unreliable for many rural end-users, and thus a monthly payment scheme may be
unaffordable (see Figure 8.3.1 for options for alleviating this). In addition, RESCOs should
have disconnection policies that are strictly enforced, as renting a SHS should be a
voluntary option for households, with end-users that prefer to purchase their own power
being disconnected or allowed to rent-to-own the system. Furthermore, fees for
maintenance need to be set according to project costs, rather than affordability, as this will
help to prevent market distortions. Fees should even be over-estimated to allow for
unforeseen technical problems, as projects can become an economic burden to the RESCO
organization if the systems fail.
However, for funding organizations working with countries that have existing PV
markets, it is preferable for them to help strengthen the existing institutions, policies, and
markets rather than creating new programs which serve as competition for local businesses.
Expanding RE markets will decrease the need for future aid-dependence, as excessive
donor funding can create expectations, decrease community motivation, and inhibit
markets through consumers rejecting market prices.
Such a role for project finance (including government) may include:
Facilitating rural access to electricity through providing subsidies and
financing for equipment, and making users aware of these options
Aiding small businesses and NGOs to expand their capacity for supply and
after-sales support
Funding training programs for both users and technicians in collaboration with
solar vendors
Funding supply lines to rural areas
Facilitating the growth of rural microenterprises
Funding the establishment of standards and certifications for RE equipment
and vendors in order to avoid unreasonable product failure
Helping to ‗level the playing field‘ by eliminating market failures such as
import duties and taxes on RE and EE equipment
Encouraging cost-effectiveness through competition between vendors, unless
there is a direct reason not to do so.

122
Yet, the literature, project documents, and many past and ongoing SHS projects in
PICs do not highlight this role for project/programme finance or the need for market
expansion. Opponents of market approaches believe that low-income users will be
financially excluded, due to users not being able to afford initial costs and maintenance.
However, projects implemented in other regions demonstrate that subsidies and financing
can be channelled through vendors and financial institutions, thus allowing SHSs and
replacement components to be both affordable and needs-based. Such subsides and
financing should be available for all types and sizes of systems in order to avoid market
distortions, encourage productive uses, and at the same time provide options for low-
income households.
Opponents to market approaches also suggest end-users in PICs are unable to properly
operate and maintain their own SHS. The results of this research show otherwise, where rural
end-users on Akhamb Island have demonstrated their ability and desire to learn how to
manage a SHS with limited resources and support. These end-users have maintained their
SHS with no external initiative, limited training, and self-organized technical support. In
addition, the rapid adoption rate of SHSs in the community has resulted in the island
becoming nearly fossil fuel-free on its own initiative. This geographic clustering of RE
growth has been documented by Bollinger & Gillingham (2011), who suggested that ‗peer
effects‘ exist, wherein a household is on average five times more likely to convert to solar PV
if one of their neighbours has. This shows that familiarization and education on solar PV is
important for large-scale PV rollout.
Therefore, the results of this research, through the cases studies and
recommendations from interviewees, suggest that PV market expansion is appropriate for
PICs, and often addresses users‘ needs better than solar electrification models. This
provides a challenge for PICs, to provide training and support for end-users, to trust them
to be able to manage and maintain SHSs, and to acknowledge self-initiated electrification
as a part of the rural development process.

123
8.2 Recommendations for Reducing Project Risk
This research has shown that community consultation will increase user-satisfaction
and enhance project endurance, while at the same time providing baseline data for project
evaluations. Consultation can include participatory practices such as surveys, participatory
rural analyses, representative committees, and stakeholder problem trees, and can help to
give end-users ownership over their electricity solutions. However, participatory
approaches are time-consuming, costly, and require trained and culturally aware staff
(ESMAP, 2003).
Lessons learned from previous projects and success criteria (such as those
developed in this research) have also recommended many social solutions for designing
enduring outcomes, particularly education, ownership, and empowerment of beneficiaries.
The success criteria described in Table 8.2.1 are a combination of recommendations from
the literature review, lessons learned from project documents, and the conclusions from the
qualitative and quantitative data analysis undertaken in this study. These criteria are aimed
at providing enduring results for end-users, which is complementary to other success
factors found in the PIC literature, in that they generally focus upon factors for national
policies and project management.
Categories Success Criteria for Enduring Results for End-Users
Technical
Simple and quality technologies proven for PICs
Strong equipment standards and certifications
Accredited installers
Training for vendors and end-users
Conservative system-sizing
Assessment of local needs
Systems meet user desires
Systems consider expanding demands
Economic: Users involved and trained in maintenance
Various services provided, linked to productive uses
Microenterprise promoted
Financing and subsidies available to end-users
Training on financial literacy
Table 8.2.1: Success factors for enduring results.
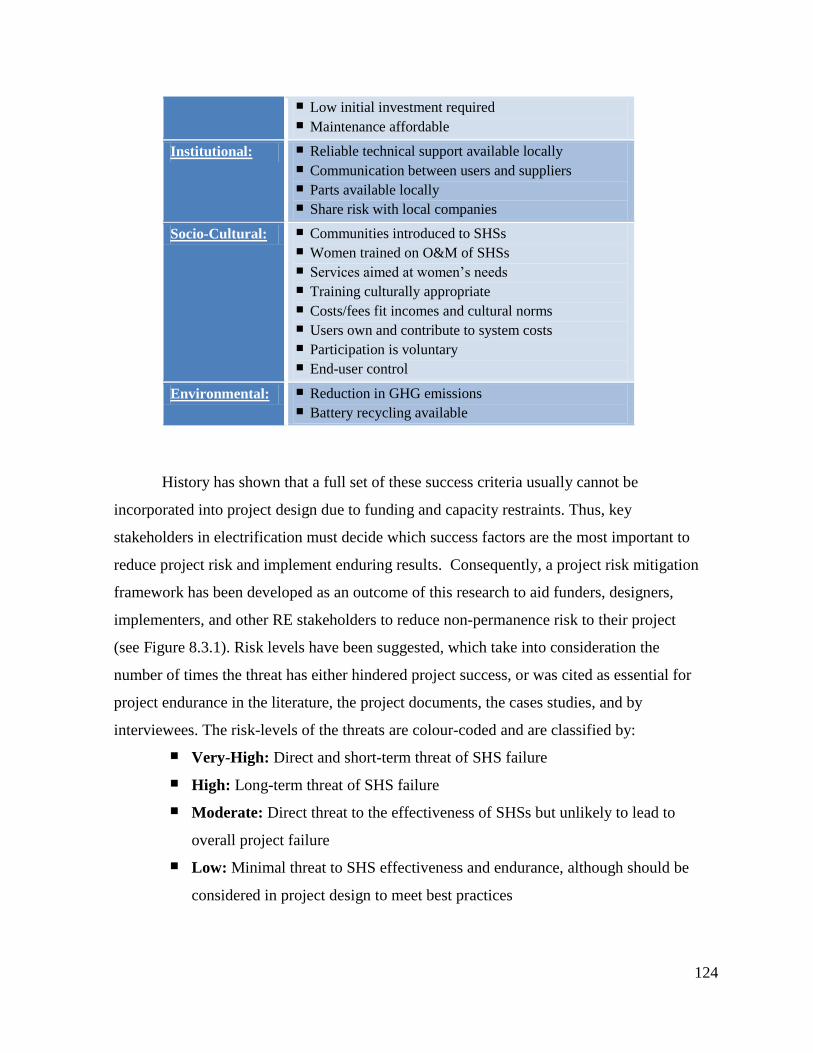
124
Low initial investment required
Maintenance affordable
Institutional: Reliable technical support available locally
Communication between users and suppliers
Parts available locally
Share risk with local companies
Socio-Cultural: Communities introduced to SHSs
Women trained on O&M of SHSs
Services aimed at women‘s needs
Training culturally appropriate
Costs/fees fit incomes and cultural norms
Users own and contribute to system costs
Participation is voluntary
End-user control
Environmental: Reduction in GHG emissions
Battery recycling available
History has shown that a full set of these success criteria usually cannot be
incorporated into project design due to funding and capacity restraints. Thus, key
stakeholders in electrification must decide which success factors are the most important to
reduce project risk and implement enduring results. Consequently, a project risk mitigation
framework has been developed as an outcome of this research to aid funders, designers,
implementers, and other RE stakeholders to reduce non-permanence risk to their project
(see Figure 8.3.1). Risk levels have been suggested, which take into consideration the
number of times the threat has either hindered project success, or was cited as essential for
project endurance in the literature, the project documents, the cases studies, and by
interviewees. The risk-levels of the threats are colour-coded and are classified by:
Very-High: Direct and short-term threat of SHS failure
High: Long-term threat of SHS failure
Moderate: Direct threat to the effectiveness of SHSs but unlikely to lead to
overall project failure
Low: Minimal threat to SHS effectiveness and endurance, although should be
considered in project design to meet best practices

125
Possible actions to reduce the risk of each threat are suggested in the final column
of Figure 8.3.1. Some actions, such as: 1. training end-users and technicians, 2. providing a
variety of system sizes, 3. carrying out a community needs assessment, 4. setting up
certifications and standards, 5. conservatively sizing systems, and 6. providing access to
financing, resulted in multiple risk reductions with only one action. Such actions can be
seen as cost-effective because they provide multiple returns for investment. Educating end-
users has the most co-benefits, and therefore in a pragmatic world, given funding and
capacity constraints, it may provide the best return.
8.3 A Balanced Electrification Strategy
The results of this research show that self-initiated systems best allow for
individuals‘ potentials to be actualised through customized SHSs that are under end-users‘
control. This corresponds with the development literature, where there is no universal truth
regarding development needs: rather, community needs, expressed through participation,
ownership, and capacity-building, will enhance the effectiveness and durability of the design
and implementation of development projects (Berkes, 2007; Campbell & Vainio-Mattila,
2003). This is in line with a generally accepted definition of community development, which
is ―a movement designed to promote better living for the whole community with the active
participation and on initiative of the community‖ (Bhattacharyya, p.1, 1972).
In contrast, end-users‘ desires and capabilities are peripheral in most of the rented
SHS projects implemented in PICs. A consideration of Arnstein‘s ‗Ladder of Citizen
Participation‘ (shown in Figure 2.2.1) can aid in visualizing the current state of PIC
electrification projects. Currently, many projects are in the third rung of the ladder, where
beneficiaries are ‗informed‘ of electrification projects. Some projects are positioned on the
fourth rung through carrying out ‗consultation‘ with end-users. Yet, the self-initiated SHS
model allows electrification to happen in the upper-rungs, with a variety of educational
social programs, allowing end-users to entirely manage their electrification, for ‗full citizen
control‘.
Thus, self-initiated electrification enables end-users to be independent from aid from
developed countries, through a transfer of power to beneficiaries, which allows them to

126
control their own development solutions. Consequently, a transfer of ownership is at the root
of the distinction between projects that are empowering to users and those that are not. The
benefits of such empowerment is highlighted in the UN Declaration on Rights of Indigenous
Peoples, which states that ―control by indigenous peoples over developments affecting them
and their lands, territories and resources will enable them to maintain and strengthen their
institutions, cultures and traditions, and to promote their development in accordance with their
aspirations and needs‖ (UN General Assembly, 2007). Therefore, the key for successful rural
development to occur is to allow local people ―to develop their full potential and lead
productive and creative lives in accordance with their specific needs and interests‖ (Subbarao,
2010).
These studies suggest that funding for participatory practices and capacity-building
programs are important to end-users as a means to take control of their development
solutions. As the literature suggests, in an ideal world, such social solutions would be
maximized. Yet, the cost of such programs to aid-donors and private investors are real and
also need to be considered when attempting to match ideals to funding realities. Thus,
investment in full participatory approaches may be difficult to justify to some financial
institutions supporting SHS projects and programs. This is because social changes are time-
consuming, costly, and difficult to measure.
Consequently, it is necessary to justify the costs of investments in participatory
approaches by transparently demonstrating the benefits in reducing the risk of project
failure and enhancing project and programme durability. Clearly, as with all investments,
there is a point of diminishing returns, beyond which additional financial contributions to
end-user participation may become difficult to justify. At this point it may be useful to
consider the investment required by end-users whose co-financing of participation (e.g., in-
kind contributions) could help enable projects and programs to reach the highest rungs on
Arnstein‘s ladder without exceeding funding limits.
This research has shown that a proper balance in the overarching program design
between the technical and social focus of projects is required, as each are equally important
for project endurance: technical solutions cannot flourish without attention to social needs,
while at the same time an over-emphasis in the social dimensions (at the expense of the
technical) may prevent efficient electrification initiatives from going ahead. Many of the

127
programs examined did not allocate sufficient funds to understanding and incorporating the
social aspects. Rather, there was a general focus on quick implementation, visible
solutions, and technical rollout. Yet, such an approach was shown to decrease the
probability of project success and enhance the risk of project failure. Therefore, this
research suggests that many projects in PICs have not yet found the optimum tuning of
balanced investment in both social and technical dimensions of solar PV electrification.
There is general agreement that conventional, technical ‗top-down‘ development
approaches have failed to deliver helpful results to beneficiaries, as often they neglect
recipients‘ needs and disregard the creation of local ownership (Chambers, 1994; OECD-
DAC, 2005). Yet, purely ‗bottom-up‘ social approaches are costly, timely, and unrealistic
in a donor funded world of solar PV programs. The purpose of the Project Risk Mitigation
Framework presented in this thesis is to help funders and implementers of solar PV
electrification find the correct balance of technical and social investment, through enabling
project designers to choose the most effective method to minimize threats, no matter if they
are social or technical in nature. This balance will vary on a case-by-case basis depending
on a community‘s development level and needs, yet more attention to social dimensions of
renewable electrification is likely to increase SHS longevity in PICs.
Figure 8.3.1: A Project Risk Mitigation Framework for identifying threats to SHSs in PICs, and
suggested actions to mitigate these threats.

128
Indicator Primary
Threats
Possible Results if
Unaddressed Risk Level Actions to Avoid Threats
1.
Appropriate
equipment
use
A) No standards
or certifications
for equipment or
vendors
A1) End-users purchase low-
quality parts unknowingly
A2) Vendors sell poor quality
systems to increase sales
A3) Vendors lack expertise
A4) Equipment may fail quickly
A) High: Poor quality
equipment can lead
systems to fail quickly
and decrease
willingness-to-pay
A1) Certifications and standards for
equipment
A2) Accredit installers and designers
A3) Subsidize appropriate equipment
A4) Subsidize adequately-designed systems
by accredited installers
A5) Label solar PV-appropriate and
energy-efficient equipment/appliances
B) End-users not
trained on
appropriate
equipment use
B1) End-users purchase
undersized systems
B2) End-users poorly install
their systems
B3) End-users overuse their
SHSs
B) High:
End-users may
overuse their systems,
causing inefficiency
and failure
B1) Educate consumers on system-sizing,
limitations, and installation
B2) Give end-users ownership, as it
provides a financial incentive against
overuse
B3) Provide long-term training to prevent
overuse, as it will require a behaviour
change
C) Equipment
inappropriately
complex or not
designed for PIC
environments
C1) Expertise may be
unavailable to fix complex
equipment
C2) Equipment may need to be
replaced regularly
C3) Maintenance costs can
increase
C) Moderate: Many
experienced vendors
are now aware of
what equipment is
appropriate
C1) Avoid complex technologies that
require a high level of maintenance
C2) Use technically and commercially
proven technologies for PICs
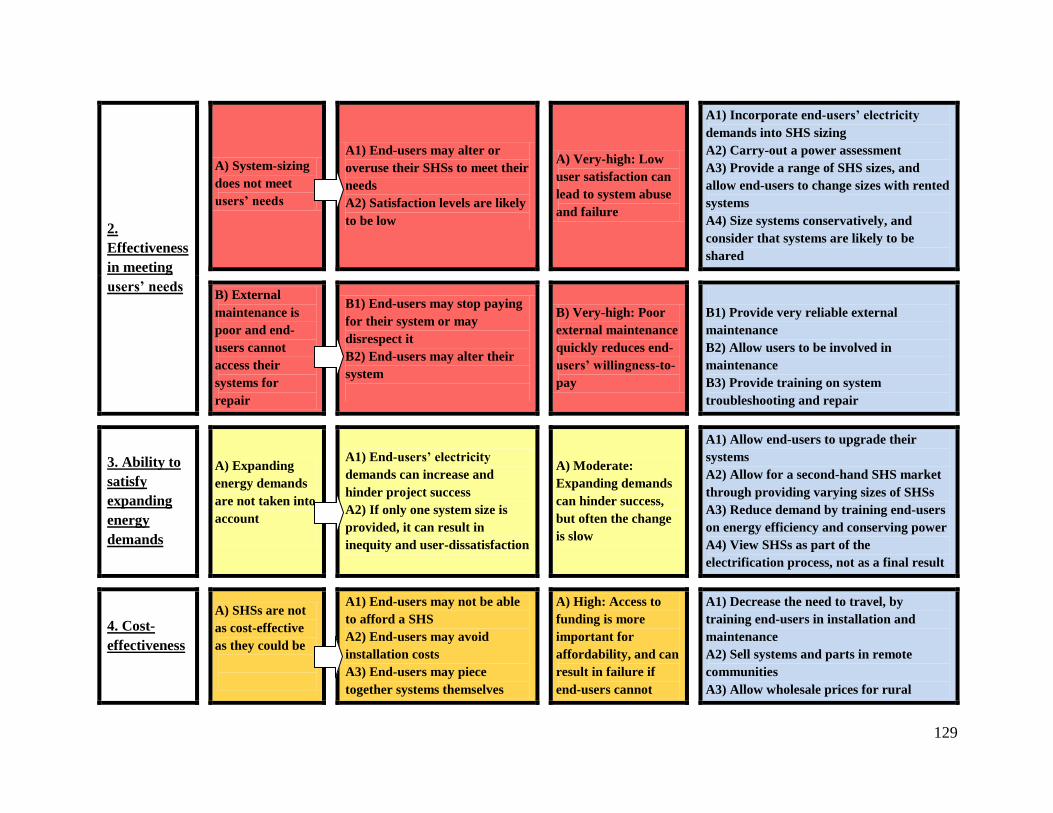
129
2.
Effectiveness
in meeting
users’ needs
A) System-sizing
does not meet
users’ needs
A1) End-users may alter or
overuse their SHSs to meet their
needs
A2) Satisfaction levels are likely
to be low
A) Very-high: Low
user satisfaction can
lead to system abuse
and failure
A1) Incorporate end-users’ electricity
demands into SHS sizing
A2) Carry-out a power assessment
A3) Provide a range of SHS sizes, and
allow end-users to change sizes with rented
systems
A4) Size systems conservatively, and
consider that systems are likely to be
shared
B) External
maintenance is
poor and end-
users cannot
access their
systems for
repair
B1) End-users may stop paying
for their system or may
disrespect it
B2) End-users may alter their
system
B) Very-high: Poor
external maintenance
quickly reduces end-
users’ willingness-to-
pay
B1) Provide very reliable external
maintenance
B2) Allow users to be involved in
maintenance
B3) Provide training on system
troubleshooting and repair
3. Ability to
satisfy
expanding
energy
demands
A) Expanding
energy demands
are not taken into
account
A1) End-users’ electricity
demands can increase and
hinder project success
A2) If only one system size is
provided, it can result in
inequity and user-dissatisfaction
A) Moderate:
Expanding demands
can hinder success,
but often the change
is slow
A1) Allow end-users to upgrade their
systems
A2) Allow for a second-hand SHS market
through providing varying sizes of SHSs
A3) Reduce demand by training end-users
on energy efficiency and conserving power
A4) View SHSs as part of the
electrification process, not as a final result
4. Cost-
effectiveness
A) SHSs are not
as cost-effective
as they could be
A1) End-users may not be able
to afford a SHS
A2) End-users may avoid
installation costs
A3) End-users may piece
together systems themselves
A) High: Access to
funding is more
important for
affordability, and can
result in failure if
end-users cannot
A1) Decrease the need to travel, by
training end-users in installation and
maintenance
A2) Sell systems and parts in remote
communities
A3) Allow wholesale prices for rural

130
A4) End-users may not be able
to afford maintenance
afford replacement
parts
organizations to decrease rural retail
prices
A4) Provide SHSs that power a variety of
services, not just lighting
A5) Oversize systems in order to reduce
the need for expensive battery
replacements
A6) Encourage competition between solar
vendors
B) Projects are
cash-flow
negative in the
long-term
B1) Projects can become an
economic burden for the
managing organization
B2) Projects may need to be
continually subsidized
B) Moderate:
Unsustainable
projects require
lifetime financial
support, yet are often
funded
B1) Set fees according to project costs,
rather than according to affordability
B2) Implement strong disconnection
policies for payment defaults
C) Subsidies and
policies biased
against RE and
self-initiated
systems distort
the SHS market
C1) Projects that are over-
subsidized can distort the
market
C2) Policies that do not promote
RE can inhibit the market
C) Moderate: Self-
initiated systems may
become expensive
C1) Encourage government regulations
that promote RE
C2) Use blanket subsidies for SHS
equipment
C3) Set fees according to project costs
5.
Effectiveness
in changing
community
livelihoods
A) SHSs do not
accommodate
productive uses
A1) End-users may not be able
to pay for system repair
A2) SHS electrification does not
improve community income
levels or livelihoods
A) Moderate:
SHSs are comparable
in cost to other
energy sources that
do not accommodate
productive uses
A1) Link services to productive uses
A2) Provide a range of SHS sizes, which
can be specialized for end-users’
occupations and interests
A3) Employ rural organizations to sell
SHSs and parts

131
6.
Availability
of resources
and support
A) Adequate
technical support
is not available to
end-users
A1) A lack of long-term
resources and support can lead
to system failure
A2) End-users may try to repair
their systems themselves,
causing safety issues and the
chance of breaking equipment
A) Very-high: A lack
of technical support
often leads to failure
A1) Provide reliable after-sales service,
through toll-free call centres, radio
communication, and the option of sending
broken parts to vendors for repair
A2) Provide regular monitoring of systems,
perhaps through GPS/ GSM devices, text
messaging, telephone, and radio
communication
A3) Create strong relations between
suppliers and customers
A4) Support vendors to provide technical
training and involve end-users in
maintenance
A5) Attach basic maintenance information
and how to access technical support to the
SHS
A6) Create a national support centre for
RE
A7) Incorporate RE education into schools
and vocational centres
B) Technical
support is not
affordable
B1) End-users will not pay for
technical support, and may try
to repair their systems
themselves
B2) The system may remain
broken before its intended
lifespan
B) High:
Unaffordable support
may result in
improper repair or
unused systems
B1) Provide after sales service and repair
in ways that minimize the need to travel
B2) Provide technical support locally
through training local technicians
B3) Train end-users to be able to handle
basic maintenance and repair
7.
Availability
of system
components
A) Spare parts
are unavailable
to end-users
when needed for
A1) End-users are not able to
use their SHSs until parts are
available
A2) End-users become
A) Very-high: Spare
parts are needed for
system endurance
A1) Create strong supply chains, both
from overseas to suppliers and from
suppliers to rural areas
A2) Organize local organizations to supply

132
replacement dissatisfied
A3) SHSs may remain broken
before their intended lifespan
spare parts, while at the same time
providing a business opportunity
8. Capacity
building
A) End-users do
not understand
their SHS and
how to use and
maintain it
A1) End-users are unable to
properly maintain their SHSs
A2) End-users do not properly
connect wires and equipment,
causing SHSs to function poorly
A3) End-users do not
understand the capacity of their
systems
A) Very-high: Lack
of training can result
in SHS failure, as
external support
cannot be relied upon
due to PICs’
remoteness
A1) Provide training in communities, with
its being hands-on, in the local language,
and designed for community education
levels
A2) Ensure that funding for training is
available for the long-term, before and
after installation
A3) Use a variety of media tools to reach
large audiences, such as movies, radio
shows, newspaper articles, travelling
theatre, laminated information sheets, and
text messaging
A4) Set up training programs with solar
suppliers to provide to customers
A5) Provide an incentive for end-users to
come to training courses, such as free volt-
meters, a compass, wire connectors,
electrical tape, breakers/ fuse holders, etc.
B) Technicians
lack the
appropriate
knowledge to
maintain and
repair systems
B) Technicians inappropriately
connect systems, causing
inefficiency and damage
B) High: Local
technicians are often
the only support
rural end-users have,
yet they generally
have basic knowledge
B1) Ensure technicians are on the same
level by providing technical training on
system sizing, installation, troubleshooting,
and basic repair of components
B2) Training must accommodate
technicians’ education and level of
understanding, be hands-on, and in the
local language

133
C) Institutions
lack a variety of
skills to provide
adequate after-
sales services,
properly size
systems, and
manage their
organization
C1) Institutions are unable to
provide proper training and
after-sales service
C2) Systems are inappropriately
designed
C3) Institutions are ineffective
due to poor management, and
may not last
C) Moderate: Many
urban vendors
already have some
degree of training
C1) Ensure vendors are on the same level
by providing training and certifications
C2) Set up courses for business
management and provide a business
coordinator
9. Gender
inclusiveness
A) Installed SHSs
do not meet
women’s needs
A1) Women may be
uninterested in the SHS, and
may not use or take care of it
A2) Women may be further
marginalized if the systems’
productive uses are focused on
men
A) Moderate:
Although gender
inclusiveness is
important, it does not
often hinder project
endurance
A1) Ensure women are included in all
project stages
A2) Target women in trainings on how to
use and manage their SHSs
A3) Provide separate training sessions for
women
A4) Ensure productive uses of projects
involve women, through including them in
SHS design
A5) Provide national training for women
technicians
10.
Affordability
A) End-users are
unable to afford
a SHS’s initial
cost
A) Low-income households may
not be able to afford the initial
cost of a SHS
A) Very-high:
Affordability is a
barrier to widespread
SHS usage
A1) Provide financing to end-users to allow
them to pay for systems over time
A2) Provide subsidies on the initial cost,
and consider smart subsidies that are
slowly phased out with economies of scale
A3) Provide basic financial training to end-
users
A4) Consider battery-charging stations
and small solar lanterns as more
affordable options
A5) Allow users to pay with crops, by
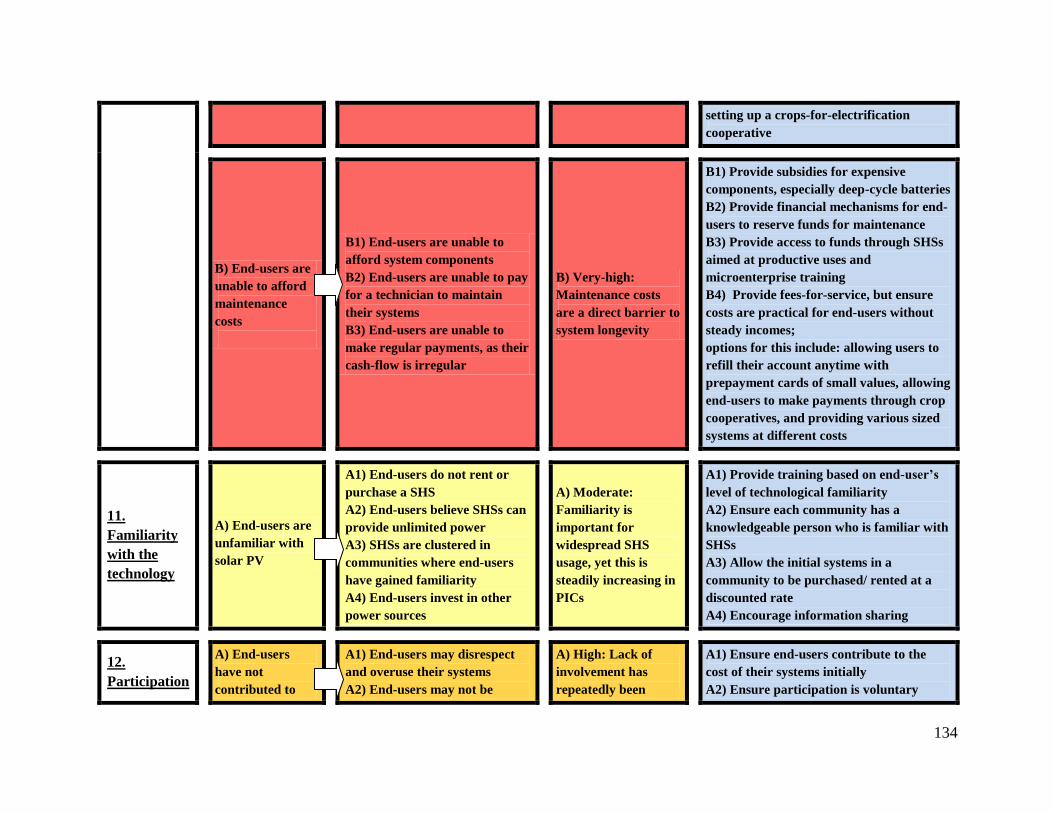
134
setting up a crops-for-electrification
cooperative
B) End-users are
unable to afford
maintenance
costs
B1) End-users are unable to
afford system components
B2) End-users are unable to pay
for a technician to maintain
their systems
B3) End-users are unable to
make regular payments, as their
cash-flow is irregular
B) Very-high:
Maintenance costs
are a direct barrier to
system longevity
B1) Provide subsidies for expensive
components, especially deep-cycle batteries
B2) Provide financial mechanisms for end-
users to reserve funds for maintenance
B3) Provide access to funds through SHSs
aimed at productive uses and
microenterprise training
B4) Provide fees-for-service, but ensure
costs are practical for end-users without
steady incomes;
options for this include: allowing users to
refill their account anytime with
prepayment cards of small values, allowing
end-users to make payments through crop
cooperatives, and providing various sized
systems at different costs
11.
Familiarity
with the
technology
A) End-users are
unfamiliar with
solar PV
A1) End-users do not rent or
purchase a SHS
A2) End-users believe SHSs can
provide unlimited power
A3) SHSs are clustered in
communities where end-users
have gained familiarity
A4) End-users invest in other
power sources
A) Moderate:
Familiarity is
important for
widespread SHS
usage, yet this is
steadily increasing in
PICs
A1) Provide training based on end-user’s
level of technological familiarity
A2) Ensure each community has a
knowledgeable person who is familiar with
SHSs
A3) Allow the initial systems in a
community to be purchased/ rented at a
discounted rate
A4) Encourage information sharing
12.
Participation
A) End-users
have not
contributed to
A1) End-users may disrespect
and overuse their systems
A2) End-users may not be
A) High: Lack of
involvement has
repeatedly been
A1) Ensure end-users contribute to the
cost of their systems initially
A2) Ensure participation is voluntary

135
and
ownership
the cost of their
systems
willing to pay for maintenance
A3) End-users may not have
desired the system initially
shown to lead to
system disrespect
B) End-users are
not given
ownership of
their systems
B1) End-users may not retain
interest in paying for systems
that they do not own
B2) End-users may be
dissatisfied as they prefer to own
their systems
B3) End-users may disrespect
and overuse their systems
B) Moderate: Lack of
ownership often leads
to system disrespect
and user
dissatisfaction, yet
other models may
work
B1) Give ownership of systems to end-
users
B2) Train end-users to manage their
systems
C) Projects have
not involved end-
users in their
design
C1) End-users may lack interest
or not respect the project
C2) Lack of participation leads
to misconceptions
C3) Stakeholders are unclear of
their roles in the projects
C4) Payment methods do not
match users’ abilities to pay
C) High:
Users are likely to be
dissatisfied and
misuse their SHSs
C1) Carry-out an objective assessment of
local needs through survey and
participatory approaches
C2) Base programs on lessons previously
learned
C3) Clearly define roles and ensure
transparency
13.
Willingness
to pay
A) End-users are
dissatisfied with
their systems
A) End-users are not willing to
pay fees or pay to maintain their
systems anymore
A) Very-high: If users
are unwilling to pay
for their SHS, system
failure will likely
result
A1) Ensure payment methods fit cultural
norms
A2) Ensure systems meet users’ desires
A3) Ensure adequate support is available
A4) Make systems as cost-effective as
possible
A5) Ensure policies regarding fees,
disconnection, and O&M are consistent
and transparent
A6) Give end-users ownership so that they
can be responsible for their own systems

136
14.
Effectiveness
in improving
the
environment
A) A SHS’s effect
on GHG
emissions is not
considered
A1) Hybrid solar/fossil fuel
systems may be installed
A2) Even without consideration,
SHSs normally decrease GHG
emissions
A) Low: SHSs
naturally reduce
GHG emissions
A) Ensure subsidies are biased towards
RE, not fossil fuels
B) Battery
recycling is not
available
B) Exposure to lead may result
in negative health and
environmental effects
B) Low:
Environmental
consequences do not
affect project
longevity, although
are important
B1) Set up a national battery recycling
program
B2) If this is not possible, train end-users
that the lead in batteries is toxic
B3) Encourage the use of high-quality
maintenance-free batteries to increase
battery life

137
8.4 Limitations of the Research
This research was limited by only two case studies, due to time and financial
constraints. Therefore, although three models of electrification were represented (self-
initiated, project-initiated, and RESCO), these projects were at different stages, leading to
limitations in comparing responses in the questionnaires. Thus, with the long-term effects
of two of the projects yet to be seen, some indicators such as cost-effectiveness were
difficult to compare. In addition, the RESCO project in Namdrik Atoll was rehabilitated in
2001 and has switched ownership since, making it an imperfect project to study. However,
an evaluation of this project was carried out by Empower (2005), which allowed the
researcher to grasp the effects of the project at two different points in time.
Also, the author‘s lack of knowledge of the Marshallese language hindered the
research results, in that questionnaires could not be administered verbally in the RMI, and
therefore respondents‘ questions could not be easily clarified. This led to some respondents
not returning or completing the questionnaires. In contrast, the author is fluent in Bislama
(Vanuatu pigeon), and as such all of the respondent‘s questions in Vanuatu were answered
fully.
In Vanuatu, there was a time constraint for both the interviews and questionnaires,
leading to four SHS owners on Akhamb not being included in the research due to their
unavailability during the field research period. This also led the author to carry-out five
interviews in one day in Port Vila, which led to the interviews not being as in depth as they
would otherwise have been.
Thus, repeated evaluations are needed in various PICs in order to fully understand
the effects of self-initiated user-owned systems, because data on this method is still limited.
However, this research has successfully contributed to closing this gap through its
evaluation of the benefits of the SHSs on Akhamb Island. There is also merit in further
research to identify the most efficient balance between social and technical development
dimensions of project design and implementation.

138
This research has analyzed the essential criteria and electrification models for rural
electrification using solar PV home systems (SHSs) in Pacific Island Countries (PICs),
specifically in the Marshall Islands and Vanuatu. A set of fourteen indicators were
developed in order to determine these success criteria, which expanded the literature on
evaluation indicators to include a set appropriate for evaluating the effects of rural
electrification on PIC end-users. The results showed that the most important success
criteria for end-users include:
Technical: Low-maintenance technologies; equipment standards and
certifications; conservative system-sizing; and various size availability.
Economic: Projects cash-flow positive; end-users involved in maintenance;
and services linked to productive uses.
Institutional: Reliable technical support; communication between users and
suppliers; support and parts available locally; and training for end-users.
Socio-cultural: End-user control; services include women‘s and local needs;
and financing available.
Environmental: Reduction in GHG emissions.
This research proposes that despite the prevalence of Renewable Energy Service
Company (RESCO) managed projects in PICs, self-initiated user-owned SHSs are more
likely to result in enduring benefits for end-users, (and therefore more cost-effective
investments in household solar PV), as they:
1. Provide an economic incentive for end-users to respect their systems
2. Allow for customized systems to address end-users‘ needs and productive uses
3. Incorporate end-users‘ desires for participation and ownership
4. Empower end-users to create and be responsible for their own development
solutions.
Thus, self-initiated electrification enables end-users to be independent from aid
from developed countries, through a transfer of power to beneficiaries, which allows them
to control their own development solutions.
Chapter 9:
Conclusions
139
While such benefits are beginning to be acknowledged by the global literature and
by respondents, the literature, project documents, and many ongoing projects from PICs
generally view rented SHSs as the preferred electrification model. This preference is
derived from two concerns: 1. End-users will not be able to afford initial and replacement
components without costs being dispersed over time, and 2. End-users in PICs are unable
to properly operate and maintain their own SHSs.
The results of this research do not support the view that rented SHSs are the most
effective or efficient approach to rural electrification. On the contrary, this research has
shown that self-initiated, user-owned approaches have a greater chance of enduring project
success if they are well designed. Here, the costs of self-initiated systems can be dispersed
over time through providing users with access to financing. Such practices have been
successful in many developing countries in other regions and this research did not find any
reason why such an approach would not be successful in PICs. In addition, self-initiated
systems have the potential to be more cost-effective, through avoiding the need for
complex institutional structures, thus increasing affordability.
This research addressed the issue of end-users being unable to properly operate and
maintain their own SHS through a case study, while at the same time expanding the current
knowledge of the potential of self-initiated SHSs in PICs. The results demonstrated rural
end-users‘ ability and desire to learn how to manage a SHS with limited access to resources
and support. These end-users have successfully installed and maintained SHSs themselves
with no external initiative, with limited training, and self-organized technical support. In
addition, the community has become nearly fossil fuel-free of its own initiative.
Therefore, projects with fewer layers between the funder and beneficiaries, end-user
education and participation, and self-initiative often are more successful in making SHSs
cost-effective and enduring. The need for such social solutions is well documented in the
development literature; yet, these solutions need to be balanced with technical support due
to capacity and funding constraints.
This research concludes that a proper balance in the overarching program design
between the technical and social focus of projects is required, as each are equally important
for project effectiveness and durability. However, many of the electrification programs in
PICs did not allocate sufficient funds to understanding and incorporating the social aspects,

140
with a general focus on implementing visible technical solutions; yet, this was shown to
reduce project longevity. Thus, in applying this research to the realities of community
development with its funding constraints, consideration needs to be given as to the
optimum balance between the social and technical.
In conclusion, market solutions are the best way forward for future PIC
electrification, in that they provide the most cost and time efficient way of maintaining a
balance between social and technical needs, because they minimize the need for over-
investment in institutional structures. The funding that would otherwise be spent on
building bureaucracy in RESCO models can be more efficiently allocated to the social
dimensions of a user-initiated and user-owned market approach.

141
Adams, J., Roberts, N., et al. (2007). Project Appraisal Document on a Proposed GEF Grant to
Fiji, Papua New Guinea, Republic Of Marshall Islands, Solomon Islands, and Vanuatu for
a Sustainable Energy Financing Project. World Bank: May 16, 2007, 1-139.
ADB (Asian Development Bank) (2011). Project Information Documents: Yap Renewable Energy
Development Project: Micronesia. [Online]. Retrieved September 15, 2011, from
http://pid.adb.org/pid/LoanView.htm?projNo=44469&seqNo=01&typeCd=3
Akker, J. (2006). Final Evaluation of the UNDP/GEF/SPREP Project: Pacific Islands Renewable
Energy Project (PIREP), 1-58.
Alphatron (2011). Microgrid: Systems for Stand Alone Power Grids. [Online]. Retrieved June 15,
2011, from http://www.alphatrononline.com/microgrid.cfm
APAN (Asia Pacific Adaptation Network) (2012). Pacific Island Greenhouse Gas Abatement
through Renewable Energy Project (PIGGAREP). [Online]. Retrieved March 27, 2012
from http://www.apan-gan.net/adaptation-database/piggarep
APCTT-UNESCAP (2009). Fiji Renewable Energy Report. Asian and Pacific Centre for Transfer
of Technology of the United Nations Economic and Social Commission for Asia and the
Pacific (ESCAP), 1-63.
Arnstein, S. (1969). A Ladder of Citizen Participation. JAIP, 35 (4): 216-224.
AusAid (2011). Vanuatu Electricity for Rural Development Program – an Australian funded
initiative. Draft Program Design Document, June 2011, 1-132.
Barefoot Power Limited (2011). Our Products. [Online]. Retrieved July 11, 2011, from
http://barefootpower.com/barefoot-products/#
Beck, F. & Martinot, E. (2004). Renewable Energy Policies and Barriers. Encyclopedia of Energy.
San Diego: Elsevier Science/Academic Press, 365-383.
Berkes, F. (2007). Community-based conservation in a globalized world. Proceedings of the
National Academy of Sciences. Washington, DC: National Academy of Sciences, 104 (39):
15188–15193.
Bhattacharyya, S. (1972). Community Development in Developing Countries. Calcutta: Academic
Publishers, 1-148.
Bollinger, B. & Gillingham, K. (2011). Peer Effects in the Diffusion of Solar Photovoltaic Panels.
New York and Connecticut: NYU Stern School of Business and Yale School of Forestry &
Environmental Studies, 1-42.
BP (British Petroleum) (2009). Statistical Review of World Energy. London, 1-48.
Bryman, A. (2008). Social research methods (3rd ed.). Oxford: Oxford University Press. Ch. 15 and
22: 314-335, 538-552.
References:

142
Cabraal, A., Barnes, D., & Agarwal, R. (2005). Productive uses of energy for rural development.
Annual Review of Environmental Resources, 30: 117–144.
Campbell, L. & Vainio-Mattila, A. (2003). Participatory Development and Community-Based
Conservation: Opportunities Missed for Lessons Learned? Human Ecology, 31(3): 417-
437.
Cecelski (2000). The Role of Women in Sustainable Energy Development. Colorado, USA: National
Renewable Energy Laboratory: Subcontractor Report. June 2000.
Chakrabarti, S. (2002). Rural electrification programme with solar energy in remote region–a case
study in an island. Energy Policy, 30: 33–42.
Chambers, R. (1994). The Origins and Practice of Participatory Rural Appraisal. World
Development, 22 (7): 953-969.
Chaurey, A. & Kandpal, T. (2009). Solar lanterns for domestic lighting in India: Viability of central
charging station model. Energy Policy, 37: 4910–4918.
Chow, J. (2010). Assessment of Solar Home Systems (SHS) for Isolated Rural Communities in
Vanuatu Using Project Lifecycle/Sustainability Framework. Masters Thesis, Houghton,
Michigan: Michigan Technological University, 1-55.
CIA (Central Intelligence Agency) (2009). The World Factbook: Oceania. [Online]. Retrieved April
2, 2011, from http://www.zaneeducation.com/factbook/maps/refmap_oceania.html
CIA (Central Intelligence Agency) (2009a). The World Factbook: Marshall Islands. [Online].
Retrieved November 10, 2011, from
http://www.zaneeducation.com/factbook/maps/maptemplate_rm.html
CIA (Central Intelligence Agency) (2009b). The World Factbook: Marshall Islands. [Online].
Retrieved November 10, 2011, from
http://www.zaneeducation.com/factbook/maps/maptemplate_nh.html
Climate Parliament (2009). Renewables: Micro-finance for Solar Lighting Systems. [Online].
Retrieved April 2, 2012, from http://www.climateparl.net/cp/118
Connell, J. & Waddell, E. (2007). Environment, Development and Change in Rural Asia-Pacific.
London: Routledge, Tailor, and Francis Group, 38-55.
D.lite design (2011). Product Line. [Online]. Retrieved August 2, 2011, from
http://www.dlightdesign.com/products_product_line_global.php
DOE-EA (Department of Energy-Environmental Assessment) (2009). Environmental Assessment
for BP Solar Array Project. New York: Brookhaven National Laboratory, United States
Department of Energy: Office of Science, 1-72.
Dornan, M. (2011). Solar-based rural electrification policy design: The Renewable Energy Service
Company (RESCO) model in Fiji. Renewable Energy, 36 (2): 797-803.

143
E8 (2009). Decreasing Reliance on Fuel and Enhancing Renewable Energy-Based Electrification
in the Small Island State of Tuvalu: The Tuvalu Solar Power Project. Montreal, Canada: E8
General Secretariat, 1-32.
Empower (2005). Review of Namdrik Atoll Solar Project, Republic Of The Marshall Islands: Final
Report. Pacific Islands Energy Policy and Strategic Action Planning (PIEPSAP) Project
Report 50. Empower Consultants Limited, October 2005, 1-66.
ESMAP (2003). Monitoring and Evaluation in Rural Electrification Projects: A Demand-Oriented
Approach. UNDP/World Bank Energy Sector Management Assistance Programme
(ESMAP): The International Bank for Reconstruction and Development, July 2003.
Europeaid (2009). Kiribati/Solar Energy for Outer Islands: Annex. CRIS No. FED/2009/21-648.
European Union Project Reports, 1-6.
Fthenakis,V., Kim, H., & Alsema, E. (2008). Emissions from Photovoltaic Life. Environmental
Science Technology, 42: 2168–2174.
GEF (Global Environment Facility) Council (2005). PIGGAREP Project Executive Summary, GEF
Council Work Program Submission. New York: United Nations Development Programme-
Global Environment Facility, 1-50.
GoF (Government of France) (2011). Overseas France: Renewable Energy. [Online]. Retrieved
September 13, 2011, from http://www.outre-mer.gouv.fr/?les-outre-mer-a-la-foire-de-
hanovre.html
GoV (Government of Vanuatu) (2006). House, Income and Expenditure Survey. Port Vila: Vanuatu
National Statistics Office, Government of Vanuatu.
GPA (Guam Power Authority) (2008). Integrated Resource Plan FY 2008. Hagåtña, Guam: Guam
Power Authority, 1-73.
Gustavsson, M. (2007). With time comes increased loads—An analysis of solar home system use in
Lundazi, Zambia. Energy Policy 35: 1292-1299.
Holdren, J., Smith, K., et al. (2000). Energy, the Environment and Health. World Energy
Assessment. New York: United Nations Development Programme, United Nations
Department of Economic and Social Affairs, and World Energy Council, 61-110.
Ilskog, E. (2008). Indicators for assessment of rural electrification: An approach for the comparison
of Apples and Pears. Energy Policy, 36 (7): 2665-2673.
Ilskog, E. & Kjellstrom, B. (2008). And they lived sustainably ever after? Assessment of rural
electrification cases by means of indicators. Energy Policy, 36 (7): 2674-2684.
IPCC (Intergovernmental Panel on Climate Change) (2007). Climate Change 2007: Working Group
II: Impacts, Adaptation and Vulnerability Sec. 6.7. IPCC Fourth Assessment Report.
Geneva, Switzerland: World Meteorological Organization.

144
IRENA (International Renewable Energy Agency) (2011). IRENA Workshop Summary:
Accelerated Renewable Energy Deployment on Islands with Emphasis on the Pacific
Islands. Sydney: 26-28 October, 2011, 1-6.
IRENA (International Renewable Energy Agency) (2012). Proposed IRENA Activities for the
Pacific Region in 2012. Abu Dhabi: IRENA Pacific Region Unit, 1-3.
IRENA (International Renewable Energy Agency) (2012a). IRENA Renewable Energy Country
Profiles: Pacific Region. Abu Dhabi: IRENA Pacific Region Unit, 1-35.
Jafar, M. (2000). Renewable Energy in the South Pacific: options and constraints. Renewable
Energy, 19 (1): 305-309.
Jochem, E., Adegbulugbe, A., et al. (2000). Energy End-Use Efficiency. World Energy Assessment.
New York: United Nations Development Programme, United Nations Department of
Economic and Social Affairs, and World Energy Council, 175-211.
Johnston, P. (2004). Pacific Regional Energy Assessment 2004: Fiji National Report, Volume 4.
Apia, Samoa: South Pacific Regional Environment Program, 1-117.
Johnston, P. (2004a). Pacific Regional Energy Assessment 2004: Papua New Guinea National
Report, Volume 10. Apia, Samoa: South Pacific Regional Environment Program, 1-114.
Johnston, P. (2004b). Pacific Regional Energy Assessment 2004: Vanuatu National Report, Volume
1. Apia, Samoa: South Pacific Regional Environment Program, 1-92.
Jol, J., Mandoc, M., & Molenbroek, E. (2008). Solar electricity 2008 – A technical and economic
overview. Kanaalweg, Netherlands: Ecofys BV, 1-24.
Kopi, I. & Lloyd, C. (2002). Renewable Energy and Rural Electrification in PNG. Dunedin, New
Zealand: Physics Department, Otago University, 1-5.
Krithika, P. & Palit, D. (2011). Review of Alternative Participatory Business Models for Off-grid
Electricity Services. New Delhi: OASYS- South Asia Project, 1-32.
Kua, N. (2010). Request for Tenders: Renewable Energy DVD Documentary for Pacific Islands
Countries. PIGGAPEP Project. Apia, Samoa: SPREP. 12 October 2010.
KUTh Energy Limited (2009). KUTh Signs MOU With Vanuatu Electricity Provider. ASX Release:
16th October 2009.
Leonics Co. Limited (2009). Solar Home System. [Online]. Retrieved November 13, 2011, from
http://www.leonics.com/system/solar_photovoltaic/solar_home_system/solar_home_syste
m_en.php
Lewis, N. (2007). Toward Cost Effective Solar Energy Use. Science. 315, 798-801.
Liebenthal, A., Mather S., & Wade, H. (1994). Solar Energy: Lessons from the Pacific Experience.
World Bank Technical Paper Number 244. Energy Series. Washington, DC: The World
Bank.

145
Maharaj, R. (1999). Coastal Erosion in Pacific Small Island Developing States (SIDS) – The
need for an approach to integrated coastal management (ICM). CoGeonvironment NEWS.
Suva, Fiji: SOPAC, 1-5.
Mala, K., Schlapfer, A., & Pryor, T. (2008). Solar photovoltaic (PV) on atolls:
Sustainable development of rural and remote communities in Kiribati. Renewable and
Sustainable Energy Reviews, 12: 1345–1363.
Mala, K., Schlapfer, A., & Pryor, T. (2009). Better or worse? The role of solar photovoltaic systems
in sustainable development: Case studies of remote atoll communities in Kiribati.
Renewable Energy, 34: 358-361.
Mapako, M. & Prasad, G. (2007). Rural Electrification in Zimbabwe Reduces Poverty by
Targeting Income-Generating Activities. Proceedings of the Fifteenth Conference on
Domestic Use of Energy. Cape Town: 11-12 April 2007.
Mario (2003). Renewable Energy Training Needs Assessment in Pacific Island Developing States.
South Pacific Applied Geoscience Commission (SOPAC) Technical Report 363, 1-33.
Martinot, E., Cabraal, A., & Mathur, S. (2001). World Bank/GEF solar home system projects:
experiences and lessons learned 1993–2000. Renewable and Sustainable Energy Reviews,
5: 39–57.
Martinot, E., Chaurey, A., et al. (2002). Renewable Energy Markets in Developing Countries.
Annual Review of Energy and the Environment, 27: 309-348.
Martinot, E. & McDoom, O. (2000). Promoting Energy Efficiency and Renewable Energy: GEF
Climate Change Projects and Impacts. Washington, DC: Global Environment Facility.
June 2000.
Martinot, E. & Reiche, K. (2000). Regulatory Approaches to Rural Electrification and Renewable
Energy: Case Studies from Six Developing Countries. Working paper. Washington, DC:
The World Bank. June 2000.
Matakiviti, A. (2006). Vanuatu National Consultation – Back to Office Report. Pacific Islands
Energy Policy and Strategic Action Planning (PIEPSAP) Project Report 46: 1-7.
MEC (Marshalls Energy Company) (2005). Facility Data Sheet: Namdrik Atoll Solar Power
System. [Online]. Retrieved November 8, 2011, from http://www.mecrmi.net/Namdrik.htm
MEC (Marshalls Energy Company) (2008). Report of the Installation of the EU Rep-5 Solar
Project at Ailinglaplap Atoll, Republic of the Marshall Islands. Installed by MEC, 1-18.
MECC (Ministry of Environment and Climate Change) (2012). Tonga Renewable Energy
Programs. [Online]. Retrieved March 15, 2011, from
http://www.mecc.gov.to/index.php?option=com_content&view=article&id=204:solar-
electrification-programs&catid=186:renewable-energy&Itemid=226

146
Mimura, N. (1999). Vulnerability of island countries in the South Pacific to sea level rise and
climate change. Climate Research, 12: 137–143.
Minton, P. (2007). Wikimedia Commons Map: Namdrik Atoll. [Online]. Retrieved November 10,
2011, from http://en.wikipedia.org/wiki/File:Namorik_Atoll_-_Map.jpg
Nathan, N. (2010). Ta in Solar Power System. Adapted from UNESCO Solar Technical Training
Manual by Herbert Wade. Translated by Nelling Nathan. Majuro, RMI: Island Eco. 1-64.
Nguyen, K. (2007). Alternatives to grid extension for rural electrification: Decentralized renewable
energy technologies in Vietnam. Energy Policy, 35(4): 2579–2589.
Nieuwenhout, F., van Dijk, A., et al. (2001). Experience with Solar Home Systems in Developing
Countries: A Review. Progress in Photovoltaics: Research and Applications, 9: 454-474.
NZPNGBC (New Zealand Papua New Guinea Business Council) (2011). The Papua New Guinea
Energy Sector. [Online]. Retrieved November 2, 2011, from
http://nzpngbc.org.nz/index.php?option=com_content&view=category&layout=blog&id=4
6&Itemid=63
OECD-DAC (Organization of Economic Co-operation and Development: Development Assistance
Committee) (2005). The Paris Declaration on Aid Effectiveness. Paris, France. March 2,
2005: 1-23.
OECD-DCD (Organization of Economic Co-operation and Development, Development Co-
operation Directorate) (2012). Development Aid at a Glance 2012: Statistics by Region:
Oceania. Ch. 6, 1-12.
Origin Energy (2011). Electricity Tariffs: Residential customers. [Online]. Retrieved September 12,
2011, from http://www.originenergy.com.au/2087/Electricity-tariffs-QLD
Painuly, J. (2001). Barriers to renewable energy penetration; a framework for analysis. Renewable
Energy, 24: 73–89.
Palaki, A., Tukunga, T., et al. (2009). A Technical, Institutional, Environment and Economic
Impacts Assessment of the Mango and Mo‟unga‟one Solar Photovoltaic Rehabilitation
Project. Pacific Islands Greenhouse Gas Abatement through Renewable Energy Project
(PIGGAREP), 1-57.
Prasad, K. (2012). Implementation Status & Results, Pacific Islands Sustainable Energy Finance
Project (P098423). The World Bank: Global Environment Facility (GEF) East Asia and
Pacific.
PRISM (Pacific Regional Information System) (2010). Urban/ Rural Growth and Household Size.
Secretariat of the Pacific Community. [Online]. Retrieved January 30, 2011, from
http://www.spc.int/prism/urbanrural-growth-a-household-size
REEGLE (2011). Energy Profile Palau. [Online]. Retrieved August 30, 2011, from
http://www.reegle.info/countries/PW#sources

147
REN21 (2011). Renewables 2011: Global Status Report on Local Renewable Energy Policies.
Paris: REN21 Secretariat, 1-116.
REP-5 (2010). Support to the Energy Sector in Five ACP Pacific Island Countries. [Online].
Retrieved January 12, 2012, from http://www.rep5.eu/node/48
RMI Census (1999). RMI Census of Population and Housing. Majuro, RMI: Economic Policy,
Planning and Statistics Office: Census of Population 1999.
RMI National Energy Policy (2009). Republic of the Marshall Islands National Energy Policy and
Energy Action Plan. Majuro, RMI: Energy Planning Division, Ministry of Resources and
Development, 1-37.
Robson, C. (1993). Real world research : a resource for social scientists and practitioner-
researchers. Oxford, UK: Blackwell.
Roper, T. (2009). Representing the Climate Institute and the Global Sustainable Energy
Islands Initiative (GSEII). Pacific Power Association CEO‟s Conference, American Samoa,
August 2009.
Schelling, N., Hasson, M., et al. (2010). SIMbaLink: Towards a Sustainable and Feasible Solar
Rural Electrification System. Paper presented at ICTD2010, Royal Holloway, University of
London. December 13-16, 2010.
Smith, J. (2000). Solar-Based Rural Electrification and Microenterprise Development in Latin
America: A Gender Analysis. National Renewable Energy Laboratory, U.S. Department of
Energy, 1-25.
SolarBuzz (2011). Solar Market Research and Analysis: Module Pricing. [Online]. Retrieved
September 14, 2011, from http://solarbuzz.com/facts-and-figures/retail-price-
environment/module-prices
SolarRay (2012). Powerboards: Conversion and Control. [Online]. Retrieved April 22, 2012, from
http://www.solarray.com/CompletePackages/Powerboard_T.php
Soriano, M. (2007). Project Brief: Pacific Islands Greenhouse Gas Abatement through Renewable
Energy Project (PIGGAREP). United Nations Development Programme Global
Environment Facility (UNDP-GEF), 1-130.
Sovacool, B. (2008). Valuing the greenhouse gas emissions from nuclear power: A critical survey.
Energy Policy, 36: 2940-2953.
Sovacool, B., Agostino, A., & Malavika, J. (2011). The socio-technical barriers to Solar Home
Systems (SHS) in Papua New Guinea: ‗‗Choosing pigs, prostitutes, and poker chips over
panels.‘‘ Energy Policy, 39: 1532–1542.
Sovacool, B., Agostino, A., & Malavika, J. (2011a). Gers gone wired: Lessons from the Renewable
Energy and Rural Electricity Access Project (REAP) in Mongolia. Energy for Sustainable
Development, 15: 32–40.

148
SPC (Secretariat of the Pacific Community) (2011). Request for Proposal for Solar Photovoltaic
Home Systems. North REP Project. Noumea: New Caledonia: SPC Headquarters, 14 May
2011.
SPREP (South Pacific Regional Environment Program) (2009). Factsheet: Climate Change
Mitigation. Apia, Samoa: SPREP. July 2009.
SPREP (South Pacific Regional Environment Program) (2010). Pacific Islands Greenhouse Gas
Abatement through Renewable Energy Project. [Online]. Apia, Samoa. Retrieved August
10, 2010, from http://www.sprep.org/climate_change/piggarep.htm
SPREP (South Pacific Regional Environment Program) (2011). Renewable Energy in the Solomon
Islands, making a difference. Press Release: PIGGAREP. [Online]. Rarotonga, Cook
Islands. [Online]. Retrieved July 11, 2011, from
http://www.sprep.org/article/news_detail.asp?id=952
Subbarao, S. (2010). Renewable Energy Projects under the Clean Development Mechanism
(CDM). PhD Thesis, University of Otago, Dunedin, New Zealand, 1-401.
Syngellakis, K., Konings, P., et al. (2010). Renewable Energy Project: Support to the Energy
Sector in Five ACP Pacific Islands (REP-5). Programme Management Unit. Pacific Islands
Forum Secretariat European Commission – 9th EDF, 1-100.
Toloa, A. (2010). Tokelau National Strategic Plan: 1 July 2010 – 30 June 2015. Apia, Samoa:
Government of Tokelau, Office of the Council for Ongoing Government, 1-72.
Trading Economics (2011). Marshall Islands Indicators: IMF and World Bank Data. [Online].
Retrieved October 20, 2011, from http://www.www.tradingeconomics.com/marshall-
islands/indicators
Trading Economics (2011a). Vanuatu Indicators: IMF and World Bank Data. [Online]. Retrieved
October 20, 2011, from www.www.tradingeconomics.com/vanuatu/indicators
Twelve Volt Travel (2012). Twelve Volt TVs. [Online]. Retrieved January 12, 2012, from
http://www.12volt-travel.com/12-volt-televisions-c-684.html
Ualesi, S. (2011). Pacific Islands Greenhouse Gas Abatement through Renewable Energy
(PIGGAREP) - Implementation. PIGGAREP Project Manager, presented at IRENA
Workshop Accelerated Renewable Energy Deployment on Islands with Emphasis on the
Pacific Islands. Sydney: 26-28 October, 2011, 1-6.
UK Parliamentary Office for Science and Technology (2006). Postnote: Carbon Footprint of
Electricity Generation. Number 268: October 2006.
UN General Assembly (2007). United Nations Declaration on the Rights of Indigenous Peoples.
Resolution adopted by the United Nations General Assembly, 2 October 2007, 1-9.
UN Habitat (2005). Vanuatu Demography. [Online]. Retrieved November 10, 2011, from
http://ww2.unhabitat.org/habrdd/conditions/melanesia/vanuatu.htm
149
UNDP (United Nation Development Programme) (1999). Pacific Human Development Report
1999. Regional Reports: Asia and the Pacific. United Nations: New York.
UNDP (United Nation Development Programme) (2007). Pacific Islands Greenhouse Gas
Abatement through Renewable Energy (PIGGAREP) Project Document. Governments of
the Cook Islands, Fiji, Kiribati, Nauru, Niue, Papua New Guinea, Samoa, Solomon Islands,
Tonga, Tuvalu and Vanuatu; Global Environment Facility (GEF); and Secretariat of the
Pacific Regional Environment Programme (SPREP), 1-134.
UNESCAP (United Nations Economic and Social Commission for Asia and the Pacific) (2001).
Sustainable Energy Future: Policy Options, Barriers, and Action Plans. Energy Resources
Development Series, New York: United Nations. 38: 74-93.
UNICEF (United Nations Children's Fund) (2009). Protecting Pacific Island children and women
during economic and food crises. Working Edition One. Suva, Fiji: United Nations
Children's Fund Pacific Branch.
Urmee, T. (2009). Solar PV Electrification Programs in Developing Countries: Towards a Holistic
Approach. PhD Thesis, Murdock University, Australia, 1-315.
Urmee, T. & Harries, D. (2009). A survey of solar PV program implementers in Asia and the
Pacific regions. Energy for Sustainable Development, 13 (1): 24-32.
Urmee, T., Harries, D., & Schlapfer, A. (2009). Issues related to rural electrification using
renewable energy in developing countries of Asia and Pacific. Renewable Energy, 34: 354-
357.
USDOE (United States Department of Energy) (2011). State Energy Program (SEP): Territories.
Washington, DC. February 28, 2011, 1-11.
USDOS (United States Department of State) (2011). Background note: Vanuatu. Bureau of East
Asian and Pacific Affairs. [Online]. Retrieved November 12, 2011, from
http://www.state.gov/r/pa/ei/bgn/2815.htm
USDOS (United States Department of State) (2011a). Background note: Marshall Islands. Bureau
of East Asian and Pacific Affairs. [Online]. Retrieved November 12, 2011, from
http://www.state.gov/r/pa/ei/bgn/26551.htm
USEIA (United States Energy Information Administration) (2007). Independent Statistics and
Analysis: Country Energy Profiles. Retrieved June 1, 2010, from
http://tonto.eia.doe.gov/country/index.cfm
USEIA (United States Energy Information Administration ) (2011). Independent Statistics and
Analysis: Electricity. Washington, D.C.: United States Department of Energy. [Online].
Retrieved August 6, 2011, from
http://www.eia.gov/cneaf/electricity/page/at_a_glance/sales_tabs.html
van Alphen, K., Kunz, H., & Hekkert, M. (2008). Policy measures to promote the widespread
utilization of renewable energy technologies for electricity generation in the Maldives.
Renewable and Sustainable Energy Reviews, 12: 1959-1973.
150
van Alphen, K., van Sark, W., & Hekkert, M. (2007). Renewable energy technologies in the
Maldives—determining the potential. Renewable and Sustainable Energy Reviews, 11:
1650–1674.
Vanuatu‘s Energy Roadmap Launch (2011). Program for the Launch of the Development of
Vanuatu‟s Energy Roadmap. Holiday Inn Resort, Port Vila, Vanuatu. October 12-14, 2011.
Vleuten, F., Stam, R., & van der Plas, R. (2007). Putting solar home system programmes into
perspective: What lessons are relevant? Energy Policy, 35 (3): 1439–1451.
VNSO (Vanuatu National Statistics Office) (2009). Vanuatu National Statistics Office: Marriage,
families and households. [Online]. Retrieved April 11, 2012, from
http://www.vnso.gov.vu/index.php?option=com_content&view=article&id=19&Itemid=26
Wade, H. (2004). Pacific Regional Energy Assessment 2004: Kiribati National Report, Volume 5.
Apia, Samoa: South Pacific Regional Environment Program, 1-78.
Wade, H. (2004a). Pacific Regional Energy Assessment 2004: Marshall Islands National Report,
Volume 6. Apia, Samoa: South Pacific Regional Environment Program, 1-74.
Wade, H. (2004b). Pacific Regional Energy Assessment 2004: Tonga National Report, Volume 14.
Apia, Samoa: South Pacific Regional Environment Program, 1-73.
Wade, H. (2004c). Pacific Regional Energy Assessment 2004: Tuvalu National Report, Volume 15.
Apia, Samoa: South Pacific Regional Environment Program, 1-73.
Wade, H. (2005). Renewable Energy Technology Support Programme for the Pacific Islands.
Pacific Islands Renewable Energy Project. Apia, Samoa: South Pacific Regional
Environment Program, 1-32.
Wade, H. (2005a). Demonstration projects to showcase the business angle of renewable energy
service delivery in the Pacific Islands. Pacific Islands Renewable Energy Project. Apia,
Samoa: South Pacific Regional Environment Program, 1-44.
Wade, H., Johnston, P., & Vos, J. (2004). Pacific Regional Energy Assessment 2004: Regional
Overview Report. Apia, Samoa: South Pacific Regional Environment Program, 1-106.
Webb, A. & Kench, P. (2010). The dynamic response of reef islands to sea-level rise: Evidence
from multi-decadal analysis of island change in the Central Pacific. Global and Planetary
Change, 72 (3): 234-246.
Wikimedia Commons (2006). Wikimedia Commons Map: Malekula. [Online]. Retrieved
November 10, 2011, from http://en.wikipedia.org/wiki/File:MalakulaMap.png
Woodruff, A. (2007). An Economic Assessment of Renewable Energy Options for Rural
Electrification in Pacific Island Countries. Pacific Islands Applied Geoscience Commission
Technical Report 397. Suva, Fiji: SOPAC Secretariat, 1-92.

151
World Bank (2003). Monitoring and Evaluations in Rural Electrification Projects: A Demand-
Oriented Approach. Washington, DC, USA: The World Bank, Winrock International, and
the Mallika Consultants, 1-151.
WOR (World of Renewables) (2011). News: Noumea Sets Renewable Energy Targets [Online].
Retrieved September 19, 2011, from
http://www.worldofrenewables.com/vbnews.php?do=viewarticle&artid=2390&title=noume
a-sets-renewable-energy-targets
Yu, X., Gilmour, A., & Taplin, R. (1996). Current limitations on further introduction of renewable
energy systems in the South Pacific. Energy Policy, 24(8): 697-711.
Yu, X. & Taplin, R. (1997). A survey: international aid for renewable energy in the Pacific Islands
since the 1970s. Energy Policy, 25 (5): 501-516.
Yu, X., Taplin, R., & Akura, T. (1997). A framework for energy policy-making in the Pacific
Islands. Energy Policy, 25(12): 971-982.

152
Respondent 1 (2011). Vanuatu Energy Unit (VEU). Port Vila, Vanuatu: Vanuatu Nation
Government. Interview, October 2011.
Respondent 2 (2011). RMI Energy Services Program (ESP). Majuro, Marshall Islands: RMI
National Government. Scoping exercises, February 2011.
Respondent 3 (2011). RMI RE Entrepreneur. Majuro, Marshall Islands. Interview, April 2011.
Respondent 4 (2011). Secretariat of the Pacific Community (SPC) Energy Division. Suva, Fiji:
Regional Organization. Scoping exercises, January 2011.
Respondent 5 (2011). Vanuatu RE Entrepreneur #1. Port Vila, Vanuatu. Interview, October 2011.
Respondent 6 (2011). Akhamb Island Solar Technician. Akhamb Island, Malekula, Vanuatu.
Interview, October 2011.
Respondent 7 (2011).Vanuatu AusAid Representative. Port Vila, Vanuatu: Australian Aid Office.
Interview, October 2011.
Respondent 8 (2011). Vanuatu RE Entrepreneur #2. Port Vila, Vanuatu. Interview, October 2011.
Respondent 9 (2011). Ailinglaplap resident, RMI. Majuro, Marshall Islands. Scoping exercises,
March 2011.
Respondent10 (2011). RMI Local Government Representative #1. Majuro, Marshall Islands.
Interview, March 2011.
Respondent 11 (2011). RMI Local Government Representative #2. Majuro, Marshall Islands.
Interview, March 2011.
Respondent 12 (2011). RMI National Government Representative. Majuro, Marshall Islands:
Ministry of Resources and Development. Interview, March 2011.
Respondent 13 (2011). RMI Local Government Representative #3. Majuro, Marshall Islands.
Interview, April 2011.
Respondent 14 (2011). Vanuatu RE NGO #1. Port Vila, Vanuatu. Interview, October 2011.
Respondent 15 (2011). Vanuatu RE Entrepreneur #3. Port Vila, Vanuatu. Interview, October 2011.
Respondent 16 (2011). Vanuatu RE Entrepreneur #4. Port Vila, Vanuatu. Interview, October 2011.
Respondent 17 (2011). Vanuatu RE Entrepreneur #5. Port Vila, Vanuatu. Interview, October 2011.
Respondent 18 (2011). Vanuatu RE NGO #2. Port Vila, Vanuatu. Interview, October 2011.
Respondent 19 (2012). RMI Utility Company. Majuro, Marshall Islands. Electronic
communication, April 2012.
Personal Communication References:
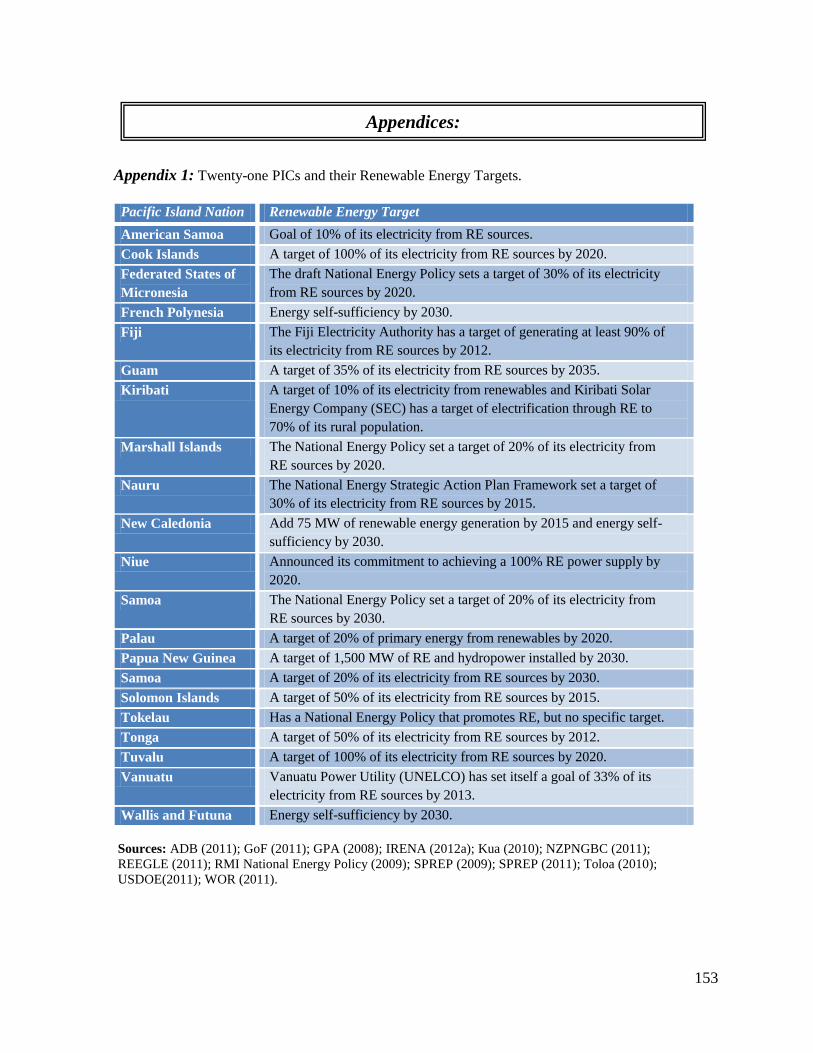
153
Appendix 1: Twenty-one PICs and their Renewable Energy Targets.
Pacific Island Nation Renewable Energy Target
American Samoa Goal of 10% of its electricity from RE sources.
Cook Islands A target of 100% of its electricity from RE sources by 2020.
Federated States of
Micronesia
The draft National Energy Policy sets a target of 30% of its electricity
from RE sources by 2020.
French Polynesia Energy self-sufficiency by 2030.
Fiji The Fiji Electricity Authority has a target of generating at least 90% of
its electricity from RE sources by 2012.
Guam A target of 35% of its electricity from RE sources by 2035.
Kiribati A target of 10% of its electricity from renewables and Kiribati Solar
Energy Company (SEC) has a target of electrification through RE to
70% of its rural population.
Marshall Islands The National Energy Policy set a target of 20% of its electricity from
RE sources by 2020.
Nauru The National Energy Strategic Action Plan Framework set a target of
30% of its electricity from RE sources by 2015.
New Caledonia Add 75 MW of renewable energy generation by 2015 and energy self-
sufficiency by 2030.
Niue Announced its commitment to achieving a 100% RE power supply by
2020.
Samoa The National Energy Policy set a target of 20% of its electricity from
RE sources by 2030.
Palau A target of 20% of primary energy from renewables by 2020.
Papua New Guinea A target of 1,500 MW of RE and hydropower installed by 2030.
Samoa A target of 20% of its electricity from RE sources by 2030.
Solomon Islands A target of 50% of its electricity from RE sources by 2015.
Tokelau Has a National Energy Policy that promotes RE, but no specific target.
Tonga A target of 50% of its electricity from RE sources by 2012.
Tuvalu A target of 100% of its electricity from RE sources by 2020.
Vanuatu Vanuatu Power Utility (UNELCO) has set itself a goal of 33% of its
electricity from RE sources by 2013.
Wallis and Futuna Energy self-sufficiency by 2030.
Sources: ADB (2011); GoF (2011); GPA (2008); IRENA (2012a); Kua (2010); NZPNGBC (2011);
REEGLE (2011); RMI National Energy Policy (2009); SPREP (2009); SPREP (2011); Toloa (2010);
USDOE(2011); WOR (2011).
Appendices:
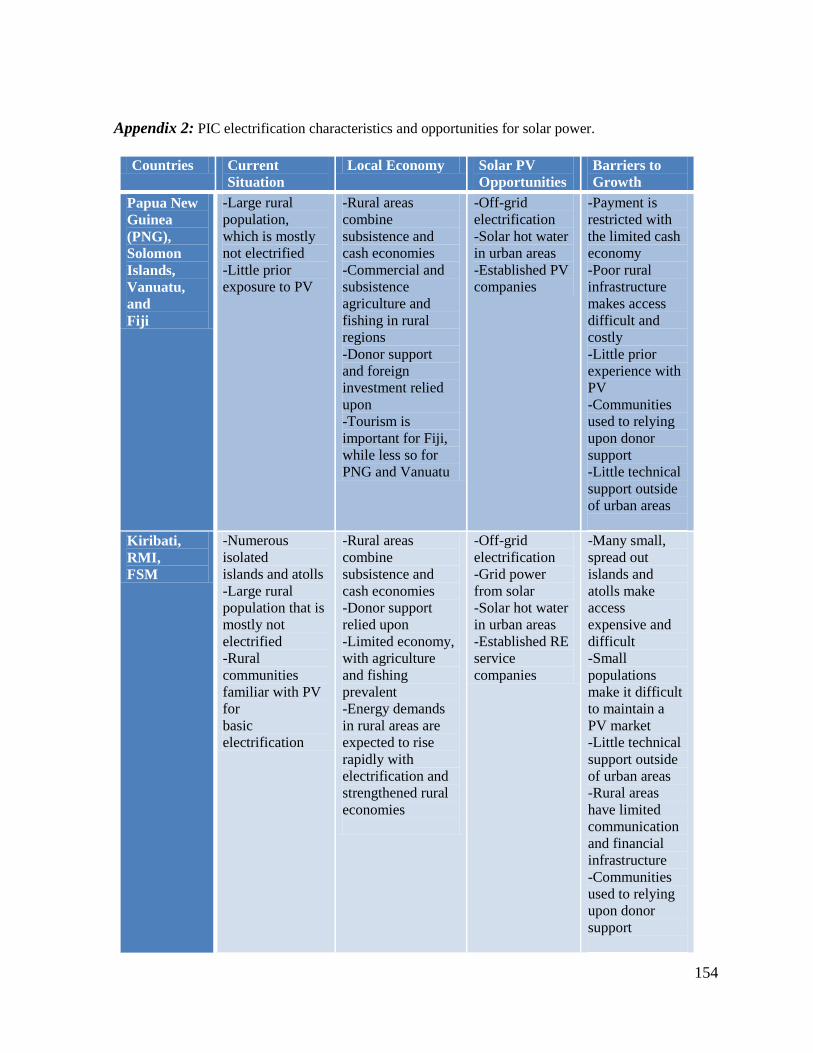
154
Appendix 2: PIC electrification characteristics and opportunities for solar power.
Countries Current
Situation
Local Economy Solar PV
Opportunities
Barriers to
Growth
Papua New
Guinea
(PNG),
Solomon
Islands,
Vanuatu,
and
Fiji
-Large rural
population,
which is mostly
not electrified
-Little prior
exposure to PV
-Rural areas
combine
subsistence and
cash economies
-Commercial and
subsistence
agriculture and
fishing in rural
regions
-Donor support
and foreign
investment relied
upon
-Tourism is
important for Fiji,
while less so for
PNG and Vanuatu
-Off-grid
electrification
-Solar hot water
in urban areas
-Established PV
companies
-Payment is
restricted with
the limited cash
economy
-Poor rural
infrastructure
makes access
difficult and
costly
-Little prior
experience with
PV
-Communities
used to relying
upon donor
support
-Little technical
support outside
of urban areas
Kiribati,
RMI,
FSM
-Numerous
isolated
islands and atolls
-Large rural
population that is
mostly not
electrified
-Rural
communities
familiar with PV
for
basic
electrification
-Rural areas
combine
subsistence and
cash economies
-Donor support
relied upon
-Limited economy,
with agriculture
and fishing
prevalent
-Energy demands
in rural areas are
expected to rise
rapidly with
electrification and
strengthened rural
economies
-Off-grid
electrification
-Grid power
from solar
-Solar hot water
in urban areas
-Established RE
service
companies
-Many small,
spread out
islands and
atolls make
access
expensive and
difficult
-Small
populations
make it difficult
to maintain a
PV market
-Little technical
support outside
of urban areas
-Rural areas
have limited
communication
and financial
infrastructure
-Communities
used to relying
upon donor
support

155
Palau,
Nauru,
Tuvalu,
Tonga,
Samoa,
Niue,
Tokelau
-Large urban or
semi-urban
population
-Rural
electrification
nearly complete
or completed
-Rural
communities
familiar with
PV for basic
electrification
-Have had long-
term
electrification
projects
-Largely a cash
economy, although
subsistence
agriculture and
fishing is still
practiced
-Donor support is
significant
-Agriculture and
fisheries are the
basis of the
economy
-Tourism is
significant for
Palau, Tonga, and
Samoa
-Grid power
from PV
-Some have
large PV
installations
-Solar hot water
in urban areas
-Small
populations
limit market
growth
-Tokelau‘s rural
areas are costly
to access
-Tonga and
Tuvalu have
many isolated
islands
-Utilities are
limited in size
-Small
economies of
scale for solar
PV
Sources: Adapted from Wade (2005).

156
Sustainability
dimension Key variable Indicator
Technical
development
Operation and
maintenance
Efficiency
Conformance with national standards
Technical losses
Compatibility with future grid service
Availability of support infrastructure
Technical client-
relation issues
Daily operation services
Availability of services
Economic
development
Financial
perspective
Profitability
Costs for operation and maintenance
Costs for capital and installation
Share of profit set aside for re-investment in
electricity service business
Tariff lag
Development of
productive uses
Share of electricity consumed by businesses
Share of electrified households using electricity for
income-generating activities
Employment
generation
Business development
Competition Number of electricity service organizations in the area
Social/ethical
development
Improved
availability of
social electricity
services
Share of health centres and schools with electricity
Number of street lights in the area
Share of public places and specialised businesses
where TV/telecommunication/internet is provided
Credit facilities
Micro-credit possibilities available for electricity
services connection
Equal
distribution
Share of population with primary school education
Share of population with access to electricity
Distribution of electricity client households in income
groups
Subsidies offered for electricity services
Share of economically active children
Environmental
development
Global impact Share of renewable energy in production
Emissions of carbon dioxide from production
Local impact
Share of electrified households where electricity has
replaced other energy sources for lighting
Share of electrified households where electricity has
Appendix 3: Ilskog‘s (2008) thirty-six indicators for evaluating RE projects‘ effects on
sustainable development globally.

157
replaced other energy sources for cooking of main
meals
Any serious local environment impact identified
Organisational/
institutional
development
Capacity
strengthening
Share of staff and management with appropriate
education
Degree of local ownership
Number of shareholders
Share of women in staff and management
Staff turnover in organisation
Number of years in business
Source: Ilskog (2008).

158
Social
Sustainability
Socio-cultural
Respect
A socially acceptable project is built on an
understanding of local traditions and core values.
Community
Participation
A process which fosters empowerment and ownership
in community members through direct participation in
development decision-making affecting the
community.
Political Cohesion
Involves increasing the alignment of development
projects with host country priorities and co-ordinating
aid efforts at all levels (local, national, and
international) to increase ownership and efficient
delivery of services.
Economic Sustainability
Implies that sufficient local resources and capacity
exist to continue the project in the absence of outside
resources.
Environmental Sustainability
Implies that non-renewable and other natural resources
are not depleted nor destroyed for short-term
improvements.
Appendix 4: Chow‘s (2010) five factors for sustainable development, adapted from
McConville (2006).
Source: Chow (2010).

159
Source: Urmee & Harries (2009).
Appendix 5: Urmee & Harries‘ (2009) indicators for successful program implementation.

160
Appendix 6:Questionnaires for SHS users in the case study communities of Namdrik Atoll and Akhamb Island.
Questionnaires were translated into the local language and a few questions were omitted at each
location that were inappropriate for the given projects (see details below). The corresponding
indicator is listed in the column on the right.
Please answer these questions about your home: 1. What is your gender?
Male Female
2. How many people live in your house?
0 1 2 3 4 5 6 7
8 9 10 11 12 or more
3. How many people in your house are employed?
0 1 2 3 4 5 6 7
8 9 10 11 12 or more
4. What is the average income of your household biweekly in
total (USD)?
$0-49 $50-99 $100-149 $150-199
$200-249 $250 or more
5. What is your household’s primary source of income?
teacher health worker
farmer or fisherman business owner
council man/local government worker
construction worker police
pastor or other church work make handicrafts
judge/chief other _____________
6. What is the highest level of education of the people in your
house?
primary middle school high school
college/ university
Answer these questions regarding your solar history: 7. Does the house have any other power source currently? What
source?
none portable solar lantern generator
battery SHS kerosene other
______________
8. What did the house use for lighting before their most recent
SHS?
portable solar lantern generator kerosene
battery powered light SHS other
______________
1) Gender inclusiveness
2) Appropriate equipment use
2 – 5) Also, affordability
5) Also, effectiveness in
changing community
livelihoods
6) Familiarity with the
technology
7) Effectiveness in meeting
users’ needs
7-8) Also, effectiveness in
improving the environment
8) Affordability

161
9. What do you use your solar powered lights for (you can
choose more than one)?
cooking eating with studying reading
making things to sell
selling things at night business related work
other ______________
10. If you have a freezer, what do you use it for (you can choose
more than one)? (this question was excluded for Akhamb, as
only 1 user had a freezer).
food storage for the people in this house
food storage for other houses
to store something to sell here
to store something to export to town
other ______________
11. Why did your family decide to purchase solar systems
(choose one)?
Because we thought it would be a cheaper energy source
Because we wanted to expand our energy uses
Because we thought it could be used to improve our income
Because it is easier to use than other power sources
Other___________________________________
12. How many different solar systems has your family had in
your house?
1 2 3 4 5 6 7 or more
13. How many years ago was your family’s first solar system
installed?
0 1 2 3 4 5 6
7 8 9 10 11 12 13
14 15 or more I don‘t know
Answer these questions about your current solar
system (some of these questions were omitted for
Namdrik Atoll, as they did not apply to the Island
Eco installed system): 14. Who is responsible for repairing your current solar
system?
Me or my family The national government
The local government A solar company
A community member Someone else
________________
15. Were you involved in designing your current solar system to
meet your needs?
No A little bit- we could choose options
Yes, my family designed it
9-10) Effectiveness in
changing community
livelihoods
10-11) Also, willingness to pay
12-13) Familiarity with the
technology
13) Also, effectiveness in
improving the environment
14-16) Participation and
ownership
15) Also, effectiveness in
meeting users’ need

162
16. Are you allowed to fix or add parts to this system yourself?
No Yes
17. If you are renting your current system, how much money
did your family spend per month?
$__________/ month
18. If you own your current system, how much does your
family spend on your solar system per year to fix and maintain
it?
$0-49 $50-99 $100-149 $150-199 $200-
249 $250 or more
19. Do you think your family now spends more or less on your
current solar system than on your previous energy source
before solar?
More Less The same
20. Is your current solar system working now?
No Yes
If Yes:
21. Have any parts been replaced?
Yes Which part(s)? _________________________
No I don‘t know
If No:
22. Why is the system no longer working?
I don‘t know - it broke and no one knew what was wrong
The person who was supposed to repair it wasn‘t available
Spare parts were not available
My family didn‘t have enough money to repair it
We didn‘t want to repair it
We bought another power system instead
We bought a second hand system that doesn‘t work well
Other_______________________________
23. How well is your current solar system repaired and
maintained?
Not well Somewhat well Very well
24. How well overall do the lights work on your current solar
system?
Not well Somewhat well Very well
16) Also, ability to
satisfy expanding
energy demands
17-18) Cost-
effectiveness;
Affordability
19) Affordability;
Willingness to Pay
20-21) Appropriate
equipment use;
Effectiveness in
improving the
environment
22-24) Availability of
resources and support

163
25. Current Solar System details:
Solar Panel wattage: ________________W
Battery amps: ______________amps
Battery type: Solar Battery Car Battery
Number of lights: 0 1 2 3 4 5
6 7 8 or more
Other appliances used: TV Stereo
Other ____________________________________
26. What appliance would you like to add to your system if you
could—choose only one?
More lights TV Stereo Freezer
Other ____________________________________
27. Did you or your family participate in the installation of your
current solar system?
No A little bit Yes
28. Do you feel sure that you or someone in your family will be
able to fix this solar system if it breaks?
Not at all A little bit Somewhat Very much
29. Do you feel sure that someone in your community will be
able to fix this solar system if it breaks?
Not at all A little bit Somewhat Very much
30. If someone in your community were not able to fix it, how
sure are you that you could get help from someone in the
capital?
Not at all A little bit Somewhat Very much
31. How willing are you to spend money to get this solar system
fixed if it breaks in the future?
Not at all A little bit Somewhat Very much
Answer these questions only if you had a previous solar
system before your current one (this section was only
relevant for Namdrik Atoll, as only one user on Akhamb
had a previous SHS): 32. Who was responsible for repairing your previous solar
system?
Me or my family The national government
The local government A solar company
A community member Someone else
_____________
33. Were you involved in designing your previous solar system
to meet your needs?
No A little bit - we could choose options
Yes, my family designed it
25) Appropriate
equipment use; Cost-
effectiveness;
Effectiveness in
changing community
livelihoods; Gender
inclusiveness;
Effectiveness in
improving the
environment
26) Effectiveness in
meeting users’ needs
27) Capacity building
28) Familiarity with the
technology
29-30) Availability of
resources and support
31) Willingness to pay
32-33) Participation and
ownership
33) Also effectiveness in
meeting users’ needs

164
34. Were you allowed to fix or add parts to this system
yourself?
No Yes
35. If you were renting your previous system, how much money
did your family spend per month?
$__________/ month
36. If you owned your previous system, how much did your
family spend on your solar system per year to fix and maintain
it?
$0-49 $50-99 $100-149 $150-199
$200-249 $250 or more
37. Is your previous solar system still working?
No Yes
If Yes:
38. Have any parts been replaced?
Yes Which part(s)?_________________________
No I don‘t know
If No:
39. Why is the system no longer working?
I don‘t know - it broke and no one knew what was wrong
The person who was supposed to repair it wasn‘t available
Spare parts were not available
My family didn‘t have enough money to repair it
We didn‘t want to repair it
We bought another power system instead
We bought a second hand system that doesn‘t work well
Other_______________________________
40. How well was your previous solar system repaired and
maintained?
Not well Somewhat well Very well
41. How well overall did the lights and appliances work on your
previous solar system?
Not well Somewhat well Very well
42. If your previous system is no longer working, how many
years did it work for in total?
0 1 2 3 4 5 6
7 8 9 10 11 12 13
14 15 or more Don‘t know
43. How many watts was this previous system? __________W
34) Ability to satisfy
expanding energy
demands
35-36) Cost-
effectiveness
37) Effectiveness in
improving the
environment
37-38) Also, appropriate
equipment use
39-41) Availability of
resources and support
42-43) Appropriate
equipment use
43) Also, cost-
effectiveness

165
Answer these questions regarding your solar knowledge
and training (all respondents): 44. How many of the people in your family have been taught to
maintain and fix solar systems?
0 1 2 3 4 5 6 7
8 9 10 or more
45. How many men in your family feel confident maintaining
and fixing a solar system?
0 1 2 3 4 5 6 7
8 9 10 or more
46. How many women in your family feel confident maintaining
and fixing a solar system?
0 1 2 3 4 5 6 7
8 9 10 or more
47. If anyone in your family is confident repairing a SHS, where
did they learn or gain their confidences?
From a solar training
I have learned from repairing my own solar system
I have learned from repairing other people‘s solar system
I have watched people install solar systems
I have helped install solar systems
My friend/ family member taught me
I have learned from using other electrical products
I learned from reading or studying electricity or solar
A solar company worker taught me
Other ____________________________________________
48. If a solar training workshop were to happen in your
community, would you come?
Yes Maybe No
Answer these questions regarding your solar preferences: 49. How important is it to you that you own your own solar
system and you are responsible for it?
Not at all A little bit Somewhat important
Very important
50. How important is it to you that you know how to repair and
maintain your own solar system?
Not at all A little bit Somewhat important
Very important
51. How important is it to you that you design your system and
can change or add to it (add solar panels/ lights)?
Not at all A little bit Somewhat important
Very important
44) Capacity building
45-47) Familiarity with the technology
45-46) Also, gender
inclusiveness
48) Capacity building
49) Participation and
ownership
50) Capacity building
51-53) Effectiveness in
meeting users’ needs

166
52. How important is having a solar system to your family
(compared to another power source)?
Not at all A little bit Somewhat important
Very important
53. How much do you trust solar as a reliable power source for
your house?
Not at all A little bit Somewhat Very much

167
Appendix 7: Interview questions for key stakeholders in Vanuatu and the Marshall Islands and the
indicators each question addressed.
Interview Questions Indicators Addressed
1. What household-scale solar projects
has your organization been involved in
in Vanuatu/ Marshall Islands? What
were the size and purpose of these
projects?
1. Appropriate equipment use
2. Effectiveness in meeting users‘ needs
5. Effectiveness in changing community
livelihoods
14. Effectiveness in improving the environment
2. What role did your organization play
in developing and implementing these
projects?
6. Availability of resources and support
12. Participation and ownership
3. When were these systems installed and
by whom? Are they still working
properly?
1. Appropriate equipment use
2. Effectiveness in meeting users‘ needs
4. Were the household users involved in
designing or installing the projects?
How?
3. Ability to satisfy expanding energy demands
9. Gender inclusiveness
12. Participation and ownership
5. Did the users pay for their own
systems? Do the users own their own
systems?
3. Ability to satisfy expanding energy demands
4. Cost-effectiveness
10. Affordability
12. Participation and ownership
13. Willingness to pay
6. Was any training provided? By whom
and to whom?
6. Availability of resources and support
8. Capacity Building
9. Gender inclusiveness
11. Familiarity with the technology
7. Who is responsible for maintaining
the systems? Who supplies spare
parts?
6. Availability of resources and support
7. Availability of system components
8. Capacity Building
12. Participation and ownership
8. Who pays for the maintenance? Were
there any problems with this?
4. Cost-effectiveness
10. Affordability
9. In your opinion have the systems been
properly maintained?
2. Effectiveness in meeting users‘ needs
14. Effectiveness in improving the environment

168
10. How do you think these projects could
have been improved in order to
produce more enduring outcomes?
All
11. How important do you see
participation by users in solar projects
to be? How can they best be integrated
into project design and
implementation?
6. Availability of resources and support
9. Gender inclusiveness
11. Familiarity with the technology
12. Participation and ownership
12. How important do you think it is for
users to own their own systems or for
utilities/companies to own household
solar systems in rural communities in
order to make them last?
All
13. What do you think is the most
important factor in making solar
projects last in the outer islands?
All
14. What issues do you see for using solar
as a major power source for rural
electrification in Vanuatu/ Marshall
Islands?
All
15. Do you have any other comments
about solar in Vanuatu/ Marshall
Islands?
All

169
Appendix 8: A summary of the history of SHS projects implemented in the RMI, based on information in the literature and project
documents. The indicators addressed by the positive and negative results are referred to by indicator number.
Country Project, Date,
and Involved
Parties
Specifications Model Used Positives Negatives Lessons Learned
RMI Rural
Electrification
1980s - 1990s Organizer:
Alternative
Energy Fund
and the RMI
Government
Funding:
US
Government
and the Pacific
Island Forum
Secretariat
(PIFS)
-A micro-grid was
set up on Utrok
Atoll in the 1980s
through US funding,
but failed due to no
organized
maintenance
-132 SHSs installed
on various atolls
-Project-initiated
user-owned: rent
to own
-Basic O&M
was handled
locally with
irregular visits
from a
government
technician
-Most SHSs
until the late
1990s were
funded through
an Alternative
Energy Fund in
the RMI
-Introduced solar
PV to multiple
atolls so that most
communities were
familiar with solar
PV by 2000 (11)
-Both technical and
maintenance issues resulted
in many of the systems
failing (6)
-Communities were
responsible for basic
maintenance without any
training (8)
-Users paid a minimal
amount for systems,
resulting in a lack of
ownership (12)
-Training and
familiarity with the
technology is necessary
for users to properly
handle their SHSs
-The lack of a long-
term O&M policy leads
to project failure
-Users must contribute
to the cost of their
SHSs in order to instill
a sense of ownership
Namdrik
Atoll: 1996
Organizer:
Marshalls
Alternative
Energy
Company
(MAEC)
Funding:
French
Government
-Provided 134
SHSs, and six large
refrigerator systems
-Fees were $8 per
month with no
installation fee
-RESCO, with
MAEC, owning
the systems and
providing
servicing
-Pre-payment
metering was
used to pay fees
and users were
disconnected
after 3 months of
non-payment
-A pre-feasibility
study and a
survey of
homeowners was
carried out prior
to project
implementation
(2,12)
-The RESCO
concept was
introduced to the
locals in a
community
meeting (12)
-The chiefs used the
refrigeration systems for
themselves, when they were
intended to be for the
community (5, 12)
-Payments were too
complicated as the
prepayment meters had
technical difficulties, and
there were difficulties
transmitting the codes
through radio to Namdrik
each month (1)
-Non-transparency of
accounts and other issues
led to clashes between the
-Community-shared
systems often do not
work out, due to
ownership being
unclear
-All stakeholders must
be involved in project
planning in order for it
to run smoothly
-Transparency is
necessary to prevent
unnecessary
speculation
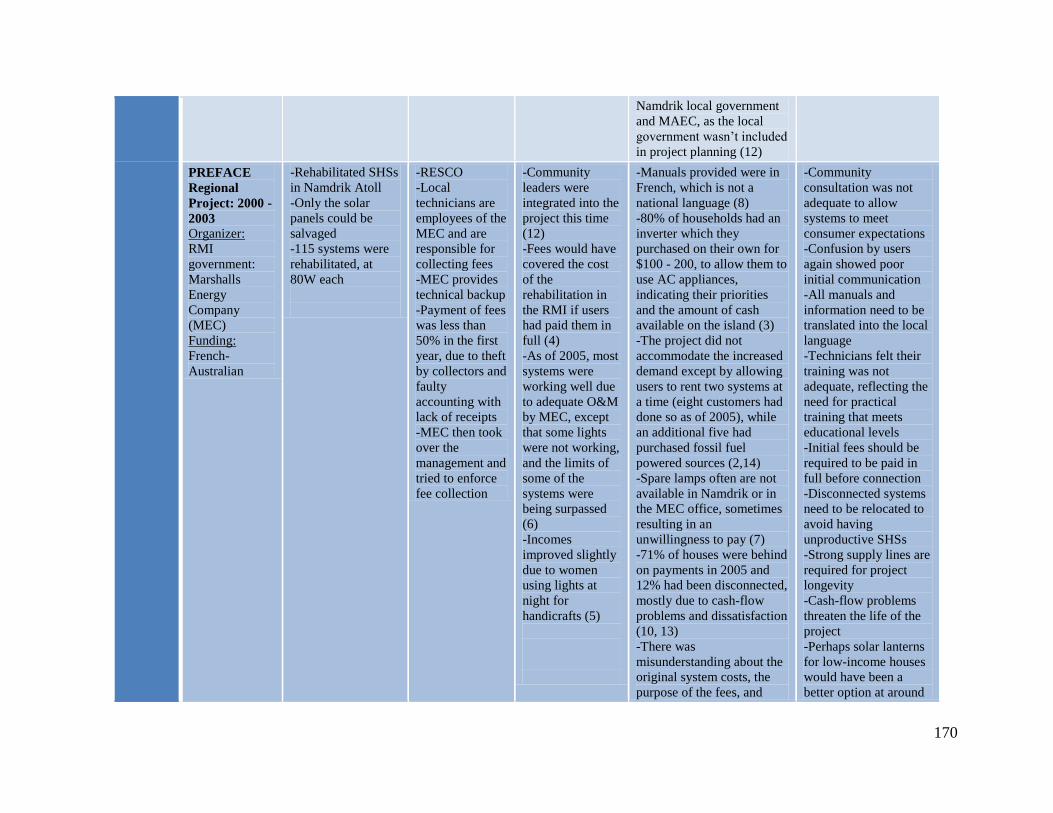
170
Namdrik local government
and MAEC, as the local
government wasn‘t included
in project planning (12)
PREFACE
Regional
Project: 2000 -
2003 Organizer:
RMI
government:
Marshalls
Energy
Company
(MEC)
Funding:
French-
Australian
-Rehabilitated SHSs
in Namdrik Atoll
-Only the solar
panels could be
salvaged
-115 systems were
rehabilitated, at
80W each
-RESCO
-Local
technicians are
employees of the
MEC and are
responsible for
collecting fees
-MEC provides
technical backup
-Payment of fees
was less than
50% in the first
year, due to theft
by collectors and
faulty
accounting with
lack of receipts
-MEC then took
over the
management and
tried to enforce
fee collection
-Community
leaders were
integrated into the
project this time
(12)
-Fees would have
covered the cost
of the
rehabilitation in
the RMI if users
had paid them in
full (4)
-As of 2005, most
systems were
working well due
to adequate O&M
by MEC, except
that some lights
were not working,
and the limits of
some of the
systems were
being surpassed
(6)
-Incomes
improved slightly
due to women
using lights at
night for
handicrafts (5)
-Manuals provided were in
French, which is not a
national language (8)
-80% of households had an
inverter which they
purchased on their own for
$100 - 200, to allow them to
use AC appliances,
indicating their priorities
and the amount of cash
available on the island (3)
-The project did not
accommodate the increased
demand except by allowing
users to rent two systems at
a time (eight customers had
done so as of 2005), while
an additional five had
purchased fossil fuel
powered sources (2,14)
-Spare lamps often are not
available in Namdrik or in
the MEC office, sometimes
resulting in an
unwillingness to pay (7)
-71% of houses were behind
on payments in 2005 and
12% had been disconnected,
mostly due to cash-flow
problems and dissatisfaction
(10, 13)
-There was
misunderstanding about the
original system costs, the
purpose of the fees, and
-Community
consultation was not
adequate to allow
systems to meet
consumer expectations
-Confusion by users
again showed poor
initial communication
-All manuals and
information need to be
translated into the local
language
-Technicians felt their
training was not
adequate, reflecting the
need for practical
training that meets
educational levels
-Initial fees should be
required to be paid in
full before connection
-Disconnected systems
need to be relocated to
avoid having
unproductive SHSs
-Strong supply lines are
required for project
longevity
-Cash-flow problems
threaten the life of the
project
-Perhaps solar lanterns
for low-income houses
would have been a
better option at around

171
who should pay for spare
lamps, and therefore users
felt the fees were unfair (12,
13)
$50 - 100 each
-System design needs
to consider the
increasing demands
REP-5
Regional
Project:
Organizer: REP
5 Project
Management
Unit, MEC
Funding: EU
-440 systems of
200W each installed
on Ailinglaplap
Atoll, serving every
household
(approximately
2,000 people)
-RESCO, with
MEC
responsible for
maintaining the
systems and
providing spare
parts
-Fees were
reduced from
$12 per month
to $5 due to
users not paying
-There was a
20% failure rate
on charge
controllers for
unknown
reasons and 70%
failure on lights
due to poor
quality lights
-The project
provided spare
parts to MEC, so
equipment was
available for
awhile after
installation (7)
-The people of
Ailinglaplap,
though
discouraged by
this project, still
felt solar PV was
a good technology
for rural
electrification (1,
2)
-Fee collection was poor,
with fees not being
collected in certain areas,
and disconnection policies
were varying in different
areas (10,13)
-Training to users on how to
read their charge controllers
was not provided (8)
-MOUs were signed for
various tasks but the
commitments made were
soon forgotten (12)
-Inappropriate equipment
was used for the climate, as
battery boxes were not
vented, thus causing some
batteries to overheat (1)
-Technicians‘ wages were
approximately $110 per
month, meaning 22 systems
were needed with fees of $5
just to pay for one
technician (there were 8 at
the beginning of the project)
(4)
-Project policies need
to be consistent in all
locations
-Basic training needs to
be provided to users
even if they are not
responsible for O&M
-Users placed indoor
lights outdoors, which
reflected that the
systems were not
meeting their needs
-Project sustainability
is threatened by low
fees and users not
paying
-Equipment should be
tested for durability in
the PICs
Sources: Ailinglaplap resident, RMI, Respondent 9 (2011); Empower (2005); MEC (2008); Syngellakis et al. (2010); Wade (2004a); Wade (2005)

172
Appendix 9: A summary of the history of SHS projects implemented in Vanuatu, based on information in the literature and project
documents. The indicators addressed by the positive and negative results are referred to by indicator number.
Country Project, Date,
and Involved
Parties
Specifications Model Used Positives Negatives Lessons Learned
Vanuatu
Energy Unit
Electrification
Project, Efate,
Malekula and
Umbae Island:
1999 - 2001 Organizer:
Vanuatu
Energy Unit
Funding:
Vanuatu
Energy Unit
and JICA
-100 W systems
installed at 265
households
-Users paid $90 US
connection fee and
$15 per month
-RESCO using
prepayment
meters
-A ‗local
caretaker‘
handled O&M
-JICA also
provided a RE
expert to the
Energy Unit for
5 years to help
manage the
projects
-Maintenance was
reliable in Efate
as the systems
were near to the
capital, Port Vila
(6)
-Users
complained that
fees were too high
and the
government
responded by
giving options for
payment
according to how
many lights users
wanted (2, 12)
-Nearly 20% of systems
were removed by 2004 due
to users failure to pay the
fees as users did not
understand why they had to
continue to pay when the
project was donor-funded
(12)
-Prepayment meters
malfunctioned and the
Energy Unit lacked
expertise to fix them, so
they were removed, which
was costly (1)
-Users also said the solar
systems were too small -
only provided lights (2)
-Users were not trained
during the project except for
the very basics (8)
-Lack of proper
explanations with users
and transparency of
funds hindered project
success
-SHSs need to be sized
to fit user needs
-User training would
have aided in project
longevity
-Complex technologies
which have not been
tested in PICs may
create issues with
maintenance
PREFACE
Regional
Project: 2001 Organizer:
Vanuatu
government
Funding:
French-
Australian
-Demonstration PV
projects in 40
government staff
houses (mostly rural
teachers) and public
buildings
-RESCO
-Both Energy
Unit staff and
‗local caretakers‘
handled O&M
-Technical
performance was
high as systems
were designed
and installed
correctly (1)
-Fees were paid
regularly as they
were deducted
from staff salaries
(10)
-Fees did not cover the cost
of the project (4)
-Success varied according to
the access to caretakers and
the knowledge of staff, who
were untrained (6,11)
-People with regular
incomes are much more
likely to pay fees on
time
-Technicians need to be
available locally
-User training would
have aided in project
longevity

173
The Light Up
Vanuatu
Project:
2010-12 Organizer:
Vanuatu
Energy Unit
Funding:
AusAid
-Release 24,000
small solar lanterns
into rural
communities, 1.5 -
15W (mostly made
by D.lite and
Barefoot Power).
-The lanterns were
under maintenance
for 1 year
-Most of these
lanterns have now
been released
-Project-initiated
user-owned
-AusAid
subsidized the
cost of the solar
lanterns and
provided funds
for spare parts
-Two NGOs
were employed
to release the
equipment, set
up suppliers in
rural villages,
supply spare
parts, and
maintain the
lanterns
-Rural store
owners,
women‘s groups,
and other
entrepreneurs
were able to
purchase the
lanterns at
wholesale rates
and then supply
them to their
communities
-One NGO
hadn‘t been
separating
project lights
from the other
lights they were
selling and this
has resulted in
uncertainty from
the government
-Many solar
lanterns were seen
in the rural
village, which
decreased users
reliance on
kerosene and
allowed access to
lighting at night
(5, 14)
-Lanterns were
affordable to most
rural users (10)
-The lanterns are
in high demand
(1,2)
-Microfinance
training was
provided to local
organizations by
one NGO,
increasing rural
employment (5, 8,
12)
-Women were
included in the
business aspect
(9, 12)
-A local presence
created easy
access to spare
parts (5, 7)
-One NGO had
set up a battery
recycling scheme
in which unusable
lanterns were
returned to the
supplier, with a
small incentive
-Users were unaware of the
1-year warrantee, so some
lanterns failed before this
time and were not replaced
(4, 6)
-Lanterns do not have as
long of a lifespan as SHSs,
and therefore project results
may not be as long-lasting
(5)
-The project required all of
the names of the users that
the lanterns were sold to,
which was impractical for
rural settings with poor
communication, and created
difficulties for NGOs and
rural vendors (4)
-Employing rural
organizations and
increasing their capacity
can be an effective way
to increase community
livelihoods
-Letting local
businesses share the
risk of selling solar PV
can increase ownership
of projects
-Small solar lanterns
are affordable to most
low-income users in
PICs
-Solar lanterns are a
quick and effective way
to decrease reliance on
kerosene
-Users need to be made
aware of all aspects of
projects

174
about going
ahead with the
subsequent
AusAid VERD
Program, which
is currently in
the final
planning stages
for rural suppliers
to collect them
(14)
-The project
helped to build
the capacity of
NGOs as well, so
that they can
continue with this
work once the
project closes (6,
8)
Sources: AusAid (2011); Johnston (2004b); VEU, Respondent 1 (2011); AusAid, Respondent 7 (2011); Vanuatu NGO #1, Respondent 14 (2011);
Vanuatu NGO #2, Respondent 18 (2011); Wade (2005).
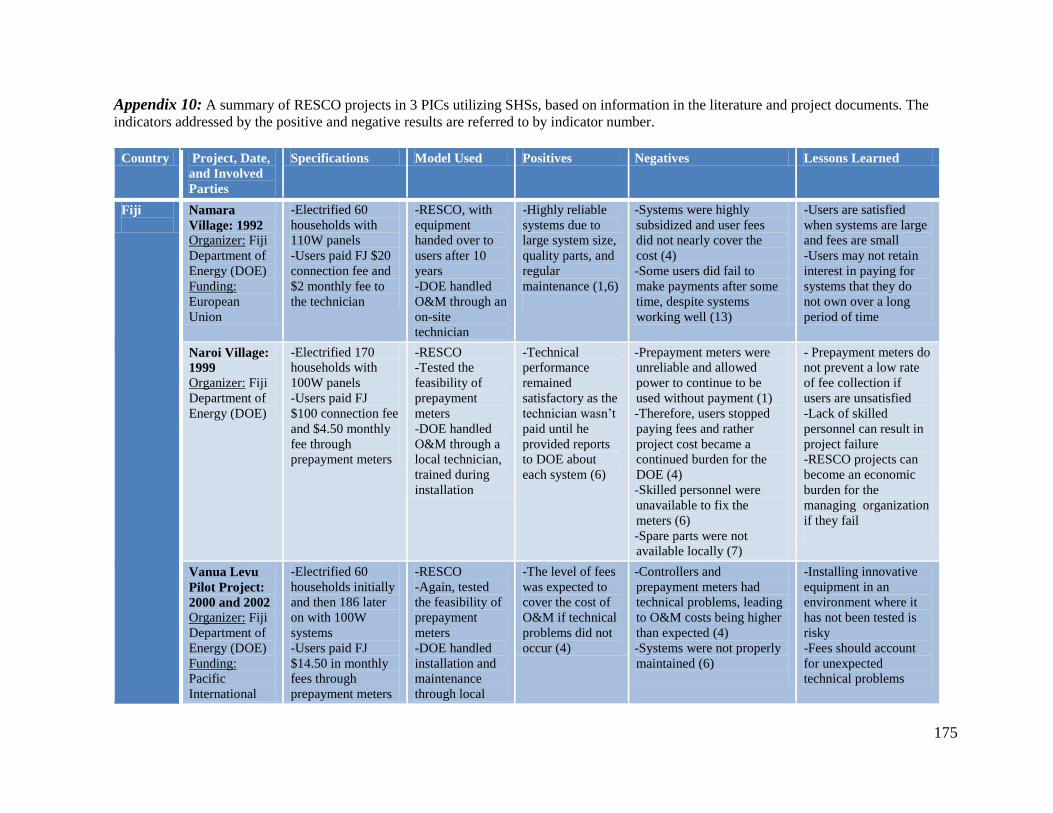
175
Appendix 10: A summary of RESCO projects in 3 PICs utilizing SHSs, based on information in the literature and project documents. The
indicators addressed by the positive and negative results are referred to by indicator number.
Country Project, Date,
and Involved
Parties
Specifications Model Used Positives Negatives Lessons Learned
Fiji
Namara
Village: 1992 Organizer: Fiji
Department of
Energy (DOE)
Funding:
European
Union
-Electrified 60
households with
110W panels
-Users paid FJ $20
connection fee and
$2 monthly fee to
the technician
-RESCO, with
equipment
handed over to
users after 10
years
-DOE handled
O&M through an
on-site
technician
-Highly reliable
systems due to
large system size,
quality parts, and
regular
maintenance (1,6)
-Systems were highly
subsidized and user fees
did not nearly cover the
cost (4)
-Some users did fail to
make payments after some
time, despite systems
working well (13)
-Users are satisfied
when systems are large
and fees are small
-Users may not retain
interest in paying for
systems that they do
not own over a long
period of time
Naroi Village:
1999 Organizer: Fiji
Department of
Energy (DOE)
-Electrified 170
households with
100W panels
-Users paid FJ
$100 connection fee
and $4.50 monthly
fee through
prepayment meters
-RESCO
-Tested the
feasibility of
prepayment
meters
-DOE handled
O&M through a
local technician,
trained during
installation
-Technical
performance
remained
satisfactory as the
technician wasn‘t
paid until he
provided reports
to DOE about
each system (6)
-Prepayment meters were
unreliable and allowed
power to continue to be
used without payment (1)
-Therefore, users stopped
paying fees and rather
project cost became a
continued burden for the
DOE (4)
-Skilled personnel were
unavailable to fix the
meters (6)
-Spare parts were not
available locally (7)
- Prepayment meters do
not prevent a low rate
of fee collection if
users are unsatisfied
-Lack of skilled
personnel can result in
project failure
-RESCO projects can
become an economic
burden for the
managing organization
if they fail
Vanua Levu
Pilot Project:
2000 and 2002 Organizer: Fiji
Department of
Energy (DOE)
Funding:
Pacific
International
-Electrified 60
households initially
and then 186 later
on with 100W
systems
-Users paid FJ
$14.50 in monthly
fees through
prepayment meters
-RESCO
-Again, tested
the feasibility of
prepayment
meters
-DOE handled
installation and
maintenance
through local
-The level of fees
was expected to
cover the cost of
O&M if technical
problems did not
occur (4)
-Controllers and
prepayment meters had
technical problems, leading
to O&M costs being higher
than expected (4)
-Systems were not properly
maintained (6)
-Installing innovative
equipment in an
environment where it
has not been tested is
risky
-Fees should account
for unexpected
technical problems

176
Centre for High
Technology
Research
(PICHTR); and
the Government
of Japan
contractors
Fiji RESCO
Project, 12
different
villages 2003 -
2009 Organizer: Fiji
Department of
Energy (DOE)
Funding:
PICHTR; and
Government of
Japan
-Approximately 950
households were
further electrified
with 100 - 110W
systems in various
villages
-$1,458 US total
installed cost per
SHS
-Users pay
approximately 10%
of the cost with a
FJ $50 connection
fee and $14
monthly fee
-RESCO using
prepayment
meters
-DOE handled
installation and
maintenance
through local
contractors
-A different type
of prepayment
meter was used
(Enercash) which
was more
successful (1)
-There is a high
demand for the
systems by end-
users (2, 10)
-Communication with
technicians was limited due
to the office being a long
distance from villages and
lack of telecommunication
(6)
-30 - 50% of the systems
were not working properly
due to lack of regular
O&M, which was caused
by contrasting interests
between the government
and the RESCO contractor
(6)
-Batteries were not
maintenance-free, causing
many batteries to dry up
and fail (1)
-No training or
consultation was provided
with project
implementation (8)
-Systems were all one size
(3)
-Active government
support is required to
make such programs
sustainable, which is
not always possible in
PICs due to under-
resourced and under-
staffed offices
-Despite failure of
many systems, the
same model continues
to be implemented in
Fiji due to high demand
and lack of resources
without addressing the
underlying issues
-Contrasting interests
or understanding
between stakeholders
can lead to project
failure
-Maintenance-free
batteries are
appropriate for PICs
-Communication
between the project site
and the managing
organization needs to
be available and
systematic
Kiribati
Kiribati Solar
Energy
Company,
-275 houses
electrified by 1989,
mostly with 38W to
-Company with
start-up costs
funded by
-Equipment was
good quality (1)
-Systems were installed
improperly by users (8, 11)
-There was a lack of
-Users tended to
purchase undersized
systems and used cheap

177
Kiribati: 1984
- 89 Organizer:
Kiribati Solar
Energy
Company
(SEC)
Funding:USAid
55W panels
-Peak sales were in
1987
USAid
-The government
and other
organizations
had shares
-The
shareholders
pulled out after a
while, thinking
the company was
stable, but they
went bankrupt in
1989
satisfactory O&M carried
out by users (8, 11)
-Users were unwilling to
pay for subsidized
technical support (13)
-Equipment costs and
transportation both for
importing equipment and
transporting to the outer
islands made SHS costs
very expensive (4, 10)
replacement
components
-Costs of systems have
become more
affordable and may
affect users‘
willingness to pay
Kiribati Solar
Energy Service
Company,
Kiribati: 1990
- current Organizer:
Kiribati Solar
Energy
Company
(SEC)
Funding: JICA;
European
Union
-JICA provided the
start-up cost for
changing SEC into
a RESCO
-300 houses
electrified by 1999,
with an additional
1,700 in 2005 and
2,000 in 2010 (both
with funding by the
EU)
-100W panels
powered 3 lights
and a DC socket for
radio
-Users paid AUD
$10 in monthly fees
-Privately run
RESCO
-SEC trained
local technicians
to install,
maintain, and
collect the SHS
fees
-RESCO
decisions were
made by a
committee,
which included
government
representatives
-Able to cover
operating costs
with the current
amount of
systems installed,
although fees may
need to be raised
in the future (4)
-SEC
manufactures its
own controller,
that is designed
with the harsh
oceanic
conditions in
mind (1)
-Capital costs have been
subsidized by donors, and
would have to be so if this
model was reproduced (4)
-O&M was not always
satisfactory, so the EU has
funded training for more
outer island technicians to
lessen the workload (6)
-Systems are not affordable
to everyone (10)
-Local technicians
living near to the
systems are needed to
reduce costs
-SEC was more
successful using older
people as technicians
who may be less
technically competent
but more respected and
able to collect fees, as
the work didn‘t require
a high level of technical
knowledge
-Systems are limited to
providing lighting and
powering a radio, thus
limiting possibilities for
productive uses
Tonga
The Tonga
Outer Islands
Solar
Electrification
Programme
(TOISEP)
1988 - 1999
-Nearly 600
systems installed on
many different
islands
-Most systems were
110-150 W, with
good quality solar
-RESCO
-Government
had only an
advisory role;
communities and
co-operatives
own the systems
-The maintenance
and repair fund
collected interest,
to make spare
parts more
affordable (10)
-SHSs were
-O&M was unsatisfactory
as visits by EPU
technicians were rare,
creating long delays for
systems to be repaired (6)
-This made it hard to
disconnect those who
-Spare parts and
technicians should be
available locally to
avoid delays
- Participation needs to
be voluntary in order to
ensure users have a
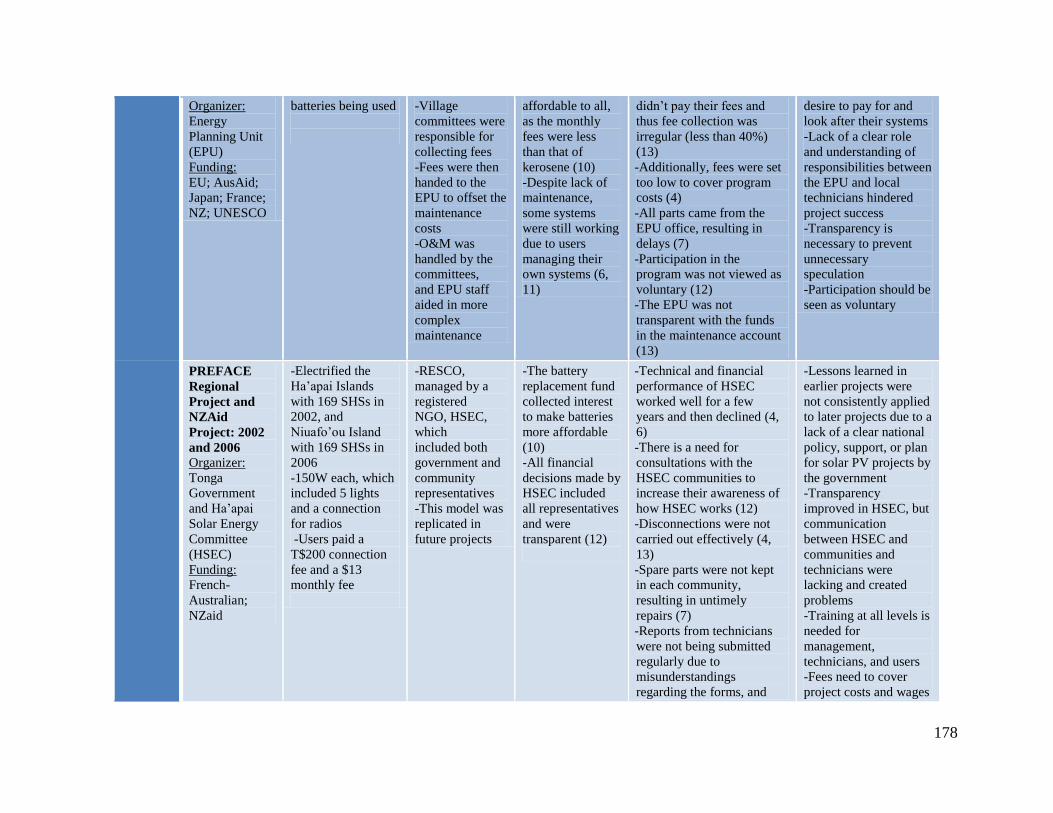
178
Organizer:
Energy
Planning Unit
(EPU)
Funding:
EU; AusAid;
Japan; France;
NZ; UNESCO
batteries being used
-Village
committees were
responsible for
collecting fees
-Fees were then
handed to the
EPU to offset the
maintenance
costs
-O&M was
handled by the
committees,
and EPU staff
aided in more
complex
maintenance
affordable to all,
as the monthly
fees were less
than that of
kerosene (10)
-Despite lack of
maintenance,
some systems
were still working
due to users
managing their
own systems (6,
11)
didn‘t pay their fees and
thus fee collection was
irregular (less than 40%)
(13)
-Additionally, fees were set
too low to cover program
costs (4)
-All parts came from the
EPU office, resulting in
delays (7)
-Participation in the
program was not viewed as
voluntary (12)
-The EPU was not
transparent with the funds
in the maintenance account
(13)
desire to pay for and
look after their systems
-Lack of a clear role
and understanding of
responsibilities between
the EPU and local
technicians hindered
project success
-Transparency is
necessary to prevent
unnecessary
speculation
-Participation should be
seen as voluntary
PREFACE
Regional
Project and
NZAid
Project: 2002
and 2006 Organizer:
Tonga
Government
and Ha‘apai
Solar Energy
Committee
(HSEC)
Funding:
French-
Australian;
NZaid
-Electrified the
Ha‘apai Islands
with 169 SHSs in
2002, and
Niuafo‘ou Island
with 169 SHSs in
2006
-150W each, which
included 5 lights
and a connection
for radios
-Users paid a
T$200 connection
fee and a $13
monthly fee
-RESCO,
managed by a
registered
NGO, HSEC,
which
included both
government and
community
representatives
-This model was
replicated in
future projects
-The battery
replacement fund
collected interest
to make batteries
more affordable
(10)
-All financial
decisions made by
HSEC included
all representatives
and were
transparent (12)
-Technical and financial
performance of HSEC
worked well for a few
years and then declined (4,
6)
-There is a need for
consultations with the
HSEC communities to
increase their awareness of
how HSEC works (12)
-Disconnections were not
carried out effectively (4,
13)
-Spare parts were not kept
in each community,
resulting in untimely
repairs (7)
-Reports from technicians
were not being submitted
regularly due to
misunderstandings
regarding the forms, and
-Lessons learned in
earlier projects were
not consistently applied
to later projects due to a
lack of a clear national
policy, support, or plan
for solar PV projects by
the government
-Transparency
improved in HSEC, but
communication
between HSEC and
communities and
technicians were
lacking and created
problems
-Training at all levels is
needed for
management,
technicians, and users
-Fees need to cover
project costs and wages

179
the committee not
enforcing their use (8)
-Technicians were not
committed to their jobs due
to low wages (4, 6)
need to be fair
-Spare parts need to be
available locally
PIGGAREP
Regional
Project
2008 - ongoing Organizer:
Tonga
Government
and Ha‘apai
Solar
Electricity
Incorporated
(HSEI),
previously
HSEC
Funding: Italy;
PIGGAREP;
REEEP
-Rehabilitated 60
systems installed in
1988 and 1994 in
Mango and
Mo‘unga
communities
-Only some solar
panels were able to
be reused
-Users paid a
T$200
connection fee and
a $13 monthly fee
-Followed same
organizational
structure as the
PREFACE
Project, and the
communities
joined HSEI
-Similar projects
with an
additional 564
systems are
being installed in
2012 with aid
from SPC,
IUCN, and JICA
-Now frequently
needed spare parts
are kept with each
technician (7)
-Improvement of
understanding of
roles helped the
projects to go
ahead more
smoothly (12)
-Strengthened the
capacity of the
HSEI
-Project evaluations are not
yet available to assess the
outcome of the SHSs
Sources: APCTT-UNESCAP (2009); Dornan (2010); Europeaid (2009); Johnston (2004); MECC (2012); Nieuwenhout et al. (2001); Palaki et al. (2009);
Urmee (2009); Urmee et al. (2009); Urmee & Harries (2009); Wade (2004); Wade (2004b); Wade (2005).

180
Appendix 11: A summary of the private SHS market in PNG, based on information in the literature and project documents. The indicators
addressed by the positive and negative results are referred to by indicator number.
Country Project, Date,
and Involved
Parties
Specifications Model Used Positives Negatives Lessons Learned
PNG Private
Markets 1997 -
present
Organizer:
Private sales by
Enertec, TE
(PNG), RDS,
and others
Funding:
The World
Bank and GEF
supported the
private market
in 2007,
otherwise
minimal
external
funding
-Technical,
financial, and
institutional data is
very limited from
1978, when PV
arrived in PNG, to
now
-The market for
SHSs began in
1997; systems sold
now range from 10
to 480 W or more
-The SHSs are
mostly used for
lighting, radios,
charging mobiles,
TVs, and other
appliances
-It is estimated that
approximately
3,000 SHSs were
sold to individuals
from 1997 to 2002,
after which 1,000 -
5,000 systems are
being sold each
year
-Self-initiated
user-owned
through three
large private
companies and
other smaller
entrepreneurs and
institutions
-The role of the
Government
Energy Division
has been minimal
-The WB-GEF
project was the
only major donor
effort aimed at
SHSs for
individuals in
PNG
-It attempted to
distribute and
further
commercialize
SHS 2007, yet it
was met with
limited success
-There is a
thriving and
growing market
for SHSs (4,6)
-RDS marketed
50-150 W SHSs
with an option of
cash sales or a
six-month
payment scheme,
by which they
sold 5,000 in one
year (10)
-There is limited data by
which to know how many
of the systems are working
(6)
-Equipment is not always
suited for the harsh climate
(1)
-The government supports
expanding use of fossil fuel,
which puts SHSs at a
disadvantage (4, 10)
-The importance of culture
and training often has not
been incorporated into sales
and projects (2, 8)
-The option of
financing for users can
help increase private
sales
-Users are in need of
training to be able to
maintain their systems,
as many do not have
access to companies
after purchasing due to
long distances, poor
transportation
infrastructure, and poor
telecommunication
-SHSs are still not
affordable or a priority
for many of the poor,
and financial literacy
continues to be an issue
-Systems should be
oversized as users often
share systems with
others, which is a part
of their culture
Sources: Johnston (2004a); Kopi & Lloyd (2002); Sovacool (2011); Wade (2005).

181
Appendix 12: A summary of the co-operative model implemented in Tuvalu, based on information in the literature and project documents.
Country Project, Date,
and Involved
Parties
Specifications Model Used Positives Negatives Lessons Learned
Tuvalu Tuvalu Solar
Energy Co-
operative
Electrification,
Tuvalu: 1984 -
1994 Organizer:
Tuvalu Solar
Electricity Co-
operative
Funding:
USAid; EU;
and the French
Government
-Over 400
members by 1994
-Systems for solar
lighting
-One of the first
countries in the
world to use solar
PV for rural
electrification
-Co-operative,
with initial
system costs
covered by
donors
-After failure, the
systems were
mostly replaced
by diesel power
grids in 2000
–Diesel-powered
grids are now
being converted
into hybrid
systems, with a
40 kW and a 46
kW array already
having been
installed
-Local technicians
were trained to
maintain the
systems
-For the first 10
years the project
had strong
institutional
support, which
helped with project
endurance
-Systems were highly
subsidized
-The co-operative fell apart
because the funds collected
for O&M disappeared
-After the co-operative
failure, there was a low-
level of user satisfaction due
to lack of maintenance
support and spare part
availability
-The co-operative
model is weak in fiscal
discipline and this
problem caused the
co-operative to
dissolve
Sources: E8 (2009); Wade (2004c); Wade (2005).

182
Appendix 13: Descriptions of four ongoing regional projects and efforts in PICs which directly
affect rural RE electrification.
1. PIGGAREP
The aim of the Pacific Islands Greenhouse Gas Abatement through Renewable Energy
Project (PIGGAREP) is to reduce CO2 emissions in eleven PICs by two million tons in total by
2015. In order to achieve this, the project is focusing on addressing policy barriers, building RE
capacity, improving access to funding, enhancing local markets for RE, creating regulations and
standards for RE uptake, increasing knowledge of RE resources, and raising awareness of key
stakeholders (UNDP, 2007). It includes demonstration RE technologies and training for
government staff and RE technicians. Specific activities which address the use of solar PV for rural
electrification include:
1. A training for solar PV users in community high schools in the Solomon Islands
2. Financial training for 5 RESCOs in Tonga
3. Tonga SHS assessment and standardization
4. Solar PV systems for rural electrification of Tuvalu (Ualesi, 2011)
The five-year project was due to be completed in 2012; however, there have been some
delays in implementation, due to lack of government staff to work with, time-consuming
community consultations, and inadequately planned financial procedures, and thus the project has
been extended (APAN, 2012).
2. IRENA
The global International Renewable Energy Agency (IRENA) has recently entered the Pacific
region in order to aid in the uptake of RE. In 2012 the organization plans to assist in the following
activities, in order to augment off-grid RE development in PICs:
To develop a web-based platform to provide information on the cost and performance of
RE technologies in PICs, and on successful RE projects in the region and globally
To make the existing knowledge contained in PIC energy studies widely available
To strengthen the role of the private sector by providing advice in developing viable
business models and sharing information among organizations regarding successful
approaches found in PICs
To support organized training activities, including vocational programmes, in order to
build capacity in PICs. Training could be based on the proposed Pacific Renewable
Energy Training Initiative (PRETI), which is a model that develops existing educational
programs to become ‗centres of excellence‘ for RE technologies
(IRENA, 2011; IRENA, 2012)
3. GEF Sustainable Energy Financing Project
The GEF Sustainable Energy Financing Project aims to encourage local financial
institutions to participate in RE finance, in order to enhance RE markets (Adams et al., 2007). This
project has been operating in Fiji, PNG, RMI, Solomon Islands, and Vanuatu from 2007 to 2012,
after which it will support technical assistance and information sharing from Fiji until 2017 (Prasad,
2012).

183
4. The Pacific Micro Energy Service Companies (PMESCO) Project
This project was jointly developed by the Renewable Energy and Energy Efficiency
Partnership (REEEP) and the South Pacific Applied Geoscience Commission (SOPAC), to
establish a Micro Credit Facility and demonstrate its ability to help replace kerosene for lighting in
the Solomon Islands and Kiribati. In the Solomon Islands, a ‗cash for crops‘ centre has allowed
customers to pay their instalments through crops, as access to markets is limited in rural areas. Its
activities include:
To engage with local entrepreneurs to establish and operate a micro-energy service
company
To install ‗Light Up The World‘ SHSs for lighting 3 communities in the Solomon Islands
and 3 communities in Kiribati, including technical training for vendors
To establish a micro-credit facility, including training for vendors
To identify ways of measuring emission reductions
To support the activities through voluntary carbon markets
(Climate Parliament, 2009)