solubilization and biodegradation of naphthalene in...
TRANSCRIPT

Solubilization and Biodegradation of Naphthalene in
Presence of Sapindus Mukorossi −−−− Synthetic Mixed
Surfactant Systems
Thesis Submitted
by
K. JAGAJJANANI RAO
In partial fulfillment for the award of the Degree of
MASTER OF TECHNOLOGY (Research)
IN
CHEMICAL ENGINEERING
(Biochemical Engineering and Biotechnology)
Under the esteemed guidance of
Dr. SANTANU PARIA
DEPARTMENT OF CHEMICAL ENGINEERING
NATIONAL INSTITUTE OF TECHNOLOGY, ROURKELA - 769008
ORISSA, INDIA.
January - 2009
Solubilization and Biodegradation of Naphthalene in Presence of
Sapindus Mukorossi −−−− Synthetic Mixed Surfactant Systems
________________________________________________________________________
A Thesis
by
K. JAGAJJANANI RAO
In partial fulfillment for the award of the Degree of
MASTER OF TECHNOLOGY (RESEARCH)
IN
CHEMICAL ENGINEERING
(Biochemical Engineering and Biotechnology)
Under the esteemed guidance of
Dr. SANTANU PARIA
DEPARTMENT OF CHEMICAL ENGINEERING
NATIONAL INSTITUTE OF TECHNOLOGY, ROURKELA - 769008.
ORISSA, INDIA.
January - 2009

CERTIFICATE
This is to certify that the project report titled “Solubilization and
Biodegradation of Naphthalene in Presence of Sapindus Mukorossi −−−− Synthetic
Mixed Surfactant Systems”. has been done under my guidance is a bonafide record of
work done by Mr. K. Jagajjanani Rao in partial fulfillment of the requirement for the
completion of the Master in Technology in Chemical Engineering.
Date : 30/01/09
(Dr. Santanu Paria)
Assistant Professor
Department of Chemical Engineering
National Institute of Technology
Rourkela - 769008

ACKNOWLEDGEMENT
In pursuit of this academic endeavor, I feel that I have been singularly fortunate,
inspiration, guidance, direction, cooperation, love and care all came in my way in
abundance and it seems almost an impossible task for me to acknowledge the same in
adequate term. Yes, I shall be failing in my duty if I do not record my profound sense of
indebtedness and heart felt gratitude to my supervisor, Dr. Santanu Paria, Assistant
Professor, Department of Chemical Engineering, NIT Rourkela, who guided and inspired
me in pursuance of this work. His association will remain a beacon light to me through
out my career.
I owe a depth of gratitude to Prof. K.C. Biswal., H.O.D, Prof. G.K. Roy., Chairman
MSC, for all the facilities provided during the course of my tenure. I am thankful to Dr.
Madhusree Kundu for her valuable suggestions and support.
I want to acknowledge the support of all the faculty and friends of Chemical Engg and
Biotechnology Department, NIT, Rourkela.
A special thanks to my all lab mates Rajib Ghosh Chaudhuri, Nihar Biswal, Menaketan
Ray for making a good atmosphere in the lab. I acknowledge the co-operation extended
by Mr. Mohanthy.
I thank Kaleswar Rao and Chaitanya for their joyous company and for helping me in
several ways. I wish to thank Ramakrishna and Sravanthi for their support and joyful
company.
My heartfelt thanks to all my friends Ramesh, Jabes, Koti, Hari, Ashraf, Chandan, Yogi,
Alok, Padma, Sirisha, Arathi, Kishore, Anand and Mallikarjun for their moral support.
I thank to the support, encouragement and good wishes of my parents and family
members, without which I would not have been able to complete my thesis.

i
Contents Page No
List of figure iv
List of table vi
Nomenclature vii
Abstract ix
1. Introduction 1
2. Background literature 4
2.1 Polycyclic aromatic hydrocarbons (PAHs) 4
2.1.1 General properties 4
2.1.2 Fate of PAHs in the soil and groundwater environment 6
2.1.3 PAH toxicity 6
2.2 Bioavailability and biodegradation of organic contaminants 7
2.3 Surfactants 9
2.3.1 Characteristics of surfactants 9
2.3.2 Classification of surfactants based on origin 9
2.3.2.1 Synthetic surfactants 9
2.3.2.2 Natural surfactants 10
2.4 Surfactant solubilization 12
2.5 Remediation application of surfactants 13
2.6 Effects of surfactants on biodegradation of organic contaminants 14
2.6.1 Synthetic surfactants: uses and limitations 14
2.6.2 Biosurfactants: uses and limitations 16
2.6.3 Plant surfactants: uses and limitations 20
2.7 Concluding remark 21
2.8 Motivation 22
2.9 Research objectives 22
3. Solubilization of naphthalene in presence of plant and plant- 23
synthetic mixed surfactant systems
3.1 Introduction 23
3.2 Experimental section 25

ii
3.2.1 Materials 25
3.2.2 Extraction of Reetha surfactant from the fruit 25
3.2.3 Methods 25
3.3 Results and discussion 26
3.3.1 Structure and physical properties of Reetha solution 26
3.3.2 Solubilization by single surfactants 27
3.3.3 Solubilization by surfactant mixtures 30
3.3.3.1 Mixing effect of nonionic – Reetha surfactants 31
3.3.3.2 Mixing effect of cationic – Reetha surfactants 31
3.3.3.3 Mixing effect of anionic – Reetha surfactants 32
3.3.4 Effect of surfactant mixtures on micelle–water partition coefficient 33
3.3.5 Solution properties of mixed surfactant systems 35
3.3.6 Conclusion 41
4. Mixed micellar behavior of plant surfactant with synthetic surfactants. 42
4.1 Introduction 42
4.2 Experimental section 43
4.2.1 Materials 43
4.2.2 Extraction of Reetha surfactant from the fruit 43
4.2.3 Surface tension measurements 43
4.3 Results and Discussion 44
4.3.1 CMC behavior of mixtures 44
4.3.2 Interaction between surfactants 44
4.3.3 Effect of CMC ratio and micellar mole fraction of Reetha in 47
surfactant mixtures
4.3.4 Conclusion 50
5. Biodegradation of Naphthalene in presence of plant - synthetic mixed 51
surfactant systems
5.1 Introduction 51
5.2 Materials and methods 53
5.2.1 Chemicals 53
5.2.2 Microorganisms and medium 53

iii
5.2.3 Experimental design 53
5.2.4 Analytical methods 54
5.3 Results and Discussion 55
5.3.1 Surface tension and growth measurements 55
5.3.2 Solubilization of naphthalene by single and mixed surfactants 59
5.3.3 Naphthalene Biodegradation 60
5.3.4 Degradation of surfactants by mixed cultures 66
5.3.5 Zeta Potential effect on Biodegradation 68
5.3.6 Correlation of growth and degradation mixed cultures 69
5.3.7 Conclusion 70
6. Conclusions and suggestions for future work 72
References 75

iv
List of Figures
Figure No. Title Page No
Figure-3.1 Structures of surfactant molecules used in this study (a)
SDBS, (b) SOS, (c) AOT, (d) CTAB, (e) TX -100, and (f)
Reetha.
27
Figure-3.2 Solubilization of naphthalene by using surfactants (a)
Reetha, (b) TX–100 (c) SOS, (d) SDBS, CTAB, and AOT.
30
Figure 3.3 Solubilization of naphthalene in presence of (a) TX–100 +
Reetha, (b) CTAB + Reetha, (c) SDBS+Reetha, (d)
AOT+Reetha, (e) SOS+Reetha mixed systems.
32
Figure 3.4 Comparison of (a) MSR, (b) Deviation ratio, R of
naphthalene as a function of mole fraction of Reetha for
different mixed surfactant systems.
34
Figure 3.5 Comparison of β and ∆MSR vs. mole fraction of Reetha for (a)
SDBS, CTAB (b) SOS, AOT, TX–100.
39
Figure-4.1 Surface tension vs. logarithm of total surfactant
concentration at 28oC for the surfactants TX-100, CTAB,
SDBS, AOT, SOS with Reetha.
45
Figure-4.2 Mixed CMCs of surfactants TX-100, CTAB, SDBS, AOT,
SOS with increase of mole fraction of Reetha compared to
the theoretically predicted CMCs.
46
Figure-4.3 % CMC ratio (Reetha/non-Reetha) vs. βavg of surfactant
combinations (TX-100, CTAB, SDBS, AOT, SOS) with
Reetha.
49
Figure-5.1 Mixed cultures KC and WWC at 40X. 54
Figure-5.2 Surface tension comparison of various surfactants with
Reetha by KC and WWC.
56
Figure-5.3 Compariosn of growth rate constants (Kg) of cultures KC and
WWC with TX-100, CTAB, SDBS with different mole
58

v
fraction of Reetha.
Figure-5.4 Naphthalene solubility in MSM by surfactants TX-100,
CTAB and SDBS with Reetha.
59
Figure-5.5(a) Biodegradation % by KC and WWC for TX-100 – Reetha
mixture.
61
Figure-5.5(b) Naphthalene depletion in 18days for surfactants TX-100,
CTAB, SDBS with reehta (pure/mixtures); 2.5 mM
.naphthalene taken for TX-100 and its mixtures with reetha,
where as it was1.25 mM for all other cases.
62
Figure-5.6 Kinetic rate constant (K) values compariosn of cultures KC
and WWC with TX-100, CTAB, SDBS with different mole
fraction of Reetha.
64
Figure-5.7 Kinetic degradation rate constant (K) and growth rate
constant (Kg) values comparison for KC and WWC by
surfactant (TX-100, CTAB, SDBS) – Reetha mixtures.
65
Figure-5.8 Increase in surface tension with respect to Reetha for various
combinations of surfactants (for 60 day period).
67
Figure-5.9 Zeta potential (ξ) comparison for KC and WWC for
surfactant (TX-100, CTAB, SDBS) – Reetha mixtures.
68

vi
List of Table
Table
No.
Title Page No
Table-2.1 Physio-chemical properties, solubility and cancer class of
different PAH’s
5
Table-2.2 Selected studies involving the use of synthetic surfactants to
stimulate hydrophobic organic contaminant biodegradation.
15
Table-2.3 Selected studies involving the use of biosurfactants to
stimulate hydrophobic organic contaminant biodegradation.
17
Table-2.4 Summaries of surfactant soil flushing field tests. 19
Table-3.1 Values of XR, MSR, R, ∆MSR, log Km, B, β, CMC, and x1 for
mixed surfactant systems.
40
Table-4.1 Mixed CMCs with interaction parameter (β), activity
coefficients (f ) relation with Gibbs free energy at 28 oC at
relative mole fractions α of Reetha to TX-100, CTAB, SDBS,
AOT, SOS.
48
Table-5.1 Growth rate constant (Kg) for various surfactants by KC and
WWC. CTAB, Reetha, SDBS, and TX – 100 are abbreviated
as C, R, S, T respectively.
57
Table-5.2 Biodegradation % by mixed cultures with CTAB and SDBS
mixtures with Reetha.
61
Table-5.3 Degradation rate constant (K) values of napthalene by two
mixed cultures.
63
Table-5.4 Percentage increase in surface tension values by both mixed
cultures.
66

vii
Nomenclature
B = Empirical parameter
C0, Ct = Concentration of naphthalene at day 0 and day t, in mM
C1, C12 = Concentration of surfactant 1and mixed surfactant 12 in mM
CCMC = Concentration of surfactant above CMC, in mM
CS = Concentration of surfactant below CMC, in mM
f1, f2 = Activity coefficients
GE = Gibbs free energy
HE = Enthalpy of mixing
K = Kinetic degradation rate constant, day -1
Kg = Growth rate constant, day-1
Km = Micellar partition coefficient
Km1, Km2, Km1, 2 = Micelle – water partition coefficients of a solute for surfactants 1, 2 and
in mixture.
Kow = Octonol water partition coefficient
N2, N1 = Concentration of cells, in mg/L
R = Universal gas constant
R = Deviation ratio
S = Apparent solubility of organic compound, in mM
SCMC = Solbulity of organic compound at CMC, in mM
T = Absolute temperature
t2, t1 = Time in days
x1 = Micellar mole fraction of Reetha
X1, X2 = Mole fraction of surfactant 1 and 2
Xa = Mole fractions of solute in aqueous phase
Xm = Mole fractions of solute in micelles
Xm1 = Micellar mole fraction of surfactant 1
XR = Mole fraction of Reetha
Greek letters
∆ = Change/Difference

viii
α1 = Mole Fraction of Reetha
Β = Empirical Parameter
γ = Surface Tension, dyne/cm
ξ = Zeta potential, mV
Abbreviations
AOT = Dioctyl sodium sulfosuccinate
CMC = Critical Micellar Concentration
CMC1, CMC2, CMC12 = CMCs of Reetha, pure synthetic and mixed surfactant
CTAB = Cetyl trimethyl ammonium bromide
DNA = Deoxyribonucleic acid
DNAPL = Dense Non Aqueous Phase Lipid
EPA = Environmental Protection Agency
HOC = Hydrophobic Organic Contaminant
IARC = International Agency for Research on Cancer
KC = Known Culture
LNAPL = Light Non-Aqueous Phase Liquid
MSR = Molar Solubilization Ratio
NAPL = Non Aqueous Phase Lipid
PAH = Poly Aromatic Hydrocarbon
PCB = Polychlorobiphenyl
PCE = Polychloroethylene
RNA = Ribonucleic acid
SDBS = Sodium dodecyl benzne sulphonate
SDS = Sodiumdodecyl sulphate
SOS = Sodium octane sulfonate
TCE = Tetrachloroethylene
TCET = 1,1,1-Trichloroethane
TX–100 = Triton - 100
VOC = Volatile Oraganic Compund
WWC = Waste Water Culture
ix
Abstract
Solubilization efficiencies of naphthalene by micellar solution of a plant–based surfactant
extracted from fruit of Sapindus mukorossi (Reetha), and the synthetic surfactants like
nonionic (TritonX–100 or TX–100), cationic (Cetyl trimethyl ammonium bromide or
CTAB), anionic (Sodium dodecylbenzenesulfonate or SDBS; Dioctyl sodium
sulfosuccinate or AOT; Sodium octanesulfonate or SOS) in their single and as well
binary mixed (plant – synthetic) systems were measured and compared. The
solubilization efficiency of single surfactants followed the order TX-100 > CTAB >
Reetha = SDBS > AOT > SOS. The mixed surfactant systems show negative deviation in
molar solubilization ratio (MSR) from the ideality. The ascending order of % change in
MSR (∆MSR) are TX–100 – Reetha < CTAB – Reetha < SDBS – Reetha < AOT – Reetha
< SOS – Reetha. The mixed micellar solution for a particular combination also exhibits
∆MSR is more negative when interaction parameter for the mixed micelle (β) is more
negative.
For the above mixtures mixed micellization and interaction of surfactant
molecules were examined. Mixed critical micelle concentrations (CMCs) were obtained
from surface tensiometry as well as from solubilization experiments. The mixed micellar
compositons and the estimation of interacting forces were determined on the basis of a
regular solution model along with thermodynamic potentials of micellization. The CMCs
were reduced, although not substantial, and synergistic behaviour of the Reetha with
synthetic surfactants was observed. The interaction parameter β for the mixed micellar
system was calculated using regular solution model to see the nonideality of the system.
The negative value of β for different Reetha – synthetic mixed surfactants systems
indicate there is a synergistic effect in the mixed micellar systems.
The bioavailability and biodegradation of naphthalene was studied with Reetha,
TX–100, CTAB, SDBS, and the mixture of these synthetic surfactants with Reetha.
Biodegradation of naphthalene was more in the presence of surfactant mixtures indicate

x
more bioavailability to microorganisms. Two mixed culture’s (known culture (KC) and
unknown culture (WWC)) naphthalene degrading ability in the presence of surfactants
(pure/mixtures) were tested. Naphthalene biodegradation is explained with the help of
growth rate constants (Kg), naphthalene degradation rate constants (K), surfactant
(pure/mixtures) utilization (by % change in surface tension), and with zeta potential
values of the microbes in surfactant combinations. Naphthalene degraded was more in
CTAB, SDBS - Reetha mixtures and less in case of TX-100 - Reetha mixtures, while the
order is opposite in mixed surfactant utilization. Addition of Reetha to the synthetic
surfactants TX-100, CTAB and SDBS proved to be more beneficial to WWC than KC.
Utilization of naphthalene along with surfactants (pure/mixtures) also explained and
mixed micellar concentrations above critical micelle concentration were not toxic to the
microorganisms used. Zeta potential for mixed cultures was monitored for surfactants
(pure/mixtures) and its relation to K values explained. The results of this study may be
useful for the applications of natural or natural – synthetic mixed systems in surfactant
enhanced remediation and degradation.
Keywords: Sapindus mukorossi, Reetha, molar solubilization ratio, interaction parameter,
Biodegradation, Zeta potential

1
Chapter 1
Introduction
1.1 Definitions of surfactant, micellar solubilization, and biodegradation
The term surface-active agent or “surfactant” represents a heterogeneous and
long-chain molecule containing both hydrophilic (head) and hydrophobic (tail) moieties.
Micellar solubilization. At a particular concentration (known as critical micellar
concentration) surfactant monomers tend to form aggregates called micelles. Micellar
systems have the unique property of being able to solubilize both hydrophobic and
hydrophilic compounds (which entraps the undissolved molecules and get them
dissolved) and then level off. This concentration is called as Micellar solubilization.
Bioavailability is herein defined as the accessibility of a substrate by a microorganism.
Biodegradation is the contaminant utilization by microorganisms as a substrate and
turning down it to harmless products.
1.2 Hydrophobic organic contaminants
Hydrophobic organic compounds (HOC) are ubiquitous soil pollutants and cause
many environmental problems. Among HOCs, polycyclic aromatic hydrocarbons (PAHs)
are major components of crude oil, creosote, coal tar and wastes from the combustion of
fossil fuel, coal gasification, and incineration of industrial wastes (Menzie et al., 1992). .
PAHs are non-polar, neutral, and hydrophobic organic molecules comprised of two or
more fused benzene rings. They have received much attention since they are known to be

2
potentially mutagenic or carcinogenic to human being and other living organisms
(Harvey, 1996). Sixteen PAHs are listed by EPA as priority pollutants due to their
toxicity. Even though PAHs have low solubility in water, their slow dissolution can
contaminate large amounts of ground water for a long period (Luthy et al., 1994).
Physical, chemical and biological methods have been used for the remediation of
hydrophobic organic compounds contaminated sites. Among many treatment methods for
hydrophobic organic compounds contaminated soil, bioremediation has been used for the
destruction of organic compounds in soil and has been considered as an economical
option for contaminated soil and groundwater attenuation. However, conventional
remediation methods, such as “pump and treat” and soil venting with nutrient solution,
are often insufficient for PAHs contaminated soils because of their bioavailability in soils
is often limited by their low solubility and strong sorption to the soil (Wilson and Jones,
1993; Makkar and Rockne, 2003).
1.3 Role of surfactants
The bioavailability of PAHs can be enhanced by solubilizing the contaminants in
aqueous phase and by which the enzymes from microorganism catalyze the degradation
step. In general, the surfactants are used to enhance solubilization of PAHs or any other
hydrophobic compounds. Many studies employing single and mixed surfactants showed
their remediation potential in solubilizing and mobilizing organic contaminants like
PAHs (Paria, 2008; Edwards et al., 1991; Paria and Yuet, 2006). Although synthetic
surfactants are efficient solubilizers of contaminants but surfactants used should be also
biodegradable or food grade, else there will be another environmental problem due the
presence of non degradable surfactants (Stelmack et al., 1999). Biosurfactants produced
by microorganisms are also used to enhance bioavailability and biodegradation rates of
PAHs in soil remediation. These are having advantages like easy degradability,
production from renewable sources etc. than synthetic surfactants (Muller et al., 1993).
But their usage in bulk is limited as their purification; recoveries are not economical and
some are having antimicrobial properties (Fiechter, 1992). Surfactant enhanced
degradation is also a complicated process; as surfactant presence some times adversly
effect the innate microoorganisms growth and uptake of substrates. The presence of

3
surfactants along with contaminant highly influences the ultimate degradation ability of
microorganisms.
The synthetic surfactants are also some times expensive and its losses due to
precipitation, adsorption, toxicity to microorganisms, and low biodegradability at higher
CMC limitmg its usage. Plant-based natural surfactants which are cheap, abundent, eco
friendly, are an effective alternative to use. Additional advantage of plant based natural
surfactant application in remediation studies is that any residual surfactant left in the
subsurface soils will be easily biodegraded. It is indeed beneficial to know the biological
response of surfactant (pure/mixtures) addition on PAH degrading bacteria in order to
develop practical surfactant enhanced bioremediation strategies.

4
Chapter 2
Background literature
2. Polycyclic aromatic hydrocarbons (PAHs)
2.1. General properties
PAHs are nonpolar and hydrophobic organic chemicals composed of two or more
benzene rings. They have low solubility in water and are strongly bound to soil. Table-
2.1 show properties of some polycyclic aromatic hydrocarbons (PAHs). PAHs are major
components of crude oil, creosote, coal tar and wastes from the combustion of fossil fuel,
coal gasification and liquefaction, and incineration of industrial wastes (Harvey, 1996;
Wilson and Jones, 1993). These compounds are produced by industrial activities such as
oil processing and storage, and largely by combustion. In urbanized areas, it has been
reported that urban runoff also contains significant amounts of PAHs (Sansalone and
Buchberger, 1995). Combustion products are the major sources of PAHs in storm water
runoff from urbanized areas (Ngabe et al., 2000).
A benzene ring has six carbon atoms and a conjugated system of π electrons
(Carey, 1987). The π electrons delocalization in the aromatic ring of cyclic (4n+ 2) π-
bond system causes cyclic compounds to be particularly stable compared to nonaromatic
compounds (Schwarzenbach et al., 1993). From a remediation perspective, it is important
to examine the environmental properties of these compounds. PAHs generally exist as
solids in the environment, and some PAHs may exist as needles, plates, crystals, or

5
prisms and range from colorless to golden yellow (NIEHS, 1997). Naphthalene has the
lowest melting point (80.6ºC) and molecular weight (31.5 mg/L), and most soluble PAH
in water (Schwarzenbach et al., 1993). The highest molecular weight PAH of
environmental interest is coronene, and it has the lowest solubility in water, which is
about 1.4×10⁻⁴ mg/L (Connell, 1997).
Table-2.1: Physio-chemical properties, solubility and cancer class of different PAH’s
(Wilson and Jones, 1993).
Cancer Class PAH No. of Rings
Mol. wt. g mole-1
Boiling point °C
Aq. Sol. a (µ g/L)
Log Kow
U.S EPA b
IARCc
Naphthalene 2 128 218 31000 3.50 D 3 Phenanthrene 3 178 339 1300 4.45 D 3 Anthracene 3 178 340 70 4.46 D 3
Fluoranthene 4 202 375 260 4.90 D 3 Pyrene 4 202 393 135 4.90 D 3
Benz [a] anthracene
4 228 435 14 5.61 B2 2A
Chrysene 4 228 448 2 5.90 B2 3 Benzo [a]
pyrene 5 252 496 4 6.04 B2 2B
Dibenz [a,h] anthracene
5 278 535 0.5 7.20 B2 N/A
aMackay et al. 1992
bCancer class from U.S. Environmental Protection Agency (U.S EPA) weight-of-evidence
classifications. D-not classifiable; B2-probable human carcinogen.
c-Cancer class from International Agency for Research on Cancer (IARC). 3-not classifiable; 2A-
probabale human carcinogen; 2B-possible human carcinogen; N/A-not applicable.
(U.S. Environmental Protection Agency, 2002. Integrated risk information system (IRIS). Office
of Research and Development, National Center for Environmental Assessment, Washington,
DC.)
Within the PAH family, many properties, such as solubility, melting and boiling
point, vapor pressure, and octanol–water partition coefficient (Kow), correspond to the
molecular weight and structure of the compound. Octanol–water partition coefficient
(Kow) is a measure of solubility and defined as partition of the organic compound between
octanol / water phase (Schwarzenbach et al., 1993). As shown in Table-2.1, the
solubilities of PAHs decrease as the number of benzene rings increases. Even though

6
PAHs have low solubility in water, their dissolution can contaminate large amounts of
ground water for long periods (Luthy et al., 1994).
2.1.2 Fate of PAHs in the soil and groundwater environment
As it is mentioned that PAHs have very low water solubility and high Kow values, they
tend to get sorbed preferably to the soil organic matter instead of being solubilized in the
infiltrating water and through this be transported downwards to the groundwater
reservoirs. The sorption process is therefore counteractive to efficient biodegradation
process as it decreases bioavailability, and as these compounds are located in micro
porous areas of the soil due to sorption which makes it inaccessible to the bacteria and the
biodegradation will thus be controlled by the slow desorptive and diffusive mass transfer
into the biologically active areas (Zhang et al., 1998). It has been claimed that a slow
sorption following the initial rapid and reversible sorption lead to a chemical fraction that
is very resistant to desorption (Hatzinger and Alexander, 1995). This phenomenon is
called aging, and the existence of such desorption-resistant residues may increase the
time for their removal as the compound stay in the soil dramatically. PAHs have also
been shown to be partitioned or incorporated more or less reversibly into the humic
substances of the soil after partial degradation and thereby be even more immobilised in
the soil (Kästner et al., 1999).
At the same time they show very low aerobic degradability depending on the
environmental conditions and the available concentration. Only two-and three-ringed
compounds have been shown to be degraded under anaerobic conditions with nitrate or
sulfate as the terminal electron acceptor (Mihelic and Luthy, 1988). Very low
concentrations have a strong influence on the biodegradation of such hydrophobic
compounds, and some studies have indicated that the process stops below a certain
threshold concentration (Alexander, 1985). The low mobility and high persistence means
that they can stay in the soil for decades, and even at sites with contaminations dating at
least 50 years back, 4- or 5-ringed PAHs are found near the soil surface.
2.1.3 PAH Toxicity
Research into the toxicology of HOCs is ongoing, but presently many of these pollutants
are considered to be mutagenic and/or known carcinogens (Harvey, 1991; Menzie et al.,
1992; Connell, 1997; NIEHS, 1997). HOCs are found throughout a list of priority

7
hazardous substances compiled by the U.S. EPA and the Agency for Toxic Substances
and Disease Registry (ATSDR, 1999). In addition, in the 1997 report on carcinogens, the
U.S. Department of Health and Human Services cited evidence that 15 PAHs caused
various types of cancer in experimental animals (NIEHS, 1997). According to Lee et al.
(1981), PAHs are the largest class of chemical carcinogens, and both Clar (1964) and
Harvey (1991) also reported in detail about the evidence of PAH carcinogenicity in
animals. Harvey (1996) reported that some PAH metabolites bind to protein, DNA, and
RNA, and adducted compounds may cause damage to cells and cause carcinogenic
effects. In Table- 2.1 the cancer classed of selected PAHs listed.
2.2 Bioavailability and Biodegradation of organic contaminants
Bioavailability and biodegradation are two important factors effect the ultimate fate of
any contaminant. Bioavailability is governed by (1) the substrate concentration that the
cell membrane “sees,” (i.e., the “directly bioavailable” pool) as well as (2) the rate of
mass transfer from potentially bioavailable (e.g., nonaqueous) phases to the directly
bioavailable (e.g., aqueous) phase. The biodegradation process consists of several steps
(Fig. 2.1). Consider a substrate that is initially present in soil or a porous matrix where it
is inaccessible to microorganisms. The substrate may be adsorbed to the matrix or may be
present in the liquid or solid phase. First, this substrate has to be transferred to sites where
it can come in direct contact with microorganisms. This can occur by desorption,
dissolution, or mobilization of the contaminant from the soil ‘phase’ to the aqueous
phase, and eventually by transport, i.e. convection and dispersion (Fig. 2.1).
Subsequently, the substrate has to be taken up by the cells. After the substrate is taken up,
it is finally converted. Biodegradation of PAHs is restricted by their limited
bioavailability, which is mainly associated with PAH hydrophobic nature and strong
adsorptive capacity in soil (Thomas et al., 1986; Volkering et al., 1998). It has been
reported that the mass transfer rate of PAHs into the aqueous phase is the rate-limiting
step in their degradation (Stucki and Alexander, 1987; Pignatello and Xing, 1996).
The bioavailability of soil contaminants can be increased by stimulating the
process that is limiting the rate of biodegradation (Chung et al., 1993). Stimulation of
desorption and dissolution rates can be accomplished by all kinds of physical and

8
chemical means. For instance, the temperature can be raised, soil might be pulverized to
increase access and decrease diffusional distances, soil may be agitated, acoustic
techniques may increase bioavailability, or soil organic matter may be oxidized using
chemical agents (Bollag and Bollag, 1995). However, the most promising way to increase
a contaminant's bioavailability is thought to be the addition of surface active agents such
as surfactants that stimulate mass transfer rates.
Figure 2.1: Processes involved in the biodegradation of contaminants that are initially
present in soil. Processes involved in the transfer of compounds between the soil phase
and the bulk aqueous phase: 1: desorption 2: dissolution 3: detachment 4: mobilization.
Processes involved in the uptake of contaminants by cells: a: uptake of dissolved
substrate; b: uptake of ‘pseudo-solubilized’ substrate; c: uptake of substrate by direct
attachment of the organism to substrate droplets.

9
2.3 Surfactants
2.3.1 Characteristics of surfactants
Surfactants are amphiphilic compounds which contain hydrophobic and hydrophilic
moieties. While hydrophobic groups (tail) have little affinity for polar solvents,
hydrophilic groups (head) have strong affinity for polar solvents such as water and
prevent the surfactant molecules from being completely separated from the polar solvent.
At low concentration, surfactants are fully soluble in water. However, when the
concentration is increased, in order to decrease the free energy of the system,
hydrophobic groups begin to aggregate and build up the core of a cluster. This small
aggregate is called a ‘surfactant micelle’ and the formation of micelles is called
micellization. The lowest concentration at which micelles begin to form is called the
‘critical micellization concentration’ (CMC). The CMC becomes different according to
temperature, surfactant type and structures. It was reported as a range of concentrations
rather than a fixed value (Rosen, 1989).
2.3.2 Classification of surfactants based on origin
2.3.2.1 Synthetic surfactants
These are manufactured by the chemical routes. According to the nature of the head
groups a surfactant can be classified into four types. The head group may have a positive
charge (cationic), negative charge (anionic), both positive and negative charge
(zwitterionic), or no charge (nonionic).
Anionic surfactants: Examples of anionic surfactant groups include sulfonic acid salts,
alcohol sulfates, alkylbenzene sulfonates, phosphoric acid esters, and carboxylic acid
salts. Anionic surfactants tend to be good solubilizers and are relatively nontoxic. They
have been used in petroleum oil recovery operations as well as in contaminant
hydrogeology remediation applications.
Cationic surfactants: Examples include polyamines and their salts, quaternary
ammonium salts, and amine oxides. Cationic surfactants tend to be toxic and are
therefore not widely used in environmental applications at this time. Cationic surfactants
also tend to sorb to anionic surfaces and so can be severely retarded in groundwater
systems.

10
Nonionic surfactants: Examples include polyoxyethylenated alkylphenols, alcohol
ethoxylates, alkylphenol ethoxylates, and alkanolamides. Nonionic surfactants tend to be
good solubilizers and are relatively nontoxic. They are usually easily blended with other
types of surfactants (i.e., used as cosurfactants) and therefore have found widespread use
in petroleum and environmental applications. The performance of nonionic surfactants,
unlike anionic surfactants, is relatively insensitive to the presence of salts in solution.
Zwitterionic surfactants: They can be anionic (negatively charged), cationic (positively
charged) or non-ionic (no charge) in solution, depending on the acidity or pH of the
water. They are compatible with all other classes of surfactants and are soluble and
effective in the presence of high concentrations of electrolytes, acids and alkalis. These
surfactants may contain two charged groups of different sign linked by a spacer which
may be rigid or flexible, hydrophilic or hydrophobic, typically 2–8 bridging atoms
(Menger et al., 1991, 1993). Whereas the positive charge is almost always ammonium,
the source of the negative charge may vary (carboxylate, sulphate, sulphonate). These are
mild with high foaming properties. An example of an amphoteric/zwitterionic surfactant
is alkyl betaine.
2.3.2.2 Natural surfactants
Oleochemical surfactants: Oleochemical surfactants, also referred to as natural, are
derived from plant oils such as palm, palm kernel or coconut oil or from animal fats such
as tallow, lard or fish oil. Fish oil is no longer used as an oleochemical feedstock, and
animal fats have lost ground in recent years. In contrast, vegetable oils have been gaining
importance. But all these above surfactants are processed to gain the surface active
property. These differ from the synthetic surfactants slightly by having linear carbon
chains and even numbered, while synthetic surfactants may have branched carbon chains
and contain even or odd numbers of carbon atoms. These differences may seem subtle,
but they can have a significant impact on cleaning performance, especially in mixed
surfactant systems.
Microbial surfactants: Many bacteria, yeasts, and fungi produce extracellular or
membrane-associated surface active compounds, called ‘Biosurfactants’ (Hommel, 1990;
Fiechter, 1992; Banat, 1995; Lin, S.C., 1996; Desai and Banat, 1997). The term
biosurfactant refers to any type of compound produced by microorganisms with surface

11
active or emulsifying properties (Rosenberg, 1986; Hommel, 1990; Fiechter,1992).
Biosurfactants are of low and high molecular weight lipid complexes, which are normally
produced by microorganisms by acclimation. The hydrophilic portion can be a
carbohydrate, amino acid, cyclic peptide, phosphate, carboxylic acid or alcohol
(Mulligan, 2005). Most of the biosurfactants are anionic or nonionic and only a few are
cationic such as those containing amine groups. The potential of biosurfactants in
environmental applications has reviewed by some researchers (Volkering et al., 1998;
Mulligan, 2005; Maier et al., 2000). Biosurfactants may be applied in foods and
pharmaceutical products (Velikonja and Kosaric, 1993; Desai and Banat, 1997).
The structure of biosurfactant is a characteristic of the producing species and the
availability of carbon source during the growth of the microorganisms (Zhang and Miller,
1995). The fact that many biosurfactants are produced even when the cells are not grown
on hydrophobic substrates suggests that their function is not solely restricted to the
stimulation of substrate availability (Bouchez-Naïtali et al., 1999). Another function
might be to regulate cell adhesion to and cell detachment from surfaces, which controls
mobility of the cells (Rosenberg, 1986; Busscher et al., 1996). Biosurfactants may
function as antibiotics. The biocidic actions of rhamnolipid by Pseudomonas, mycolic
acid-type biosurfactants from Actimomycetes, and of lipopeptides produced by Bacillus
are well documented (Haferburg et al., 1986; Jenny et al., 1991).
Biosurfactants may also be used as anti-viral and anti-bacterial agents
(Stanghellini and Miller, 1997; Vollenbroich et al., 1997; Lang and Wullbrandt, 1999).
Biosurfactants might be used for enhancing the biotransformation rate of lipophilic
compounds such as sterols or steroids when uptake by cells is rate limiting (Angelova and
Schmauder, 1999). Advantages of biosurfactants over synthetic surfactants include the
high structural diversity and concomitant diversity in properties, the possibility to
produce these biosurfactants from renewable resources, and the fact that they are
biodegradable. In addition, these compounds are natural, which facilitates the public
acceptance of their application in the environment (Haferburg et al., 1986; Fiechter,
1992). Biosurfactants generally are more expensive than synthetic surfactants (Fiechter,
1992; Lang and Wullbrandt, 1999). Therefore, the use of purified biosurfactants is

12
restricted to high added value products unless methods for cheap production and
purification are developed.
Plant based surfactants: Surfactants from renewable sources like plant are gaining
importance in recent years. The lipophile group of plant surfactants can come from
oleochemical raw materials derived from rapeseed, sunflower, palm, or other plants. The
hydrophile segment can come from co-products of the starch or sugar industries (sugar
beets, derivatives of maize or other grain crops). They are used in hygiene products,
cosmetics, pharmaceuticals, detergents and surfacing agents. The European market for
surfactants represented 2.3 million tonnes in 2000, of which about 20 % were derived
from plants. AGRICE (Agriculture for Chemicals and Energy) pertain to synthesis of
new molecules with surfactant properties using environmentally friendly chemical
processes and focusing on the development, simplification and optimization of chemical
and microbiological synthesis of plant surfactants.
Natural plant derived surfactants mainly surface active agents like saponins
without much processing are of main focus in recent years. Saponin glycoside from
quillaja bark (Hong et al., 2002) and another palnt based nonionic surfactant derived from
Sapindus mukorossi, commonly known as “Soapnut” or “Reetha” in the Indian
subcontinent, has been tested to remediate contaminated soils (Kommalapati, 1995).
2.4 Surfactant solubilization
The surfactant aggregates allow partitioning of the hydrocarbons into the hydrophobic
pseudophase of the micellar core (Miller and Bartha, 1989; Rouse et al., 1994).
Surfactant micelles have received much attention because micelles are able to solubilize
hydrophobic organic compounds which have low water solubility through incorporation
of them into the hydrocarbon-like core of the micelle and partitioning of hydrophobic
organic compounds between the micelle cores of surfactant and surrounding water. This
phenomenon greatly enhances the total concentration of a compound in solution above its
aqueous solubility, and is referred to as “solubilization” (Rouse et al., 1994). Micellar
solubilization can be further enhanced as the hydrophobic chain length increases, and
hence the size of micelle (Thangamani and Shreve, 1994). Solubilization also increases
with reduction in the ionic charge of the hydrophilic end (Porter, 1991). But in some

13
cases loose packing of micelle increase the solubility with bulk polar head group (Abe et
al., 1987), more interaction results in solubility reduction due to tight packing of
surfactants i.e allowing less solute into micelle core while surfactants enhance the
removal of hydrocarbons by increasing their aqueous-plus-micellar “solubilities,” thereby
facilitating transport across cell membranes and making them more available for
degradation (Falatko and Novak, 1992). Studies have shown that application of
surfactants result in a several-fold increase in the solubility of hydrocarbons (Zhang and
Miller, 1992). Many of the most persistent contaminants especially PAH (poly aromatic
hydrocarbons) exhibit low water solubility and hence, solubility of contaminants can
often be improved by addition of surfactants.
2.5 Application of surfactants in remediation
The bioavailability of polycyclic aromatic hydrocarbons in soils is often limited by their
low solubility and strong sorption to soil. As a way to increase the bioavailability of PAH
contaminated soil, surfactant aided soil flushing has been considered for dissolving and
mobilizing the soil bound hydrophobic contaminants (Moon et al., 2003; Ko et al., 1998;
Yeom, 1996). Beginning with use by petroleum industries for oil recovery, surfactants
have been applied in the field (Volkering et al., 1998) and research has been conducted
on contaminated soil remediation applications (Willumsen and Karlson, 1998; Tsomides
et al., 1995; Tiehmn et al., 1997). Three types of surfactants cationic, anionic and
nonionic surfactants– have been considered for use in soil washing. Many researchers
have reported that surfactants could increase the solubility and mass transfer of
hydrophobic organic compounds (Volkering et al, 1998; Rothmel et al., 1998). The
increased bioavailability with surfactant addition can be attributed to two main
mechanisms based on the nature of contaminant. First, surfactants can reduce the
interfacial tension between the aqueous phase and the non-aqueous phase liquid (NAPL).
Therefore, the presence of the surfactant can disperse the NAPL and increase the contact
area. Increased dispersion and contact area of the NAPL can give enhanced
bioavailability for microorganisms. Second, the surfactant can increase the aqueous
solubility of less soluble organic compounds significantly. Increased solubility of organic
compounds can provide more available substrate for microorganisms. Schippers et al.

14
(2000) proposed three possible mechanisms to explain the enhanced biodegradation of
PAH by the surfactant addition. The first mechanism is that bacteria might be able to
utilize micellar solubilized / micelle portioned PAHs directly through the cell membrane.
The second mechanism is that surfactant can increase mass transfer to the aqueous phase,
and bacteria might subsequently use the aqueous phase PAHs. The third mechanism is
that the surfactant might change the hydrophobicity of the cell surface, and the changed
hydrophobicity might enhance the direct cell attachment to PAHs or NAPL.
In general, surfactants could enhance the apparent solubility of PAHs by micellar
formation, which commences at the CMC and then solubility is proportional to surfactant
concentration (Edwards et al., 1991). However, biodegradation of PAHs is not always
correspondingly enhanced by surfactants. Some research groups have found that addition
of surfactants stimulated PAH biodegradation (Aronstein and Alexander, 1992; Bury and
Miller, 1993; Tiehm, 1994; Volkering et al., 1995; Boonchan et al., 1998), whereas others
reported no effect (Laha and Luthy, 1991) or inhibition by surfactants (Guha and Jaffe,
1996; Boonchan et al., 1998). The contradictory results may be due to the varied
interactions among PAH-degrading species, PAHs, and surfactants. Surfactants may be
used as a growth substrate in preference to PAH compounds or toxic to some
microorganisms, and hence PAH degradation would be reduced. If surfactants are neither
toxic nor growth substrates, they can either enhance degradation of PAHs by solubilizing
the PAHs inside the micelle that are accessible to microorganisms, or decrease
degradation by preventing cells from directly contacting PAHs (Guha and Jaffe, 1996;
Stelmack et al., 1999). By reducing surface and interfacial tension between liquids, solids
and gases, allowing them to disperse readily as emulsions, chemical or biological
surfactants may have variable effects on contaminant biodegradation (Banat et al., 2000).
2.6 Effects of surfactants on biodegradation of organic contaminants
2.6.1 Synthetic surfactants: uses and limitations
Numerous batch and column studies have indicated that surfactants enhance recoveries of
non-aqueous phase lipids NAPL (Ellis et al., 1985; Soerens et al., 1992) by solubility
enhancement or desorption. There have also been indications that pretreatment of a soil

15
with surfactant washing (Igepal CA-720) to solubilize PAHs enhances biodegradtion of
these contaminants (Joshi and Lee, 1995).
Table-2.2: Selected studies involving the use of synthetic surfactants to stimulate
hydrophobic organic contaminant biodegradation (Makkar and Rockne, 2003).
Compound Surfactant (b) Medium Surfactant
conc.
Effect on biodegradation
kinetics
Phenanthrene Nonionic surfactants Liquid CMC 0
Phenanthrene Nonionic surfactants Liquid > CMC __
Phenanthrene, pyrene, fluoranthene, fluorene,
and anthracene
Nonionic surfactants, sodium dodecyl sulfate
Liquid >CMC -
Naphthalene and phenanthrene
Triton X-100, Brij-35, Tergitol NPX, Igepal CA-720
Liquid >CMC +
Phenanthrene Tween 80 Soil >CMC +
Naphthalene Triton X-100, Brij-30, Liquid >CMC +
Phenanthrene Triton X-100, Triton X-102, Triton CF-21, Triton N-101,
Brij-30, Brij-35, polyoxyethylene 10 laurylether,
Tergitol 15-S-9
Liquid >CMC +
Phenanthrene Tergitol NP-10, Tergitol 15-S- 20, Tergitol TMN-10
Liquid >CMC -
Phenanthrene Tergitol NP-10 Liquid >CMC +
Phenanthrene, pyrene, fluoranthene, fluorene,
anthracene, and substituted naphthalene
Arkopal N-300, SapogenatT-300 Soil. >CMC +
Phenanthrene Tween-40, Triton X-114, Brij-35 Soil slurry <CMC +
Naphthalene, phenanthrene, and pyrene
Triton X-100 Liquid > CMC +
Anthracene Triton X-100, Dowfax 8390 Liquid <CMC -
Naphthalene and phenanthrene
Triton X-100 Liquid >CMC +/-
Total petroleum hydrocarbons
Igepal CO-630 Liquid. >CMC +/-/0
Pyrene T10 and T15 Soil slurry >CMC +
Pyrene, chrysene, and Benzo [a] pyrene
Tween-80 Soil >CMC +
Aroclor 1242 L-Carvone, sodium dodecyl sulfate, sorbitan trioleate
Soil 100–180 mg/ml
+
Phenanthrene, acenaphthene, anthracene,
fluorene, and pyrene
Triton X-100, Triton N-101, Brij-30, Brij-35
Liquid >CMC -
+ = beneficial effect defined as a significant increase in biodegradation rate and/or extent;
- = detrimental effect; 0 = no effect

16
Studies with synthetic nonionic and anionic surfactant additions have indicated that they
can enhance/limit the biodegradation of soil xenobiotics and a range of other
hydrocarbons (Table-2.2).Nonionic surfactants have also shown to inhibit biodegradation
at concentrations above their CMC. Indeed many synthetic surfactants are known to exert
an inhibitory effect on PAH-degrading microorganisms (Tsomides et al., 1995).
However, the positive cases are counterbalanced by almost as many negative results.
Anionics and nonionic surfactants are less likely to be absorbed to the soil
surface. Cationic surfactants have been used to lower aquifer permeabilities by sorption
on to the aquifer materials (Westall et al., 1992). These are effective solubilizers, good
desorption agents, emulsifying agents, suspending agents etc. In spite of above
advantages these are having some limitations for use as some are toxic to soil
microorganisms, more degradation time, some adsorb more to the soil, increased
(pseudo) solubility (Singh et al., 2006).
2.6.2 Biosurfactants: uses and limitations
Bacteria that overproduce biosurfactants may have an important role in the
biodegradation process (Ron and Rosenberg, 2002). In terms of physicochemical
properties such as surface activity as well as pH and heat stability, many biosurfactants
are comparable to synthetic surfactants (Georgiou et al., 1992). These have the following
potential advantages i.e. these are made of cheap sources like microbes on cheap
substrates / wastes, low critical micelle concentration (CMC), high biodegradability over
synthetic surfactants and, therefore, are particularly well suited for environmental
applications such as bioremediation and the dispersion of oil spills. (Leahy et al.,1990;
Fiechter et al.,1992; Van Dyke et al.,1991). Some studies about solubility enhancement
and biodegradation using biosurfactants raise a new alternative for the use of
conventional synthetic surfactants in various environments (Table-2.3).
Due to some technical and/ or economic reasons biosurfactants have not been
employed extensively in industry. Like most microbial metabolites, biosurfactants exist
in fermentation broth of complex composition at relatively low concentrations, which
often makes the costs associated with the isolation and purification of biosurfactants
prohibitively high. To make the large-scale production of biosurfactants possible, it’s
necessary to undergo the time consuming and labor-intensive strain improvement

17
programs and medium optimization studies generally rely on the availability of efficient
and specific analysis techniques for biosurfactants.
Table-2.3: Selected studies involving the use of biosurfactants to stimulate hydrophobic
organic contaminant biodegradation (Makkar and Rockne, 2003).
Compound(s) Surfactant Medium Organism(s) Effect on
biodegradatio
n kinetics (b)
Crude oil Emulsan Liquid Acinetobacter calcoaceticusRAG-1
0
14-16 C alkanes, pristine phenyldecane,
and naphthalene
Sophorose lipid
Liquid Mixed population +
Hexachlorobiphenyl Rhamnolipid Soil slurries
Pseudomonas aeruginosa UG12
+
Octadecane Rhamnolipid Soil Pseudomonas aeruginosaATCC 9027c
+
Hexachlorobiphenyl Rhamnolipid, Emulsan
Soil Pseudomonas aeruginosa, Acinetobacter
calcoaceticusRAG-1
+
Aliphatic and aromatic hydrocarbons
Rhamnolipid Soil Pseudomonas aeruginosaUG12
+
Phenanthrene Rhamnolipid Soil slurries
Pseudomonas aeruginosa UG12
+
Metals, phenanthrene, andPCBs
Rhamnolipid Soil Pseudomonas aeruginosa ATCC 9027
+
Mixture of alkanes and naphthalene
Rhamnolipid and oleophilic
fertilizer
Soil Pseudomonas aeruginosa +
4,4’-dichlorobiphenyl Rhamnolipid Soil Pseudomonas aeruginosa +
Phenanthrene, pyrene, and B[a]PSodium
dodecyl sulfate and
Rhamnolipid Soil Pseudomonas aeruginosa UG2 --
Naphthalene Rhamnolipid Soil Pseudomonas aeruginosa 19SJ +
Naphthalene and phenanthrene
Rhamnolipid Soil Pseudomonas aeruginosaATCC 9027
+
Naphthalene and methyl naphthalene
Glycolipid andTween 80
Liquid Rhodococcus sp H13A +
Hexadecane and kerosene oil
Crude surfactin
Soil +
Crude oil Biosurfactant Liquid
Bacillus subtilis ATCC 2423
0
Phenanthrene and hexadecane
Rhamnolipid Soil Pseudomonas aeruginosa UG2 +
Phenanthrene, fluoranthene, pyrene,
B[a]P, and pentachlorophenol,
endosulfan
Rhamnolipid,
Crude surfactin
Soil
Soil
Pseudomonas aeruginosa #64,
Bacillus subtilis ATCC 2423 1, 1
+
+

18
Phenanthrene, fluoranthene, and
pyrene
Alasan Liquid
Acinetobacter radioresistensKA53
+
Aliphatic and aromatic hydrocarbons
Crude surfactin
Sea water Bacillus subtilis O9 +
Phenanthrene Sophorolipid Soil Candida bombicola ATCC22214
+
Phenanthrene and cadmium
Rhamnolipid Soil Pseudomonas aeruginosa ATCC 9027
+
Naphthalene and cadmium
Mono-rhamnolipid
Soil Pseudomonas aeruginosaATCC 9027
+
Toluene, ethyl benzene,and butyl
benzene
Di-rhamnolipid
Liquid Pseudomonas +
Unfortunately, for the most biosurfactants reported so far the techniques
frequently employed for the detection of biosurfactants have been surface/interfacial
tension measurements (Akit et al., 1981; MacDonald et al., 1981; Ramsay et al., 1988;
Hommel et al., 1987; Persson et al., 1988). Many researchers have investigated the
effects of biosurfactants on bioremediation and it is acknowledged that precise
mechanisms are not easily elucidated in bioremediation systems because multiple
variables are typically in play.
These studies that were performed with strains that take up dissolved substrate
indicate that the effect of surfactants on biodegradation rates in these cases was
exclusively caused by their effect on dissolution rates. When substrate is not taken up
from the dissolved aqueous phase but by direct attachment of the cells to the substrate,
surfactants may negatively affect uptake and biodegradation (Churchill, P.F. and
Churchill, 1997). Surfactants render these substrate droplets hydrophilic and inhibit
bacterial attachment (Efroymson and Alexander, 1991; Stelmack et al., 1999). The
description of biodegradation rates based on independently determined mass transfer
processes is more difficult for cells that take up substrate by attachment of the cells to the
substrate than for cells that take up dissolved or solubilized substrate. The quantitative
analysis of degradation kinetics for strains using the former uptake mode deserves further
attention. Several studies have investigated the effect of surfactants on biodegradation of
contaminants in field-contaminated soil, as reviewed by Volkering et al (1998).
Volkering concludes that more positive results generally were found during experiments
with field contaminated soil than with soil contaminated in the laboratory (Volkering et

19
al., 1998). This might indicate that surfactants generally perform better during situations
with lower bioavailability of contaminants. Few field scale applications of surfactants
during bioremediation have been reported in Table-2.4 The ultimate objective of any
surfactant enhanced remediation study should be beneficial to environment with easy
biodegradability after the application, economical, must enhance the degradation of
contaminants etc. Plant based surfactants are a novel alternative from conventional
resources with satisfying the above objectives.
Table-2.4:. Summaries of surfactant soil flushing field tests.
Group Process Contaminant removed Reference
SUNY-Buffalo with Dupont at Corpus Christi Site
Addition of 1% surfactant (approved in food preparation) Witconol 2722 and Tergitol 15-S012
73 gal carbon tetrachloride successfully removed in comparison to pump and treat
Fountain (1993)
Canadian Air Forces Base at Borden (SUNY)
2% mixture of surfactant added to sandy aquifer
80% of PCE recovered Fountain and Hodges (1992)
General Motors NAO Research and Development Center
0.75% nonionic ethoxylated surfactant washing with recovery
10% of PCBs, oils removed in first test and 14% in second exceeding expectations
Ang and Abdul (1991)
University of Michigan
Injection of 4% Witconol and Tween 80 and modeling
Removal of 10% dodecane required 0.7 1 surfactant and 130,0001 water
Abriola et al. (1993)
Eckenfelder, Inc. Injection of 2.5% SDS and recycle/reuse of surfactant
Injection of 7.7 pore volumes of 2.5% SDS removed as much PCB as 20 to 40 pore volumes of water (90% waste volume reduction)
Underwood et al. (1993)
US DOE Gaseous Diffusion SitePortmouth, OH
4% sodium dihexyl sulfosuccinate surfactant/4% isopropyl alcohol as cosolvent and 2% electrolyte (1:1 NaCl and CaCl2)
DNAPLs, TCE with some PCBs and other chlorinated solvents, >90% removed by solubilization
Jafvert (1996)
Ecosites Inc., Estrie Reg. Shop, Que., Canada
Biodegradable nontoxic surfactant
Hydrocarbons, LNAPLs, "Cutting Oil", 160,000 kg hydrocarbon recovered in 12 months, US$ 1.2 million Cdn for fulll scale, commercial completed project
Jafvert (1996)
Fredicksburg, VA Wood treating site
Alkaline agent (0.5% Na2CO3), nonyl phenol surfactant with 10 mol ethylene oxide (0.1 % wt Makon-10) and polymer (1500 mg/1 xanthan gum)
Creosote-based wood treating oil (DNAPL), unable to inject fluid, poor site evaluation
Rice University (1997)

20
TWCC Biosolve Group Patented non-hazardous, biodegradable surfactant (1-2% concentration)
80% removal of NAPL, 90% removal of transmission fluids in Northern California, increases biodegradation by 30%. Cost US$ 0.35-0.85 per gallon
USEPA (1998)
Hill Air Force Base, Layton, UT Cell 5, Surfactant Mobilization
6.6 PV of surfactant (2.2% Aerosol OT/ 2.1%Tween) and Electrolyte (CaCl2) injected
LNAPL (JP-4 jet fuel, chlorinated and nonchlorinated VOCs, naphthalene, pesticides, PCBs, dioxins)
Jafvert (1996)
Cell 6, surfactant Solubilization
10 PV of 4.3% surfactant (Dowfax)
Mixture of VOCs, naphthalene, pesticides, PCBs, dioxins, JP-4 fuel
Jafvert (1996)
Cell 8, Surfactant/cosolvent solubilization
Surfactant (3.5% wt Brij 91) and cosolvent (2.5% wt n-pentanol), < 10 PV injected
LNAPL (JP-4 jet fuel, chlorinated and nonchlorinated solvents, PCBs), 72% average reduction
AATDF (1998)
OU2-Micellar Flood 0.6 PV of surfactant (7.5% sodium dihexyl sulfosuccinate), cosolvent (3.75% isopropyl alcohol) and electrolyte (7000 mg/1 NaCl)
chlorinated solvents (TCE, TCA, PCE, and TCET), petroleum hydrocarbons, DNAPL (70% TCE), 99% recovery of DNAPL
Jafvert (1996)
Volk Air National Guard Base, WI
9-14 PV of Adsee 799 and Hyonic PE-90 (50:50) blend
Hydrocarbons, chlorinated hydrocarbons (Dichloromethane, chloroform, TCA, TCE)
Nash (1988)
2.6.3 Plant surfactants: uses and limitations
Plant based surfactants with less purification steps are under spot light; efficient and
found to be economical for contaminant remediation processes. Saponins of this class are
glycosides widely distributed in the plant kingdom. They include a diverse group of
compounds characterized by their structure containing a steroidal or triterpenoid aglycone
and one or more sugar chains.Saponins as commercially significant compounds with
expanding applications in food, cosmetics, and pharmaceutical sectors (Price et al., 1987;
Oakenfull, 1981; Fenwick et al., 1991; Hostettmann and Marston, 1995; Oakenfull and
Sidhu, 1989) with their physicochemical (surfactant) properties (San Martin and Briones,
1999) and mounting evidence on their biological activity (such as anticancer and
anticholesterol activity) (Gurfinkel and Rao, 2003; Kim et al., 2003b). Purified saponins
and saponin mixtures resulted in both enhancements and reductions in water solubility of
test compounds like quercetin (Schpke and Bartlakowski, 1997), digitoxin (Walthelm et

21
al., 2001), rutin (Walthelm et al., 2001), and aesculin (Walthelm et al., 2001), the extent
of which was determined by concentration of saponin and the model compound. For
example solubility enhancement of quercetin obtained by pure saponins at concentrations
> cmc values can be attributed to micellar solubilization, whereas solubilization effect of
some saponin mixtures at concentrations < cmc points to an alternative mechanism
(Schpke and Bartlakowski, 1997).
Solubilization properties of saponins well discussed in some remediation studies.
Saponin from quillaja bark reported having potential for heavy metal removal from
contaminated sites (Hong et al., 2002). While palnt based nonionic surfactant derived
from Sapindus mukoross, has been tested to remediate contaminated soils.. Laboratory
studies revealed its potential for remediation of contaminated soils by desorption and
solubilization (Kommalapati et al., 1997). The recorded use of this product as common
soap does not cite any toxic effects on human skin and eyes (Windholz, 1983). Along
with all this surfactant showed better microbial growth with rapid degradation property
both in aerobic and anaerobic conditions (Kommalapati and Roy, 1996, 1997). Limited
use of these surfactant compounds are mainly due to their region specificity and are not
available in all parts of the world.
2.7 Concluding remarks
Conventional bioremediation processes for PAHs contaminated soil have been known to
have limitations because of the low solubility and strong sorption of PAHs to soil. In
order to overcome the limitation of bioavailability, surfactant aided PAH bioremediation
has been considered over the last few decades. However, even though much research has
been conducted on surfactant aided PAH remediation; bacterial responses to synthetic
surfactants have not produced any robust results. Bisurfactants may be an alternative, but
are used limited in bulk and practical applications. From economical and engineering
points of view, it is crucial to know the biological response of surfactant addition on PAH
degrading bacteria in order to develop practical surfactant enhanced bioremediation
strategies. Natural surfactants from plant origin are cheap, abundant, eco friendly and are
easily biodegradable than synthetic surfactants.Much more research is required to make

22
the application of natural plant surfactants a standard tool in biological soil and water
remediation.
2.8 Motivation
Surfactants from renewable sources are of increasing interest in recent years and the
potential of plant based surfactants from various sources are not fully explored. Sapindus
mukorossi known as Reetha is widely grown in tropical countries like India and has
surface active properties. Although its incorporation is seen in some herbal and toilet
formulations; its use in remediation of organic contaminants like PAHs focused very
little. It will be healthy if it’s PAHs solubilizing and easy degradation properties are
effectively utilized. The incorporation of this cheap surfactant with synthetic surfactants
can limit the use of synthetic surfactants which are costly and are environmental hazards
if used in bulk scale.
2.9 Research objectives
The overall objective of the project is to study the mixed micellar, solubilization, and
PAH biodegradation behavior of plant based natural surfactant from Sapindus mukorossi
(Reetha) with synthetic surfactants for the application of polycyclic aromatic
hydrocarbons remediation.
The specific objectives of this study are:
• To know naphthalene solubilization efficiency of natural surfactant and
comparative studies with synthetic pure surfactants.
• To elucidate the mixed micellar behavior of Reetha − synthetic mixed surfactants.
• To know the solubilization behavior of naphthalene in presence Reetha – mixed
surfactant systems and to correlate that with mixed micellar behavior.
• To observe the biodegradation of naphthalene in presence of Reetha, synthetic
and Reetha − synthetic surfactant mixtures.
• Evaluate and estimate the degradation potential of mixed cultures in presence of
Reetha – synthetic surfactant systems along with pure surfactants.

23
Chapter 3
Solubilization of naphthalene in presence of
Sapindus mukorossi −−−− synthetic mixed
surfactant systems.
3.1 Introduction
Surfactants flushing emerged as new alternative to treat PAH contaminated soil and water
systems and many laboratory studies are reported (Zhu and Feng, 2003). Surfactants in
aqueous solution solubilize the water insoluble hydrophobic compounds in the core of the
micelles (Edwards et al., 1991). The effectiveness of a surfactant in solubilizing a
particular solute is known as MSR, expressed by (Edwards et al.,1991).
MSR = (S–SCMC)/ (CS–CMC) (3.1)
Where S and SCMC are the apparent solubility of an organic compound at surfactant
concentration CS (CS > CMC) and that at the CMC respectively. Thus, when solute
concentration in solvent phase is plotted against surfactant concentration above the CMC,
MSR can be determined from the slope of the linearly fitted line.
Mixed surfactants systems for the remediation of organic contaminants gaining
more and more importance over the single surfactants in recent years, due to its better
performance than the single surfactants (Paria and Yuet, 2006; Zhu and Chiou, 2001). The
solubilization performances of organic compounds in mixed surfactants aiming for

24
remediation application are mostly laboratory scale and limited than that of single
surfactants (Zhu and Feng, 2003; Paria and Yuet, 2006; Zhu and Chiou, 2001; Dar et al.,
2007; Mohamed and Mahfoodh, 2006; Zhou and Zhu, 2004). However, till now there is a
very little information available on their fate in sub surface. The surfactants left in sub–
surface after the remediation process may have a negative or positive influence on the
biodegradation of the organic compounds (Liu et al., 1995). The non–biodegradable
synthetic surfactants along with organic contaminants become hazard to the environment.
In this case, the surfactant toxicity and it’s potential to be carefully considered prior to the
selection of surfactants for soil and water bodies cleanup (De Oude, 1992). Biosurfactants
are found to be promising recently, due to its environmentally friendly nature; however,
their use has been limited in industry due to some technical and/or economic reasons.
Natural surfactants from plant origin may gain more importance in future, but very few
studies have been done employing them for hydrophobic contaminants removal from the
soil (Kommalapati et al., 1997).
Plant based natural surfactant derived from Sapindus mukorossi, commonly
known as “soapnut” or Reetha is a saponin, a non–ionic glycoside contains sugars such as
D–glucose, D–xylose, L–arbinose, L–rhamnose and glucoronic acid (Row and Rukmini,
1966). Solubilization studies using Reetha surfactant exposed its remediation potential on
different hydrophobic contaminants in soil and water systems (Balakrishnan et al., 2006;
Kommalapati and Roy, 1997) along with efficient biodegradable property under both
aerobic and anaerobic conditions (Kommalapati and Roy, 1997; Kommalapati and Roy,
1996).
In this study, we have studied the solubilization of naphthalene in presence of
Reetha in different proportions with cationic, nonionic and anionic synthetic surfactants,
which has not been reported to the best of our knowledge. The objective of this paper is
to evaluate the efficiency of Reetha surfactant and synthetic–Reetha surfactant
combinations to solubilize naphthalene in aqueous systems using batch studies for the
application of surfactant enhanced remediation soil and other applications like detergency
and industrial cleaning etc. As the synthetic surfactants hinders biodegradation process
(Guha et al., 1998; Yuan et al., 2000), that used in remediation process or in laundry
cleaning creates lots of environmental problem. The use of only natural surfactant or

25
synthetic–natural surfactant mixture enables easy degradation. Nowadays, many
countries are trying to focus on the biosurfactants from microorganism as a substitute of
synthetic surfactants, but in our view, production of plant based surfactant is very easy in
compare to biosurfactants and huge amount of plant surfactant production is possible to
substitute synthetic surfactants. In that respect, it is worthy to give more insight in this
area.
3.2 Experimental section
3.2.1 Materials: The surfactants TX–100, CTAB, AOT, and SOS were obtained from
Loba chemie Pvt Ltd, India, Sodium dodecyl benzene sulfonate (SDBS) from Sigma
Aldrich, Germany; Naphthalene from Spectrochem Pvt. Ltd, India. All the chemicals
were used as received. Dry fruit (Reetha or S. mukorossi) was purchased from the local
market, Rourkela, Orissa, India. The structures of surfactants used in this study are shown
in the Figure-3.1 Ultra pure water (Sartorius AG Gottingen, Germany) was used for the
experiments of 18.2 mΩ resistivity and pH 6.8 – 7. Surface tension of surfactant solutions
were determined by Whilmey plate method using a surface tensiometer, Data Physics,
Germany (DCAT–11EC). Naphthalene concentrations were measured by UV–Vis.
spectrophotometer (Jasco, Japan, V–530). The organic content of the plant surfactant
solution was measured by total organic carbon analyzer (Shimadzu, Japan, TOC–VCPN).
3.2.2 Extraction of Reetha surfactant from the fruit: After removing seed from fruit,
the pericarp was dried in an oven at 50 °C for about 48 hours and then powdered in a
grinder. The powdered sample was extracted with methanol gave brown syrup. The
suspended particles were separated by centrifugation at 8000 rpm for 15 – 20 min. and
followed by vaccum evaporation and drying of the extract at 60 – 80 °C which gave a
light yellowish white colored powder.
3.2.3 Methods: All the solubility experiments were done in the poly propylene falcon
tubes of capacity 15ml. A stock solution of naphthalene (400mM) was prepared by
dissolving naphthalene in pure methanol is preferred over higher alcohols because of its
negligible effect on solubilization and CMC values (Rosen, 2004). For experiment 0.1ml
naphthalene from the stock was added to10ml surfactant solution of a specified strength
in falcon tube, as 1% methanol will not affect the solubility of PAH (Edwards et al.,

26
1991; Paria and Yuet, 2006). The concentration and volume of the stock naphthalene
solution used in each experiment was selected to (i) keep the methanol concentration in
the test solution to below 1 vol% and (ii) to give an excess of naphthalene in the test
solution. The tube was sealed with a screw cap to prevent volatilization loss of
naphthalene from water. For the study 24 hr equilibration time was taken as kinetics of
solubilization show no change in solubility of naphthalene (Paria, 2006), after 24 hr
equilibration period and subsequent centrifugation at 5000 rpm for 30 min to separate the
suspended solids, if any, the concentration of naphthalene was determined by measuring
the absorbance at 274 nm wave length with a quartz cuvettes of 10mm path length using
an UV–Vis spectrophotometer. Note that subsequent dilutions were made where ever
needed and surfactant concentration was kept the same in both the reference and the
measurement cells to minimize the effect of surfactant on UV absorbance. All
experiments were performed at room temperature, 25 – 28 °C. Experiments were done in
triplicate and the average values are reported.
3.3 Results and discussion
3.3.1 Structure and physical properties of Reetha solution
The structure of Reetha is most important to know before doing the experiment. Huang et
al., 2003 have proposed the structure of saponin isolated from S. Mukorossi is shown in
Figure-3.1 They have mentioned that depending on the R group seven different structures
are possible. In our sample total carbon content was analyzed using TOC analyzer and
found the value of 152.5 ppm for 0.03 wt. % solution. Back calculating the TOC of all
the probable structure proposed by Huang et al., 2003 our value shows less error when
we consider the R group given in Figure-3.1 and with a molecular weight of 966. We
have also compared our TOC value with the reported value by Kommalapati and Roy,
1997 was 41 g/l for 10 % solution that is close to our value 49.24 g/l. The CMC of
Reetha solution found was around 0.05 wt % (0.510 mM) as measured by surface
tensiometer which is comparable with the reported value 0.045 wt % (Balakrishnan et al.,
2006). The CMC value obtained from solubilization curve (0.517 mM) is also shows
good agreement with the surface tension data. pH of 1 % solution was 4.34 close to the
reported value of 4.5 (Kommalapati and Roy, 1997).

27
Figure-3.1: Structures of surfactant molecules used in this study (a) SDBS, (b) SOS, (c)
AOT, (d) CTAB, (e) TX -100, and (f) Reetha.
3.3.2 Solubilization by single surfactants
In this section we have mainly focused on the solubilization behavior in presence of
mixture of Reetha and different synthetic surfactants. Before studying the mixed systems,
single surfactants were studied to get an idea about the effectiveness of different synthetic
surfactants (TX–100, CTAB, SDBS, SOS, and AOT) with respect to Reetha. The
solubility of naphthalene in presence of synthetic surfactants and Reetha is shown in
(f)
R =
N+
CH3
CH3
CH3H3C(CH2)14H2C
Br-
(c) (d)
CH3S ONa
O
O
(a) (b)
n = 9.5
(e)

28
Figures-3.2 (a) - (d). MSR values of the single surfactant systems are calculated from the
slope of the linear portion of the experimental data (Surfactant concentration in mM vs.
naphthalene concentration in mM) given in Table-3.1. The effectiveness of solubilization
can also be expressed in terms of the other parameter like partition coefficient (Km). The
partition coefficient is defined as partition of the organic compound between micelles and
the aqueous phase, can be written as
Km = Xm/Xa (3.2)
where Xm and Xa are the mole fractions of solute in micelles and the aqueous phase,
respectively. The value of Xm can be calculated as Xm = MSR/(1 + MSR), and Xa can be
expressed as Xa = SCMCVw, where Vw = 0.01805 L/mol is the molar volume of water.
Consequently, eq. (2) can be rearranged to yield
( )MSRVS
MSRK
wCMC
m+
=
1 (3.3)
The following order of MSR and log Km values are observed: TX–100 > CTAB > Reetha
> SDBS > AOT > SOS, shown in Table-3.1. The difference between Reetha and SDBS is
found very close. The increasing order of CMC values of these surfactants are: TX–100 <
Reetha < CTAB < SDBS < AOT < SOS. In general, lower the CMC values higher the
solubilization efficiency of the surfactants. Here, except Reetha, all the synthetic
surfactants studied are followed the CMC rule. Efficiency of Reetha is expected after
TX–100 but practically it is just after CTAB. In general, it is reported, non ionic
surfactants are better solubilizing than ionic surfactants, because of their lower CMC.
Even, solubilization capacity of a nonionic surfactant of polyoxyethylene type for water
insoluble materials is much greater than that of an ionic surfactant having the same
hydrocarbon chain length as that of the nonionic surfactant, this fact suggests that the
polyoxyethylene part in the molecule also plays an important role in solubilization
(Tokiwa, 1968). Between cationic and anionic surfactants with similar chain length
cationic surfactant shows greater solubilization efficiency of PAHs due to adsorption at
micellar water interface in addition to solubilization in the inner core of the micelle
(Paria, 2006). Here, though the CMCs of CTAB and SDBS are very close, due to chain
length difference and cationic nature, CTAB shows higher solubilization efficiency. Less
solubilization efficiency of Reetha than expected based on the CMC value is attributed in

29
terms of complex structure of the micellar core due to bulkiness of both the hydrophobic
(tail) and hydrophilic (head) group. Hydrophobic part is consisting of five six member
cyclic hydrocarbon rings resulting shorter effective chain length and less hydrophobic in
nature. As a general rule, incorporation of a phenyl group in the alkyl group increases its
hydrophobicity to a much smaller extent than increasing its chain length with the same
number of carbon atoms (Tedros, 2005). Another reason may be the presence of
carboxylic group in the hydrophobic region reduces the solubilization of naphthalene
molecule in the inner core due to repulsion between the carboxylic group and π–electron
cloud of naphthalene ring. Among the synthetic surfactants TX–100 and AOT have
branched chain hydrocarbon tail and others are having straight chains, as a result, their
core region is not as complicated as Reetha and more hydrophobic in nature due to
presence straight or branched chain hydrocarbon tail. Finally, the micellar aggregation
number also plays an important role in the solubilization. The decreased aggregation
number in the micelles causes reduced solubilization of nonpolar substances (Rosen,
2004). The reported values of micellar aggregation number of the surfactants TX-100,
CTAB, SDBS, AOT, SOS, and Reetha are ~ 145 (Tummino and Gafni, 1993), ~ 60
(Saroja et al., 1999), ~ 28 (Cheng and Gulari, 1982), ~22 (Umlong and Ismail, 2005), ~
25 (Tarter, 1955), ~ 21 (Balakrishnan et al., 2006) respectively. All the synthetic
surfactants show the increasing solubility order according the order of micellar
aggregation numbers. Although Reetha is having lowest micellar aggregation number but
showing higher solubility than SDBS, AOT, and SOS due to its low CMC value. Lower
micellar aggregation number indicates lower solubilization capacity per micelle, but at
the same time lower CMC indicates more number of micelles present at a particular
concentration. Since SDBS, AOT, and SOS are showing higher CMC than Reetha, they
are having lower solubilization efficiency.

30
0
0.2
0.4
0.6
0.8
1
1.2
1.4
0 5 10 15 20
Reetha
Nap
hth
ale
ne
Con
cen
tra
tio
n (
mM
)
Surfactant Concentration (mM)
(a)
0
0.2
0.4
0.6
0.8
1
1.2
0 0.5 1 1.5 2 2.5 3
TX-100
Nap
hth
ale
ne
Con
cen
tra
tio
n (
mM
)
Surfactant Concentration (mM)
(b)
0
0.5
1
1.5
2
0 100 200 300 400 500
SOS
Nap
hth
ale
ne
Con
cen
tra
tio
n (
mM
)
Surfactant Concentration (mM)
(c)
0
0.2
0.4
0.6
0.8
1
1.2
1.4
0 2 4 6 8 10 12
SDBSAOTCTAB
Nap
hth
ale
ne
Con
cen
tra
tio
n (
mM
)
Surfactant Concentration (mM)
(d)
Figure-3.2: Solubilization of naphthalene by using surfactants (a) Reetha, (b) TX–100
(c) SOS, (d) SDBS, CTAB, and AOT.
3.3.3 Solubilization by surfactant mixtures
Solubilization of naphthalene by aqueous surfactant mixtures composed of Reetha with
TX–100, CTAB, SDBS, AOT and SOS are done by taking different mole proportions of
surfactants and compared with those by single surfactants. The plots on change of
naphthalene solubilization in presence of mixed surfactant systems are shown
in Figure-3.3. Table-3.1 summarizes different parameter values of mixed surfactant
systems like mixed CMC, MSR, and log Km. Mixed CMC values reported here are
obtained from the surface tension data; there is also a good agreement with the values
obtained from solubilization plot. It is observed from the Table-3.1 that mostly the MSR
values of mixed systems are in between that of the single surfactants. Figure-3.4 (a)
depicts the effect of change in MSR values of different synthetic surfactants in presence
of Reetha. The Figure clearly indicates the MSR values changing nonlinearly with the

31
change of mole fraction of Reetha (XR), in further, that is an indication of nonideal
behavior of mixed surfactant systems. To measure the nonideality and also to see the
nature of deviation (positive or negative) we have calculated the deviation ratio. The
Deviation ratio is calculated by
R = MSRexp/MSRideal (3.4)
Where, MSRexp is the experimentally determined MSR and MSRideal is the MSR of
naphthalene in a binary surfactant mixture based on ideal mixing, i.e.
MSRideal = MSR1X1 + MSR2X2 (3.5)
Where, X1, X2 mole fraction of surfactant 1 and 2 respectively, MSR1, MSR2 are MSR
values of pure surfactants 1 and 2 respectively. The values of R > 1 indicate positive
deviation and R < 1 indicate negative deviation. The change in R with the mole fraction
of Reetha is shown in Figure-3.4 (b).
3.3.3.1 Mixing effect of nonionic – Reetha surfactants: The mixing behavior of TX–100
– Reetha systems are depicted in Figures-3.4 (a), (b), and Table-3.1. The MSR and log
Km values with different mole fractions of Reetha show the values are decreasing with the
increase in mole fraction of Reetha (XR). The results indicate solubilization follow almost
ideal behavior with small deviation for this combination of surfactants. From the table it
is clear the deviation ratio (R) is close to 1 for most of the compositions and % change in
MSR (∆MSR, (MSRexp – MSRideal) × 100/MSRideal or (R–1) × 100) is less than ~ –14%.
The maximum ∆MSR is observed at XR = 0.07. It is also observed that MSR values are
changing linearly (with correlation coefficient of linear fit above 0.97 and above 0.99 if
the point XR = 0.07 is excluded) for this combination with the change of Reetha mole
fraction, an indication of ideal behavior.
3.3.3.2 Mixing effect of cationic – Reetha surfactants: Similar to the previous
combination the MSR and Km values for CTAB – Reetha combination also mostly
decreased with the increase in mole fraction of Reetha (see Figures-3.4 (a), (b) and Table
3.1). Initially, with very low concentration of Reetha ∆MSR is positive and above Reetha
mole fraction of 0.14 the value becomes negative. The maximum values of positive and
negative change occurred ~ 2 % (XR = 0.14) and ~ –18 % (XR = 0.77) respectively.
Similar trend is also observed for log Km.

32
0.12
0.16
0.2
0.24
0.28
0 1 2 3 4 5 6 7 8
XR=0.05
XR=0.16
XR=0.32
XR=0.52
XR=0.81
Nap
tha
len
e C
on
cen
trati
on
(m
M)
Surfactant Concentration (mM)
(d)
0
0.2
0.4
0.6
0.8
1
1.2
0 1 2 3 4 5 6 7 8
XR = 0.77
XR = 0.47
XR = 0.27
XR = 0.14
XR = 0.04
Nap
tha
len
e C
on
cen
trati
on
(m
M)
Surfactant Concentration (mM)
(b)
0.1
0.2
0.3
0.4
0.5
0.6
0.7
0.8
0.9
0 0.4 0.8 1.2 1.6 2 2.4 2.8
XR = 0.86
XR = 0.61
XR = 0.40
XR = 0.22
XR = 0.07
Nap
tha
len
e C
on
cen
trati
on
( m
M )
Surfactant Concentration (mM)
(a)
0.1
0.15
0.2
0.25
0.3
0.35
0.4
0.45
0.5
0 2 4 6 8 10 12
XR=0.04
XR=0.13
XR=0.27
XR=0.46
XR=0.76
Nap
tha
len
e C
on
cen
trati
on
(m
M)
Surfactant Concentration (mM)
(c)
0.1
0.2
0.3
0.4
0.5
0.6
0.7
0.8
0 20 40 60 80
XR=0.02
XR=0.09
XR=0.18
XR=0.34
Nap
tha
len
e C
on
cen
trati
on
(mM
)
Surfactant Concentration (mM)
(e)
Figure-3.3: Solubilization of naphthalene in presence of (a) TX–100 + Reetha, (b) CTAB
+ Reetha, (c) SDBS+Reetha, (d) AOT+Reetha, (e) SOS+Reetha mixed systems.
3.3.3.3 Mixing effect of anionic – Reetha surfactants: We have studied three anionic
surfactants SDBS, AOT, and SOS with a variation of chain length and structure. The
change in MSR values with XR is not following linear relationship indicating the nonideal
behavior for all the cases. It is observed from the Figure-3.4 (b) that the nature of change
in R for SDBS is in reverse order to that of CTAB with respect to mole fraction of

33
Reetha. We will explain this in detail in the section 3.5. The negative deviation for SDBS
is maximum (–39.68 %) at XR = 0.04. Negative deviation is observed up to ~ 0.5 mole
fraction, after that the deviation is positive with a very low value of maximum 1.48 %,
i.e. close to ideal behavior. In contrast to previous surfactants (TX–100, CTAB, and
SDBS) AOT shows overall negative deviation for all the compositions with more
negative values and a maximum of – 53 % at XR = 0.16. Similar to AOT, SOS also shows
over all negative deviation. Among all the surfactants studied here SOS shows highest
negative deviation of – 78.43 % at XR = 0.09.
Now, by comparing all the results of mixed surfactant systems we can conclude
that ascending order of ∆MSR are TX–100 – Reetha < CTAB – Reetha < SDBS – Reetha <
AOT – Reetha < SOS – Reetha, which is the reverse order of sequence that of single
surfactants for solubilization or same sequence of CMC. From the Table-3.1 it is worthy
to note that when the synthetic surfactants are having higher MSR than Reetha, the mixed
systems are showing lower MSR than only synthetic surfactant. Similarly, when the
synthetic surfactants are having lower MSR than Reetha then the mixed systems are
showing higher MSR than only synthetic, but the negative deviations indicate lower MSR
than expected or calculated considering ideal mixing.
3.3.4 Effect of surfactant mixtures on micelle–water partition coefficient
Treiner et al., 1998 have suggested the following relationship for the partitioning of a
neutral nonpolar organic solute between micelle and aqueous phase in a mixed surfactant
systems as
lnKm1,2 = Xm1 lnKm1 + (1 − Xm1 ) lnKm2 + BXm1(1 − Xm1 ) (3.8)
Where Km1, Km2, and Km1, 2 are the micelle – water partition coefficients of a solute for the
single surfactants constituting the mixed micelle and mixed systems respectively, Xm1 is
the micellar mole fraction of surfactant 1. B is an empirical parameter includes surfactant
– surfactant (like β) and surfactant – solute interactions. The value, B = 0 indicates there
is no mixing effect of surfactants on the partition of the solute (Zhou and Zhu, 2004), if B
> 0 or B < 0 implies that Km in the mixed surfactant system is larger or smaller
respectively than predicted by ideal mixing rule (Dar et al, 2007). X1 can be calculated
using mixed micellar theory discussed in the next section.
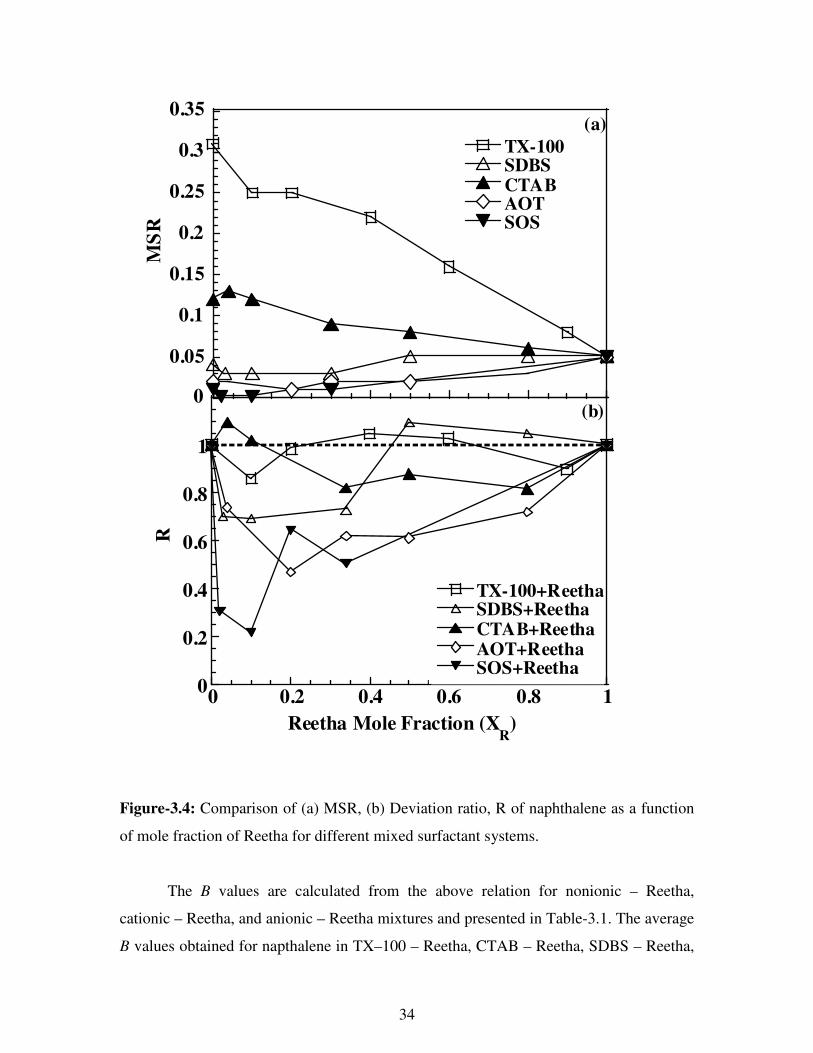
34
0
0.05
0.1
0.15
0.2
0.25
0.3
0.35
TX-100SDBSCTABAOTSOS
MS
R
(a)
0
0.2
0.4
0.6
0.8
1
0 0.2 0.4 0.6 0.8 1
TX-100+ReethaSDBS+ReethaCTAB+ReethaAOT+ReethaSOS+Reetha
R
Reetha Mole Fraction (XR
)
(b)
Figure-3.4: Comparison of (a) MSR, (b) Deviation ratio, R of naphthalene as a function
of mole fraction of Reetha for different mixed surfactant systems.
The B values are calculated from the above relation for nonionic – Reetha,
cationic – Reetha, and anionic – Reetha mixtures and presented in Table-3.1. The average
B values obtained for napthalene in TX–100 – Reetha, CTAB – Reetha, SDBS – Reetha,

35
AOT – Reetha, and SOS – Reetha mixed surfactant systems are 0.77, 0.40, −1.86, −3.21,
and −10.701 respectively. The B values are found to be negative except TX–100 and
CTAB – Reetha mixtures and the positive values are also less than one. According to the
values of B, the mixing effect of anionic – Reetha surfactants on the partition of
naphthalene is negative in SDBS – Reetha, AOT – Reetha, SOS – Reetha mixed systems
and consistent with the result of negative deviation of MSRs from the ideal, which can be
used to explain the mixing effect of anionic – nonionic surfactants on the solubilization of
naphthalene. Similarly, that of solubilization of pyrene reported by Zhou and Zhu, 2004
for anionic – nonionic systems as they got positive B value and positive deviation of
MSR. However, mixtures of TX–100 – Reetha, and CTAB – Reetha show the partition of
naphthalene is positive, which are contradictory with the some negative deviation of
MSRs for some combinations as shown in Table-3.1 with different mole fraction of
Reetha from the ideal mixture. Similar contradictory results were also found before in
other studies (Zhou and Zhu, 2004; Edwards et al., 1994; Tokuota et al., 1994). Hence,
these results indicate some times the mixing effect of surfactants on the Km1,2 is contrary
to that on the solubilization of organic compounds in mixed surfactants.
3.3.5 Solution properties of mixed surfactant systems
The results of solubilization in the mixed surfactant systems indicate the behavior is
complex in nature and mostly follow nonideal path. Since solubilization is closely
associated with the solution properties of the surfactant micelles, to explain the above
results we have studied mixed micellar properties of all the combinations. The mixed
CMC values obtained from the experiments are reported in Table-3.1. To know whether
the mixed solution follows ideal or nonideal behavior mixed CMC values were calculated
using ideal solution theory (Clint, 1975).
2
1
1
1
12
11
CMCCMCCMC
αα −
+= (3.6)
Where CMC1, CMC2, CMC12 are the critical micelle concentrations of Reetha, pure
synthetic surfactant, and mixed surfactant. α1 mole fractions of component 1 in mixed
surfactant solutions. The Table-3.1 clearly indicates that there is a deviation between the
ideal and experimental CMC values. The mixed CMCs of TX–100, CTAB, SDBS and
AOT with Reetha surfactant are intermediate between the respective individual

36
surfactants used in the combination. In the case of TX–100 – Reetha mixture the
experimental values are close to ideal, and in the other cases experimental CMC values
are lower than the ideal values, indicating negative deviation from the ideal behavior for
mixed micelle formation. The data for the other surfactants show there is a difference
between the experimental and theoretical CMC values and the deviation is highest for
SOS – Reetha mixture. In further, for nonideal binary mixture of surfactants Rubingh’s
equation of regular solution theory can be used to calculate the micellar mole fraction
(Rubingh, 1977).
( )
( )
( )
1
1
1ln1
ln
21
1212
1
11
1212
1
=
−
−
−
Cx
Cx
Cx
Cx
α
α
(3.7)
The micellar mole fraction (x1) can be calculated from equation 3.7 by solving iteratively.
To show the interaction between two surfactants, β is an interaction parameter which
indicates the interaction between two surfactant molecules in the mixed micelle and is a
measure of deviation from the ideal behavior. The parameter β can be now calculated by
substitiuting the value of x1 in the equation below
( )
2
1
11
121
1
ln
x
Cx
C
−
=
α
β (3.8)
The β parameter quantitatively captures the extent of non–ideality for a mixed surfactant
system. The negative value of β indicates synergism in mixed micelle formation, a
positive value indicates antagonism, and if zero, then mixed micelle formation is ideal.
The larger the absolute value of β, stronger the mixing non–ideality. The negative
deviation indicates a reduction in free energy of micellization over that predicted by ideal
solution theory. The larger negative value of β denotes the greater negative deviation of
CMCs from ideal mixture. All the surfactants used here show a synergistic effect in the
mixture as it satisfied the conditions (i) β must be negative (ii) ln(CMC1/CMC2) < β
(Zhou and Zhu, 2005). The extent of deviation from ideality is different for various
surfactant combination used as mentioned in Table-3.1. From the Table it is very clear
that β values are not constant for all the compositions in a particular binary mixture and

37
some compositions the variation is more. In addition, it is also observed that β values are
very much sensitive to x1, even; small change in second or third decimal level in x1 can
give a very significant change in the β parameter. The average β values for TX–100,
CTAB, SDBS, AOT, and SOS are –0.560, –0.458, –0.511, –1.022, and –4.178
respectively indicating the ascending deviation order as CTAB < SDBS < TX–100 <
AOT < SOS. These sequences are almost following the same as of ∆MSR except TX–100.
Actually, the values are very close for TX–100, CTAB, SDBS and since the β parameter
is very sensitive to x1 value, the change in sequence from the expected may be due to
that. In summary, for the combinations studied here indicate if the β parameter is more
negative, ∆MSR also more negative. From the β parameter values it can be attributed that
AOT and SOS are having more interaction with Reetha in the mixed micelle, as a result
surfactants molecules are more closely packed in the mixed micelle than the pure micelle.
Since it reported that looser packing of surfactant molecules in the mixed micelle may
increase the solubilization of organics in the micellar phase (Venable and Nauman, 1964;
Abe et al., 1987; Roy et al., 1995; Schott, 1967), in our study we have also found similar
observation. More closely packed surfactant micelle resist to enter the naphthalene
molecule from aqueous phase to micellar phase by diffusion that ultimately may reduce
the solubilization efficiency. When the interaction parameter is more, micelles are closely
packed and lead to less solubilization and greater deviation from the predicted values. It
is also observed, for the ionic surfactants deviation is more than nonionic, may be due to
closer packing of ionic micelle in presence of nonionic Reetha due to reduction in head
group repulsion.
To explain the results of Figures-3.4 (a), (b) we have plotted β and ∆MSR vs. mole
fraction of Reetha are shown in Figures-3.5 (a), (b). For CTAB – Reetha mixture
decreasing ∆MSR at high Reetha mole fraction is attributed in terms of the following
reasons. (i) With increasing the Reetha mole fraction as interaction parameter value (β)
increases, micelles are closely packed, (ii) presence of more nonionic group in the
micelle shield the cationic charge of the micelle at water micelle interface and in turn,
reduce the solubilization by adsorption at the micellar surface, (iii) micelle consists of
more Reetha molecules which has lower slolubilization capacity. For SDBS – Reetha
composition we have observed the opposite trend that of CTAB is also attributed: (i) The

38
MSR values of SDBS and Reetha are very close, so ideally there should not be much
deviation of solubilization in the mixture. However, at low concentration of Reetha
repulsion between the head groups of SDBS molecules in the micelle decreases, which
may cause close packing of the molecules in the micelle and ultimately reduce the
diffusion of naphthalene molecules inside the micellar core. (ii) With increasing Reetha
mole fraction when the micelle is dominating by Reetha (x1 ~ 0.5) the deviation is less
and becoming close to ideal. When the micelle is dominating by Reetha, solubilization is
close to that of pure Reetha and the presence of more Reetha molecule in the micelle may
shield the negative charge of the SDBS as a result repulsion between the mixed micelle
and π – electrons of naphthalene molecule also reduced. For the other two anionic
surfactants probably due to similar reason initially there is a deep minimum and with
increasing Reetha concentration as x1 increases, the solubilization of the mixture is close
to Reetha and ultimately deviation decreases.
Previously some researchers (Dar et al, 2007; Mohamed and Mahfoodh, 2006; Zhu
and Feng, 2003) have reported opposite trend in MSR in the mixed surfactant systems,
like higher MSR in the mixed systems than the individual surfactants. The solubilization
efficiency depends on many factors like type and structure of surfactants, type of
solubilizates, mixing ratio of surfactants and so on (Rosen, 2004). For those reported
studies the nonionic surfactants mixed with the ionic surfactants were higher MSR values
than the ionic surfactants, and different PAHs were used. Whereas, in contrast to that, for
our study MSR values of TX-100 and CTAB are higher than Reetha, SDBS is close to
that, SOS and AOT are lower than that, as a result we got little positive deviation in MSR
for last two surfactants. In addition to that it is note worthy, in the mixed surfactant
systems when the synergism is there (more negative β) the micelle will be more densely
packed and solubilization may decrease; but at the same time the mixed micellar CMC
also will be low. In that case, at a particular concentration, since the number of micelle
will be more the solubilization also will enhance. The amounts of positive or negative
deviation will depends on the factor which is predominant.

39
-50
-40
-30
-20
-10
0
10
20
-1.4
-1.2
-1
-0.8
-0.6
-0.4
-0.2
0
0.2∆∆∆∆
MSR(SDBS)
∆∆∆∆
MSR (CTAB)
ββββ (SDBS)ββββ (CTAB)
∆∆ ∆∆
MS
R
ββββ
(a)
-80
-60
-40
-20
0
20
-10
-8
-6
-4
-2
0
0 0.2 0.4 0.6 0.8 1
∆∆∆∆ MSR
(SOS)
∆∆∆∆ MSR
(AOT) ∆∆∆∆
MSR (TX-100)
ββββ (SOS)
ββββ (AOT)
ββββ (TX-100)
∆∆ ∆∆ M
SR
Reetha Mole Fraction (XR)
(b)
ββββ
Figure-3.5: Comparison of β and ∆MSR vs. mole fraction of Reetha for (a) SDBS, CTAB
(b) SOS, AOT, TX–100.

40
Table-3.1: Values of XR, MSR, R, ∆MSR, log Km, B, β, CMC, and x1 for mixed surfactant systems.
Surfactant XR or α1 MSR ideal MSR exp log KmExp. R ∆∆∆∆MSR (%) Bb βa CMC ideal (mM) CMCexp(mM) x1
0.00 0.312 0.312 4.937 1.000 0.00 0.000 0.000 0.309 0.309 0.000
0.07 0.294 0.253 4.866 0.859 –14.09 0.878 –1.009 0.318 0.239 0.197
0.22 0.255 0.251 4.863 0.985 –1.46 1.018 –0.984 0.339 0.292 0.227
0.40 0.209 0.219 4.815 1.049 4.95 1.029 –0.625 0.368 0.322 0.331
0.61 0.155 0.159 4.698 1.028 2.78 0.779 –0.179 0.409 0.392 0.485
0.86 0.091 0.081 4.437 0.897 –10.26 0.128 –0.194 0.437 0.456 0.765
TX–100
1.00 0.054 0.054 4.270 1.000 0.00 0.000 0.000 0.472 0.517 1.000
0.00 0.124 0.124 4.630 1.000 0.00 0.000 0.000 1.097 1.097 0.000
0.04 0.121 0.133 4.629 1.096 9.59 1.552 –0.106 1.050 1.029 0.097
0.14 0.114 0.117 4.579 1.021 2.08 0.802 –0.318 0.949 0.897 0.283
0.27 0.105 0.086 4.459 0.821 –17.92 0.072 –0.430 0.839 0.755 0.455
0.47 0.091 0.080 4.430 0.878 –12.22 0.319 –0.653 0.719 0.619 0.617
0.77 0.070 0.057 4.292 0.817 –18.30 –0.705 –1.247 0.588 0.480 0.770
CTAB
1.00 0.054 0.054 4.270 1.000 0.00 0.000 0.000 0.517 0.517 1.000
0.00 0.051 0.051 4.249 1.000 0.00 0.000 0.000 1.148 1.148 0.000
0.04 0.051 0.031 4.038 0.699 –39.68 –5.339 –0.124 1.096 1.069 0.102
0.13 0.052 0.032 4.045 0.695 –38.99 –2.377 –0.318 0.987 0.927 0.283
0.27 0.052 0.034 4.077 0.730 –34.57 –1.681 –0.429 0.867 0.781 0.455
0.46 0.052 0.053 4.262 1.093 1.06 0.004 –0.652 0.737 0.634 0.617
0.76 0.053 0.054 4.270 1.049 1.48 0.060 –1.036 0.594 0.544 0.820
SDBS
1.00 0.054 0.054 4.270 1.000 0.00 0.000 0.000 0.517 0.517 1.000
0.00 0.020 0.020 3.853 1.000 0.00 0.000 0.000 2.700 2.700 0.000
0.05 0.022 0.016 3.758 0.739 –26.08 –2.415 –0.591 2.240 1.724 0.310
0.16 0.026 0.012 3.634 0.469 –53.07 –3.955 –0.758 1.593 1.319 0.506
0.32 0.031 0.019 3.831 0.620 –38.02 –2.848 –1.207 1.159 0.886 0.635
0.52 0.038 0.023 3.912 0.613 –38.67 –3.166 –1.208 0.848 0.699 0.754
0.81 0.047 0.034 4.077 0.720 –28.01 –3.686 –1.347 0.614 0.566 0.896
AOT
1.00 0.054 0.054 4.270 1.000 0.00 0.000 0.000 0.517 0.517 1.000
0.00 0.005 0.005 3.257 1.000 0.00 0.000 0.000 157.203 157.2 0.000
0.02 0.006 0.002 2.838 0.307 –69.28 –10.598 –5.141 18.831 6.849 0.637
0.09 0.009 0.002 2.861 0.216 –78.43 –14.849 –5.102 5.715 3.524 0.762
0.18 0.014 0.009 3.511 0.646 –35.38 –9.403 –6.021 2.788 2.069 0.827
0.34 0.022 0.011 3.597 0.506 –49.42 –7.955 –9.440 1.498 1.061 0.826
0.67 –6.720 0.773 0.525 0.832
SOS
1.00 0.054 0.054 4.270 1.000 0.00 0.000 0.000 0.517 0.517 1.000
a βav: TX-100 = –0.560; CTAB= –0.458; SDBS= –0.511; AOT= –1.022; SOS= –4.178.
b Bav: TX-100 = 0.766; CTAB= 0.408; SDBS= –1.866; AOT= –3.214; SOS= –10.701.

41
3.3.6 Conclusion
The results of this study can be summarized as:
The solubilization efficiency of naphthalene by Reetha in terms of MSR is less than TX–
100 and CTAB close to SBDS, and higher than AOT, SOS. The MSR values of all the
mixed systems are in between that of single surfactants and are nonlinearly changing with
mole fraction of Reetha, the negative change in MSR than expected (∆MSR) are in the
sequence of TX–100 – Reetha < CTAB – Reetha < SDBS – Reetha < AOT – Reetha <
SOS – Reetha, which is the reverse order of the sequence that of single surfactants for
solubilization.. The interaction parameter for mixed micellization (β) is negative for all
the mixed surfactant systems indicate the synergistic behavior. The average interaction
parameter for mixed micellization, βav, for the mixtures of TX–100, CTAB, SDBS, AOT,
and SOS with Reetha is –0.560, –0.458, –0.511, –1.022, and –4.178 respectively
indicating the same order as of ∆MSR except TX–100 mixture. When the value of
interaction parameter is more negative, micelle are densely packed and solubilization is
less. From the application point of view, although the plant surfactant is environmentally
friendly due to its fast biodegradable nature, but in terms of solubilization efficiency,
commonly used synthetic surfactants like TX-100, SDBS, CTAB are better than Reetha.
So, use of plant - synthetic mixed surfactant systems may increase the solubility than
only plant surfactant and reduce the environmental problem by replacing a certain
fraction.

42
Chapter 4
Mixed micellar behavior of plant surfactant
with synthetic surfactants
4.1 Introduction
Surfactants have many applications in diversified areas such as coatings to improve
wettability of surfaces, as emulsifiers, as detergents etc and the role of mixed surfactants
proved to be more advantageous than single surfactant systems to fulfill various industrial
applications. In the economy and performance point of view mixed surfactants preferred
as they contain more than one type of surfactant and are essentially important because
most of the commercially available surfactants are mixtures with better properties than
pure surfactants. The properties of a pure surfactant are mainly determined by its
chemical structure and its geometrical arrangement within a micelle. But as known for a
long time, surfactant mixtures can show a very different behavior in comparison to their
components. The interaction between different surfactants can lead to synergism or to
antagonism, depending on the kinds of surfactants.
Some surfactant mixtures present synergistic properties and produce a high degree
of reduction in surface tension and a low critical micelle concentration (CMC) than each
pure surfactant does. Several studies have been there with different combinations of
anioinic − cationic, nonionic − anionic, nonionic − nonionic, cationic − nonionic, anionic
− biosurfactants (Rodenas et al., 1999) which are having an advantage to limit the use of

43
pure surfactants in wide applications like soil washing, detergency and many other
phenomena. Among the more important aspects to be studied in mixed surfactant
systems, there are two points particularly interesting, namely: (i) the effect of the polar
headgroup and (ii) the influence of the hydrophobic chain length of one component of the
mixture.
Here in this study we investigate the mixed micellar behaviour of nonionic natural
plant surfactant (Reetha) with cationic (CTAB), nonionic (TX-100), and anionics (SDBS,
AOT, SOS) surfactants. For the nonideal behavior of surfactants, mixed micellar
compositions and the estimation of interacting forces, we used the most common model,
Rubingh's regular solution theory. Thermodynamics of the various types of solutions that
are formed from mixing above components in different proportions also examined by
calculating and correlated the excess enthalpy of micellization with activity coefficients
as described in (Kang et al., 2001).
4.2 Experimental section
4.2.1 Materials: The surfactants SOS, AOT, CTAB and TX–100 were obtained from
Loba chemie Pvt Ltd, India. Sodium dodecyl benzene sulfonate (SDBS) has been from
Sigma Aldrich, Germany. All the chemicals were used as received. Ultra pure water
(Sartorius, Germany) was used for the experiments of 18.2 mΩ resistivity and pH 6.8 – 7.
Surface tension of surfactant solutions were determined by whilmey plate method using a
surface tensiometer, Data Physics, Germany (DCAT–11EC).
4.2.2 Extraction of Reetha surfactant from the fruit: Dry fruit (S. mukorossi) was
purchased from the local market, Rourkela, Orissa, India. And method of extraction was
same as described in earlier chapter.
4.2.3 Surface tension measurements: Surfactant solutions surface tension measured by
Wilhelmy plate method using surface tensiometer, Data Physics, Germany (DCAT–
11EC). The temperatures (±0.1ºC) were maintained by circulating thermostatic water by
a circulator through jacketed vessel containing the solution. The platinum plate used for
the measurements are cleaned with acetone and burned for each reading. The measured
surface tension values were plotted as a function of logarithm of surfactant concentration
and the critical micelle concentration (CMC) was estimated from the break point in the
resulting curve. Representative plots of surface tension (γ) vs logarithm of surfactant

44
concentration (log10 C) are shown in Figure-4.1. The reproducibility of the surface
tension (γ) vs concentration curve was checked by duplicate runs. All the samples done in
triplicate and average value has taken for the plots.
4.3 Results and Discussion
4.3.1 CMC behavior of mixtures
The critical micelle concentration (CMC) was determined by the surface tension
reduction method as shown in Figure-4.1 for pure nonionic (TX-100), cationic (CTAB)
anionics (SDBS, AOT, SOS) surfactants with and with out Reetha and are compared with
our earlier results presented in Chapter 3.
Results had good correlation and the mixed CMC values obtained from the
experiments are reported in Table-4.1. To know whether the mixed solution follows ideal
or nonideal behavior mixed CMC values were calculated using ideal solution theory
(Clint, 1975).
2
1
1
1
12
11
CMCCMCCMC
αα −
+= (3.6)
The Table-4.1 and Figure-4.2 clearly indicates that there is a deviation between the ideal
and experimental CMC values.
The mixed CMCs of TX–100, CTAB, SDBS and AOT with Reetha surfactant are
intermediate between the respective individual surfactants used in the combination. In the
case of TX–100 – Reetha mixture the experimental values are close to ideal, and in the
other cases experimental CMC values are lower than the ideal values, indicating negative
deviation from the ideal behavior for mixed micelle formation. The data for the other
surfactants show there is a difference between the experimental and theoretical CMC
values and the deviation is highest for SOS – Reetha mixture (Figure-4.2).
4.3.2 Intraction between surfactants
Rubingh’s equation of regular solution theory can be used to calculate the micellar mole
fraction. And the nature and the strength of the interaction between two surfactant
molecules in the mixed micelle were determined by calculating the values of their β
parameter using equation 3.7 and 3.8 as described before.
The micellar mole fraction (x1) can be calculated from equation 3.7 by solving
iteratively. To show the interaction between two surfactants, β is an interaction parameter
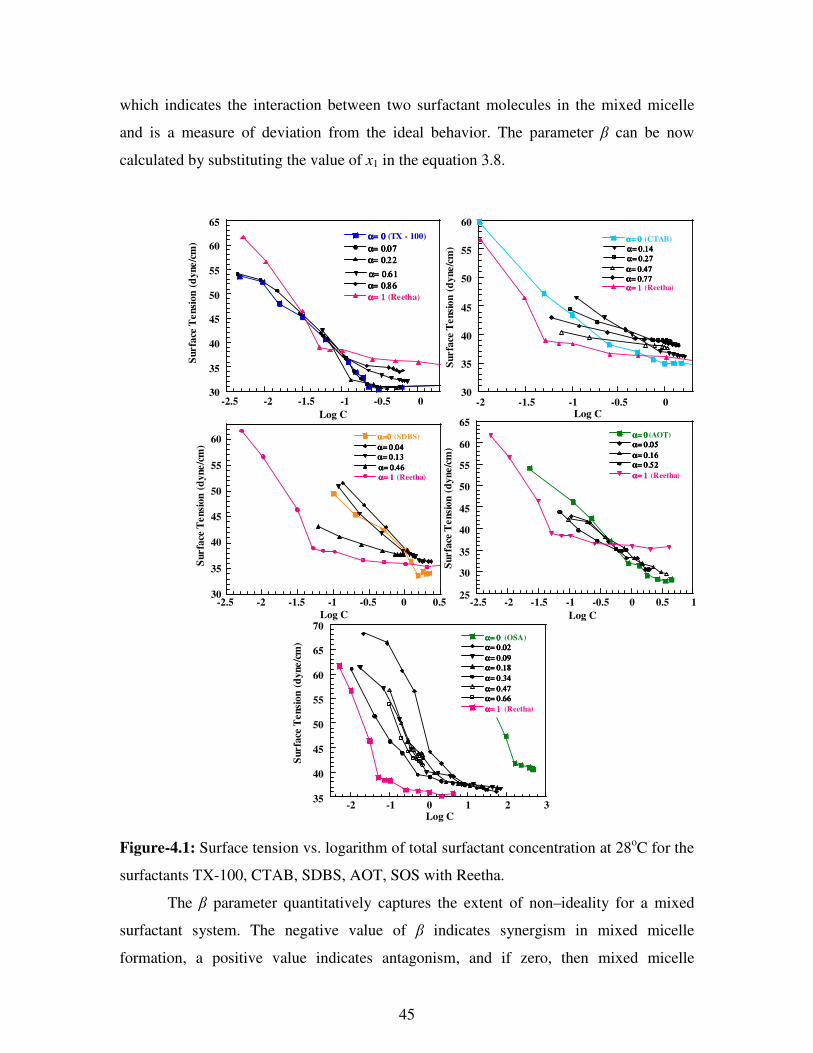
45
which indicates the interaction between two surfactant molecules in the mixed micelle
and is a measure of deviation from the ideal behavior. The parameter β can be now
calculated by substituting the value of x1 in the equation 3.8.
30
35
40
45
50
55
60
-2.5 -2 -1.5 -1 -0.5 0 0.5
α=0α=0α=0α=0 (SDBS)
α= 0.04α= 0.04α= 0.04α= 0.04
α= 0.13α= 0.13α= 0.13α= 0.13
α= 0.46α= 0.46α= 0.46α= 0.46
α= 1α= 1α= 1α= 1 (Reetha)
Surfa
ce T
en
sion
(d
yne/c
m)
Log C
35
40
45
50
55
60
65
70
-2 -1 0 1 2 3
α= 0α= 0α= 0α= 0 (OSA)
α= 0.02α= 0.02α= 0.02α= 0.02
α= 0.09α= 0.09α= 0.09α= 0.09
α= 0.18α= 0.18α= 0.18α= 0.18
α= 0.34α= 0.34α= 0.34α= 0.34
α= 0.47α= 0.47α= 0.47α= 0.47
α= 0.66α= 0.66α= 0.66α= 0.66
α= 1α= 1α= 1α= 1 (Reetha)
Surfa
ce T
ensi
on
(d
yne/c
m)
Log C
30
35
40
45
50
55
60
-2 -1.5 -1 -0.5 0
α= 0α= 0α= 0α= 0 (CTAB)
α= 0.77α= 0.77α= 0.77α= 0.77
α= 0.47α= 0.47α= 0.47α= 0.47
α= 0.27α= 0.27α= 0.27α= 0.27
α= 0.14α= 0.14α= 0.14α= 0.14
α= 1α= 1α= 1α= 1 (Reetha)
Su
rfa
ce T
ensi
on
(d
yne/c
m)
Log C
30
35
40
45
50
55
60
65
-2.5 -2 -1.5 -1 -0.5 0
α= 0α= 0α= 0α= 0 (TX - 100)
α= 0.86α= 0.86α= 0.86α= 0.86
α= 0.61α= 0.61α= 0.61α= 0.61
α= 0.22α= 0.22α= 0.22α= 0.22
α= 0.07α= 0.07α= 0.07α= 0.07
α= 1α= 1α= 1α= 1 (Reetha)
Surfa
ce T
ensi
on
(d
yne/c
m)
Log C
25
30
35
40
45
50
55
60
65
-2.5 -2 -1.5 -1 -0.5 0 0.5 1
α= 0α= 0α= 0α= 0 (AOT)
α= 0.05α= 0.05α= 0.05α= 0.05
α= 0.16α= 0.16α= 0.16α= 0.16
α= 0.52α= 0.52α= 0.52α= 0.52
α= 1α= 1α= 1α= 1 (Reetha)
Surfa
ce T
ensi
on
(d
yn
e/c
m)
Log C
Figure-4.1: Surface tension vs. logarithm of total surfactant concentration at 28oC for the
surfactants TX-100, CTAB, SDBS, AOT, SOS with Reetha.
The β parameter quantitatively captures the extent of non–ideality for a mixed
surfactant system. The negative value of β indicates synergism in mixed micelle
formation, a positive value indicates antagonism, and if zero, then mixed micelle

46
formation is ideal. The larger the absolute value of β, stronger the mixing non–ideality.
The negative deviation indicates a reduction in free energy of micellization over that
predicted by ideal solution theory. The larger negative value of β denotes the greater
negative deviation of CMCs from ideal mixture. All the surfactants used here show a
synergistic effect in the mixture as it satisfied the conditions (i) β must be negative (ii)
ln(CMC1/CMC2) < β (Zhou and Zhu, 2005).
0.2
0.4
0.6
0.8
1
1.2
TX-100 (Ideal)
TX-100 (Experimental)
CTAB (Ideal)
CTAB (Experimetal)
CM
C/m
M
0.5
1
1.5
2
2.5
SDBS (Ideal)
SDBS (Experimental)
AOT (Ideal)
AOT (Experimental)
CM
C/m
M
0
20
40
60
80
100
120
140
0 0.2 0.4 0.6 0.8 1
SOS (Ideal)
SOS (Experimental)
CM
C/m
M
Reetha mole fraction
Figure-4.2: Mixed CMCs of surfactants TX-100, CTAB, SDBS, AOT, SOS with
increase of mole fraction of Reetha compared to the theoretically predicted CMCs.
The regular solution approximation can be introduced to treat the nonideality of
mixing by assuming that the excess entropy of mixing is zero. This condition allows the

47
excess enthalpy of mixing to be directly substituted for the excess free energy of mixing.
In a binary mixture, the excess enthalpy of mixing is ordinarily represented by Holland,
1986.
HE = X1(1-X1) β RT = GE (4.1)
Where β RT represents the difference in interaction energy between mixed and unmixed
systems. Equation 4.1 corresponds to the leading term in the lattice model description for
the enthalpy of mixing in liquid mixtures (Munster, 1974). HE of the mixed micellization
was calculated by this equation and the results are presented in Table-4.1. HE observed
was negative for all combinations. These negative values signify that the mixed
micellization of the used combinations is exothermic. Since it is assumed that the excess
entropy is zero in the RST, the excess Gibbs free energy GE is indistinguishable from HE,
and also is given by eq. 4.1.
The activity coefficients f1 (Reetha) and f2 (non-Reetha) are related to GE by the equation
(Holland, 1986)
GE/RT = X1 ln f1 + (1-X1) ln f2 (4.2)
Substitution of Eq. 4.1 for GE to Eq. 4.2 yields the following expressions for f1 and f2.
f1 = exp[β (1-X1)2] (4.3)
f2 = exp[β X12] (4.4)
With these equations f1 and f2 were calculated and the results are tabulated in Table-4.1.
The activity coefficients were less than 1 for all the surfactants with different
combinations, and f1 was smaller than f2 in some cases and vice versa. The value which is
far to 1 will be more responsible for non-ideality in mixtures.
4.3.3 Effect of CMC ratio and x1 on ββββ
Mixing of various surfactants with Reetha were tested to see the interaction. As
mentioned above positive β means there is a net repulsion between the surfactant
molecules in the micelle, whereas a negative β from the Table-4.1 indicates a net
attraction. To get an idea about the nonideal behavior of binary surfactant mixtures from
the CMC difference of the pure surfactants the average interaction parameters (βavg) of
different pairs of surfactants mixtures is plotted against % ratio of the CMCs of the pure
surfactants (CMCReetha/synthetic × 100).

48
Table-4.1: Mixed CMCs with interaction parameter (β), activity coefficients (f ) relation
with Gibbs free energy at 28 oC at relative mole fractions α of Reetha to TX-100, CTAB,
SDBS, AOT, SOS.
Surfactan
t used
with
Reetha
mole
fraction
α
(Reetha)
CMCT
h in
mM
CMCE
xpt. in
mM
CMCReeth
a/synthetic
β x1 f1 f2 GE/RT
0 0.309 0.309 0 0 1 1 0
0.07 0.318 0.239 -1.009 0.197 0.522 0.962 -0.1596
0.22 0.339 0.292 -0.984 0.227 0.555 0.951 -0.1727
TX-100 0.4 0.368 0.322 -0.625 0.331 0.756 0.934 -0.1384
0.61 0.409 0.392 -0.179 0.485 0.954 0.959 -0.0447
0.86 0.437 0.456 -0.194 0.765 0.989 0.893 -0.0349
1 0.517 0.517
1.673
0 1 1 1 0
0 1.148 1.148 0 0 1 1 0
0.04 1.096 1.069 -0.124 0.102 0.905 0.999 -0.0114
0.13 0.987 0.927 -0.318 0.283 0.849 0.975 -0.0645
0.27 0.867 0.781 -0.429 0.455 0.88 0.915 -0.1064
SDBS 0.46 0.737 0.634 -0.652 0.617 0.909 0.78 -0.1541
0.76 0.594 0.544 -1.036 0.820 0.967 0.498 -0.1529
1 0.517 0.517
0.349
0 1 1 1 0
0 1.098 1.097 0 0 1 1 0
0.04 1.05 1.029 -0.106 0.0977 0.917 0.999 -0.0093
0.14 0.949 0.897 -0.318 0.283 0.849 0.975 -0.0645
0.27 0.839 0.755 -0.43 0.455 0.88 0.915 -0.1066
CTAB 0.47 0.719 0.619 -0.653 0.617 0.909 0.78 -0.1543
0.77 0.588 0.48 -1.247 0.770 0.936 0.477 -0.2208
1 0.517 0.517
0.471
0 1 1 1 0
0 2.7 2.7 0 0 1 1 0 0.05 2.24 1.724 -0.591 0.3101 0.755 0.945 -0.1264
0.16 1.593 1.319 -0.758 0.506 0.831 0.824 -0.1895
0.32 1.159 0.886 -1.207 0.635 0.851 0.615 -0.2798
0.52 0.848 0.699 -1.208 0.754 0.93 0.503 -0.2241
AOT 0.81 0.614 0.566 -1.347 0.896 0.986 0.339 -0.1255
1 0.517 0.517
0.191
0 1 1 1 0
0 157.204 157.204 0 0 1 1 0
0.02 18.831 6.849 -2.256 0.637 0.743 0.4 -0.5217
0.09 5.715 3.524 -1.93 0.762 0.896 0.326 -0.35
0.18 2.788 2.069 -4.08 0.827 0.885 0.061 -0.5837
SOS 0.34 1.498 1.061 -5.37 0.826 0.85 0.026 -0.7718
0.67 0.773 0.525 -7.255 0.832 0.815 0.007 -1.0141
1 0.517 0.517
0.003
0 1 1 1 0

49
The effect of CMCs ratio on βavg for anionic,cationic and nonionic surfactants shown in
Figur-4.3. It was observed that βavg decreased with increase in CMC ratio and up to a ratio
value 35 %. And a constant change in βavg also observed beyond a ratio value 35 %. This
indicates below 35 % of CMC % of other surfactants irrespective of head group with
Reetha will result in mixtures with good net interaction and the order of increase shown
in the figure. Since the CMCs of TX – 100 and Reetha are very close the interaction
parameter also very low. So, from the CMC values of the pure surfactants we can get a
rough idea about their mixed micellar behavior.
The change in interaction parameter with the change in micellar molefraction (x1)
for Reetha – synthetic surfactants mixtures are plotted in Figure- 4.4. It was observed that
β values tend to increase for all the surfactant combinations CTAB, SDBS, AOT, SOS
with increase of micellar mole fraction of Reetha, but the order of increase in β varied for
each surfactant. This indicates net interaction of mixed micelle increasing with increase
in micellar contribution of Reetha. Where as β values of TX-100 – Reetha combinations
followed the reverse order and showed the increasing trend is up to (x1) = 0.5 and above
that there is no change.
-5
-4
-3
-2
-1
0
0 50 100 150 200
ββ ββ
avg
% CMC (Reetha)/CMC (non-reetha)
Figure-4.3: % CMC ratio (Reetha/non-Reetha) vs. βavg of surfactant combinations (TX-
100, CTAB, SDBS, AOT, SOS) with Reetha.

50
4.3.4 Conclusion
The mixed CMCs of nonionic Reetha with nonionic, cationic and anionic in varying mole
fraction were measured using surface tensiometry. Reduction in CMC was observed more
for ionic surfactants with Reetha. And the synergism found varied with different
surfactants used. The interaction parameter β estimated by regular solution model for
each surfactant combinations are negative indicates synergism in the mixed micelle. The
excess enthalpy of micellization was also negative implying that the mixed micellization
was exothermic. When the % of CMC ratio is 35% or less the value of interaction
parameter is high.

51
Chapter 5
Biodegradation of Naphthalene in presence of
Sapindus mukorossi - synthetic mixed
surfactant systems.
5.1 Introduction
Removal of hazardous compounds from the soil and ground water systems are gaining
more and more importance due to worldwide increasing public and regulatory concerns
with the problems of groundwater contamination and resultant impact on human health
and ecological systems. Polycyclic aromatic hydrocarbons (PAHs) as pollutants are of
major concern and may adversely impact health and environmental quality, making
remediation necessary (Wild et al., 1991; Haeseler et al., 1999). Bioremediation is a
cheaper technology available, which uses the natural plants, or microorganisms usually
bacteria and fungi to convert contaminants into less toxic compounds, ideally CO2 and
water (Riser-Roberts, 1998; Alexander, 1999). The application of this technology suffers
from several bottlenecks, one of which is the low availability of hydrophobic organic
contaminants like PAHs to the organisms. Contaminants poor bioavailability is due to
low mass transfer rates to the microorganisms from sites where they are inaccessible
(Grimberg et al., 1996; Miller and Bartha, 1989).
The bioavailability of PAHs described as the solubilized contaminant reaching the
organisms by which their enzymes catalyze the conversion step. The interfacial tension of

52
hydrophobic contaminants can be reduced by using compounds such as surfactants which
are capable of solubilizing wide range of PAHs. Many studies employing single and
mixed surfactants showed their remediation potential in solubilizing and mobilizing
organic contaminants like PAHs (Edwards et al., 1991; Zhang et al., 1997; Paria and
Yuet, 2006; Treiner et al., 1987; Mohamed et al., 2006). Although synthetic surfactants
are efficient solubilizers of contaminants some times hinder their biodegradation by
limiting bioavailability, itself accumulate and non benign to environment and degrading
organisms (Guha and Jaffe, 1996; Stelmack et al., 1999). Biosurfactants produced by
microorganisms also used to enhance bioavailability and biodegradation rates of PAHs in
soil remediation. These are having advantages like easy degradability, production from
renewable sources etc., than synthetic surfactants (Muller et al., 1993). But their usage in
bulk is limited as their purification; recoveries are not economical and some are having
antimicrobial properties (Haferburg et al., 1986; Jenny et al., 1991; Fiechter, 1992).
Different microorganisms whether individual or mixed culture, have different modes of
uptake in the presence or absence of surfactant systems. The presences of surfactants
along with contaminant highly influence the ultimate degradation ability of
microorganisms.
Surfactants from renewable plant sources which are environmental friendly surely
other option for contaminant remediation studies. They are only few studies concerning
the application of plant based natural surfactants from sapindus mukorossi (Kommalapati
et al., 1997; Row, 1966) and no study regarding their blend with synthetic surfactants
reported. The solubilization and degradation of PAHs in synthetic – plant based
surfactant mixtures may be useful in reducing the amount of synthetic surfactants usage
making them easy removal from the environment. More than that, to date, most research
for elucidating the surfactant effect on bioavailability of PAHs has been conducted with
suspended growth systems; employing mixed cultures will be advantageous as currently,
individual microbial responses to synthetic surfactants haven’t shown any robust results.
There is no study reported employing the mixed culture with synthetic – natural
surfactant mixtures and their ability to degrade PAHs. It is crucial to know the biological
response of surfactant addition to PAH degrading microbial cultures in order to develop
practical surfactant enhanced strategies. Much more research is required to make the
application of natural surfactants a standard tool in biological soil and water remediation.

53
5.2 Materials and methods
5.2.1 Chemicals
The surfactants CTAB and TX–100 were obtained from Loba chemie Pvt Ltd, India.
Sodium dodecyl benzene sulfonate (SDBS) has been from Sigma Aldrich, Germany,
Naphthalene, Carbinol from Spectrochem Pvt Ltd, India. All the chemicals were used as
received. Ultra pure water (Sartorius, Germany) was used for the experiments of 18.2 mΩ
resistivity and pH 6.8 – 7. Dry fruit (S. mukorossi) was purchased from the local market,
Rourkela, Orissa, India. The surfactant was extracted from the fruit according to the
method mentioned in Chapter 3.
5.2.2 Microorganisms and medium
Microorganisms with no biosurfactant producing activity were purchased by National
Collection of Industrial Microorganisms (NCIM), Pune. The different type of simple to
complex carbon compound degrading bacteria used for the study are Pseudomonas
aeruginosa 2074, Acinetobacter calcoaceticus 2886, Acinetobacter calcoaceticus 2890,
Mycobacterium sp. 2984, Pseudomonas desmolyticum 2028, Pseudomonas desmolyticum
2112. Each stain maintained in the nutrient medium and appropriate proportions mixed
before experiment to get a known mixed culture.
Waste water obtained from Chromite mines in Sukinda area, Jajpur district, Orissa;
microorganisms isolated and cultured in nutrient media. Two mixed cultures prepared
and used in equal amounts for the experiment. Autoclaved mineral salt media (MSM),
composed of KH2PO4 (1.5 g), Na2HPO4 (4 g), NH4Cl (1 g), MgSO4.7 H20 (0.2 g), CaCl2
(0.01 g), FeCl3 (0.005 g) per liter of deionized water used for the experiment. Surfactant
solutions were prepared from the respective stocks added to autoclaved MSM and the
overall concentration in each flask maintained was 10mM. All the flasks were shaken
well to ensure that the surfactant was completely mixed and pH adjusted to 7 - 7.2.
5.2.3 Experimental design
All the solubility and degradation experiments were done in the Erlen meyer conical
flasks of capacity 250 ml. A stock solution of naphthalene (100 mM) was prepared by
dissolving naphthalene in pure methanol is preferred over higher alcohols because of its
negligible effect on solubilization and CMC values (Edwards et al., 1991). For
experiment 1ml naphthalene from stock added to flasks with TX-100 and its mixtures,
where as 0.5ml to other all flasks with surfactants CTAB, SDBS and its mixtures with

54
Reetha. Flasks were dried to remove solvent. Here the medium used is mineral salt
medium (MSM) and at about 50 ml in each flask and 10 ml kept as reference without
addition of naphthalene or culture. Except for control all the flasks supplied with pure
and with different combination of surfactant mixtures. Naphthalene degradation was
monitored by adding 0.1ml waste water culture (WWC) and known culture (KC)
throughout a period of 18 days in the flasks containing MSM. Mixed cultures employed
shown in Figure-5.1 and naphthalene left was measured periodically. Flasks were
properly plugged with cotton plugs and covered. Aseptic conditions followed where ever
required and all experiments were performed at room temperature, 25 – 28 °C and flasks
were agitated at 130 rpm.
Figure-5.1: Mixed cultures KC and WWC at 40X.
5.2.4 Analytical methods
Surfactant solutions surface tension was measured by Wilhelmy plate method using
surface tensiometer, Data Physics, Germany (DCAT–11EC). The temperatures (28 ± 0.1
C) were maintained by circulating thermostatic water by a circulator through jacketed
vessel containing the solution. The platinum plate used for the measurements was cleaned
with acetone and burned after each reading. The measured surface tension values were
plotted for each composition in different time intervals in days. Representative plots of
surface tension (γ) vs various combinations are shown in Figure- 5.2. The reproducibility
of the results was checked by duplicate runs. Microbial growth measurements were done
by UV–Vis. spectrophotometer (Jasco, Japan, V–530) at an absorbance of 600nm. All the
samples were treated with 10% formaldehyde prior to analysis to kill the

55
microorganisms. Samples measured for residual naphthalene in each flask measured by
HPLC with C18 reversed phase (RP) column and methanol as mobile phase (Jasco,
MD2015plus). Experiments were done in triplicate and the average values are reported.
5.3 Results and Discussion
5.3.1 Surface tension and growth measurements
In the degradation experiments, better result in degradation is expected when the growth
of culture in the medium is higher. If the growth is more there are both possibilities of
degradation of naphthalene and surfactant is there. Hence, before knowing the amount of
naphthalene degraded first we observed the change in growth of the cultures and surface
tension in the system. All the combinations used showed static values as shown in
Figure-5.2 indicates surfactants and not degraded.
The culture growth in the presence of naphthalene and surfactants is reported in terms of
growth rate constant (Kg). That is defined as (Thomas et al., 1993).
12
12lntt
NNK g
−
−
= (5.1)
Where N2 and N1 are concentration of cells in mg/L at time t2 and t1 in days. Growth rate
constant (Kg) of KC and WWC calculated for the pure surfactants (Reetha, TX-100,
CTAB, SDBS) are shown in Table-5.1. The higher the values of (Kg) indicate faster
growth of microorganisms in the respective surfactant. By comparing the Kg values for
WWC and KC we can see the values are little higher for WWC but the change is not very
significant, but the increasing order of Kg values are also similar for both the cultures.
The ascending order of growth by KC was CTAB < TX-100 < SDBS < Reetha; and by
WWC was TX-100 ≈ < CTAB < SDBS < Reetha with negligible difference between TX-
100 and CTAB.While comparing the mixtures of synthtetic surfactants with Reetha in
different mole fractions, Figure-5.3 shows that with increase in mole fraction of Reetha,
(Kg) values of all the mixed combinations are increased. This indicates since pure Reetha
is having higher Kg value than the synthetic surfactants in presence of naphthalene, so its
addition to synthetic surfactants enhanced the growth of both the cultures than the
synthetic surfactants alone. It is reported that the known cultures are not producing
surfactants in presence of hydrophobic compounds.

56
0
10
20
30
40
50
1 18
TX-100
T+R(7+3)
T+R(5+5)
T+R(3+7)
CTAB
C+R(7+3)
C+R(5+5)
C+R(3+7)
SDBS
S+R(7+3)
S+R(5+5)
S+R(3+7)
Reetha
NaphthaleneDays
WWC0
10
20
30
40
50
KC
Figure-5.2: Surface tension comparison of various surfactants with Reetha by KC and
WWC.
As KC is devoid of having biosurfactant production ability; to test the surfactant
production ability of WWC, we have monitored the growth and surface tension in
presence of naphthalene without surfactant (Figure-5.2). The Kg value found was 0.277
for WWC and 0.209 for KC, no change in surface tension even after 18 days indicates
WWC are utilizing naphthalene in absence of surfactant but not producing any surfactant.

57
The Kg value without surfactants is lower than all the Kg values in the presence of
surfactants (pure/mixtures) by WWC/KC. This indicates the presence of surfactant
(pure/mixtures) showing increase in growth of respective mixed culture. Different Kg
values show varying growth of mixed cultures in the presence of surfactants.
Surface tension depletion throughout the period of 18 days for individual and
mixed surfactants of CTAB, SDBS, TX-100 was checked and no difference found with
the initial value for both the cultures. The constant values in surface tension
measurements through out the study may be due to preferably only naphthalene
utilization by mixed cultures with out degrading surfactants or if surfactants are degraded
the rate is very slow, so that even after 18 days remaining concentration of surfactants are
still above CMC.
Table-5.1: Growth rate constant (Kg) for various surfactants by KC and WWC. CTAB,
Reetha, SDBS, and TX – 100 are abbreviated as C, R, S, T respectively.
Kg Values Surfactant
KC WWC
R 0.424 0.43
T 0.338 0.293
C 0.264 0.297
S 0.332 0.371
T + R (30:70) 0.399 0.378
T + R (50:50) 0.347 0.378 T + R (70:30) 0.341 0.331
C + R (30:70) 0.314 0.373
C + R (50:50) 0.276 0.333
C + R (70:30) 0.273 0.291
S + R (30:70) 0.392 0.397
S + R (50:50) 0.352 0.377
S + R (70:30) 0.336 0.366

58
Figure-5.3: Compariosn of growth rate constants (Kg) of cultures KC and WWC with
TX-100, CTAB, SDBS with different mole fraction of Reetha
0.2
0.25
0.3
0.35
0.4
0.45
0 0.2 0.4 0.6 0.8 1
TX-100 - KC
TX-100 - WWC
Kg V
alu
es
Mole fraction of reetha
0.2
0.25
0.3
0.35
0.4
0.45
0 0.2 0.4 0.6 0.8 1
CTAB - KC
CTAB - WWC
Kg V
alu
es
Mole fraction of reetha
0.2
0.25
0.3
0.35
0.4
0.45
0 0.2 0.4 0.6 0.8 1
SDBS - KC
SDBS - WWC
Kg V
alu
es
Mole fraction of reetha

59
5.3.2 Solubilization of naphthalene by single and mixed surfactants
As it is mentioned before the availability of the PAH is an important step in
biodegradation, so the solubility limits of naphthalene in different surfactant solution is
worthy to know in biodegradation study. In our study we found the aqueous solubility of
naphthalene is 0.234 mM at room temperature in the absence of surfactants. The
solubility of naphthalene in single and mixed surfactant systems we have reported in
Chapter 3. We found the solubility order of the pure surfactants are TX-100 > CTAB >
Reetha > SDBS. In the mixed systems for TX-100 and CTAB solubility is more when
mole fraction of synthetic surfactant is more, but reverse for SDBS since Reetha is
having little more solubilization capacity. From Figure-5.4 TX-100 – Reetha mixtures
showed a linear decrease in solubilization with increase in mole fraction of Reetha
similar to that in absence of MSM as reported before (Rao and Paria, 2009), indicates as
the both the surfactants are nonionic shows ideal behavior with negligible effect of MSM
on micellization or solubilization. But our study (Rao and Paria, 2009) in aqueous system
with MSR (molar solubilization ratio)values reported the solubility of naphthalene by
SDBS mixtures showed low efficiency i.e below Reetha solubility up to 0.5 mole
fractions but later on increased; where as CTAB showed increased value in solubility
than pure Reetha for all mole fractions.
Figure-5.4: Naphthalene solubility in MSM by surfactants TX-100, CTAB and SDBS
with Reetha.
0
0.5
1
1.5
2
2.5
0 0.2 0.4 0.6 0.8 1
TX-100
CTAB
SDBS
Naphth
ale
ne in m
M
Reetha mole fraction

60
The variation in solubility’s here may be due to MSM effect on solubilization of
naphthalene. The presence of nonionic surfactant Reetha in mixed micelle reduced
repulsion between ionic heads of surfactants and similarly mono, di, tri valence ions of
MSM resulted in tight packing of mixed micelle resulting in less solubility of
naphthalene.
5.3.3 Naphthalene Biodegradation
To see the efficiency of degradation of organic compound in presence of mixed
surfactant systems using Reetha as one of the components, naphthalene biodegradation
was studied in the presence of various surfactants with two different mixed cultures. The
degradation of naphthalene in percent by mixture of KC and WWC on different single
and mixed surfactants is shown in Figure-5.5(a) and Table-5.2. Naphthalene depletion
periodically measured for surfactants used and indicated in Figure-5.5(b). The maximum
degradation time given was 18 days, for all the single surfactants and their mixtures show
after 18 days negligible naphthalene left except for TX-100 and its mixtures with Reetha.
The degradation of PAHs in presence of surfactant can be described as first order
kinetics (Wong et al., 2004). To have a clear understanding of the extent of naphthalene
degradation in the presence of each surfactant and surfactant combinations used, the
kinetic rate constant (K) of naphthalene are presented in Table-5.3 calculated according
to
tC
CK
t
/ln 0
= (5.2)
Where C0 and Ct are the concentration of naphthalene at day 0 and day t respectively. The
low K values indicate lower degradation rate. From Table-5.3 the K values followed
following order for the pure surfactants: SDBS > Reetha > CTAB > TX-100 for KC and
WWC. The comparison of two mixed cultures in presence of pure surfactants reveals that
both mixed cultures degrade naphthalene effectively in presence of SDBS and very slow
in TX-100. Comparisons of both the cultures show the rate constant values are very close
for pure surfactants.

61
0
20
40
60
80
100
0 5 10 15 20
% B
iod
egr
ad
ati
on
Days
KC
Reetha T+R (3+7) T+R (5+5) T+R (7+3) TX-100
0
20
40
60
80
100
0 5 10 15 20
% B
iod
egr
ad
ati
on
Days
WWC
Figure-5.5 (a): Biodegradation % by KC and WWC for TX-100 – Reetha mixture.
Table-5.2: Biodegradation % by mixed cultures with CTAB and SDBS mixtures with
Reetha.
Mixed
cultures
CTAB with different mole fraction
of Reetha in %
SDBS with different mole fraction
of Reetha in %
Days 0.0 0.3 0.5 0.7 1.0 0.0 0.3 0.5 0.7 1.0
1 54.49 77.81 74.34 74.88 78.20 82.64 88.24 76.78 80.48 78.20
3 87.87 90.40 85.94 91.36 86.80 90.73 93.07 87.06 89.95 86.80
KC 7 89.48 91.16 89.57 92.39 94.57 93.18 95.13 92.99 92.90 94.57
13 89.55 91.18 92.94 93.21 94.79 94.49 96.64 93.68 95.43 94.79
18 91.62 93.25 93.59 93.32 96.33 96.22 97.24 95.94 96.04 96.33
Days 0.0 0.3 0.5 0.7 1.0 0.0 0.3 0.5 0.7 1.0
1 72.89 96.10 93.47 92.45 83.65 78.81 96.96 97.14 94.95 83.65
3 79.76 97.68 97.60 94.00 85.33 87.60 97.36 97.60 96.40 85.33
WWC 7 82.38 98.09 99.18 94.25 86.80 92.87 97.52 98.04 97.60 86.80
18 90.96 98.95 99.58 94.86 87.86 95.81 98.80 98.43 98.52 94.40

62
Figure-5.5 (b): Naphthalene depletion in 18days for surfactants TX-100, CTAB, SDBS
with reehta (pure/mixtures); 2.5 mM .naphthalene taken for TX-100 and its mixtures with
reetha, where as it was1.25 mM for all other cases.
(1+0) (7+3) (5+5) (3+7) (0+1)

63
From Table-5.3, Figure-5.6 the mixed surfactant systems show little complex
behavior than the single systems. TX-100 – Reetha mixtures showed increase in - values
with increase in mole fraction of Reetha. But are less than pure Reetha and more than
TX-100 alone, this indicates naphthalene degradation increased with addition of Reetha
to TX-100 by both mixed cultures.
Table-5.3: Degradation rate constant (K) values of napthalene by two mixed cultures.
K Surfactant
KC WWC
R 0.174 0.160
T 0.011 0.012
C 0.138 0.134
S 0.182 0.177
T + R (30:70) 0.066 0.080
T + R (50:50) 0.047 0.058
T + R (70:30) 0.035 0.027
C + R (30:70) 0.150 0.254
C + R (50:50) 0.153 0.307
C + R (70:30) 0.151 0.165
S + R (30:70) 0.200 0.246
S + R (50:50) 0.178 0.230
S + R (70:30) 0.180 0.233
In presence of CTAB – Reetha mixtures for KC; K values are almost constant and
lied above pure CTAB and below Reetha surfactants for KC. Whereas order of K values
followed by WWC for CTAB – Reetha mixtures is as follows: 50:50 > 30:70 > 70:30 and
are interestingly greater than pure surfactants CTAB and Reetha. This indicates addition
of Reetha increased the degradation of naphthalene in ascending order except 50:50
combinations by WWC which are also greater than CTAB – Reetha mixtures by KC.
Coming to SDBS – Reetha mixtures; for both the cultures K values of 30:70 is higher
than their other combinations. K values are equal to or more than pure surfactants by KC
and totally more than their pure SDBS, Reetha surfactants by WWC.

64
Figure-5.6: Kinetic rate constant (K) values compariosn of cultures KC and WWC with
TX-100, CTAB, SDBS with different mole fraction of Reetha
0
0.05
0.1
0.15
0.2
0.25
0.3
0.35
0 0.2 0.4 0.6 0.8 1
TX-100 - KC
TX-100 - WWC
K V
alu
es
Mole fraction of reetha
0.1
0.15
0.2
0.25
0.3
0.35
0 0.2 0.4 0.6 0.8 1
CTAB - KC
CTAB - WWC
K V
alu
es
Mole fraction of reetha
0.15
0.2
0.25
0.3
0.35
0 0.2 0.4 0.6 0.8 1
SDBS - KC
SDBS - WWC
K V
alu
es
Mole fraction of reetha

65
This indicates addition of Reetha enhanced naphthalene degradation by KC and WWC in
SDBS – Reetha mixtures. K value comparison for pure and surfactant mixtures by two
mixed cultures from Table-5.3, Figure-5.7 states that addition of Reetha surfactant
increased rate of degradation of naphthalene in surfactant mixtures. SDBS – Reetha
mixtures by KC and, SDBS, CTAB – Reetha mixtures by WWC stand with high K values
greater than their pure surfactants; indicating faster naphthalene biodegradation. In
addition from the Figure-5.7 with increase in K order for KC and WWC, simultaneous
increase in growth rate constant (Kg) not observed. This indicates surfactant mixtures
with Reetha also enhanced the growth of mixed cultures apart from naphthalene.
0.25
0.3
0.35
0.4
0.45
0 0.2 0.4 0.6 0.8 1
TX-100 - KCCTAB - KC
SDBS - KC
Kg V
alu
es
Mole fraction of reetha
0 0.2 0.4 0.6 0.8 1
TX-100 - WWCCTAB - WWC
SDBS - WWC
Mole fraction of reetha
0
0.05
0.1
0.15
0.2
0.25
0.3
0.35
0.4
0 0.2 0.4 0.6 0.8 1
TX-100 - KC
CTAB - KC
SDBS - KC
K V
alu
es
Mole fraction of reetha
0 0.2 0.4 0.6 0.8 1
TX-100 - WWC
CTAB - WWC
SDBS - WWC
Mole fraction of reetha
Figure-5.7: Kinetic degradation rate constant (K) and growth rate constant (Kg) values
comparison for KC and WWC by surfactant (TX-100, CTAB, SDBS) – Reetha mixtures

66
5.3.4 Degradation of surfactants by mixed cultures
Degradation of surfactants TX-100, CTAB, SDBS, Reetha pure and synthetic – Reetha
surfactant mixtures was studied to know the utilization of surfactant by mixed cultures.
Qualitative study was performed by observing the change in surface tension by KC and
WWC in surfactants (pure/mixed). This gives the ease or probability degradation of
surfactants by the cultures in addition to naphthalene.
The degradation of surfactants monitoring the surface tension values for a period
of 60 days by mixed cultures KC and WWC. Table-5.4, Figure-5.8 shows the percentage
increase in surface tension by pure surfactants TX-100, SDBS, CTAB, and Reetha in the
following order: Reetha (16.4 %) > TX-100 (14.3 %) > SDBS (0.1 %) > CTAB (0.0 %) >
for KC; and Reetha (43.0 %) > TX-100 (13.2 %) > SDBS (9.1 %) > CTAB (0.3 %) for
WWC. The results clearly indicate mixed cultures behaved differently with different
surfactants. Among the surfactants studied here, one common behavior is observed that
two nonionic surfactants Reetha and TX-100 are showing increase in surface tension in
presence of both KC and WWC.
Table-5.4: Percentage increase in surface tension values by both mixed cultures.
% increase in Surface tsension values from
reference (for 60 days period)
Surfactant
KC WWC
R 16.4 43.0
T 14.3 13.2
C 0.0 0.3
S .0.1 9.1
T + R (20:80) 19.3 25.0
T + R (80:20) 18.7 23.9
C + R (20:80) 3.7 11.8
C + R (80:20) 4.9 6.3
S + R (20:80) 3.4 14.3
S + R (80:20) 9.9 5.0

67
Figure-5.8: Increase in surface tension with respect to Reetha for various combinations
of surfactants (for 60 day period).
Both the surfactants show highest increase in surface tension in presence of
WWC. By comparing all the surfactants, pure Reetha by WWC showed rapid
biodegradable property with high surface tension value. Among the synthetic surfactants
a maximum of 14.3 % increase was found with TX-100 by KC.
While coming to surfactant mixtures with Reetha from Table-5.4, Figure-5.8 it is
observed that % increase in surface tension for TX-100 – Reetha mixtures are more than
other surfactant mixtures and are very nearer with increase in mole fraction of Reetha by
both mixed cultures. Less K values with higher Kg values of TX-100/TX-100 – Reetha
mixtures to increase in mole fraction of Reetha; revealed that less naphthalene
degradation ability with more surfactant degradation property by mixed cultures. Like
wise with the incorporation of Reetha surfactant to CTAB and SDBS increased the
surfactant mixture degradation by WWC, where as exactly opposite trend followed by
KC.
Although different trend followed by both cultures for CTAB and SDBS with
Reetha, an increase in Kg values were seen for both as their K values differ and
contributing for the growth of cultures. Here, growth may be resulted due to consumption
of naphthalene while surfactant utilization was low. High and low K values with increase
of Reetha fraction with low and high surfactant utilization gained increase of Kg values
with increase in Reetha fraction.
0
10
20
30
40
0 0.2 0.8 1
TX-100 -KC
TX-100 - WWC
SDBS - KC
SDBS - WWC
CTAB - KC
CTAB - WWC%
In
crea
se in s
urf
ace
ten
sion
Mole fraction of Reetha

68
5.3.5 Zeta Potential (ξ) effect on Biodegradation
Like the colloidal particles microorganisms also possesses certain surface charge when
present in the aqueous medium. In general, microorganisms have a negative electrical
surface charge which depends on carbohydrate moieties, proteins etc., which stem from
phospholipid bilayer. The Zeta potential (ξ) for mixed cultures of KC and WWC in water
at neutral pH observed was -23.1 mV, -30.4 mV respectively; where as in the mineral salt
medium are – 14.83 mV and – 8.23 mV. The reduction of potential in MSM was more for
WWC may be due to suppression of extra cellular charge and species variation. Figure-
5.9 represents the zeta potential (ξ) of two cultures in presence of different surfactant
medium. From the Figure it can be noticed that for the both cultures used, with increase
in mole fraction of Reetha surfactant; zeta values decreased and lied in between the pure
surfactants. The zeta potential (ξ) for combinations of CTAB - Reetha show less value
for WWC than KC and there is a difference between the two cultures. Where as for TX-
100 – Reetha and SDBS –Reetha combinations the variation in zeta potential was very
small. In case of TX-100 – Reetha mixture since both are nonionic overall change is very
less.
Figure-5.9: Zeta potential (ξ) comparison for KC and WWC for surfactant (TX-100,
CTAB, SDBS) – Reetha mixtures.
-50
-40
-30
-20
-10
0
10
20
0 0.2 0.4 0.6 0.8 1
CTAB(unknown)CTAB(known) TX100(known)
TX100(unknown)
SDBS(known)
SDBS(unknown)
Zet
a m
V
Mole fraction of reetha

69
Lower zeta values for WWC than KC for CTAB with increase in Reetha mole
fraction has more K values with fast naphthalene depletion. Here reduction in zeta
potential helped WWC to degrade naphthalene effectively than KC and variation in K
values are significant for CTAB-Reetha mixtures by both mixed cultures used. While
TX-100, SDBS with Reetha showed less zeta potential variation by both cultures and are
having marginal increase in K values of WWC than KC, indicating the zeta effect on rate
constant.
Pure surfactants TX-100 inhibited the degradation of naphthalene but enhanced
after the addition of Reetha surfactant indicates the surfactant dependence on the
structure although the zeta potential values are same for nonionic combinations used.
Figure-5.9 depicts lowering of zeta potential value (absolute value) for ionic surfactant
mixtures with increase in Reetha mole fraction increased the depletion of naphthalene, so,
the plant – synthetic mixtures may increase the effectiveness of the blend when the
synthetic surfactants are having inhibition tendency towards biodegradation like CTAB
and TX-100.
5.3.6 Correlation of growth and degradation mixed cultures
The variation in results by PAH degrading mixed cultures regarding growth may be due
to utilization of surfactants as growth substrates in preference to naphthalene or
naphthalene alone or both in varying rates. The contradictory results for degradation are
due to the interactions among PAH degrading culture, PAH and surfactant. If surfactants
are neither toxic nor growth substrates, they can either enhance degradation of PAH by
forming micelles that are accessible to microorganisms or decrease degradation by
preventing cells from directly contacting PAH.
Kg values of naphthalene in presence for pure surfactants showed highest for
Reetha by both mixed cultures than all other synthetic surfactants conversely not giving
high K values indicate rapid degradation potential of Reetha. Coming to surfactant
mixtures with increase in mole fraction of reetha an increase in growth of mixed cultures
was observed which was greater than pure synthetic surfactants and less than pure reetha.
This indicates that reetha addition increases growth. It is expected that more degradation
with increase in growth of cultures. But in contrast Kg values order is not matching with
K values. This indicates naphthalene alone is not a growth substrate here but surfactants

70
(pure/mixtures) utilization influencing the microbial growth as well as naphthalne
degradation.
Figure-5.6 suggests increase or decreases of K values are not in the order of Kg
values; especially TX-100 (pure/mixture) showed more deviation than CTAB, SDBS
(pure/mixtures). This indicates varying surfactants (pure/mixtures) utilization by both
mixed cultures. Mixed cultures ability to utilize the surfactants (pure/mixed) is studied
qualitatively by monitoring surface tension measurements. Figure-5.8 suggests the
addition of reetha in small amounts to TX-100 showed more degradation than CTAB and
SDBS mixtures. While other surfactants showed increase in surfactant degradation with
increase in reetha, which indicates nonionic surfactant combinations with reetha are more
degradable than ionic surfactants.
When naphthalene was given as a substrate along with excess surfactants, chance
of utilizing both observed in varying amounts. This may be the reason for variation in Kg
values with respect to K values. Figure-5.6 suggests, for TX-100 – Reetha mixture
naphthalene degradation was low with increase in surfactant-mixture degradation by both
mixed cultures. While for CTAB and SDBS – Reetha mixtures, naphthalene degradation
was more and surfactant-mixture degradation was less than TX-100 – Reetha mixture.
Non- zero K values of all indicate naphthalene and surfactants (pure/mixtures) utilized as
substrates with varying degradation rates. Ionic surfactants with Reetha are advisable for
remediation studies as they degrade PAH like naphthalene in limited time with itself
having moderate degradation rates. Zeta studies revealed that hydrophilic nature of mixed
cultures decreased with addition of Reetha to pure synthetic surfactants and naphthalene
degradation was favored. The reduction of hydrophilicity differed for two mixed cultures
used and more naphthalene degradation seen with WWC which is having low zeta.
5.4 Conclusion
In this study, we found that the addition of plant based Reetha surfactant increased the
degradation of naphthalene especially by ionic surfactants CTAB, SDBS than nonionic
TX-100. KC showed better naphthalene degradation potential in the presence of pure
surfactants while WWC dominated in surfactant mixtures. Synthetic surfactant
degradation was enhanced by the addition of Reetha and is of the order TX-100 > SDBS
> CTAB. Surfactant interference is seen with degradation of naphthalene and is varied for
different surfactants used. Zeta potential (ξ) varied for two mixed cultures used and

71
decrease of zeta potential with Reetha additon showed its enhanced effect on naphthalene
degradation especially for ionic – Reetha surfactant mixtures. Use of natural surfactant
Reetha will make a promising remediation tool by replacing or substituting in part or full
of synthetic surfactants; ultimately making their use and easy removal from the
environment with effective biodegradtion.

72
Chapter 6
Conclusions and suggestions for future work
The plant based surfactant Reetha was investigated primarily for its solubilization
potential with synthetic nonionic, cationic and anionic surfactants and their property to
enhance bioavailability and biodegradation of naphthalene also studied.
By comparing the solubility of Reetha with the synthetic surfactants the following
order of MSR and log Km values are observed: TX–100 > CTAB > Reetha > SDBS >
AOT > SOS. The increasing order of CMC values of these surfactants are: TX–100 <
Reetha < CTAB < SDBS < AOT < SOS. In general, lower the CMC values higher the
solubilization efficiency of the surfactants. Here, except Reetha, all the synthetic
surfactants studied are followed the CMC rule. Efficiency of Reetha is expected after
TX–100 but practically it is just after CTAB. In general, it is reported, non ionic
surfactants are better solubilizing than ionic surfactants, because of their lower CMC.
Even, solubilization capacity of a nonionic surfactant of polyoxyethylene type for water
insoluble materials is much greater than that of an ionic surfactant having the same
hydrocarbon chain length as that of the nonionic surfactant, this fact suggests that the
polyoxyethylene part in the molecule also plays an important role in solubilization.
Between cationic and anionic surfactants with similar chain length cationic surfactant
shows greater solubilization efficiency of PAHs due to adsorption at micellar water
interface in addition to solubilization in the inner core of the micelle. Less solubilization
efficiency of Reetha than expected based on the CMC value is attributed in terms of

73
complex structure of the micellar core, hydrophobic part is consisting of five six member
cyclic hydrocarbon rings resulting shorter effective chain length, presence of carboxylic
group in the hydrophobic region, and low micellar aggregation no.
Solubilization in the mixed surfactant systems Reetha - TX-100 is showing ideal
behavior and Reetha with all other ionic surfactants are showing nonideal behavior. The
deviation in solubility from ideality is identified by the deviation ratio (R). All the ionic
surfactants show negative deviation in presence of Reetha. The maximum deviation
occurs for CTAB, SDBS, AOT, and SOS are – 18 %, - 39.68 %, - 53 %, and 78.4 %
respectively. Now, by summarizing all the results of mixed surfactant systems we can
conclude that ascending order of ∆MSR (% change in MSR) are TX–100 – Reetha <
CTAB – Reetha < SDBS – Reetha < AOT – Reetha < SOS – Reetha, which is the reverse
order of sequence that of single surfactants for solubilization or same sequence of CMC.
In the mixed surfactant systems when the synergism is there (more negative β or
interaction parameter of mixed micelle) the micelle will be more densely packed and
solubilization may decrease; but at the same time the mixed micellar CMC also will be
low. In that case, at a particular concentration, since the number of micelle will be more
the solubilization also will enhance. The value of positive or negative deviation will
depends on the factor which is predominant.
Solubilization and surface tensiometry have been used to study mixtures of
nonionic Reetha with nonionic, cationic and nonionic surfactants without electrolyte.
Interaction parameters estimated from surface tension data suggest interactions between
Reetha with other surfactants to follow an order anionic/Reetha > cationic/Reetha >
nonionic/Reetha. Moderate synergy between Reetha with cationic and anionic surfactants
observed with more interaction and excess enthalpy of micellization was negative,
implying that the mixed micellization was exothermic. On the other hand, behavior of
mixtures of Reetha - nonionic surfactant (TX-100) is close to that for ideal mixing with
limited interaction. A 0.35 CMC ratio of Reetha with other surfactants showed better
interaction and improved with less than 0.35. The bioavailability and biodegradation of
naphthalene studied by two mixed cultures with Reetha and synthetic surfactants like
nonionic (TX–100), cationic (CTAB), anionic (SDBS). The solubilization efficiency of
single surfactants showed that Reetha was less effective than TX–100, CTAB and similar
to SDBS, but biodegradation of naphthalene was more in the presence of surfactant

74
mixtures indicate more bioavailability to microorganisms. Two mixed culture’s
naphthalene degrading ability in the presence of surfactants (pure/mixtures) tested.
Naphthalene biodegradation explained with the help of growth rate constants (Kg),
naphthalene degradation rate constants (K), surfactant (pure/mixtures) utilization (by %
change in surface tension) and with zeta potential values of the surfactant combinations.
Naphthalene degraded was more in CTAB, SDBS - Reetha mixtures and less in case of
TX-100 - Reetha mixtures, while it is opposite in mixed surfactant utilization. Additon of
Reetha surfactant to surfactants TX-100, CTAB and SDBS proved more beneficial to
WWC than KC. Utilization of naphthalene along with surfactants (pure/mixtures)
explained and mixed micellar concentrations above critical micelle concentration were
not toxic to the microorganisms used. Zeta potential for mixed cultures was monitored for
surfactants (pure/mixtures) and its relation to K values explained. To solubilize wide
range of contaminants we are proposing a treatment scheme that employs plant-based
natural surfactants along with synthetic surfactants, which in turn limits the synthetic
surfactant load to soil and ground water remediation and helps easy removal after the
process. The results of this study provide the usefulness of applying plant based natural
surfactants with synthetic surfactants in surfactant enhanced remediation and degradation.
Suggestions for future work
Following suggestions are made for the future work
• Plant - synthetic surfactant mixtures property to solubilize a wide range of
complex organic compounds may be investigated.
• Experimenting and substituting a part or in full of synthetic surfactants with plant
based surfactants for soil/water remediation studies by knowing their interaction
behavior.
• Hazardous contaminants degradation enhancement by various microorganisms
including innate fungal and other species in the presence of plant surfactant
mixtures should be tested.

75
References
AATDF monograph, “Surfactants and cosolvents for NAPL Remediation”, Technical
Practices Manual. Ann Arbor Press, Ann Arbor, MI. (1998).
Abe, A., Imae, T., and Ikeda, S. A., “Micelle shape and capacity of solubilization”,
Colloid Polymer Sci., 265, 637–645 (1987).
Abriola, L. M., Pennell, K. D., Defcker, T. J., Weber, and W. J., Jr., “Laboratory and
modeling investigations of surfactant enhanced aquifer remediation”, 19th Annual
Risk Reduction Engineering Laboratory Hazardous Waste Research Symposium.,
Cincinnati, OH, April 13–15, 173–176 (1993).
Agency for Toxic Substances and Disease Registry. Comprehensive Environmental
Response, Compensation, and Liability Act (CERCLA) List of priority hazardous
substances, U.S. Department of Health and Human Services, Washington, D.C.,
(1999).
Ajay Singh., Jonathan, D., Van Hamme, B., Owen, P., and Ward, A., “Surfactants in
microbiology and biotechnology: Part 2. Application aspects”, Biotechnology
Advances., 24, 100–116 (2006).
Akit, J., Cooper, D. G., Manninen, K. I., and Zajic, J.E., "Investigation of potential
biosurfactant production among phytopathogenic bacteria and related soil microbes,"
Current Microbiol. 6, 145–150 (1981).
Alexander, M., “Biodegradation of organic chemicals”, Environ. Sci. Technol., 18, 106–
111 (1985).
Alexander, M., Potter, C. L., Glaser, J. A., Chang, L.W., Meier, J.R., and Dosani, M. A.,
“Biodegradation and bioremediation”. 2nd ed. Academic Press, New York. (1999).
Ang, C. C., Abdul, A. S., “Aqueous surfactant washing of residual oil contamination
from sandy soil”, Ground Water Monit. Rev., 11, 121–127(1991).
Angelova, B., and Schmauder, H. P., “Lipophilic compounds in biotechnology–
interactions with cells and technological problems”, J. Biotechnol., 67, 13–32 (1999).
Aronstein, B. N., and Alexander, M., “Surfactants at low concentrations stimulate
biodegradation of sorbed hydrocarbons in samples of aquifer sands and soil slurries”,
Environ. Toxicol. Chem., 11, 1227–1233 (1992).

76
Balakrishnan, S., Varughese, S., and Deshpande, A. P., “Micellar characterisation of
saponin from Sopindus mukorossi”, Tenside, Surfactants, Detergents., 43, 262–268
(2006).
Banat, I. M., “Biosurfactants production and use in microbial enhanced oil recovery and
pollution remediation: a review”, Biores. Technol., 51, 1–12 (1995).
Banat, I. M., Makkar, R. S., and Cameotra, S. S., “Potential commercial applications of
microbial surfactants”, Appl Microbiol Biotechnology., 53, 495–508 (2000).
Bollag, J. M., and Bollag, W. B. “Soil contamination and the feasibility of biological
remediation”, Bioremediation: Science and applications (Skipper, H. D. and Turco,
R. F., Eds.) 1–31, Soil Science Society of America, Madison. (1995).
Boonchan, S., Britz, M., and Stanley, G.A., “Surfactant–enhanced biodegradation of high
molecular weight polycyclic aromatic hydrocarbons by Stenotrophomonas maltophilia”,
Biotechnol. Bioeng., 59, 482–494. (1998).
Bouchez–Naïtali, M., Rakatozafy, H., Marchal, R., Leveau, J. Y., and Vandecasteele, J.
P., “Diversity of bacterial strains degrading hexadecane in relation to the mode of
substrate uptake”, J Appl Microbiol., 86, 421–428 (1999).
Bury, S. J., and Miller, C. A., “Effect of micellar solubilization on biodegradation rates of
hydrocarbons”, Environ. Sci. Technol., 27, 104–110. (1993).
Busscher, H. J., Van der Kuijl–Booij, M., Ven der Mei, H. C., “Biosurfactants from
thermophilic dairy streptococci and their potential role in the fouling control of heat
exchanger plates”, J. Ind. Microbiol., 16, 15–21 (1996).
Cheng, D. C. H., and Gulari, E., “Micellization and intermicellar interactions in aqueous
sodium dodecyl benzene sulfonate solutions”, J. Colloid Interface. Sci., 90, 410–423
(1982).
Chrzanowski, T. H., Simek, K., Sada, R. H., and Williams, S., “Estimates of Bacterial
Growth Rate Constants from Thymidine Incorporation and Variable Conversion
Factors”, Microb Ecol., 25, 121–130 (1993).
Chung, C. Y., McCoy, B. J., and Scow, K. M., “Criteria to assess when biodegradation is
kinetically limited by intraparticle diffusion and sorption”, Biotechnol. Bioenging.,
41, 625–632. (1993).
Churchill, P. F. and Churchill, S. A. “Surfactant–enhanced biodegradation of solid
alkanes”, J. Environ. Sci. Health A., 32, 293–306. (1997).

77
Clar, E., Polycyclic hydrocarbons. New York: Academic Press, (1964).
Clint, J. H. “Micellization of mixed nonionic surface active agents”, J. Chem. Soc.,
Faraday Trans.1, 71, 1327–1334. (1975).
Connell, D. W. “Basic concepts of environmental chemistry”. New York: Lewis, (1997).
Dar, A. A., Rather, G. M., and Das, A. R., “Mixed micelle formation and solubilization
behavior toward polycyclic aromatic hydrocarbons of binary and ternary cationic–
nonionic surfactant mixtures”, J. Phys. Chem. B., 111, 3122–3132 (2007).
De Oude, N. T., “The Handbook of environmental chemistry part F: Anthropogenic
compounds”, Vol. 3, Springer Verlag, Heidelberg, FR Germany, (1992).
Desai, J. D., Banat, I. M., “Microbial production of surfactants and their commercial
potential”, Microbiol. Mol. Biol. Rev. 61, 47–64 (1997).
Deshpande, S., Shiau, B. J., Wade, D., Sabatini, D. A., and Harwell, J. H., “Surfactant
selection for enhancing ex situ soil washing”, Water Res., 33, 351– 360 (1999).
Edwards, D. A., Adeel, Z., and Luthy, R. G., “Distribution of nonionic surfactant and
phenanthrene in a sediment/aqueous system”, Environ. Sci. Technol., 28, 1550–1560
(1994).
Edwards, D. A., Luthy, R. G., and Liu, Z., “Solubilization of polycyclic aromatic
hydrocarbons in micellar nonionic surfactant solutions”, Environ. Sci. Technol., 25,
127–133 (1991).
Efroymson, R. A., and Alexander, M., “Biodegradation by an Arthrobacter spp. Of
hydrocarbons partitioned into an organic solvent”, Appl. Environ. Microbiol., 57,
1441–1447 (1991).
Ellis, W. D., Payne, J. R., and McNabb, G. D., “Treatment of contaminated soils with
aqueous surfactants”, US EPA No. EPA/600/2–85/129, 1985.
Falatko, D. D., and Novak, J. T., “Effects of biologically produced surfactants on the
mobility and biodegradation of petroleum hydrocarbons”, Water Environ.Res., 64,
163–169 (1992).
Fenwick, G. R., Price, K. R., Tsukamoto, C., and Okubo, K., “Saponins in toxic
substances in crop plants”, Royal Society of Chemistry., Cambridge, 285–327. (1991).
Fiechter, A., “Biosurfactant: moving towards industrial application”, Tibtech., 10, 208–
217 (1992).

78
Fountain, J. C., “A pilot scale test of surfactant enhanced pump and treat”, Proceedings of
Air and Waste Management Association 85th Annual Meeting in Denver, CO, June
13–18, (1993).
Fountain, J. C., Hodges, D., Project Summary: “Extraction of Organic Pollutants Using
Enhanced Surfactant Flushing Initial Field Test (Part 1)”, NY State Center for
Hazardous Waste Management, February (1992).
Georgiou, G., Lin S. C., and Sharma M. M., “Surface–active compounds from
microorganisms’, Bio/Technology., 10, 60–65 (1992).
Grimberg, S. J., Stringfellow, W. T., and Aitken, M.D., “Quantifying the biodegradation
of phenanthrene by Pseudomonas stutzei P16 in the presence of a nonionic
surfactant”, Appl. Environ. Micro biol., 62, 2387–2392 (1996).
Guha, S., and P. R. Jaffe, P. R., “Biodegradation kinetics of phenanthrene partitioned into
the micellar phase of nonionic surfactants”, Environ. Sci. Technol., 30, 605–611
(1996).
Guha, S., Jaffe, P., and Peters, C., “Bioavailability of mixtures of PAHs partitioned into
the micellar phase of a nonionic surfactant”, Environ. Sci. Technol., 32, 930–935
(1998).
Gurfinkel, D. M., and Rao, A.V., “Soyasaponins: The relationship between chemical
structure and colon anticarcinogenic activity”, Nutr. Cancer., 47, 24– 33 (2003).
Haeseler, F., Blanchet, D., Druelle, V., and Vandecasteele, J. P., “Ecotoxicological
assessment of soils of former manufactured gas plant sites: bioremediation potential
and pollutant mobility”, Environ. Sci. Technol., 33, 4379–4384 (1999).
Haferburg, D., Hommel, R., Claus, R., and Klebel, H. P. “Extracellular microbial lipids
as biosurfactants”, Adv. Biochem. Eng. Biotech., 33, 53–93 (1986).
Harvey, R. G. “Mechanisms of carcinogenesis of polycyclic aromatic hydrocarbons”,
Polycyclic Aromatic Compounds., 9, 1–23 (1996).
Harvey, R. G. “Polycyclic aromatic hydrocarbons; Chemistry and carcinogenicity”, New
York: Cambridge University Press, (1991).
Holland, P. M. “Nonideal mixed micellar solutions”, Adv. Colloid Interf. Sci., 26, 111-
129 (1986).
Hommel, R. K., “Formation and physiological role of biosur factants produced by
hydrocarbon–utilizing microorganisms”, Biodegradation., 1, 107–109 (1990).

79
Hommel, R., Stuwer, O., Stuwer, W., Haferburg, D., and Kleber, H. P., “Production of
Water Soluble Surface Active Exolipids by Torulopsis apicola”, Appl. Microbiol.
Biotechnol., 26, 199–205 (1987).
Hong, K. J., Tokunaga, S., and Kajiuchi, T. “Evaluation of remediation process with
plant–derived biosurfactant for recovery of heavy metals from contaminated soils”,
Chemosphere, 49, 379–387 (2002).
Hostettman, K., and Marston, A., “Saponins”, Cambridge University Press (Cambridge,
U.K.). (1995).
Huang, H. C., Liao, S. C., Chang, F. R., Kuo, Y. H., and Wu, Y. C., “Molluscicidal
saponins from sapindus mukorossi, inhibitory agents of golden apple snails, Pomacea
canaliculata”, J. Agric. Food Chem., 51, 4916–4919 (2003).
Jafvert, C. T., Report: Surfactants/Cosolvent. Ground–Water Remediation Technologies
Analysis Center, Document TE–96–02. (1996).
Jenny, K., Kappeli, O., and Fiechter, A., “Biosurfactants from Bacillus licheniformis:
structural analysis and characterization”, Appl. Microbiol. Biotechnol., 36, 5–13
(1991).
Joshi, M. M., Lee, S., “A novel treatment train for remediation of PAH contaminated
soils”, Fresenius Environ. Bull., 4, 617–623 (1995).
Kang, K. H., Kim, H. U., Lim, K. H., and Jeong, N. H., “Mixed Micellization of Anionic
Ammonium Dodecyl Sulfate and Cationic Octadecyl Trimethyl Ammonium
Chloride”, Bull. Korean Chem. Soc., 22, 1009–1014 (2001).
Kästner, M., Streibich, S., Beyrer, M., Richnow, H. H, and Fritsche, W., “Formation of
bound residues during microbial degradation of [14C] Anthracene in soil”, Appl.
Environ. Microbiol. 65, 1834–1842 (1999).
Kim, D. H., Moon, Y. S., Jung, J. S., Min, S. K., Son, B. K., Suh, H. W., and Song, D.
K., “Effects of ginseng saponin administered intraperitoneally on the hypothalamo
pituitary–adrenal axis in mice”, Neurosci. Lett., 343, 62–66 (2003).
Ko, S., Schlautman, M. A., and Carraway, E. R., “Effects of solution chemistry on the
partitioning of phenanthrene to sorbed surfactants”, Environ. Sci. Technol., 32, 3542–
3548 (1998).

80
Kommalapati, R. R., and Roy, D., “Bioenhancement of soil microorganisms in natural
surfactant solutions. II. Anaerobic”, J. Environ. Sci. Health, Part A., 32, 835–847
(1997).
Kommalapati, R. R., and Roy, D., “Bioenhancement of soil microorganisms in natural
surfactant solutions. I. Aerobic”, J. Environ. Sci. Health, Part A., 31, 1951–1964
(1996).
Kommalapati, R. R., Valsaraj, K. T., David, W. C., and Roy, D., “Aqueous solubility
enhancement and desorption of hexachlorobenzene from soil using a plant–based
surfactant”, Water.Res., 31, 2161–2170 (1997).
Laha, S., and Luthy, R., “Inhibition of phenanthrene mineralization by nonionic
surfactants in soil water systems”, EnvironSci Technol., 25, 1920–1930 (1991).
Lang, S., and Wullbrandt, D., “Rhamnose lipids – biosynthesis, microbial production and
application potential”, Appl. Microbiol. Biotechnol., 51, 22–32 (1999).
Leahy, J. G., and Colwell R. R., “Microbial Degradation of Hydrocarbons in the
Environment”, Microbiol Mol Biol Rev., 54, 305–315 (1990).
Lee, M. L., Novotny, M. V., and Bartle, K. D., “Analytical chemistry of polycyclic
aromatic compounds”, Academic press, New York: Academic Press, (1981).
Lin, S., “Biosurfactants: Recent Reviews”, J. Chem.Tech. Biotechnol., 66, 109–120
(1996).
Liu, Z., Jacobson, A. M., and Luthy, R. G., “Biodegradation of naphthalene in aqueous
nonionic surfactant systems”, App. Environ. Microbiol., 61, 145–151 (1995).
Luthy, R. G., Dzombak, D. A., Peters, C. A., Roy, S. B., Ramaswami, A., Nakles, D.V.,
and Nott, B.R., “Remediating tar–contaminated soils at manufactured gas plant sites”,
Environ. Sci. Technol., 28, 266A–276A (1994).
MacDonald, C. R., Coopper, D. G., and Zajic, J. E., “Surface–Active Lipids from
Nocardia erythropolis Grown on Hydrocarbons”, Appl. Environ. Microbiol., 41, 117–
123 (1981).
Maier, R. M, and Sobeŕon–Chávez, G., “Pseudomonas aeruginosa rhamnolipids:
biosynthesis and potential environmental applications’, Appl Microbiol Biotechnol.,
54, 625–633 (2000).

81
Makkar, R. S., and Rockne, K. J., “Comparison of synthetic surfactants and
biosurfactants in enhancing biodegradation of polycyclic aromatic hydrocarbons”,
Environmental Toxicology and Chemistry., 22, 2280–2292 (2003).
Menger, F. M., and Littau, C. A., “Gemini surfactants: a new class of self–assembling
molecules”, J Am Chem Soc., 115, 10083–10090 (1993).
Menger, F. M., and Littau, C. A., “Gemini–surfactants: synthesis and properties”. J Am
Chem Soc., 113, 1451–1452 (1991).
Menzie, C. A., Potocki, B. B., and Santodanato, J., “Exposure to carcinogenic PAH’s in
the environment”, Environ. Sci. Technol., 26, 1278–1284. (1992).
Mihelic, J. R., Luthy, R. G., “Microbial degradation of acenaphthene and naphthalene
under dinitrification conditions in soil–water systems”, Appl. Environ. Microbiol., 54,
1188–1198 (1988).
Miller, R. M., and Bartha, R., “Evidence of liposome encapsulation for transport–limited
microbial metabolism of solid alkanes”, Appl.Environ.Microbiol., 55, 269–274
(1989).
Mohamed, A., and Mahfoodh, A. M., “Solubilization of naphthalene and pyrene by
sodium dodecyl sulfate (SDS) and polyoxyethylenesorbitan monooleate (Tween 80)
mixed micelles”, Colloids Surf. A., 287, 44–50 (2006).
Moon, J. W., Golz, M. N., Ahn, H. H., and Park, J. W. “Dissolved organic matter effects
on the performance of a barrier to polycyclic aromatic hydrocarbon transport by
groundwater”, J. Contamin. Hydrol., 60, 307–326.(2003).
Muller–Hurtig, R. F., Wagner, F., Blaszcyk, R., and Kosaric, N., “Biosurfactants for
environmental control”, Marcel Dekker, Inc., New York, N.Y. 447–469 (1993).
Mulligan, C. N., “Environmental applications for biosurfactants”, Environ Pollut., 133,
183–198 (2005).
Münster, A. “Statistical Thermodynamics”, Springer: New York. 2, 650 (1974)
Nash, J.H., Project summary: field studies of in situ soil washing. EPA/600/S2–87/1110.
US Environmental Protection Agency. February (1988).
National Institute of Environmental Health Science National Toxicology Program, Eighth
Report on Carcinogens (RoC) Department of Health and Human Services,
Washington, D.C., (1997).
Oakenfull, D. G., “Saponins in food: a review”. Food Chemistry., 6, 19–40(1981).

82
Oakenfull, D. G., and Sidhu, G. S., “Saponins”, In Toxicants of Plant Origin. Vol. II.
Glycosides ed., Cheeke, P.R, 97–141. Boca Raton: CRC Press Inc. (1989).
Paria, S., “Surfactant–enhanced remediation of organic contaminated soil and water”,
Adv. Colloid Interface Sci., 138, 24–58 (2008).
Paria, S., Yuet, P. K., “Solubilization of napthalene by pure and mixed surfactants”, Ind.
Eng. Chem. Res., 45, 3352–3358 (2006).
Persson, A., Oseterberg, E., Dostalek, M., “Biosurfactant production by Pseudomonas
fluorescens 378: growth and product characteristics”, Appl. Microbiol. Biotechnol.,
29, 1–4 (1988).
Pignatello, J. J., and Xing, B., “Mechanisms of slow sorption of organic chemicals to natural
particles”, Environ. Sci. Technol., 30, 1–11. (1996).
Porter, M. R., “Handbook of surfactants”, New York: Chapman and Hall Publishers
(1991).
Price, K. R., Johnson, I. T., and Fenwick, G. R., “The chemistry and biological
significance of saponins in foods and feeding stuffs”, CRC Critical Reviews in Food
Science and Nutrition., 26, 27–135 (1987).
Ramsay, B., McCarthy, J., Guerra–Santos, L., Kaepelli, O., Feitcher, A., Margaritis, A.,
“Biosurfactant production and diauxic growth of Rhodococcus aurantiacus when
using n–alkanes as carbon source”, Can. J. Microbiol., 34, 1209–1212 (1988).
Rao, K. J., and Paria, S., “Solubilization of Naphthalene in the Presence of Plant-
Synthetic Mixed Surfactant Systems”, J. Phys. Chem. B., 113, 474–481 (2009).
Rice University, Technology Practice Manual for Surfactants and Cosolvents, Rice
University, Houston, TX. (1997).
Riser–Roberts, E. R., “Remediation of petroleum contaminated soils: Biological,
physical, and chemical process”, Lewis Publ., CRC Press, Boca Raton, FL, (1998).
Rodenas, E., Valiente, M., and Del Sol Villafruela, M., “Different Theoretical
Approaches for the Study of the Mixed Tetraethylene Glycol Mono–n–dodecyl
Ether/Hexadecyltrimethylammonium Bromide Micelles”, J. Phys. Chem. B., 103,
4549–4554 (1999).
Ron, E. Z., & Rosenberg, E., “Biosurfactants and oil bioremediation”, Curr. Opin.
Biotechnol., 13, 249–252 (2002).

83
Rosen, M. J., “Surfactants and Interfacial Phenomena”, 2nd editon, Wiley, New York,
122 (1989).
Rosen, M. J., “Surfactants and interfacial phenomena”, Wiley, New York, 2004.
Rosenberg, E. “Microbial surfactants”, CRC Critical Reviews in Biotechnology. 3, 109–
132 (1986).
Rothmel, R. K., Peters, R. W., St. Martin, E., and Deflaun, M. F., “Surfactant
Foam/Bioaugmentation Technology for In Situ Treatment of TCE–DNAPLs”,
Environ Sci Technol., 32, 1667 (1998)
Rouse, J., Sabatini, D., Suflita, J., and Harwell, J., “Influence of surfactants on microbial
degradation of organic compounds”, Criti.Rev. Environ.Sci.Technol., 24. (1994).
Row, L. R., and Rukmini, C., “Chemistry of saponins: Part 1. Saponin of Sapindus
mukorossi gaertn”, Indian J. Chem., 4, 36–38, (1966).
Roy, D., Kongaraa, S., and Valsarajb, K. T., “Application of surfactant solutions and
colloidal gas aphron suspensions in flushing naphthalene from a contaminated soil
matrix”, J. Hazard. Mater., 42, 247–263 (1995).
Rubingh, D. N., in Mittal, K. L (Ed.), “Solution chemistry of surfactants”, Vol. 1, Plenum
Press, New York, 337 (1979).
San Martín, R., and Briones, R., “Industrial uses and sustainable supply of Quillaja
saponaria saponins”, Economic Botany. 53, 302– 311. (1999)
Saroja, G., Ramachandram, B., Saha, S., and Samanta, A., “The Fluorescence Response
of a Structurally Modified 4–Aminophthalimide Derivative Covalently Attached to a
Fatty Acid in Homogeneous and Micellar Environments A”, J. Phys. Chem. B., 103,
2906–2911 (1999).
Schopke, T., and Bartlakowski, J., “Effects of saponins on the water solubility of
quercetin”, Pharmazie. 52, 232–234 (1997).
Schippers, C., Gessner, K., Mueller, T., and Scheper, T., “Microbial degradation of
phenanthrene by addition of a sophorolipid mixture”, J Biotechnol., 83, 189–198
(2000).
Schott, H., “Thermally cleavable surfactants based on furan maleimide Diels Alder
adducts”, J. Phys. Chem., 71, 3611–3617 (1967).

84
Soerens, T., Sabatini, D., and Harwell, J., “Surfactant enhanced solubilization of residual
DNAPL: column studies”, Subsurface Restoration Conferrence, Dallas, TX, June21–
24, (1992).
Stanghellini, M. E., and Miller, R. M., “Biosurfactants, their identity and potential
efficacy in the biological control of zoosporic plant pathogens”, Plant Disease. 81, 4–
12 (1997).
Stelmack, P. L., Gray, M.R., and Pickard, M.A., Bacterial adhesion to soil contaminants
in the presence of surfactants. Appl. Environ. Microbiol., 65, 163–168 (1999).
Stucki, G., and Alexander, M., “Role of dissolution rate and solubility in biodegradation of
aromatic compounds”, Appl. Environ. Microbiol., 53, 292–297 (1987).
Tarter, H.V., Llong, A. L. M., “Micellar molecular weights of some paraffin chain salts
by light scattering”, J. Phys. Chem., 59, 1185–1190 (1955).
Tedros, T. F., Applied Surfactants. Wiley– VCH, Weinheim, 2005.
Thangamani, S., and Shreve, G. S., “Effect of anionic biosurfactant on hexadecane
partitioning in multiphase systems”, Environ.Sci.Technol., 28, 1993-2000 (1994).
Thomas, J. M., Yordy, J. R., Amador, J. A., and Alexander, M. “Rates of dissolution and
biodegradation of water–insoluble organic compounds”, Appl. Environ. Microbiol., 52,
290–296 (1986).
Tiehm, A., “Degradation of polycyclic aromatic hydrocar bons in the presence of
synthetic surfactants”, Appl Environ Microbiol ., 60, 258–263 (1994).
Tiehm, A., Stieber, M., Werner, P., and Frimmel, F., “Surfactantenhanced mobilization
and biodegradation of polycyclic aromatic hydrocarbons in manufactured gas plant
soil”, Environ Sci Technol., 31, 2570–2576 (1997).
Tokiwa, F., “Solubilization behavior of sodium dodecylpolyoxyethylene sulfates in
relation to their polyoxyethylene chain lengths”, J. Phys. Chem., 72, 1214–1217
(1968).
Tokuota, Y., Uchiyama, H., Abe, M., and Christian, S. D., “Solubilization of some
synthetic perfumes by anionic–nonionic mixed surfactant systems”, J. Phys. Chem.,
98, 6167–6171 (1994).
Treiner, C., Nortz, M., Vaution, C., and Puisieux, F., “Micellar solubilization in aqueous
binary surfactant systems: Barbituric acids in mixed anionic + nonionic or cationic +
nonionic mixtures”, J. Colloid Interface. Sci., 125, 261 – 270 (1998).

85
Tsomides, H. J., Hughes, J. B., Thomas, J. M., and Ward, C. H., “Effect of surfactant
addition on phenanthrene biodegradation in sediments”, Environ. Toxicol. Chem., 14,
953–959 (1995).
Tummino, P. J., and Gafni, A., “Determination of the aggregation number of detergent
micelles using steady–state fluorescence quenching Peter”, Biophys. J., 64, 1580–
1587 (1993).
Umlong, I.M., and Ismail, K., “Micellization of AOT in aqueous sodium chloride,
sodium acetate, sodium propionate, and sodium butyrate media: A case of two
different concentration regions of counterion binding”, J. Colloid Interface. Sci., 291,
529–536 (2005).
Underwood, J. L., Debelak, K. A., Wilson, D. J., and Means, J. M. “Soil cleanup by in–
situ surfactant flushing”, V. Sep. Sci. Technol., 28, 1527–1537 (1993).
USEPA, Office of Solid Waste and Emergency Response. Vendor Information System for
Innovative Treatment Technologies. VISITT 6.0, EPA–543–C–98–001. (1998).
Van Dyke, M. I., Lee, H., Trevors, J. T., “Applications of microbial surfactants.
Biotechnol”, Biotech. Adv., 9, 241-252 (1991).
Velikonja, J., and Kosaric, N., “Biosurfactant in food applications. InBiosurfactants —
production, properties and applications, ed Kosaric, N. pp. 419–446. New York:
Marcel Dekker (1993).
Venable, R. L., and Nauman, R. V., “Micellar weights of and solubilization of benzene
by a series of tetradecylammonium bromides. The effect of the size of the charged
head”, J. Phys. Chem., 68, 3498–3503 (1964).
Volkering, F., Breure, A. M., and Rulkens, W. H., “Microbiological aspects of surfactant
use for biological soil remediation”, Biodegradation, 8, 401-417(1998).
Volkering, F., Breure, A., Andel, J., and Rulkens, W., “Influence of non–ionic surfactants
on bioavailability and biodegradation of polycyclic aromatic hydrocarbons”, Appl
Environ Microbiol., 61, 1699–1705 (1995).
Vollenbroich, D., Pauli, G., Ozel, M. and Vater, J., “Antimycoplasma Properties and
Application in Cell–Culture of Surfactin, a Lipopeptide Antibiotic from Bacillus
subtilis”, Appl. Environ. Microbiol., 63, 44–49 (1997).
Walthelm, U., Dittrich, K., Gelbrich, G., and Schopke, T., “Effects of saponins on the
water solubility of different model compounds”, Planta Med., 67, 49–54 (2001).

86
Westall, J., Hatfield, J., and Chen, H., The use of cationic surfactants to modify aquifer
materials to reduce the mobility of hydrophobic organic compounds. A study of
equilibrium and kinetics. Subsurface Restoration Conference, Dallas, TX, June 21–24
(1992).
Wild, S. R., Berrow, M. L., and Jones, K. C., “The Persistence of Polynuelear Aromatic
Hydrocarbons (PAHs) in Sewage Sludge Amended Agricultural Soils”, Environ
Pollut., 72, 141–157 (1991).
Willumsen, P. A., Karlson, U., and Pritchard, P. H., “Response of fluoranthene–
degrading bacteria to surfactants”, Appl Microbiol Biotechnol., 50, 475-483 (1998).
Wilson, S. C., and Jones, K. C., “Bioremediation of soil contaminated with polynuclear
aromatic hydrocarbons (PAHs): A review”, Environ. Pollut., 81, 229–249 (1993).
Windholz, M., The Merck Index: An Encyclopedia of Chemicals, Drugs, and Biolog&als.
Merck & Co., Rathway, New Jersey, (1983).
Wong, J. W. C., Fang, M., Zhao, Z., and Xing, B., “Effect of surfactants on solubilization
and degradation of phenanthrene under thermophilic conditions”, J. Environ. Qual.,
33, 1947–1953 (2004).
Yeom, I. T., Ghosh, M. M., and Cox, C. D., “Kinetic aspects of surfactant solubilization
of soil–bound polycyclic aromatic hydrocarbons”, Environ. Sci. Technol., 35, 1589–
1595. (1996).
Yuan, S., Wei, S., and Chang, B., “Biodegradation of polycyclic aromatic hydrocarbons
by a mixed culture”, Chemosphere. 41, 1463–1468 (2000).
Zhang, Y., and Miller, R., “Enhanced octadecane dispersion and biodegradation by a
Pseudomonas rhamnolipid surfactant (biosurfactant)”, Appl Environ Microbiol., 58,
3276–3282 1992..
Zhang, Y., Miller, R. M., “Effect of Rhamnolipid (Biosurfactant) Structure on
Solubilization and Biodegradation of n-Alkanes”, Environ Microbiol.; 61,2247-2251
(1995).
Zhang, Y.M., Maier, W.J., and Miller, R.M., “Effect of rhamnolipids on the dissolution,
biavailability and biodegradation of phenanthreane”, Environ. Sci. Technol., 31,
2211–2217 (1997).
Zhou, W., and Zhu, L., “Solubilization of polycyclic aromatic hydrocarbons by anionic
nonionic mixed surfactants”, Colloids Surf. A., 225, 145–152. (2005).

87
Zhou, W., and Zhu, L., “Solubilization of pyrene by anionic–nonionic mixed
surfactants”, J. Hazard. Mater., 109, 213–220 (2004).
Zhu, L. Z., and Chiou, C. T., “Water solubility enhancements of pyrene by single and
mixed surfactant solutions”, J. Environ. Sci., 13, 491–496 (2001).
Zhu, L., and Feng, S., “Synergistic solubilization of polycyclic aromatic hydrocarbons by
mixed anionic–nonionic surfactants”, Chemosphere. 53, 459–467 (2003).

88
Publications
Journal
• K. Jagajjanani Rao and Santanu Paria. “Solubilization of Naphthalene in presence
of plant and plant – synthetic mixed surfactant systems”, Journal of Physical
Chemistry B 113, 474–481 (2009).
To be communicated
• K. Jagajjanani Rao and Santanu Paria. “Mixed micellar characteristic of Sapindus
mukorossi – synthetic mixed surfactant systems”.
• K. Jagajjanani Rao and Santanu Paria. “Biodegradation of naphthalene in
presence of Sapindus mukorossi – synthetic mixed surfactant systems”.
Presented at conference
• K. Jagajjanani and Rao Santanu Paria. “Mixed micellar and solubilization
behavior of Sapindus mukorossi – synthetic mixed surfactant systems”,
International conference on Environmental Research (ICER-2008), BITS – Goa,
Dec. 18-20, 2008.
• K. Jagajjanani Rao and Santanu Paria. “Biodegradation of Naphthalene in
presence of plant, synthetic and mixed surfactant systems”, International
conference on Environmental Research (ICER-2008), BITS – Goa, Dec. 18-20,
2008.
Subscriber access provided by NATL INST OF TECH ROURKELA
The Journal of Physical Chemistry B is published by the American ChemicalSociety. 1155 Sixteenth Street N.W., Washington, DC 20036
Article
Solubilization of Naphthalene in the Presenceof Plant#Synthetic Mixed Surfactant Systems
K. Jagajjanani Rao, and Santanu PariaJ. Phys. Chem. B, 2009, 113 (2), 474-481 • DOI: 10.1021/jp8071298 • Publication Date (Web): 19 December 2008
Downloaded from http://pubs.acs.org on January 14, 2009
More About This Article
Additional resources and features associated with this article are available within the HTML version:
• Supporting Information• Access to high resolution figures• Links to articles and content related to this article• Copyright permission to reproduce figures and/or text from this article

Solubilization of Naphthalene in the Presence of Plant-Synthetic Mixed Surfactant Systems
K. Jagajjanani Rao and Santanu Paria*Department of Chemical Engineering, National Institute of Technology, Rourkela 769 008, Orissa, India
ReceiVed: August 10, 2008; ReVised Manuscript ReceiVed: NoVember 7, 2008
Solubilization efficiencies of naphthalene by micellar solution of a plant-based surfactant extracted from fruitof Sapindus mukorossi (reetha) and the synthetic surfactants like nonionic (Triton X-100 or TX-100), cationic(cetyltrimethylammonium bromide or CTAB), and anionic (sodium dodecylbenzenesulfonate or SDBS; dioctylsodium sulfosuccinate or AOT; sodium octanesulfonate or SOS) in their single and as well as binary mixed(plant-synthetic) systems were measured and compared. The solubilization efficiency of single surfactantsshows that reetha is less effective than TX-100, similar to SDBS, and more than AOT and SOS. The mixedsurfactant systems show negative deviation in molar solubilization ratio (MSR) from ideality. The ascendingorder of percent change in MSR (∆MSR) is TX-100-reetha < CTAB-reetha < SDBS-reetha < AOT-reetha< SOS-reetha. The mixed micellar solution for a particular combination also shows that ∆MSR is more negativewhen the interaction parameter for the mixed micelle () is more negative. The results of this study may beuseful for the applications of natural or natural-synthetic mixed surfactants in surfactant-enhanced remediationor detergency.
1. Introduction
Hydrophobic organic contaminants (HOCs) are found in thepriority list of hazardous substances listed by the U.S. EPA andthe Agency for Toxic Substances and Disease Registry of USA.1
The hydrophobicity of an organic contaminant is one of theimportant factors that determine the fate of the contaminant inthe environment. In general, the more hydrophobic contaminantis more likely to be associated with the nonpolar organic mattersuch as humic substances and lipids (fats) in the soil. Polyaro-matic hydrocarbons (PAHs) like naphthalene, anthracene, andphenanthrene are commonly found in petroleum fuels, coalproducts, and tar. Because of their persistence in nature, theseare generally hazardous, sometimes above the chronic level andprevalent at many contaminated sites, such as former manu-factured gas plant sites and wood treatment facilities.2 Becauseof their existence in the environment, they are affecting humanhealth by toxic, mutagenic, and carcinogenic properties; muchresearch effort has been aimed for remediation of PAH-contaminated sites.3 PAHs are removed from contaminated sitesprincipally by microbial degradation. However, other possiblefates of PAHs are volatilization, photooxidation, chemicaloxidation, bioaccumulation, adsorption, and adhesion to the soilmatrix.4 From the remediation perspective, it is important toexamine the environmental properties of these compounds.Because of their high adsorption capacity and low watersolubility, these compounds are relatively immobile and areoften not readily bioavailable, and they can stay for a long timein the soil.5
Surfactants flushing emerged as new alternative to treat PAH-contaminated soil and water systems, and many laboratorystudies are reported.6,7 Surfactants in aqueous solution solubilizethe water insoluble hydrophobic compounds in the core of themicelles.8 The effectiveness of a surfactant in solubilizing aparticular solute is known as MSR, expressed by8
where S and SCMC are the apparent solubility of an organiccompound at surfactant concentration CS (CS > CMC) and thatat the CMC, respectively. Thus, when solute concentration inthe solvent phase is plotted against surfactant concentrationabove the CMC, MSR can be determined from the slope of thelinearly fitted line.
Mixed surfactant systems for the remediation of organiccontaminants are gaining more and more importance over thesingle surfactants in recent years due to their better performancethan the single surfactants.9,10 The solubilization performancesof organic compounds in mixed surfactants aiming for reme-diation application are mostly laboratory scale and limited thanthat of single surfactants.6,9-13 However, until now there is avery little information available on their fate in subsurface. Thesurfactants left in subsurface after the remediation process mayhave a negative or positive influence on the biodegradation ofthe organic compounds.14 The nonbiodegradable syntheticsurfactants along with organic contaminants become hazardousto the environment. In this case, the surfactant toxicity and itspotential are to be carefully considered prior to the selection ofsurfactants for soil and water bodies cleanup.15 Biosurfactantsare found to be promising recently due to their environmentallyfriendly nature; however, their use has been limited in industrydue to some technical and/or economic reasons. Naturalsurfactants from plant origin may gain more importance in thefuture, but very few studies have been done employing themfor hydrophobic contaminants removal from the soil.16
Plant-based natural surfactant derived from Sapindus muko-rossi, commonly known as “soapnut” or reetha, is a saponin, anon-ionic glycoside containing sugars such as D-glucose,D-xylose, L-arbinose, L-rhamnose, and glucoronic acid.17 Solu-bilization studies using reetha surfactant exposed its remediationpotential on different hydrophobic contaminants in soil andwater systems18,19 along with efficient biodegradable propertyunder both aerobic and anaerobic conditions.19,20
* Corresponding author. E-mail: [email protected] or [email protected]; Fax +91 661 246 2999.
MSR ) (S - SCMC)/(CS-CMC) (1)
J. Phys. Chem. B 2009, 113, 474–481474
10.1021/jp8071298 CCC: $40.75 2009 American Chemical SocietyPublished on Web 12/19/2008

In this paper, we have studied the solubilization of naphtha-lene in the presence of reetha in different proportions withcationic, nonionic, and anionic synthetic surfactants, which hasnot been reported to the best of our knowledge. The objectiveof this paper is to evaluate the efficiency of reetha surfactantand synthetic-reetha surfactant combinations to solubilizenaphthalene in aqueous systems using batch studies for theapplication of surfactant-enhanced remediation soil and otherapplications like detergency and industrial cleaning, etc. As thesynthetic surfactants hinders biodegradation process,21,22 thatused in remediation process or in laundry cleaning creates lotsof environmental problem. The use of only natural surfactantor synthetic-natural surfactant mixture enables easy degrada-tion. Nowadays, many countries are trying to focus on thebiosurfactants from microorganism as a substitute of syntheticsurfactants, but in our view, production of plant-based surfactantis very easy in comparison to biosurfactants, and a huge amountof plant surfactant production is possible to substitute syntheticsurfactants. In that respect, it is worthy to give more insight inthis area.
2. Experimental Section
2.1. Materials. The surfactants TX-100, CTAB, AOT, andSOS were obtained from Loba chemie Pvt Ltd., India, sodiumdodecylbenzenesulfonate (SDBS) was from Sigma Aldrich,Germany, and naphthalene was from Spectrochem Pvt. Ltd.,India. All the chemicals were used as received. Dry fruit (reethaor S. mukorossi) was purchased from the local market, Rourkela,Orissa, India. The structures of surfactants used in this studyare shown in Figure 1. Ultrapure water (Sartorius AG Gottingen,Germany) was used for the experiments of 18.2 mΩ resistivity
and pH 6.8-7. Surface tensions of surfactant solutions weredetermined by the Whilmey plate method using a surfacetensiometer, Data Physics, Germany (DCAT-11EC). Naphtha-lene concentrations were measured by a UV-vis spectropho-tometer (Jasco, Japan, V-530). The organic content of the plantsurfactant solution was measured by total organic carbonanalyzer (Shimadzu, Japan, TOC-VCPN).
2.2. Extraction of Reetha Surfactant from the Fruit. Afterremoving seed from fruit, the pericarp was dried in an oven at50 °C for about 48 h and then powdered in a grinder. Thepowdered sample was extracted with methanol gave a brownsyrup. The suspended particles were separated by centrifugationat 8000 rpm for 15-20 min and followed by vacuum evapora-tion and drying of the extract at 60-80 °C, which gave a lightyellowish white powder.
2.3. Methods. All the solubility experiments were done inthe polypropylene falcon tubes of capacity 15 mL. A stocksolution of naphthalene (400 mM) was prepared by dissolvingnaphthalene in pure methanol is preferred over higher alcoholsbecause of its negligible effect on solubilization and CMCvalues.23 For experiment 0.1 mL of naphthalene from the stockwas added to 10 mL of surfactant solution of a specified strengthin falcon tube, as 1% methanol will not affect the solubility ofPAH.8,9 The concentration and volume of the stock naphthalenesolution used in each experiment was selected to (i) keep themethanol concentration in the test solution to below 1 vol %and (ii) to give an excess of naphthalene in the test solution.The tube was sealed with a screw cap to prevent volatilizationloss of naphthalene from water. For the study 24 h equilibrationtime was taken as kinetics of solubilization show no change insolubility of naphthalene;9 after 24 h equilibration period and
Figure 1. Structures of surfactant molecules used in this study: (a) SDBS, (b) SOS, (c) AOT, (d) CTAB, (e) TX-100, and (f) reetha.
Solubilization of Naphthalene J. Phys. Chem. B, Vol. 113, No. 2, 2009 475

subsequent centrifugation at 5000 rpm for 30 min to separatethe suspended solids, if any, the concentration of naphthalenewas determined by measuring the absorbance at 274 nmwavelength with a quartz cuvettes of 10 mm path length usinga UV-vis spectrophotometer. Note that subsequent dilutionswere made whereever needed, and surfactant concentration waskept the same in both the reference and the measurement cellsto minimize the effect of surfactant on UV absorbance. Allexperiments were performed at room temperature, 25-28 °C.Experiments were done in triplicate, and the average values arereported.
3. Results and Discussion
3.1. Structure and Physical Properties of Reetha Solution.The structure of reetha is most important to know beforedoing the experiment. Huang et al.24 have proposed thestructure of saponin isolated from S. Mukorossi is shown inFigure 1. They have mentioned that depending on the R groupseven different structures are possible. In our sample totalcarbon content was analyzed using TOC analyzer and foundthe value of 152.5 ppm for 0.03 wt % solution. Back-calculating the TOC of all the probable structures proposedby Huang et al.,24 our value shows less error when weconsider the R group given in Figure 1 and with a molecularweight of 966. We have also compared our TOC value withthe reported value by Kommalapati et al.19 which was 41g/L for 10% solution, which is close to our value 49.24 g/L.The CMC of reetha solution found was around 0.05 wt %(0.510 mM) as measured by a surface tensiometer, which iscomparable with the reported value 0.045 wt %.18 The CMCvalue obtained from solubilization curve (0.517 mM) is alsoshows good agreement with the surface tension data. pH of1% solution was 4.34 close to the reported value of 4.5.19
3.2. Solubilization by Single Surfactants. In this paper wehave mainly focused on the solubilization behavior in presenceof mixture of reetha and different synthetic surfactants. Beforestudying the mixed systems, single surfactants were studied to
get an idea about the effectiveness of different syntheticsurfactants (TX-100, CTAB, SDBS, SOS, and AOT) withrespect to reetha. The solubility of naphthalene in presence ofsynthetic surfactants and reetha is shown in Figure 2a-d. MSRvalues of the single surfactant systems are calculated from theslope of the linear portion of the experimental data (surfactantconcentration in mM vs naphthalene concentration in mM) givenin Table 1. The effectiveness of solubilization can also beexpressed in terms of the other parameter like partition coef-ficient (Km). The partition coefficient is defined as partition ofthe organic compound between micelles and the aqueous phase,which can be written as
where Xm and Xa are the mole fractions of solute in micellesand the aqueous phase, respectively. The value of Xm can becalculated as Xm ) MSR/(1 + MSR), and Xa can be expressedas Xa ) SCMCVw, where Vw ) 0.018 05 L/mol is the molarvolume of water. Consequently, eq 2 can be rearranged to yield
The following order of MSR and log Km values is observed:TX-100 > CTAB > reetha > SDBS > AOT > SOS, shown inTable 1. The difference between reetha and SDBS is found veryclose. The increasing order of CMC values of these surfactantsis TX-100 < reetha < CTAB < SDBS < AOT < SOS. In general,the lower the CMC values, the higher the solubilizationefficiency of the surfactants. Here, except for reetha, all thesynthetic surfactants studied followed the CMC rule. Efficiencyof reetha is expected after TX-100, but practically it is just afterCTAB. In general, it is reported that nonionic surfactants arebetter solubilizing than ionic surfactants because of their lower
Figure 2. Solubilization of naphthalene by using surfactants (a) Reetha, (b) TX-100, (c) SOS, and (d) SDBS, CTAB, AOT.
Km ) Xm/Xa (2)
Km ) MSRSCMCVw(1 + MSR)
(3)
476 J. Phys. Chem. B, Vol. 113, No. 2, 2009 Rao and Paria

CMC. Even the solubilization capacity of a nonionic surfactantof polyoxyethylene type for water-insoluble materials is muchgreater than that of an ionic surfactant having the samehydrocarbon chain length as that of the nonionic surfactant; thisfact suggests that the polyoxyethylene part in the molecule alsoplays an important role in solubilization.25 Between cationic andanionic surfactants with similar chain length cationic surfactantshows greater solubilization efficiency of PAHs due to adsorp-tion at micellar water interface in addition to solubilization inthe inner core of the micelle.9 Here, though the CMCs of CTABand SDBS are very close, due to chain length difference andcationic nature, CTAB shows a higher solubilization efficiency.Less solubilization efficiency of reetha than expected based onthe CMC value is attributed in terms of complex structure ofthe micellar core due to bulkiness of both the hydrophobic (tail)and hydrophilic (head) group. The hydrophobic part is consistsof five six-member cyclic hydrocarbon rings, resulting in shortereffective chain length and less hydrophobic in nature. As ageneral rule, incorporation of a phenyl group in the alkyl groupincreases its hydrophobicity to a much smaller extent thanincreasing its chain length with the same number of carbonatoms.26 Another reason may be the presence of carboxylicgroup in the hydrophobic region reduces the solubilization ofnaphthalene molecule in the inner core due to repulsion betweenthe carboxylic group and π-electron cloud of naphthalene ring.Among the synthetic surfactants, TX-100 and AOT havebranched chain hydrocarbon tail and others have straight chains;as a result, their core region is not as complicated as reetha andmore hydrophobic in nature due to the presence straight orbranched chain hydrocarbon tail. Finally, the micellar aggrega-tion number also plays an important role in the solubilization.The decreased aggregation number in the micelles causesreduced solubilization of nonpolar substances.23 The reportedvalues of micellar aggregation number of the surfactants TX-100, CTAB, SDBS, AOT, SOS, and reetha are ∼145,27 ∼60,28
∼28,29 ∼22,30 ∼25,31 and ∼21,18 respectively. All the syntheticsurfactants show the increasing solubility order according theorder of micellar aggregation numbers. However, reetha has thelowest micellar aggregation number but shows higher solubilitythan SDBS, AOT, and SOS due to its low CMC value. A lowermicellar aggregation number indicates lower solubilizationcapacity per micelle, but at the same time a lower CMC indicatesmore number of micelles present at a particular concentration.Since SDBS, AOT, and SOS show higher CMC than reetha,they have lower solubilization efficiency.
3.3. Solubilization by Surfactant Mixtures. Solubilizationof naphthalene by aqueous surfactant mixtures composed ofreetha with TX-100, CTAB, SDBS, AOT, and SOS is done bytaking different mole proportions of surfactants and comparedwith those by single surfactants (The plots of change ofnaphthalene solubilization in the presence of mixed surfactantsystems are shown in the Supporting Information.) Table 1summarizes different parameter values of mixed surfactantsystems like mixed CMC, MSR, and log Km. Mixed CMC valuesreported here are obtained from the surface tension data; thereis also a good agreement with the values obtained fromsolubilization plot. It is observed from Table 1 that mostly theMSR values of mixed systems are in between that of the singlesurfactants. Figure 3a depicts the effect of change in MSR valuesof different synthetic surfactants in presence of reetha. The figureclearly indicates the MSR values are changing nonlinearly withthe change of mole fraction of reetha (XA); in addition, that isan indication of nonideal behavior of mixed surfactant systems.To measure the nonideality and also to see the nature of
deviation (positive or negative), we have calculated the deviationratio. The deviation ratio is calculated by
where MSRexp is the experimentally determined MSR andMSRideal is the MSR of naphthalene in a binary surfactantmixture based on ideal mixing, i.e.
where X1 and X2 are mole fraction of surfactant 1 and 2,respectively; MSR1 and MSR2 are MSR values of pure surfac-tants 1 and 2, respectively. The values of R > 1 indicate positivedeviation, and R < 1 indicate negative deviation. The change inR with the mole fraction of reetha is shown in Figure 3b.
3.3.1. Mixing Effect of Nonionic-Reetha Surfactants. Themixing behavior of TX-100-reetha systems are depicted inFigure 3a,b and Table 1. The MSR and log Km values withdifferent mole fractions of reetha show the values are decreasingwith the increase in mole fraction of reetha (XR). The resultsindicate solubilization follow almost ideal behavior with smalldeviation for this combination of surfactants. From the table itis clear the deviation ratio (R) is close to 1 for most of thecompositions and percent change in MSR (∆MSR, (MSRexp -MSRideal) × 100/MSRideal or (R - 1) × 100) is less than∼-14%. The maximum ∆MSR is observed at XR ) 0.07. It isalso observed that MSR values are changing linearly (withcorrelation coefficient of linear fit above 0.97 and above 0.99if the point XR ) 0.07 is excluded) for this combination withthe change of reetha mole fraction, an indication of idealbehavior.
3.3.2. Mixing Effect of Cationic-Reetha Surfactants. Simi-lar to the previous combination, the MSR and Km values forCTAB-reetha combination also mostly decreased with theincrease in mole fraction of reetha (see Figure 3a,b and Table1). Initially, with very low concentration of reetha ∆MSR ispositive, and above the reetha mole fraction of 0.14 the valuebecomes negative. The maximum values of positive and negativechange are ∼2% (XR ) 0.14) and ∼-18% (XR ) 0.77),respectively. A similar trend is also observed for log Km.
3.3.3. Mixing Effect of Anionic-Reetha Surfactants. Wehave studied three anionic surfactants SDBS, AOT, and SOSwith a variation of chain length and structure. The change inMSR values with XR does not follow a linear relationship,indicating the nonideal behavior for all the cases. It is observedfrom Figure 3b that the nature of change in R for SDBS is inreverse order to that of CTAB with respect to mole fraction ofreetha. We will explain this in detail in the section 3.5. Thenegative deviation for SDBS is maximum (-39.68%) at XR )0.04. Negative deviation is observed up to ∼0.5 mole fraction;after that the deviation is positive with a very low value ofmaximum 1.48%, i.e., close to ideal behavior. In contrast toprevious surfactants (TX-100, CTAB, and SDBS) AOT showsoverall negative deviation for all the compositions with morenegative values and a maximum of -53% at XR ) 0.16. Similarto AOT, SOS also shows over all negative deviation. Amongall the surfactants studied here SOS shows highest negativedeviation of -78.43% at XR ) 0.09.
Now, by comparing all the results of mixed surfactantsystems, we can conclude that ascending order of ∆MSR is TX-100-reetha < CTAB-reetha < SDBS-reetha < AOT-reetha< SOS-reetha, which is the reverse order of sequence that of
R ) MSRexp/MSRideal (4)
MSRideal ) MSR1X1 + MSR2X2 (5)
Solubilization of Naphthalene J. Phys. Chem. B, Vol. 113, No. 2, 2009 477

single surfactants for solubilization or same sequence of CMC.From Table 1 it is worthy to note that when the synthetic
surfactants are having higher MSR than reetha, the mixedsystems are showing lower MSR than only synthetic surfactant.Similarly, when the synthetic surfactants are having lower MSRthan reetha, then the mixed systems are showing higher MSRthan only synthetic, but the negative deviations indicate lowerMSR than expected or calculated considering ideal mixing.
3.4. Effect of Surfactant Mixtures on Micelle-WaterPartition Coefficient. Treiner et al.32 have suggested thefollowing relationship for the partitioning of a neutral nonpolarorganic solute between micelle and aqueous phase in a mixedsurfactant systems as
where Km1, Km2, and Km1,2 are the micelle-water partitioncoefficients of a solute for the single surfactants constitutingthe mixed micelle and mixed systems, respectively, and Xm1 isthe micellar mole fraction of surfactant 1. B is an empiricalparameter including surfactant-surfactant (like ) and surfac-tant-solute interactions. The value B ) 0 indicates there is nomixing effect of surfactants on the partition of the solute;33 B >0 or B < 0 implies that Km in the mixed surfactant system islarger or smaller, respectively, than predicted by ideal mixingrule.11 X1 can be calculated using mixed micellar theorydiscussed in the next section.
TABLE 1: Values of XR, MSR, R, ∆MSR, log Km, B, , CMC, and x1 for Mixed Surfactant Systems
surfactant XR or R1 MSRideal MSRexp log KmExp R ∆MSR (%) Bb a CMCideal (mM) CMCexp (mM) x1
TX-100 0.00 0.312 0.312 4.937 1.000 0.000 0.000 0.00 0.309 0.309 0.0000.07 0.294 0.253 4.866 0.859 -14.09 0.878 -1.009 0.318 0.239 0.1970.22 0.255 0.251 4.863 0.985 -1.46 1.018 -0.984 0.339 0.292 0.2270.40 0.209 0.219 4.815 1.049 4.95 1.029 -0.625 0.368 0.322 0.3310.61 0.155 0.159 4.698 1.028 2.78 0.779 -0.179 0.409 0.392 0.4850.86 0.091 0.081 4.437 0.897 -10.26 0.128 -0.194 0.437 0.456 0.7651.00 0.054 0.054 4.270 1.000 0.00 0.000 0.000 0.472 0.517 1.000
CTAB 0.00 0.124 0.124 4.630 1.000 0.00 0.000 0.000 1.097 1.097 0.0000.04 0.121 0.133 4.629 1.096 9.59 1.552 -0.106 1.050 1.029 0.0970.14 0.114 0.117 4.579 1.021 2.08 0.802 -0.318 0.949 0.897 0.2830.27 0.105 0.086 4.459 0.821 -17.92 0.072 -0.430 0.839 0.755 0.4550.47 0.091 0.080 4.430 0.878 -12.22 0.319 -0.653 0.719 0.619 0.6170.77 0.070 0.057 4.292 0.817 -18.30 -0.705 -1.247 0.588 0.480 0.7701.00 0.054 0.054 4.270 1.000 0.00 0.000 0.000 0.517 0.517 1.000
SDBS 0.00 0.051 0.051 4.249 1.000 0.00 0.000 0 1.148 1.148 0.0000.04 0.051 0.031 4.038 0.699 -39.68 -5.339 -0.124 1.096 1.069 0.1020.13 0.052 0.032 4.045 0.695 -38.99 -2.377 -0.318 0.987 0.927 0.2830.27 0.052 0.034 4.077 0.730 -34.57 -1.681 -0.429 0.867 0.781 0.4550.46 0.052 0.053 4.262 1.093 1.06 0.004 -0.652 0.737 0.634 0.6170.76 0.053 0.054 4.270 1.049 1.48 0.060 -1.036 0.594 0.544 0.8201.00 0.054 0.054 4.270 1.000 0.00 0.000 0 0.517 0.517 1.000
AOT 0.00 0.020 0.020 3.853 1.000 0.00 0.000 0 2.700 2.700 0.0000.05 0.022 0.016 3.758 0.739 -26.08 -2.415 -0.591 2.240 1.724 0.3100.16 0.026 0.012 3.634 0.469 -53.07 -3.955 -0.758 1.593 1.319 0.5060.32 0.031 0.019 3.831 0.620 -38.02 -2.848 -1.207 1.159 0.886 0.6350.52 0.038 0.023 3.912 0.613 -38.67 -3.166 -1.208 0.848 0.699 0.7540.81 0.047 0.034 4.077 0.720 -28.01 -3.686 -1.347 0.614 0.566 0.8961.00 0.054 0.054 4.270 1.000 0.00 0.000 0.000 0.517 0.517 1.000
SOS 0.00 0.005 0.005 3.257 1.000 0.00 0.000 0.000 157.203 157.2 0.0000.02 0.006 0.002 2.838 0.307 -69.28 -10.598 -2.256 18.831 6.849 0.6370.09 0.009 0.002 2.861 0.216 -78.43 -14.849 -1.930 5.715 3.524 0.7620.18 0.014 0.009 3.511 0.646 -35.38 -9.403 -4.080 2.788 2.069 0.8270.34 0.022 0.011 3.597 0.506 -49.42 -7.955 -5.370 1.498 1.061 0.8260.67 -7.255 0.773 0.525 0.8321.00 0.054 0.054 4.270 1.000 0.00 0.000 0.000 0.517 0.517 1.000
a av: TX-100 ) -0.560; CTAB ) -0.458; SDBS ) -0.511; AOT ) -1.022; SOS ) -4.178. b Bav: TX-100 ) 0.766; CTAB ) 0.408;SDBS ) -1.866; AOT ) -3.214; SOS ) -10.701
Figure 3. Comparison of (a) MSR and (b) deviation ratio, R, ofnaphthalene as a function of mole fraction of reetha for different mixedsurfactant systems.
ln Km1,2 ) Xm1 ln Km1 + (1 - Xm1) ln Km2 +BXm1(1 - Xm1)
478 J. Phys. Chem. B, Vol. 113, No. 2, 2009 Rao and Paria

The B values are calculated from the above relation fornonionic-reetha, cationic-reetha, and anionic-reetha mixturesand presented in Table 1. The average B values obtained fornapthalene in TX-100-reetha, CTAB-reetha, SDBS-reetha,AOT-reetha, and SOS-reetha mixed surfactant systems are0.77, 0.40, -1.86, -3.21, and -10.701, respectively. The Bvalues are found to be negative except TX-100 and CTAB-reethamixtures, and the positive values are also less than one.According to the values of B, the mixing effect of anionic-reethasurfactants on the partition of naphthalene is negative inSDBS-reetha, AOT-reetha, and SOS-reetha mixed systemsand consistent with the result of negative deviation of MSRsfrom ideal, which can be used to explain the mixing effect ofanionic-nonionic surfactants on the solubilization of naphtha-lene. Similarly, that of solubilization of pyrene reported by Zhouet al.33 for anionic-nonionic systems as they got positive B valueand positive deviation of MSR. However, mixtures of TX-100-reetha and CTAB-reetha show the partition of naphtha-lene is positive, which are contradictory with the some negativedeviation of MSRs for some combinations as shown in Table 1with different mole fractions of reetha from the ideal mixture.Similar contradictory results were also found before in otherstudies.33-35 Hence, these results indicate sometimes the mixingeffect of surfactants on the Km1,2 is contrary to that on thesolubilization of organic compounds in mixed surfactants.
3.5. Solution Properties of Mixed Surfactant Systems. Theresults of solubilization in the mixed surfactant systems indicatethe behavior is complex in nature and mostly follow nonidealpath. Since solubilization is closely associated with the solutionproperties of the surfactant micelles, to explain the above resultswe have studied mixed micellar properties of all the combina-tions. The mixed CMC values obtained from the experimentsare reported in Table 1. To know whether the mixed solutionfollows ideal or nonideal behavior mixed CMC values werecalculated using ideal solution theory.36
where CMC1, CMC2, and CMC12 are the critical micelleconcentrations of reetha, pure synthetic surfactant, and mixedsurfactant. R1 is the mole fraction of component 1 in mixedsurfactant solutions. Table 1 clearly indicates that there is adeviation between the ideal and experimental CMC values. Themixed CMCs of TX-100, CTAB, SDBS, and AOT with reethasurfactant are intermediate between the respective individualsurfactants used in the combination. In the case of the TX-100-reetha mixture the experimental values are close to ideal,and in the other cases experimental CMC values are lower thanthe ideal values, indicating negative deviation from the idealbehavior for mixed micelle formation. The data for the othersurfactants show there is a difference between the experimentaland theoretical CMC values, and the deviation is highest forthe SOS-reetha mixture. In further, for nonideal binary mixtureof surfactants Rubingh’s equation of regular solution theory canbe used to calculate the micellar mole fraction.37
The micellar mole fraction (x1) can be calculated from eq 7 bysolving iteratively. To show the interaction between twosurfactants, is an interaction parameter which indicates theinteraction between two surfactant molecules in the mixedmicelle and is a measure of deviation from the ideal behavior.The parameter can be now calculated by substitiuting the valueof x1 in the equation
The parameter quantitatively captures the extent of nonidealityfor a mixed surfactant system. The negative value of indicatessynergism in mixed micelle formation, a positive value indicatesantagonism, and, if zero, then mixed micelle formation is ideal.The larger the absolute value of , the stronger the mixingnonideality. The negative deviation indicates a reduction in freeenergy of micellization over that predicted by ideal solutiontheory. The larger negative value of denotes the greaternegative deviation of CMCs from ideal mixture. All thesurfactants used here show a synergistic effect in the mixtureas it satisfied the conditions (i) must be negative and (ii)ln(CMC1/CMC2) < .38 The extent of deviation from ideality isdifferent for various surfactant combination used as mentionedin Table 1. From the table it is very clear that values are notconstant for all the compositions in a particular binary mixture,and for some compositions the variation is more. In addition, itis also observed that values are very much sensitive to x1;even a small change in second or third decimal level in x1 cangive a very significant change in the parameter. The average values for TX-100, CTAB, SDBS, AOT, and SOS are -0.560,-0.458, -0.511, -1.022, and -4.178, respectively, indicatingthe ascending deviation order as CTAB < SDBS < TX-100< AOT < SOS. These sequences are almost following the sameas that of ∆MSR except TX-100. Actually, the values are veryclose for TX-100, CTAB, and SDBS and since the parameteris very sensitive to x1 value; the change in sequence from theexpected may be due to that. In summary, for the combinationsstudied here indicate if the parameter is more negative, ∆MSR
is also more negative. From the parameter values it can beattributed that AOT and SOS are having more interaction withreetha in the mixed micelle; as a result, surfactant moleculesare more closely packed in the mixed micelle than the puremicelle. Since it reported that looser packing of surfactantmolecules in the mixed micelle may increase the solubilizationof organics in the micellar phase,39-42 in our study we havealso found a similar observation. More closely packed surfactantmicelles resist entering the naphthalene molecule from aqueousphase to micellar phase by diffusion which ultimately mayreduce the solubilization efficiency. When the interactionparameter is more, micelles are closely packed and lead to lesssolubilization and greater deviation from the predicted values.It is also observed for the ionic surfactants deviation is morethan nonionic and may be due to closer packing of ionic micellein the presence of nonionic reetha due to reduction in headgrouprepulsion.
To explain the results of Figure 3a,b, we have plotted and∆MSR vs mole fraction of reetha in Figure 4a,b. For theCTAB-reetha mixture decreasing ∆MSR at high reetha molefraction is attributed in terms of the following reasons. (i) Withincreasing the reetha mole fraction as interaction parameter value() increases, micelles are closely packed, (ii) the presence of
1CMC12
)R1
CMC1+
1 - R1
CMC2(6)
x12 ln(R1C12
x1C1)
(1 - x1)2 ln((1 - R1)C12
(1 - x1)C2)) 1 (7)
)ln(R1C12
x1C1)
(1 - x1)2
(8)
Solubilization of Naphthalene J. Phys. Chem. B, Vol. 113, No. 2, 2009 479
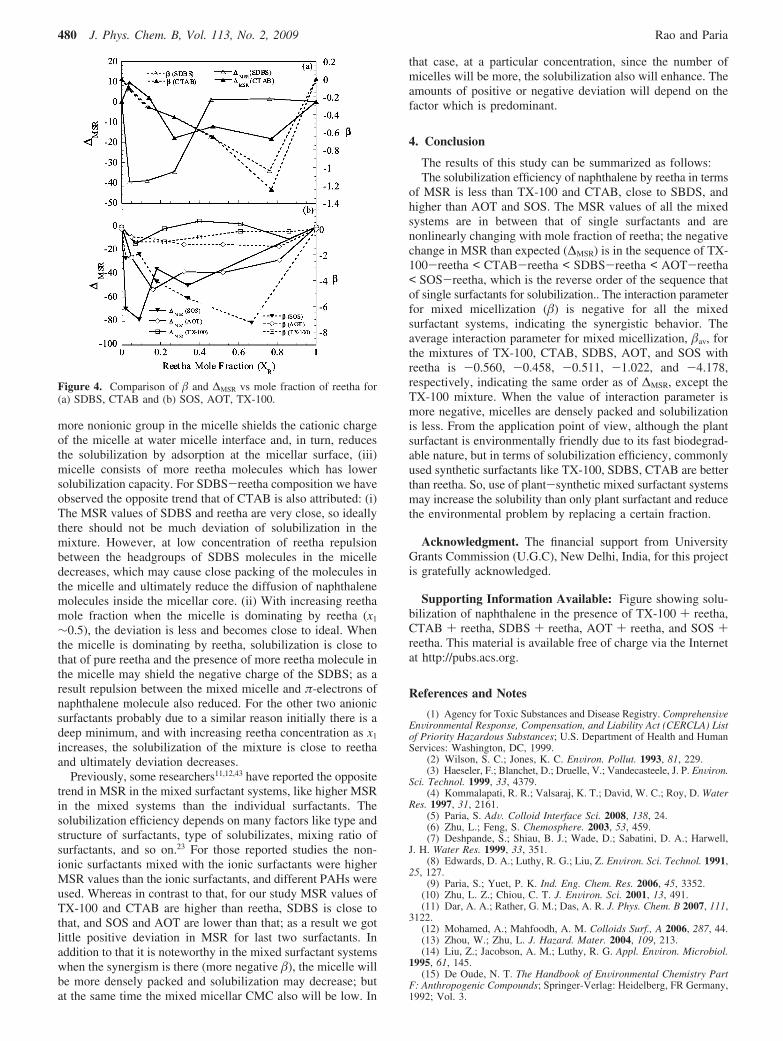
more nonionic group in the micelle shields the cationic chargeof the micelle at water micelle interface and, in turn, reducesthe solubilization by adsorption at the micellar surface, (iii)micelle consists of more reetha molecules which has lowersolubilization capacity. For SDBS-reetha composition we haveobserved the opposite trend that of CTAB is also attributed: (i)The MSR values of SDBS and reetha are very close, so ideallythere should not be much deviation of solubilization in themixture. However, at low concentration of reetha repulsionbetween the headgroups of SDBS molecules in the micelledecreases, which may cause close packing of the molecules inthe micelle and ultimately reduce the diffusion of naphthalenemolecules inside the micellar core. (ii) With increasing reethamole fraction when the micelle is dominating by reetha (x1
∼0.5), the deviation is less and becomes close to ideal. Whenthe micelle is dominating by reetha, solubilization is close tothat of pure reetha and the presence of more reetha molecule inthe micelle may shield the negative charge of the SDBS; as aresult repulsion between the mixed micelle and π-electrons ofnaphthalene molecule also reduced. For the other two anionicsurfactants probably due to a similar reason initially there is adeep minimum, and with increasing reetha concentration as x1
increases, the solubilization of the mixture is close to reethaand ultimately deviation decreases.
Previously, some researchers11,12,43 have reported the oppositetrend in MSR in the mixed surfactant systems, like higher MSRin the mixed systems than the individual surfactants. Thesolubilization efficiency depends on many factors like type andstructure of surfactants, type of solubilizates, mixing ratio ofsurfactants, and so on.23 For those reported studies the non-ionic surfactants mixed with the ionic surfactants were higherMSR values than the ionic surfactants, and different PAHs wereused. Whereas in contrast to that, for our study MSR values ofTX-100 and CTAB are higher than reetha, SDBS is close tothat, and SOS and AOT are lower than that; as a result we gotlittle positive deviation in MSR for last two surfactants. Inaddition to that it is noteworthy in the mixed surfactant systemswhen the synergism is there (more negative ), the micelle willbe more densely packed and solubilization may decrease; butat the same time the mixed micellar CMC also will be low. In
that case, at a particular concentration, since the number ofmicelles will be more, the solubilization also will enhance. Theamounts of positive or negative deviation will depend on thefactor which is predominant.
4. Conclusion
The results of this study can be summarized as follows:The solubilization efficiency of naphthalene by reetha in terms
of MSR is less than TX-100 and CTAB, close to SBDS, andhigher than AOT and SOS. The MSR values of all the mixedsystems are in between that of single surfactants and arenonlinearly changing with mole fraction of reetha; the negativechange in MSR than expected (∆MSR) is in the sequence of TX-100-reetha < CTAB-reetha < SDBS-reetha < AOT-reetha< SOS-reetha, which is the reverse order of the sequence thatof single surfactants for solubilization.. The interaction parameterfor mixed micellization () is negative for all the mixedsurfactant systems, indicating the synergistic behavior. Theaverage interaction parameter for mixed micellization, av, forthe mixtures of TX-100, CTAB, SDBS, AOT, and SOS withreetha is -0.560, -0.458, -0.511, -1.022, and -4.178,respectively, indicating the same order as of ∆MSR, except theTX-100 mixture. When the value of interaction parameter ismore negative, micelles are densely packed and solubilizationis less. From the application point of view, although the plantsurfactant is environmentally friendly due to its fast biodegrad-able nature, but in terms of solubilization efficiency, commonlyused synthetic surfactants like TX-100, SDBS, CTAB are betterthan reetha. So, use of plant-synthetic mixed surfactant systemsmay increase the solubility than only plant surfactant and reducethe environmental problem by replacing a certain fraction.
Acknowledgment. The financial support from UniversityGrants Commission (U.G.C), New Delhi, India, for this projectis gratefully acknowledged.
Supporting Information Available: Figure showing solu-bilization of naphthalene in the presence of TX-100 + reetha,CTAB + reetha, SDBS + reetha, AOT + reetha, and SOS +reetha. This material is available free of charge via the Internetat http://pubs.acs.org.
References and Notes
(1) Agency for Toxic Substances and Disease Registry. ComprehensiVeEnVironmental Response, Compensation, and Liability Act (CERCLA) Listof Priority Hazardous Substances; U.S. Department of Health and HumanServices: Washington, DC, 1999.
(2) Wilson, S. C.; Jones, K. C. EnViron. Pollut. 1993, 81, 229.(3) Haeseler, F.; Blanchet, D.; Druelle, V.; Vandecasteele, J. P. EnViron.
Sci. Technol. 1999, 33, 4379.(4) Kommalapati, R. R.; Valsaraj, K. T.; David, W. C.; Roy, D. Water
Res. 1997, 31, 2161.(5) Paria, S. AdV. Colloid Interface Sci. 2008, 138, 24.(6) Zhu, L.; Feng, S. Chemosphere. 2003, 53, 459.(7) Deshpande, S.; Shiau, B. J.; Wade, D.; Sabatini, D. A.; Harwell,
J. H. Water Res. 1999, 33, 351.(8) Edwards, D. A.; Luthy, R. G.; Liu, Z. EnViron. Sci. Technol. 1991,
25, 127.(9) Paria, S.; Yuet, P. K. Ind. Eng. Chem. Res. 2006, 45, 3352.
(10) Zhu, L. Z.; Chiou, C. T. J. EnViron. Sci. 2001, 13, 491.(11) Dar, A. A.; Rather, G. M.; Das, A. R. J. Phys. Chem. B 2007, 111,
3122.(12) Mohamed, A.; Mahfoodh, A. M. Colloids Surf., A 2006, 287, 44.(13) Zhou, W.; Zhu, L. J. Hazard. Mater. 2004, 109, 213.(14) Liu, Z.; Jacobson, A. M.; Luthy, R. G. Appl. EnViron. Microbiol.
1995, 61, 145.(15) De Oude, N. T. The Handbook of EnVironmental Chemistry Part
F: Anthropogenic Compounds; Springer-Verlag: Heidelberg, FR Germany,1992; Vol. 3.
Figure 4. Comparison of and ∆MSR vs mole fraction of reetha for(a) SDBS, CTAB and (b) SOS, AOT, TX-100.
480 J. Phys. Chem. B, Vol. 113, No. 2, 2009 Rao and Paria

(16) Kommalapati, R. R.; Valsaraj, K. T.; Constant, W. D.; Roy, D.Water Res. 1997, 31, 2161.
(17) Row, L. R.; Rukmini, C. Indian J. Chem. 1966, 4, 36.(18) Balakrishnan, S.; Varughese, S.; Deshpande, A. P. Tenside,
Surfactants, Deterg. 2006, 43, 262.(19) Kommalapati, R. R.; Roy, D. J. EnViron. Sci. Health, Part A 1997,
32, 835.(20) Kommalapati, R. R.; Roy, D. J. EnViron. Sci. Health, Part A 1996,
31, 1951.(21) Guha, S.; Jaffe, P.; Peters, C. EnViron. Sci. Technol. 1998, 32, 930.(22) Yuan, S.; Wei, S.; Chang, B. Chemosphere. 2000, 41, 1463.(23) Rosen, M. J. Surfactants and Interfacial Phenomena; Wiley: New
York, 2004.(24) Huang, H. C.; Liao, S. C.; Chang, F. R.; Kuo, Y. H.; Wu, Y. C. J.
Agric. Food Chem. 2003, 51, 4916.(25) Tokiwa, F. J. Phys. Chem. 1968, 72, 1214.(26) Tedros, T. F. Applied Surfactants; Wiley-VCH: Weinheim, 2005.(27) Tummino, P. J.; Gafni, A. Biophys. J. 1993, 64, 1580.(28) Saroja, G.; Ramachandram, B.; Saha, S.; Samanta, A. J. Phys.
Chem. B 1999, 103, 2906.(29) Cheng, D. C. H.; Gulari, E. J. Colloid Interface Sci. 1982, 90, 410.
(30) Umlong, I. M.; Ismail, K. J. Colloid Interface Sci. 2005, 291, 529.(31) Tarter, H. V.; Llong, A. J. Phys. Chem. 1955, 59, 1185.(32) Treiner, C.; Nortz, M.; Vaution, C.; Puisieux, F. J. Colloid Interface
Sci. 1998, 125, 261.(33) Zhou, W.; Zhu, L. J. Hazard. Mater. 2004, 109, 213.(34) Edwards, D. A.; Adeel, Z.; Luthy, R. G. EnViron. Sci. Technol.
1994, 28, 1550.(35) Tokuota, Y.; Uchiyama, H.; Abe, M.; Christian, S. D. J. Phys.
Chem. 1994, 98, 6167.(36) Clint, J. H. J. Chem. Soc., Faraday Trans.1 1975, 71, 1327.(37) Rubingh, D. N. In Solution Chemistry of Surfactants; Mittal, K. L.,
Ed.; Plenum Press: New York, 1979; Vol. 1, p 337.(38) Zhou, W.; Zhu, L. Colloids Surf., A 2005, 225, 145.(39) Venable, R. L.; Nauman, R. V. J. Phys. Chem. 1964, 68, 3498.(40) Abe, A.; Imae, T.; Ikeda, S. Colloid Polym. Sci. 1987, 265, 637.(41) D. Roy, D.; Kongaraa, S.; Valsarajb, K. T. J. Hazard. Mater. 1995,
42, 247.(42) Schott, H. J. Phys. Chem. 1967, 71, 3611.(43) Zhu, L.; Feng, S. Chemosphere 2003, 53, 459.
JP8071298
Solubilization of Naphthalene J. Phys. Chem. B, Vol. 113, No. 2, 2009 481