solutions - aflglobal.com · test objective the objective of the ... by inputting the refractive...
TRANSCRIPT

solutionsfor the real world
Design Qualification Testing Optical Ground Wire Fiber Optic Cable
IEEE 1138

Page 1 of 68 K-419274-RC-0001-R00
To: AFL 150 Ridgeview Circle Duncan, SC 29334 United States
KINECTRICS NORTH AMERICA INC. TEST REPORT FOR AFL OPGW CABLE
(Ref. 11.5 mm OPGW, 24 fibers)
Kinectrics North America Inc. Report: K-419274-RC-0001-R00
January 23, 2012
C. Dimnik Transmission and Distribution Technologies Business
A series of nine (9) tests were performed for AFL (AFL) on an 11.5 mm diameter, 24 fiber optical ground wire (OPGW). The cable was manufactured by AFL and is designated DNO-150268. The OPGW was received in good condition on May 25, 2011. All tests were performed in accordance to IEEE Std. 1138-2009 and IEC 60794-1-2. The OPGW cable successfully met all the requirements in these specifications. This document is a compilation of all the individual test reports. The reports are assembled in the following order. TEST STANDARD TEST TEST DATE (IEEE Std. 1138-2009) 1. Stress-Strain August 19, 2011 Paragraphs 6.4.1.2 and 6.4.1.4 & Ultimate Tensile Strength Test 2. Strain Margin Test August 26, 2011 Paragraph 6.4.1.3 3. DC Resistance Test August 15, 2011 Paragraph 6.4.1.5 4. Sheave Test August 23, 2011 Paragraph 6.4.2.1 5. Bend Test August 23, 2011 Paragraph 6.4.2.3 6. Twist Test August 29, 2011 Paragraph 6.4.2.4 7. Aeolian Vibration Test Aug. 18 – Sept. 14 Paragraph 6.4.3.1 8. Temperature Cycle Test September 1 – 6, 2011 Paragraph 6.4.3.7 9. Salt Spray Corrosion Test Nov. 8 – Dec. 22, 2011 Paragraph 6.4.3.8 Each individual test report is self-contained with dedicated figures. There are four (4) appendices located at the back of this document. Copies of Kinectrics ISO 9001 and 17025 Accreditation Certificates are included in Appendix D.
Tests 1 to 8 were performed by Kinectrics North America Inc. personnel at 800 Kipling Avenue, Unit 2, Toronto, Ontario, M8Z 5G5, Canada. Test 9 Salt Spray Corrosion Test was performed by Acuren personnel at 2421 Drew Road, Mississauga, Ontario, L5S 1A1, Canada. Kinectrics North America Inc. has prepared this report in accordance with, and subject to, the terms and conditions of AFL Purchase Order 213397 dated March 1, 2011.
PRIVATE INFORMATION Contents of this report shall not be disclosed without authority of the client.
Kinectrics North America Inc., 800 Kipling Avenue, Unit 2, Toronto, Ontario M8Z 5G5.

Page 2 of 68 K-419274-RC-0001-R00
ACKNOWLEDGEMENTS The assistance of Mr. C. Maurice for the Short Circuit Test is greatly appreciated.
Prepared by: Corrine Dimnik, Engineer Transmission and Distribution Technologies Business
Michael J. Kastelein, Technologist
Transmission and Distribution Technologies Business
Michael Colbert, Technologist Transmission and Distribution Technologies Business
Peter Adams, Technologist Transmission and Distribution Technologies Business
Greg Brown, Technologist
Transmission and Distribution Technologies Business Reviewed by:
Dmitry Ladin, Engineer/Scientist Transmission and Distribution Technologies Business
Approved by: Craig J. Pon, Manager – Lines Asset Management Transmission and Distribution Technologies Business
CD:MJK:MC:PA:GB:DL:CJP
DISCLAIMER Kinectrics North America, Inc (KNAI) has taken reasonable steps to ensure that all work performed meets industry standards as set out in Kinectrics Quality Manual, and that, for the intended purpose of this report, is reasonably free of errors, inaccuracies or omissions. KNAI DOES NOT MAKE ANY WARRANTY OR REPRESENTATION WHATSOEVER, EXPRESS OR IMPLIED, WITH RESPECT TO THE MERCHANTABILITY OR FITNESS FOR ANY PARTICULAR PURPOSE OF ANY INFORMATION CONTAINED IN THIS REPORT OR THE RESPECTIVE WORKS OR SERVICES SUPPLIED OR PERFORMED BY KNAI. KNAI does not accept any liability for any damages, either directly, consequentially or otherwise resulting from the use of this report. Kinectrics North America Inc., 2012.

Test No. 1 – Page 3 of 68 K-419274-RC-0001-R00
KINECTRICS NORTH AMERICA INC. TEST REPORT FOR AFL OPGW CABLE
(Ref. 11.5 mm OPGW, 24 fibers) Test Name: STRESS-STRAIN & ULTIMATE TENSILE STRENGTH TEST Test Date: August 19, 2011 Test Laboratory: Kinectrics North America Inc. 800 Kipling Avenue, Unit 2 Toronto, Ontario, M8Z 5G5 CANADA Cable Manufacturer: AFL Cable Designation: DNO-150268 Accessories: AFL Dead-end Part No.: ODEC450/459G08 Kinectrics Staff: Mr. Craig Pon
Mr. Peter Adams Mr. Greg Brown Ms. Corrine Dimnik
Witnesses: None TEST OBJECTIVE The objective of the Stress-Strain Test is to produce the stress-strain curves and final Modulus of Elasticity (MOE) for the OPGW cable. Monitoring the optical performance of the OPGW cable is not required during this test unless specified by the cable purchaser. The objective of the Ultimate Tensile Strength Test is to verify that the actual (ultimate) tensile strength of the OPGW cable meets or exceeds the Rated Tensile Strength (RTS) of the OPGW cable specified by the supplier. TEST STANDARD The tests were performed in accordance with IEEE Std. 1138-2009, Paragraphs 6.4.1.2 and 6.4.1.4, and IEC 60794-1-2 Method E1.

Test No. 1 – Page 4 of 68 K-419274-RC-0001-R00
TEST SET-UP The set-up for the Stress-Strain/Fiber-Strain and Ultimate Tensile Strength Tests is shown in Figure 1. Test Apparatus An OPGW sample was installed in a hydraulically activated horizontal test machine. The length of the cable between the load points of the dead-end assemblies was 13.53 m. A displacement transducer was fixed to the cable to measure cable elongation over an 8.0 m gauge length. The OPGW sample was terminated beyond both dead-end assemblies such that the optical fibers could not move relative to the OPGW. The cable and fiber terminations and the method to measure optical attenuation are described in Appendix B. The test was carried out in a temperature-controlled laboratory at 22ºC ± 3ºC. Optical Network For the attenuation measurement, twenty (20) fibers were spliced together to form one continuous loop of 270.6 m (20 fibers x 13.53 m). The gauge length for attenuation measurements was taken to be the length under tension, from dead-end to dead-end. Fiber elongation was measured using a millimetre resolution OTDR that measures the time of flight from the laser source to the receiver. By inputting the refractive index, the instrument converts the change in time of flight to change in length. For the fiber elongation measurement, four (4) fibers were spliced together to form 110.3 m (4 fibers x (18.15 m + 9.42 m)) of continuous fiber. The gauge length for fiber elongation was taken to be the length of fiber from the start of each set of loops, plus half the length of each set of three loops. Monitoring the optical performance of the OPGW cable is not required during this test. Attenuation and fiber elongation measurements were made for information purposes. Instrumentation and Data Acquisition The cable elongation, the analog output signals from the optical power meters, and the cable tension, as measured by the load cell, were monitored continuously using a digital data logging system. The sampling rate during loading was every one (1) second, and during holds, every ten (10) seconds. Fiber elongation measurements using the OTDR were taken manually at regular load intervals. The measuring instruments used in this test are listed in Appendix C.

Test No. 1 – Page 5 of 68 K-419274-RC-0001-R00
TEST PROCEDURE The cable sample was subjected to the loading schedule outlined in IEEE Std. 1138-2009, Paragraph 6.4.1.2. The cable was tensioned according to the loading schedule in Table 1. The loads were applied at a rate of 1,123 kgf/minute. Optical attenuation, cable tension and cable elongation were recorded throughout the test.
Table 1: Loading Schedule for Stress-Strain Test
RTS 7,489 kgf
Step % RTS kgf lbfHold
(minutes)
pre 2% 150 3301 30% 2,247 4,953 302 2% 150 330 23 50% 3,745 8,255 604 2% 150 330 25 70% 5,242 11,557 606 2% 150 330 27 85% 6,366 14,034 608 2% 150 330
The load was then reduced and the cable strain transducer was removed. This constituted the end of the Stress-Strain Test. The load was then reapplied at a rate of 1,123 kgf/minute until the cable failed, to complete the Ultimate Tensile Strength Test. Optical attenuation and cable tension were recorded. TEST RESULTS The data has been corrected because the elongation measurement was taken to be zero at the preload. Using a straight-line regression of the stress-strain data while loading up to 30% RTS, it was calculated that the corrected strain at preload was 0.015% for the cable. After adding these corrections, the data can be extrapolated back to the Y-axis to zero. The corrected data is the actual cable’s behaviour because the cable will have zero elongation only when it is under zero tension. Figure 2 shows load (cable tension) plotted against all cable strain data taken. Figure 3 also shows load (cable tension) plotted against cable strain (%) and fiber strain (%). In this case, only those points that contribute to the stress-strain curve are plotted. For purposes of calculating fiber strain, the gauge length is taken to be 110.3 m. Figure 4 shows optical attenuation and load (cable tension) plotted against time. The maximum attenuation, during the stress-strain test, was 0.04 dB/test fiber km. Table 2 shows the fiber strain versus cable tension. The gray highlighted data are those points that contribute to the stress-strain curve.

Test No. 1 – Page 6 of 68 K-419274-RC-0001-R00
The cable tension reached 8,360 kgf or 111.6% of the cable RTS before failure.
Table 2: Fiber Strain vs. Cable Tension
Cable Tension
(kgf)
Fiber Length
(m)
Change In FiberLength
(m)
Fiber Strain % (m/m)
150 228.4748 0.000 0.000% 2,247 228.4753 0.001 0.000% 2,247 228.4739 0.000 -0.001% 150 228.4728 0.000 -0.002%
3,745 228.4743 0.000 0.000% 3,745 228.4737 0.000 -0.001% 150 228.4723 0.000 -0.002%
5,242 228.4788 0.004 0.004% 5,242 228.4768 0.002 0.002% 150 228.4726 0.000 0.000%
6,366 228.4837 0.009 0.008% 6,366 228.4804 0.006 0.005% 150 228.4746 0.000 0.000%
ACCEPTANCE CRITERIA As specified in IEEE Std. 1138-2009 Paragraph 6.4.1.2, unless otherwise specified by the cable purchaser, there are no acceptance criteria for the Stress-Strain Test. As specified in IEEE Std. 1138-2009 Paragraph 6.4.1.4, the breaking strength of the cable shall meet or exceed 100% of the RTS. In addition, outer layer strands must withstand a minimum of 75% of the cable RTS without breaking. As specified in IEC 60794-1-2 Method E1, the attenuation and/or fiber strain of the sample shall not exceed the values given in the relevant detail specification. As specified by AFL, the relevant detail specification shall be IEEE Std. 1138-2009. CONCLUSION The results for the Stress-Strain Test are presented for information purposes. The cable, as tested, met the requirements for the Ultimate Tensile Strength Test as specified in IEEE Std. 1138-2009 Paragraph 6.4.1.4. The cable, as tested, met the requirements for Tensile Performance as specified in IEC 60794-1-2 Method E1.

Figure 1: Set-up for Stress-Strain/Fiber-Strain Test
Cylinder MountFixed to Strong Floor
Hydraulic Cylinder
Load Cell
Deadend Clamp
Typical Optical Setup
Splice to cable fibres
Fusion Splice of Fibres
Loopback
Stationary EndFixed to Strong Floor
OPGW
Optical Splitter
Laser
ReferenceMeter
Test Meter
Data Aquisition System
Gauge length
MillimeterOTDT
DisplacementTransducer
Test N
o. 1 – Page 7 of 68
K
-419274-RC
-0001-R00

Stress-Strain/Fiber-Strain Test for AFL (Ref. 11.5 mm OPGW, 24 fibers)
0
500
1000
1500
2000
2500
3000
3500
4000
4500
5000
5500
6000
6500
7000
0.00% 0.10% 0.20% 0.30% 0.40% 0.50% 0.60% 0.70% 0.80% 0.90% 1.00%
Strain - mm/mm
Ten
sio
n -
kg
f
MOE = 127,363 MPa
Based on Cable Area of 75.51 mm2
Figure 2: Load (cable tension) vs. All Cable Strain Data
Test N
o. 1 – Page 8 of 68
K
-419274-RC
-0001-R00

Stress-Strain/Fiber-Strain Test for AFL (Ref. 11.5 mm OPGW, 24 fibers)
0.910%, 6,366 kgf
0.652%, 5,242 kgf
0.419%, 3,745 kgf
0.236%, 2,247 kgf
0.005%, 6,366 kgf
0.002%, 5,242 kgf
0.000%, 3,745 kgf
0.000%, 2,247 kgf
0
1000
2000
3000
4000
5000
6000
7000
0.00% 0.10% 0.20% 0.30% 0.40% 0.50% 0.60% 0.70% 0.80% 0.90% 1.00%
Strain - mm/mm
Ten
sio
n -
kg
f
Fibre Strain
Cable Strain
Figure 3: Load (cable tension) vs. Fiber Strain and
Cable Strain for Only Those Points That Contribute to the Stress-Strain Curve
Test N
o. 1 – Page 9 of 68
K
-419274-RC
-0001-R00

Stress-Strain/ Fiber-Strain Test for AFL (Ref. 11.5 mm OPGW, 24 fibers)
0
1000
2000
3000
4000
5000
6000
7000
8000
9000
10000
0:00 0:30 1:00 1:30 2:00 2:30 3:00 3:30 4:00 4:30
Elapsed Time - Hour : min.
Ten
sio
n -
kg
f
-0.50
-0.40
-0.30
-0.20
-0.10
0.00
0.10
0.20
0.30
0.40
0.50
Op
tica
l Att
enu
atio
n -
dB
/tes
t fi
ber
km
Optical Attenuation
Cable Tension
Breaking Load = 8,360 kgf (111.6% RTS)
Figure 4 : Load (cable tension) and Optical Attenuation vs. Time
Test N
o. 1 – Page 10 of 68
K
-419274-RC
-0001-R00

Test No. 2 – Page 11 of 68 K-419274-RC-0001-R00
KINECTRICS NORTH AMERICA INC. TEST REPORT FOR AFL OPGW CABLE
(Ref. 11.5 mm OPGW, 24 fibers) Test Name: STRAIN MARGIN TEST Test Date: August 26, 2011 Test Laboratory: Kinectrics North America Inc. 800 Kipling Avenue, Unit 2
Toronto, Ontario, M8Z 5G5 CANADA Cable Manufacturer: AFL Cable Designation: DNO-150268 Accessories: AFL Dead-end Part No.: ODEC450/459G08 Kinectrics Staff: Mr. Craig Pon
Mr. Mike Kastelein Mr. Peter Adams Ms. Corrine Dimnik
Witnesses: None TEST OBJECTIVE The objective of this test is to measure the fiber and cable strain and to verify the optical and mechanical characteristics of the OPGW cable under test without optical variation. TEST STANDARD The test was performed in accordance with IEEE Std. 1138-2009, Paragraph 6.4.1.3, and IEC 60794-1-2 Method E1.

Test No. 2 – Page 12 of 68 K-419274-RC-0001-R00
TEST SET-UP The set-up for the Strain Margin Test is shown in Figure 1. Test Apparatus An OPGW sample was installed in a hydraulically activated horizontal test machine. The length of the cable between the load points of the dead-end assembly was 13.81 m. A displacement transducer was fixed to the cable to measure cable elongation over an 8.0 m gauge length. The OPGW sample was terminated beyond both dead-end assemblies such that the optical fibers could not move relative to the OPGW. The cable and fiber terminations and the method to measure optical attenuation are described in Appendix B. The test was carried out in a temperature-controlled laboratory at 22ºC ± 3ºC. Optical Network For the attenuation measurement, twenty (20) fibers were spliced together to form one continuous loop of 276.2 m (20 fibers x 13.81 m). The gauge length for attenuation measurements was taken to be the length under tension, from dead-end to dead-end. Fiber elongation was measured using a millimetre resolution OTDR that measures the time of flight from the laser source to the receiver. By inputting the refractive index, the instrument converts the change in time of flight to change in length. For the fiber elongation measurement, four (4) fibers were spliced together to form 109.9 m (4 fibers x (18.05 m + 9.42 m)) of continuous fiber. The gauge length for fiber elongation was taken to be the length of fiber from the start of each set of loops, plus half the length of each set of three loops. Instrumentation and Data Acquisition The cable elongation, the analog output signals from the optical power meters and the cable tension as measured by the load cell were monitored and recorded every one (1) second using a digital data logging system. Fiber elongation measurements using the OTDR were taken automatically at regular load intervals. The measuring instruments used in this test are listed in Appendix C. TEST PROCEDURE The loading schedule described in the procedure below was used for this test. The cable was pre-tensioned to approximately 150 kgf or 2% of the cable RTS (7,489 kgf). At this point initial reference readings of the optical signals, cable elongation transducer and the OTDR were taken. The cable was then tensioned at a rate of 374 kgf/minute, up to 100% RTS. This load rate was based on achieving the RTS in 20 minutes. The load was then reduced and the cable strain transducer was removed. This constituted the end of the Strain Margin Test. The load was then increased, at a rate of 1,123 kgf/minute, until the cable failed. Optical attenuation and cable tension were recorded.

Test No. 2 – Page 13 of 68 K-419274-RC-0001-R00
TEST RESULTS The data has been corrected because the elongation measurement was taken to be zero at the preload. Using a straight-line regression of the stress-strain data while loading up to 30% RTS, it was calculated that the corrected strain at preload was 0.018% for the cable. After adding these corrections, the data can be extrapolated back to the Y-axis to zero. The corrected data is the actual cable’s behaviour because the cable will have zero elongation only when it is under zero tension. Figure 2 shows load (cable tension) plotted against cable strain (%) and fiber strain (%). The strain margin is defined as the cable load (or cable strain) at which the fibers have elongated. Loading of the cable showed that the fiber began to strain between 4,000 kgf and 5,000 kgf or between 53% and 67% of RTS. For purposes of calculating fiber strain, the gauge length is taken to be 109.9 m. Figure 3 shows optical attenuation and load (cable tension) plotted against time. The maximum increase in optical attenuation was 0.024 dB/test fiber km during the loading to 100%. The cable tension reached 8,459 kgf or 113.0% of the cable RTS before failing. ACCEPTANCE CRITERIA As specified in IEEE Std. 1138-2009, Paragraph 6.4.1.3, the cable shall show no permanent increase in optical attenuation greater than 0.20 dB/test fiber km from preload to the maximum rated design tension (MRDT) of the cable at 1550 nm ± 20 nm for single-mode fibers. As specified by AFL Specification DNO-150268, the Maximum Cable Design Tension is 4,435 kgf. As specified in IEC 60794-1-2 Method E1, the attenuation and/or fiber strain of the sample shall not exceed the values given in the relevant detail specification. As specified by AFL, the relevant detail specification shall be IEEE Std. 1138-2009. CONCLUSION
The cable, as tested, met the requirements for the Strain Margin Test as specified in IEEE Std. 1138-2009, Paragraph 6.4.1.3. The cable, as tested, met the requirements for Tensile Performance as specified in IEC 60794-1-2 Method E1.

Figure 1: Set-Up for Strain Margin Test
Test N
o. 2 – Page 14 of 68
K
-419274-RC
-0001-R00
Cylinder MountFixed to Strong Floor
Hydraulic Cylinder
Load Cell
Deadend Clamp
Typical Optical Setup
Splice to cable fibres
Fusion Splice of Fibres
Loopback
Stationary EndFixed to Strong Floor
OPGW
Optical Splitter
Laser
ReferenceMeter
Test Meter
Data Aquisition System
Gauge length
MillimeterOTDT
DisplacementTransducer

Strain Margin Test for AFL (Ref. 11.5 mm OPGW, 24 fibers)
0
1000
2000
3000
4000
5000
6000
7000
8000
0.00% 0.20% 0.40% 0.60% 0.80% 1.00% 1.20% 1.40%
Cable Strain - mm/mm
Ten
sio
n -
kg
f0.00% 0.02% 0.04% 0.06% 0.08% 0.10% 0.12% 0.14%
Fibre Strain - mm/mm
Fibre Strain
Cable Strain
Strain Margin Straight-Line Fit
Figure 2: % Cable Strain and % Fiber Strain vs Cable Tension
Test N
o. 2 – Page 15 of 68
K
-419274-RC
-0001-R00

Strain Margin Test for AFL (Ref. 11.5 mm OPGW, 24 fibers)
0
1000
2000
3000
4000
5000
6000
7000
8000
9000
10000
0:00 0:05 0:10 0:15 0:20 0:25 0:30 0:35 0:40 0:45 0:50
Elapsed Time - Hour : min.
Ten
sio
n -
kg
f
-1.00
-0.80
-0.60
-0.40
-0.20
0.00
0.20
0.40
0.60
0.80
1.00
Op
tica
l Att
enu
atio
n -
dB
/tes
t fi
ber
km
Optical Attenuation
Cable Tension
Breaking Load = 8,459 kgf (113.0% RTS)
Figure 3: Optical Attenuation and Cable Tension vs Time
Test N
o. 2 – Page 16 of 68
K
-419274-RC
-0001-R00

Test No. 3 – Page 17 of 68 K-419274-RC-0001-R00
KINECTRICS NORTH AMERICA INC. TEST REPORT FOR AFL OPGW CABLE
(Ref. 11.5 mm OPGW, 24 fibers) Test Name: VERIFICATION OF CABLE RESISTANCE Test Date: August 15, 2011 Test Laboratory: Kinectrics North America Inc. 800 Kipling Avenue, Unit 2
Toronto, Ontario, M8Z 5G5 CANADA
Cable Manufacturer: AFL Cable Designation: DNO-150268 Accessories: AFL Dead-end Part No.: ODEC450/459G08 and insulators Kinectrics Staff: Mr. Craig Pon Mr. Michael Kastelein Mr. Greg Brown Ms. Corrine Dimnik Witnesses: None TEST OBJECTIVE The objective of the Verification of Cable Resistance Test is to verify that the actual DC resistance of the OPGW cable does not exceed the dc resistance stated by the supplier. TEST STANDARD The test was performed in accordance with IEEE Std. 1138-2009 Paragraph 6.4.1.5.

Test No. 3 – Page 18 of 68 K-419274-RC-0001-R00
TEST SET-UP AND PROCEDURE The length of cable installed for Test 1 Stress-Strain and Ultimate Tensile Strength Test was used to complete this test. Copper equalizers were placed approximately 3 m apart. Current injection clamps were connected at each end of the cable. A calibrated current source of 10 amperes was passed through the cable, outboard of the equalizers. The potential drop between the equalizers was measured by a micro-ohmmeter and displayed directly as micro-ohms. This measurement was taken and recorded five (5) times at different locations between the 10 m gauge length. The DC resistance per meter for each reading was calculated by dividing the recorded resistance by the 10 m gauge length. To minimize error due to heating, the current injected through the cable was kept at a minimum. The temperature of the cable sample was monitored and recorded during measurement. The resolution of the measurement was 0.001 mΩ. The resistance values obtained were corrected to 20 °C with the following formula: R20 = Rm / [1+α(Tm-20)] where: Rm is the measured resistance. Tm is the temperature of the cable. α is the temperature coefficient of resistance of the cable. The temperature coefficient of resistance used for this cable was: α = 3.60 x 10⁻³ / C (from ASTM B193-87,”Standard Test Method for Resistivity of Electrical Conductor Materials”, Table 2, for 40% Conductivity). Optical Network Optical measurements are not required for this test. Instrumentation and Data Acquisition The measuring instruments and equipment used in this test are listed in Appendix C.

Test No. 3 – Page 19 of 68 K-419274-RC-0001-R00
TEST RESULTS The five (5) resistance readings are shown in Table 1. As specified by the manufacturer, the calculated DC resistance of the OPGW is 0.8284 Ohms/km at 20 oC.
Table 1: Resistance Readings Measured Across Test Points
Reading #
Measured Resistance
(mΩ/Gauge length)
Measured Resistance
(mΩ/m)
Temperature on Cable
°C
Calculated Resistance
at 20C (Ω/km)
1 2.4328 0.811 24.7 0.797
2 2.4332 0.811 24.7 0.797
3 2.4331 0.811 24.7 0.797
4 2.4333 0.811 24.7 0.797
5 2.4334 0.811 24.7 0.797
Average 2.4332 0.811 24.7 0.797
ACCEPTANCE CRITERIA As specified by IEEE Std. 1138-2009 Paragraph 6.4.1.5, the actual DC resistance of the OPGW cable shall not exceed the DC resistance stated by the manufacturer at the specified temperature. As specified by the manufacturer, the calculated DC resistance of the OPGW is 0.8284 Ohms/km at 20 oC. CONCLUSION The cable, as tested, met the requirements for Cable Resistance as specified in IEEE Std. 1138-2009 Paragraph 6.4.1.5 and Client requirements.

Test No. 4 – Page 20 of 68 K-419274-RC-0001-R00
KINECTRICS NORTH AMERICA INC. TEST REPORT FOR AFL OPGW CABLE
(Ref. 11.5 mm OPGW, 24 fibers) Test Name: SHEAVE TEST Test Date: August 23, 2011 Test Laboratory: Kinectrics North America Inc. 800 Kipling Avenue, Unit 2 Toronto, Ontario, M8Z 5G5 CANADA Cable Manufacturer: AFL Cable Designation: DNO-150268 Accessories: AFL Dead-end Part No.: ODEC450/459G08 Kinectrics Staff: Mr. Craig Pon
Mr. Peter Adams Mr. Greg Brown Ms. Corrine Dimnik
Witnesses: None TEST OBJECTIVE The objective of the Sheave Test is to determine the ability of the cable to withstand passing over a sheave a number of times without significant damage to the cable or significant increase in optical attenuation. TEST STANDARD The test was performed in accordance with IEEE Std. 1138-2009, Paragraph 6.4.2.1, and IEC 60794-1-2 Method E18 Procedure 3.

Test No. 4 – Page 21 of 68 K-419274-RC-0001-R00
TEST SET-UP The set-up for the Sheave Test is shown in Figure 1. Test Apparatus The length of cable between the dead-end load points was approximately 13.68 m. The target tension of the cable was 1,123 kgf or 15% ± 1% of the cable RTS (7,489 kgf). The inside diameter of the sheave was 460 mm. The total angle of the cable over the sheave was 30.0. The set-up allowed 2.5 m of cable to travel through the sheave at a speed of 0.157 m/sec. A load cell was installed at one end to measure the tension in the cable. The test was carried out in a temperature-controlled laboratory at 22ºC ± 3ºC. Optical Network All twenty-four (24) fibers were spliced together to form one continuous loop. This provided a total fiber length under test of 328.3 m (24 fibers x 13.68 m). The sample was terminated beyond both dead-end clamps such that the optical fibers could not move relative to the metallic parts of the cable. The cable and fiber terminations and the optical power measurement method are described in Appendix B. Instrumentation and Data Acquisition The load cell and the analog outputs of the optical power meters were monitored continuously and recorded every one (1) seconds during the test by a digital data logging system. The measuring instruments used in this test are listed in Appendix C. TEST PROCEDURE Before the first pull, the midpoint and both ends of a two (2) meter test length were located and marked. A total length of two and a half (2.5) meters was pulled 30 times forward and backward over the sheave (i.e. 15 times each way). A digital caliper was used to measure the horizontal and vertical cable diameters at the three (3) locations after applying load and after the 1st, and 15th cycle. The dissection and visual examination of the cable components within the two (2) meter test section were performed after the test. The outer cable strands were removed in the test section and the diameters of all components were measured. TEST RESULTS Optical attenuation, cable tension and accumulated test cycles are plotted against time and are shown in Figure 2. The maximum attenuation increase measured during the test was less than 0.10 dB/test fiber km. There was no permanent increase in optical attenuation measured after the test. The number of forward/backward cycles over the sheave can be seen as cyclic variations in the cable tension.
Test No. 4 – Page 22 of 68 K-419274-RC-0001-R00
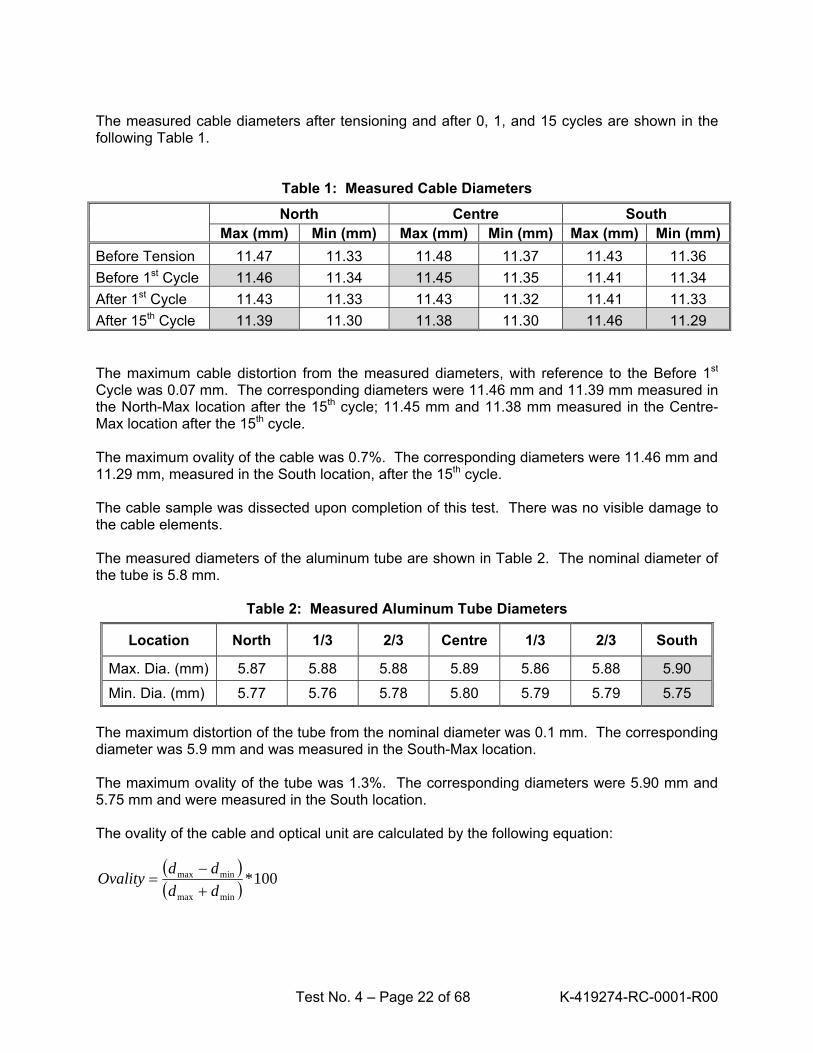
The measured cable diameters after tensioning and after 0, 1, and 15 cycles are shown in the following Table 1.
Table 1: Measured Cable Diameters
North Centre South
Max (mm) Min (mm) Max (mm) Min (mm) Max (mm) Min (mm)
Before Tension 11.47 11.33 11.48 11.37 11.43 11.36
Before 1st Cycle 11.46 11.34 11.45 11.35 11.41 11.34
After 1st Cycle 11.43 11.33 11.43 11.32 11.41 11.33
After 15th Cycle 11.39 11.30 11.38 11.30 11.46 11.29
The maximum cable distortion from the measured diameters, with reference to the Before 1st Cycle was 0.07 mm. The corresponding diameters were 11.46 mm and 11.39 mm measured in the North-Max location after the 15th cycle; 11.45 mm and 11.38 mm measured in the Centre-Max location after the 15th cycle. The maximum ovality of the cable was 0.7%. The corresponding diameters were 11.46 mm and 11.29 mm, measured in the South location, after the 15th cycle. The cable sample was dissected upon completion of this test. There was no visible damage to the cable elements. The measured diameters of the aluminum tube are shown in Table 2. The nominal diameter of the tube is 5.8 mm.
Table 2: Measured Aluminum Tube Diameters
Location North 1/3 2/3 Centre 1/3 2/3 South
Max. Dia. (mm) 5.87 5.88 5.88 5.89 5.86 5.88 5.90
Min. Dia. (mm) 5.77 5.76 5.78 5.80 5.79 5.79 5.75
The maximum distortion of the tube from the nominal diameter was 0.1 mm. The corresponding diameter was 5.9 mm and was measured in the South-Max location. The maximum ovality of the tube was 1.3%. The corresponding diameters were 5.90 mm and 5.75 mm and were measured in the South location. The ovality of the cable and optical unit are calculated by the following equation:
100*
minmax
minmax
dd
ddOvality

Test No. 4 – Page 23 of 68 K-419274-RC-0001-R00
ACCEPTANCE CRITERIA As specified in IEEE Std. 1138-2009 Paragraph 6.4.2.1, the following acceptance criteria must be met:
a) The ovality of the cable or optical units at the measured location shall not exceed 10%. b) There shall be no cracking or breaking of any component of the OPGW cable. This
assessment is made with the naked eye. c) There shall be no permanent increase in optical attenuation greater than 0.1 dB/test fiber
km at nominally 1550 nm ± 20 nm for single-mode fibers. As specified in IEC 60794-1-2 Method E18, under visual examination without magnification, there shall be no damage to the sheath and/or to the cable elements. If specified, any permanent increase in attenuation after the test shall not exceed the value specified in the detail specification. CONCLUSION The cable, as tested, met the requirements for the Sheave Test as specified in IEEE Std. 1138-2009, Paragraph 6.4.2.1. The cable, as tested, met the requirements for the Bending Under Tension (Sheave) Test as specified in IEC 60794-1-2 Method E18.

limit switches to reverse direction
chain drive
OPGW cable
fibre splice
laser
Referencemeter
Testmeter
optical splitter
support structure
data aquisition
Cable Angle, degrees
deadendassembly
adjustable
2.5 meters
approximately 18 meters
Cable Angle, degrees
motor driveand gearbox
hydraulic pistonto tension chain loop
load cell
deadendassembly &fibre termination
Figure 1: Set-up for Sheave Test
Test N
o. 4 – Page 24 of 68
K-419274-R
C-0001-R
00

Sheave Test for AFL (Ref. 11.5 mm OPGW, 24 fibers)
-1.00
-0.80
-0.60
-0.40
-0.20
0.00
0.20
0.40
0.60
0.80
1.00
00:00 04:00 08:00 12:00 16:00 20:00
Elapsed Time - min. : sec.
Op
tica
l Att
enu
atio
n -
dB
/tes
t fi
ber
km
0
150
300
450
600
750
900
1050
1200
1350
1500
Te
nsi
on
- k
gf
Optical Attenuation
Cable Tension
Cycle counts, 1 Step = 1 Cycle
Figure 2: Cable Tension, Cycle Counts and Optical Attenuation vs Time
Test N
o. 4 – Page 25 of 68
K-419274-R
C-0001-R
00

Test No. 5 – Page 26 of 68 K-419274-RC-0001-R00
KINECTRICS NORTH AMERICA INC. TEST REPORT FOR AFL OPGW CABLE
(Ref. 11.5 mm OPGW, 24 fibers) Test Name: CABLE BEND TEST Test Date: August 23, 2011 Test Laboratory: Kinectrics North America Inc. 800 Kipling Avenue, Unit 2 Toronto, Ontario, M8Z 5G5 CANADA Cable Manufacturer: AFL Cable Designation: DNO-150268 Accessories: Not Applicable Kinectrics Staff: Mr. Craig Pon
Mr. Peter Adams Mr. Greg Brown Ms. Corrine Dimnik
Witnesses: None TEST OBJECTIVE The objective of the Cable Bend Test is to verify the mechanical integrity and optical performance of the OPGW cable when subjected to the specified installation conditions. TEST STANDARD The test was performed in accordance with IEEE Std. 1138-2009, Paragraph 6.4.2.3, and IEC 60794-1-2 Method E11A.

Test No. 5 – Page 27 of 68 K-419274-RC-0001-R00
TEST SET-UP The typical set-up for the Cable Bend Test is shown in Figure 1. An untested cable section from the test sample prepared for the Sheave Test was used for the Cable Bend Test. Test Apparatus The cable was installed in an apparatus with a minimum bend radius, as specified by the manufacturer. Optical Network All twenty-four (24) fibres were spliced together to form one continuous loop. The fibre terminations and the method to measure optical attenuation are described in Appendix B. Instrumentation and Data Acquisition The optical power meters were monitored and recorded every second by a digital data logging system. The measuring instruments used in this test are listed in Appendix C. TEST PROCEDURE The cable sample was wrapped two (2) complete times in a close helix around a mandrel with a radius no larger than the minimum bend radius specified by the manufacturer. As specified by the manufacturer, the minimum bend radius under static load is 18 cm. Sufficient tension was applied to ensure that the sample was kept in close contact to the mandrel. The cable was held in this position for one (1) minute. A reference optical measurement was taken prior to bending. Another measurement was made after the cable was bent around the mandrel and held stationary. The difference between the two signals for the initial optical measurement provided the test result. The change in this difference during the test indicated any changes of attenuation in the test fibre. The signals were recorded using a digital data logging system. TEST RESULTS The optical attenuation plotted against time and shown in Figure 2. The maximum increase in attenuation measured during the test was less than 0.01 dB/fibre. There was no cracking or breaking of any component of the OPGW.

Test No. 5 – Page 28 of 68 K-419274-RC-0001-R00
ACCEPTANCE CRITERIA As specified in IEEE Std. 1138-2009 Paragraph 6.4.2.3, the following acceptance criteria must be met:
a) There shall be no cracking or breaking of any component of the OPGW cable. This assessment is made with the naked eye.
b) There shall be no permanent increase in optical attenuation greater than 0.05 dB/fibre at nominally 1550 nm ± 20 nm for single-mode fibres.
As specified in IEC 60794-1-2 Method E11, the acceptance criteria for the test shall be as stated in the detail specification. As specified by AFL, the relevant detail specification shall be IEEE Std. 1138-2009. CONCLUSION The cable, as tested, met the requirements for the Cable Bend Test as specified in IEEE Std. 1138-2009 Paragraph 6.4.2.3. The cable, as tested, met the requirements for the Bend Test as specified in IEC 60794-1-2 Method E11.

Test No. 5 – Page 29 of 68 K-419274-RC-0001-R00
Figure 1: Typical Set-up for Bend Test (Not Actual Sample)

Bend Test for AFL (Ref. 11.5 mm OPGW, 24 fibers)
-0.10
-0.08
-0.06
-0.04
-0.02
0.00
0.02
0.04
0.06
0.08
0.10
01:00 02:00 03:00
Elapsed Time - min. : sec.
Op
tic
al A
tten
ua
tio
n -
dB
/fib
er
Optical Attenuation
Figure 2: Optical Attenuation During Cable Bend Test
Test N
o. 5 – Page 30 of 68
K-419274-R
C-0001-R
00

Test No. 6 – Page 31 of 68 K-419274-RC-0001-R00
KINECTRICS NORTH AMERICA INC. TEST REPORT FOR AFL OPGW CABLE
(Ref. 11.5 mm OPGW, 24 fibers) Test Name: TWIST TEST Test Date: August 29, 2011 Test Laboratory: Kinectrics North America Inc. 800 Kipling Avenue, Unit 2 Toronto, Ontario, M8Z 5G5 CANADA Cable Manufacturer: AFL Cable Designation: DNO-150268 Accessories: AFL Dead-end Part No.: ODEC450/459G08 Kinectrics Staff: Mr. Craig Pon
Mr. Mike Kastelein Mr. Greg Brown Ms. Corrine Dimnik
Witnesses: None TEST OBJECTIVE The objective of the Twist Test is to verify the mechanical and optical performance of the fiber optic ground wire when subjected to mechanical twisting. TEST STANDARD The test was performed in accordance with IEEE Std. 1138-2009, Paragraph 6.4.2.4, and IEC 60794-1-2 Method E7.

Test No. 6 – Page 32 of 68 K-419274-RC-0001-R00
TEST SET-UP The set-up for the Twist Test is shown in Figure 1. Test Apparatus A 12.65 m length of OPGW was installed in a special facility constructed to allow one end of the cable to be fixed, and the other end to be manually rotated. Optical Network All twenty-four (24) fibers were spliced together to form one continuous loop. Instrumentation and Data Acquisition The GPIB outputs of the optical power meters were monitored and recorded every second by a digital data logging system. The measuring instruments used in this test are listed in Appendix C. TEST PROCEDURE The OPGW was tensioned to 1,498 kgf, or 20% of the cable RTS. The cable was manually rotated in the direction of the lay strands for 3.5 turns. This number of turns was calculated from the test cable length to produce a total twist in the cable of 90o per meter. The cable sample was then rotated back to the initial position. The cable was then rotated in the reverse direction to the lay of the strands, and then back to its initial position. This constitutes one torsion cycle. This cycle was repeated a second time. TEST RESULTS The optical attenuation recorded during the test is show in Figure 2. There was no permanent increase in optical attenuation measured after the test. ACCEPTANCE CRITERIA As specified in IEEE Std. 1138-2009 Paragraph 6.4.2.4, the following acceptance criteria must be met:
a) There shall be no cracking or breaking of any component of the OPGW cable. This assessment is made with the naked eye.
b) There shall be no permanent increase in optical attenuation greater than 0.10 dB/test fiber km at nominally 1550 nm ± 20 nm for single-mode fibers.
As specified in IEC 60794-1-2 Method E7, the acceptance criteria for the sample under test shall be as stated in the detail specification. As specified by AFL, the relevant detail specification shall be IEEE Std. 1138-2009.

Test No. 6 – Page 33 of 68 K-419274-RC-0001-R00
CONCLUSION The cable, as tested, met the requirements for the Twist Test as specified in IEEE Std. 1138-2009, Paragraph 6.4.2.4.
The cable, as tested, met the requirements for the Torsion Test as specified in IEC 60794-1-2 Method E7.

Test No. 6 – Page 34 of 68 K-419274-RC-0001-R00
Figure 1 Typical Set-Up of Torsion Test – End Rotated Manually (Not Actual Sample)

Twist Test for AFL (Ref. 11.5 mm OPGW, 24 fibers)
-1.00
-0.80
-0.60
-0.40
-0.20
0.00
0.20
0.40
0.60
0.80
1.00
00:00 05:00 10:00 15:00
Elapsed Time - min. : sec.
Op
tica
l Att
en
ua
tio
n -
dB
/te
st f
ibre
km
Optical Attenuation
Figure 2: Optical Attenuation vs Time
Test N
o. 6 – Page 35 of 68
K
-419274-RC
-0001-R00

Test No. 7 – Page 36 of 68 K-419274-RC-0001-R00
KINECTRICS NORTH AMERICA INC. TEST REPORT FOR AFL OPGW CABLE
(Ref. 11.5 mm OPGW, 24 fibers) Test Name: AEOLIAN VIBRATION TEST Test Date: August 18 – September 14, 2011 Test Laboratory: Kinectrics North America Inc. 800 Kipling Avenue, Unit 2 Toronto, Ontario, M8Z 5G5 CANADA
Cable Manufacturer: AFL Cable Designation: DNO-150268 Accessories: AFL Dead-end Part No.: ODEC450/459G08 AFL Suspension Clamp Part No.: SUME450/475 Kinectrics Staff: Mr. Craig Pon
Mr. Mike Kastelein Mr. Peter Adams Ms. Corrine Dimnik
Witnesses: None TEST OBJECTIVE The objective of the Aeolian Vibration Test is to assess the fatigue performance of the OPGW and the optical characteristics of the fibers under typical aeolian vibrations. TEST STANDARD The test was performed in accordance with IEEE 1138-2009, Paragraph 6.4.3.1, and IEC 60794-1-2 Method E19.

Test No. 7 – Page 37 of 68 K-419274-RC-0001-R00
TEST SETUP The set-up for the Aeolian Vibration Test is shown in Figure 1. The test was performed on the span designated KB019-Fence Span. Test Apparatus The OPGW was contained between two intermediate abutments. The active span cable length was 20.25 m and the passive span cable length was 10.02 m for a total cable length of 30.27 m between the loading points. Fixed end abutments were used to load and maintain tension in the fiber optic cable. The initial target tension of 1,872 kgf is 25% of the cable's RTS (7,489 kgf). This was applied using a cantilever weight arm on one of the end abutments. The dead-end assemblies were installed between the intermediate abutments. The suspension assembly was supported at a height such that the static sag angle of the cable to horizontal was 1.81 degrees in the active span and 3.38 degrees in the passive span. The free loop antinode amplitude of the cable was measured at the second free loop from the suspension assembly towards the shaker. An electronically controlled shaker was used to excite the cable in the vertical plane. The shaker armature was securely fastened to the cable so that it was perpendicular to the cable in the vertical plane. The shaker was located in the span to allow a minimum of six vibration loops between the suspension assembly and the shaker. The test was carried out in a temperature-controlled laboratory at 22ºC ± 3ºC. Optical Network All twenty-four (24) fibers were spliced to make a total fiber length under test of 726.5 m (24 fibers x 30.27 m). The test sample was terminated beyond both dead-ends such that the optical fibers could not move relative to the OPGW. The cable and fiber terminations and the optical power measurement method are described in Appendix B. Instrumentation and Data Acquisition Optical power meters were used to measure the optical attenuation in the test fibers. A laser micrometer and V-Scope were used to measure the free loop antinode amplitude. A load cell was used to measure the cable tension. A hand-held digital protractor was used to measure the exit angle of the cable from the suspension clamp. A thermocouple was used to measure the air temperature. The GPIB output of the optical power meters, peak-to-peak free loop amplitude, vibration frequency, number of cycles, cable tension and air temperature were recorded every five (5) minutes by a digital data logging system. The measuring instruments used in this test are listed in Appendix C.
Test No. 7 – Page 38 of 68 K-419274-RC-0001-R00
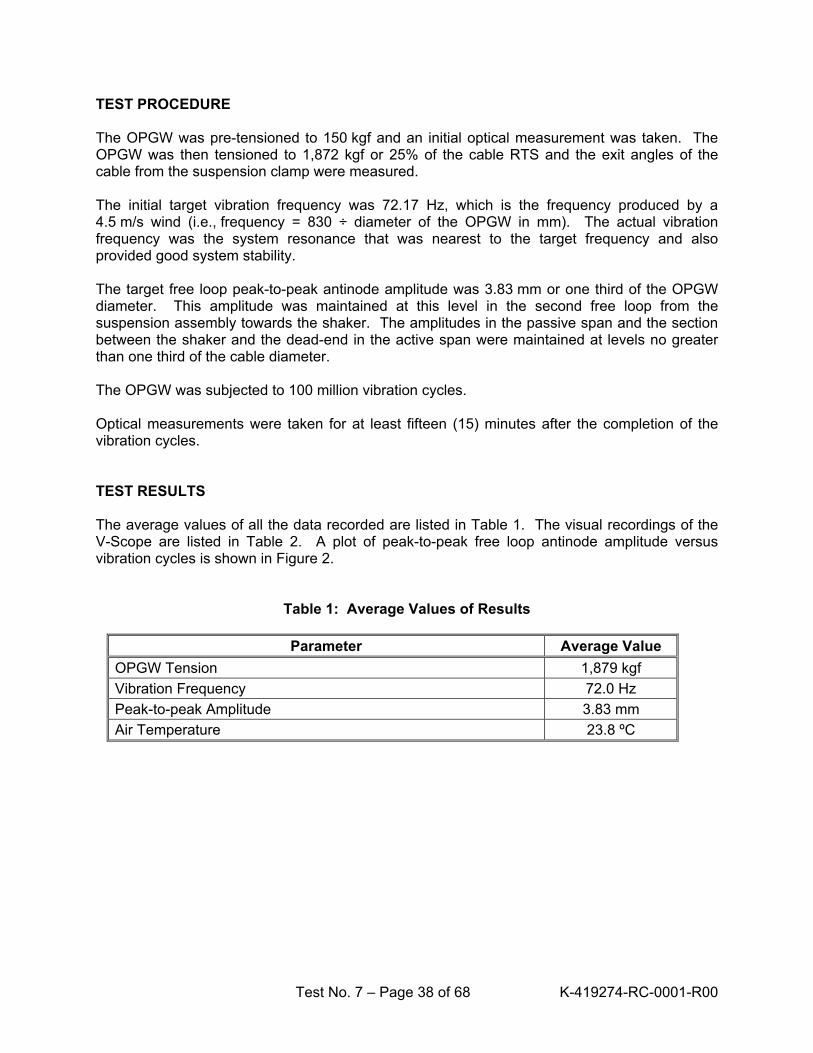
TEST PROCEDURE The OPGW was pre-tensioned to 150 kgf and an initial optical measurement was taken. The OPGW was then tensioned to 1,872 kgf or 25% of the cable RTS and the exit angles of the cable from the suspension clamp were measured. The initial target vibration frequency was 72.17 Hz, which is the frequency produced by a 4.5 m/s wind (i.e., frequency = 830 ÷ diameter of the OPGW in mm). The actual vibration frequency was the system resonance that was nearest to the target frequency and also provided good system stability. The target free loop peak-to-peak antinode amplitude was 3.83 mm or one third of the OPGW diameter. This amplitude was maintained at this level in the second free loop from the suspension assembly towards the shaker. The amplitudes in the passive span and the section between the shaker and the dead-end in the active span were maintained at levels no greater than one third of the cable diameter. The OPGW was subjected to 100 million vibration cycles. Optical measurements were taken for at least fifteen (15) minutes after the completion of the vibration cycles. TEST RESULTS The average values of all the data recorded are listed in Table 1. The visual recordings of the V-Scope are listed in Table 2. A plot of peak-to-peak free loop antinode amplitude versus vibration cycles is shown in Figure 2.
Table 1: Average Values of Results
Parameter Average Value
OPGW Tension 1,879 kgf
Vibration Frequency 72.0 Hz
Peak-to-peak Amplitude 3.83 mm
Air Temperature 23.8 ºC

Test No. 7 – Page 39 of 68 K-419274-RC-0001-R00
Table 2: Visual Recordings of V-Scope
Date Time Number of
Cycles
V-Scope Measured
(in p-p)
V-Scope Calculated (mm p-p)
August 18, 2011 14:01 586 k 0.15 3.81
August 18, 2011 16:23 1,103 k 0.16 4.06
August 19, 2011 6:35 4,180 k 0.15 3.81
August 22, 2011 13:55 11,491 k 0.15 3.81
August 23, 2011 14:40 16,896 k 0.15 3.81
August 24, 2011 7:26 20,727 k 0.15 3.81
August 26, 2011 7:46 31,727 k 0.14 3.56
August 29, 2011 6:20 43,420 k 0.15 3.81
August 31, 2011 11:32 45,304 k 0.16 4.06
September 6, 2011 7:40 71,918 k 0.16 4.06
September 7, 2011 6:10 75,100 k 0.15 3.81
September 8, 2011 7:07 79,385 k 0.15 3.81
September 9, 2011 7:21 85,090 k 0.15 3.81
September 13, 2011 7:14 93,201 k 0.16 4.06
September 14, 2011 7:15 98,020 k 0.16 4.06 Optical A plot of optical attenuation amplitude versus vibration cycles is shown in Figure 2. The maximum temporary attenuation increase measured during the test was 0.06 dB/test fiber km. There was no permanent attenuation measured at the end of the test (after the fifteen minute hold). Dissection After completion of 100 million cycles, the cable was dissected and visually examined. Active Dead-end - There were no visible signs of breaks, cracks, failure or discoloration of
any components of the OPGW. There were signs of light-to-medium wear/fretting on aluminum tube.
Passive Dead-end - There were no visible signs of breaks, cracks, failure or discoloration of
any components of the OPGW. There were signs of light wear/fretting on aluminum tube.
Suspension - There were no visible signs of breaks, cracks, failure or discoloration of
any components of the OPGW. There were signs of light-to-medium wear/fretting on aluminum tube.

Test No. 7 – Page 40 of 68 K-419274-RC-0001-R00
ACCEPTANCE CRITERIA As specified in IEEE Std. 1138-2009, Paragraph 6.4.3.1, the following acceptance criteria must be met:
a) There shall be no cracking or breaking of any component of the OPGW cable or the supporting hardware. This assessment is made with the naked eye.
b) There shall be no temporary or permanent increase in optical attenuation greater than 0.2 dB/test fiber km at nominally 1550 nm ± 20 nm for single-mode fibers.
As specified in IEC 60794-1-2 Method E19, any sign of temporary or permanent damage to the cable or any of the component parts, or attenuation change, if required, greater than the value specified in the detail specification shall be a failure. CONCLUSION The cable, as tested, met the requirements for the Aeolian Vibration Test as specified in IEEE Std. 1138-2009, Paragraph 6.4.3.1. The cable, as tested, met the requirements for the Aeolian Vibration Test as specified in IEC 60794-1-2 Method E19.

End AbutmentIntermediate Abutment
Intermediate Abutment
Shaker
Active SpanPassive Span
Splice Tray
Deadend Assembly
Suspension Assembly
Deadend Assembly
Laser
optical splitter
DisplacementTransducer
(servo controlled)
(constant tension controlled)
ReferenceMeter
TestMeter
End Abutment(fixed end)
Load Cell
Data Aquisition System
Splice Tray
Linear BearingHydraulicRam swivel cantelever
weight arm
Passive Sag Angle Active Sag Angle
Figure 1: Set-Up for Aeolian Vibration Test
Test N
o. 7 – Page 41 of 68
K-419274-R
C-0001-R
00

Aeolian Test for AFL (Ref. 11.5 mm OPGW, 24 fibers)
-1.00
-0.80
-0.60
-0.40
-0.20
0.00
0.20
0.40
0.60
0.80
1.00
0 10 20 30 40 50 60 70 80 90 100
Vibration Cycles - million
Op
tica
l Att
enu
atio
n -
dB
/tes
t fi
bre
km
0.00
0.50
1.00
1.50
2.00
2.50
3.00
3.50
4.00
4.50
5.00
An
tin
od
e A
mp
litu
de
- m
m P
k-P
k
Optical Attenuation
Antinode Amplitude (for information only)
Figure 2: Aeolian Vibration Test Results (Optical Attenuation versus Vibration Cycles)
Test N
o. 7 – Page 42 of 68
K-419274-R
C-0001-R
00

Test No. 8 – Page 43 of 68 K-419274-RC-0001-R00
KINECTRICS NORTH AMERICA INC. TEST REPORT FOR AFL OPGW CABLE
(Ref. 11.5 mm OPGW, 24 fibers) Test Name: TEMPERATURE CYCLING TEST Test Date: September 1 – 6, 2011 Test Laboratory: Kinectrics North America Inc. 800 Kipling Avenue, Unit 2 Toronto, Ontario, M8Z 5G5 CANADA Cable Manufacturer: AFL Cable Designation: DNO-150268 Accessories: Not applicable Kinectrics Staff: Mr. Craig Pon Mr. Mike Kastelein Mr. Greg Brown Ms. Corrine Dimnik Witnesses: None TEST OBJECTIVE The objective of this test was to verify the good performance of the fiber when the cable is subjected to extreme thermal cycles. TEST STANDARD The test was performed in accordance with IEEE Std. 1138-2009, Paragraph 6.4.3.7 and IEC 60794-1-2 Method F1.

Test No. 8 – Page 44 of 68 K-419274-RC-0001-R00
TEST SET-UP Test Apparatus The reel with approximately 505 m of OPGW cable was placed in a 5 m x 6 m x 4 m environmental chamber. Three (3) thermocouples were placed in the environmental chamber to measure the temperature. Two were placed on separate 25 cm cable samples and located on either side of the cable reel. The third was located under the first layer on the cable reel. Optical Network All twenty-four (24) fibers were spliced to form one continuous loop. The total test fiber length under test was approximately 12.1 km. The method for measuring optical attenuation is described in Appendix B. Instrumentation and Data Acquisition The measuring instruments used in this test are listed in Appendix C. TEST PROCEDURE The cable was subjected to two (2) thermal cycles. A thermal cycle was based on the chamber temperature starting at 22ºC ± 3 ºC, lowering to -40ºC and holding for a minimum of 16 hours. The chamber temperature was then increased to 85ºC and held for a minimum of 16 hours. To complete the cycle, the chamber temperature was returned to 22ºC ± 3 ºC. All temperature transitions were conducted at a rate of approximately 20ºC/hour. The chamber temperature is based on the average of the two (2) thermocouples on the 25 cm cable samples, located on either side of the cable reel. The cable reel temperature and optical data were recorded every 5 minutes throughout the test. TEST RESULTS Optical attenuation and chamber temperature vs. time are shown in Figure 1. The variation in optical attenuation due to temperature was no greater than 0.01 dB/test fiber km.

Test No. 8 – Page 45 of 68 K-419274-RC-0001-R00
ACCEPTANCE CRITERIA As specified in IEEE Std. 1138-2009 Paragraph 6.4.3.7, the maximum allowable permanent or temporary increase in optical attenuation is 0.2 dB/test fiber km at 1550 nm ± 20 nm for single-mode fibers. As specified in IEC 60794-1-2 Method F1, the acceptance criteria for the test shall be as stated in the detail specification. As specified by AFL, the relevant detail specification shall be IEEE Std. 1138-2009. CONCLUSION The cable, as tested, met the requirements for the Temperature Cycling Test as specified in IEEE Std. 1138-2009, Paragraph 6.4.3.7. The cable, as tested, met the requirements for the Temperature Cycling Test as specified in IEC 60794-1-2 Method F1.

Temperature Cycling Test for AFL (Ref. 11.5 mm OPGW, 24 fibers)
-0.20
-0.15
-0.10
-0.05
0.00
0.05
0.10
0.15
0.20
0 10 20 30 40 50 60 70 80 90 100 110 120 130
Time - hours
Op
tica
l Att
en
uat
ion
- d
B/k
m
-60
-40
-20
0
20
40
60
80
100
Tem
pe
ratu
re -
°C
Optical Attenuation
Temperature
Figure 1: Temperature and Optical Attenuation vs. Time
Test N
o. 8 – Page 46 of 68
K
-419274-RC
-0001-R00

Test No. 9 – Page 47 of 68 K-419274-RC-0001-R00
KINECTRICS NORTH AMERICA INC. TEST REPORT FOR AFL OPGW CABLE
(Ref. 11.5 mm OPGW, 24 fibers) Test Name: SALT SPRAY CORROSION TEST Test Date: November 8 – December 20, 2011 (Salt Spray) Test Date: December 20 – 22, 2011 (Visual Inspection) Test Laboratory: Acuren (Salt Spray) 2421 Drew Road Mississauga, Ontario, L5S 1A1 CANADA Test Laboratory: Kinectrics North America Inc. (Visual Inspection) 800 Kipling Avenue, Unit 2 Toronto, Ontario, M8Z 5G5 CANADA Cable Manufacturer: AFL Cable Designation: DNO-150268 Accessories: Not Applicable Kinectrics Staff: Mr. Craig Pon Mr. Michael Colbert Ms. Corrine Dimnik Witnesses: None TEST OBJECTIVE The objective of this test was to determine the effects of a controlled salt-laden atmosphere on the OPGW sample.

Test No. 9 – Page 48 of 68 K-419274-RC-0001-R00
TEST STANDARD The test was performed in accordance with IEEE Std. 1138-2009 Paragraph 6.4.3.8 and ASTM B117. TEST SET-UP The salt spray chamber designed to meet ASTM B117 was used to perform the test. The chamber has a salt-solution reservoir that is capable of maintaining an adequate solution. There is equipment to atomize the salt-solution including suitable nozzles and compressed air to provide a uniform spray within the chamber. The temperature of the chamber can also be controlled. Optical Network Optical measurements were not required for this test. TEST PROCEDURE The fog chamber was programmed to provide a finely divided, wet dense fog while the air supply to the atomizer was maintained at a relative humidity of 95% to 98%. The chamber air temperature was maintained at 35 C ± 2 C. The salt solution was 5% concentration and was prepared by dissolving by weight, 5 ± 1 parts of de-mineralized salt in 95 parts of de-ionized water. The quantity of collected salt spray was maintained at between about 1 to 2 ml/hour, as measured by a collecting area of 80 square cm. The pH of the collected solution was maintained between 6.5 to 7.2 at 35 ºC, by adding the appropriate amount of sodium hydroxide. Three (3) complete cable samples cut to 75 cm ± 5 cm in length were used for the test. The three (3) samples were placed in the chamber horizontally, to simulate a standard horizontally suspended OPGW cable. They were exposed to a salt spray for 1,000 hours. Silicon rubber was used to seal the ends of the sample. Upon completion of the 1,000 hours, the samples were removed and washed according to ASTM B117 post-test cleaning procedures. A visual inspection was performed of the complete cable sample. The samples were then dissected, to allow visual inspection of individual components.

Test No. 9 – Page 49 of 68 K-419274-RC-0001-R00
TEST RESULTS A photograph of the samples ‘before’ the salt spray test is shown in Figure 2. Photographs of the samples ‘after’ the salt spray test are shown in Figures 3 to 7. Refer to Table 1 for results of visual inspection. The visual inspection was performed with the unaided eye, as well as with a low magnification lens. In Table 1, the “Surface Inspected” refers to the surface within the OPGW construction: the “Outer Surface” of the wire is the exposed surface, before dissection of the layer; the “Inner Surface” is inspected only upon dissection of the layer.
Table 1: Results of Visual Inspection
Layer Component Inspected
Surface Inspected
Comments
Outer Layer
Aluminum Clad Steel Wires (ACS)
Outer
White residue on wires scrapes/wipes off with no signs of significant pitting or corrosion activity underneath. Aluminum cladding intact and no signs of underlying steel member.
Inner
White residue on wires scrapes/wipes off with no signs of significant pitting or corrosion activity underneath. Aluminum cladding intact and no signs of underlying steel member.
Center Aluminum Tube
Outer
White residue on wires scrapes/wipes off, with signs of isolated pitting and corrosion activity in some areas (Figures 6 and 7a). Activity was not widespread and appeared to be superficial. One pit location measured, with a pit depth of approximately 0.48 mm (Figure 7). There were no areas where aluminum had pitted to expose the underlying stainless steel tube.
ACCEPTANCE CRITERIA As specified in IEEE Std. 1138-2009 Paragraph 6.4.3.8, at the end of the test, the cables are to be removed and dissected for corrosion damage. The cables have passed the test if:
a) There are no locations where the aluminum-clad steel wires have been pitted so as to expose the underlying steel strength member in any way what so ever.
b) There are no locations where solid aluminum wires have been point pitted beyond a depth of 10% of the total individual wires diameter at the point of the pit.
c) There is no damage to the internal fiber containment tubing. d) In the case of aluminum coated tubing, there can be no removal of the aluminum coating
that exposes the underlying stainless steel tube. e) In the case of “other” coated tubing, there can be no removal of the coating that exposes
the underlying tubing to the elements. CONCLUSION The cable, as tested, met the requirements for the Salt Spray Corrosion Test as specified by IEEE 1138-2009 Paragraph 6.4.3.8.

Test No. 9 – Page 50 of 68 K-419274-RC-0001-R00
Figure 2 Three Cable Test Samples ‘before’ Salt Spray Test
Figure 3 Three Cable Test Samples ‘after’ Salt Spray Test

Test No. 9 – Page 51 of 68 K-419274-RC-0001-R00
Figure 4 Dissected Sample ‘after’ Salt Spray: White Residue on ACS Wires and Al-Tube
Figure 5 Dissected Sample ‘after’ Salt Spray: Typical Residue on Al-Tube

Test No. 9 – Page 52 of 68 K-419274-RC-0001-R00
Figure 6 Dissected Sample ‘after’ Salt Spray: Areas of Pitting on Al-Tube
Figure 7a Dissected Sample ‘after’ Salt Spray: Areas of Pitting on Al-Tube

Test No. 9 – Page 53 of 68 K-419274-RC-0001-R00
Figure 7b Dissected Sample ‘after’ Salt Spray: Cross-Section of a Pit on Al-Tube (Cross-Section of 7a)

Appendix A – Page 54 of 68 K-419274-RC-0001-R00
APPENDIX A
DESCRIPTION OF AFL OPGW CABLE (Ref. 11.5 mm OPGW, 24 fibers)

Appendix A – Page 55 of 68 K-419274-RC-0001-R00

Appendix A – Page 56 of 68 K-419274-RC-0001-R00

Appendix A – Page 57 of 68 K-419274-RC-0001-R00

Appendix A – Page 58 of 68 K-419274-RC-0001-R00

Appendix A – Page 59 of 68 K-419274-RC-0001-R00

Appendix B – Page 60 of 68 K-419274-RC-0001-R00
APPENDIX B
OPTICAL MEASUREMENTS General Set-up and Procedures
OPTICAL ATTENUATION MEASUREMENTS The set-up to monitor the optical attenuation for the mechanical and electrical tests is recommended by IEEE Std. 1138-2009, "IEEE Standard for Testing and Performance for Optical Ground Wire (OPGW) for Use on Electric Utility Power Lines". To increase the sensitivity to changes in attenuation, a number of fibers in each test sample are spliced together, or concatenated, to form one continuous length. Typically, twelve (12) fibers may be spliced for each test sample. A laser source with a nominal wavelength of 1550 nm is injected to an optical splitter. The splitter divides the source signal into two signals each with nominally one-half the power as the original source signal. One of the split signals is sent directly to an optical power meter and serves as the reference signal. The other split signal is spliced into one of the free ends of the concatenated test fibers. A second power meter is connected to the returning end of the test fibers. This measurement is the test signal. During the tests the readings from both optical power meters are monitored continuously. The data are stored periodically in a computer for future analysis. Manual readings are taken periodically to confirm the logged data. Any changes in the difference between the reference and test signals indicate a change in the attenuation in the test fiber. A net increase in attenuation means a loss in the optical signal. A net decrease in attenuation indicates a gain in the signal. TEST SAMPLE TERMINATION ARRANGEMENT The test samples are terminated in a manner such that the optical fibers at both ends of the sample cannot move relative to the OPGW. The general arrangement of preparing loops between the test sample and the fiber splice tray is shown in Figure B-1.

Appendix B – Page 61 of 68 K-419274-RC-0001-R00
Dead End Clamp
3 turns = 2.8 m
splice tray = 1.0m
1.2m
3 turns = 9.4m
0.8m
OPGW
Total length: 9.4 + 0.8 + 1.2 + 2.8 + 1.0 = 15.2m
OPGWNominal 1 meter diameter
Optical UnitNominal 0.3 meter diameter
Figure B-1: Test Sample Termination Arrangement

ISO-9001 Form: QF11-1 Rev 0, 97-10
APPENDIX C INSTRUMENT SHEET
AFL (Ref.: 11.5 mm OPGW, 24 fibers)
Test Description: Tests on 11.5 mm OPGW Test Start Date: August 15, 2011 Project Number: K-419274 Test Finish Date: December 20, 2011
TEST DESCRIPTION
EQUIPMENT DESCRIPTION
MAKE MODEL ASSET # or
SERIAL # ACCURACY
CLAIMED CALIBRATION
DATE CALIBRATION
DUE DATE TEST USE
Stress-Strain, Strain-Margin, Sheave, Bend, Twist.
A/D Datalogger
National Instruments PCI-6034E KIN-01315 C
±0.1% of Reading June 3, 2011 June 3, 2012
Data Acquisition
Optical Power Sensor Module HP 81531A
10000680-0 #5 ±0.15dB, ±1pW April 11, 2011 April 11, 2012
Power Meter
Optical Power Sensor Module HP 81531A
10000679-0 #6 ±0.15dB, ±1pW April 11, 2011 April 11, 2012
Power Meter
Load Cell (MTS) Conditioner
Lebow MTS
3156 (100,000 lbs) 493.01DC
17356-0 10000686-0
±1% of Reading June 21, 2011 June 21, 2012
Stress Strain Test
Load Cell Conditioner
Eaton Daytronic
3124 (25,000 lbs) 3170
17952-0 #8 11148-0
±1% of Reading February 23, 2011 February 23, 2012 Sheave Test
Displacement Transducer (PWP) ASM
WS10-250-10V-L05-M4-M12-Hg KIN-001591
<0.1 % of reading May 4, 2011 May 4, 2012 Cable Strain
Optical Fibre Monitor
Opto- Electronics OFM 10 035 -- October 7, 2010 October 7, 2011 Fibre Strain
Digital Caliper Mitutoyo CD-6"CSX 0-6 inches KIN-00898 ±0.025 mm June 13, 2011 June 13, 2012 Cable Diameter
Digital Protractor Mitutoyo Pro 3600 19693-0 0 to -0.1 deg April 27, 2011 April 27, 2012 Cable Angle
Measuring Tape Stanley FatMax (34-813) KIN-00723
< 0.05% of Reading
November 30, 2010
November 30, 2012 Cable Length
Measuring Tape Mastercraft 57-7190-0 KIN-00314 < 0.1% of Reading April 18, 2011 April 18, 2013 Cable Length
Appendix C
– Page 62 of 68
K
-419274-RC
-0001-R00

TEST DESCRIPTION
EQUIPMENT DESCRIPTION
MAKE MODEL ASSET # or
SERIAL # ACCURACY
CLAIMED CALIBRATION
DATE CALIBRATION
DUE DATE TEST USE
Temperature Cycling
Data Logger Campbell Scientific 21X 015686-0 ±0.1% FS March 3, 2011 March 3, 2012
Data Acquisition
Optical Power Sensor Module HP 81531A
2947G01386 #1 ±0.15dB, ±1pW June 6, 2011 June 6, 2012
Power Meter
Optical Power Sensor Module HP 81531A
10708-2 #4 ±0.15dB, ±1pW June 6, 2011 June 6, 2012
Power Meter
Thermocouple Omega Type T KIN - 01075 ± 1 degree C November 7, 2010
November 7, 2011
Chamber Temperature
Thermocouple Omega Type T KIN - 00645 ± 2 degree C May 11, 2011 May 11, 2012 Chamber Temperature
Thermocouple Omega Type T KIN - 00438 ± 1 degree C July 8, 2011 July 8, 2012 Chamber Temperature
DC Resistance Test
Digital Micro Ohmmeter AEMC 6250 KIN-00644 ±0.2% FS July 27, 2010 July 27, 2011* DC Resistance
Thermocouple Omega Type T KIN - 00919 ± 1 degree C September 8, 2011
September 8, 2012
Temperature Measurements
Measuring Tape Mastercraft 57-7190-0 KIN-00314 < 0.1% of Reading April 18, 2011 April 18, 2013 Gauge Length
* Kinectrics Quality Assurance System allows for a one month extension on calibration due dates.
Appendix C
– Page 63 of 68
K
-419274-RC
-0001-R00

TEST
DESCRIPTION EQUIPMENT
DESCRIPTION MAKE MODEL
ASSET # or SERIAL #
ACCURACY CLAIMED
CALIBRATION DATE
CALIBRATION DUE DATE
TEST USE
Aeolian Vibration Test (Fence Span)
A/D Datalogger
National Instruments PCI-MIO-16E-1 KIN-00234 A ±0.1% of Reading June 27, 2011 June 27, 2012 Data Acquisition
Optical Power Sensor Module HP 81531A
KIN-01399 #12 ±0.15dB, ±1pW
September 14, 2010
September 14, 2011*
Power Meter
Optical Power Sensor Module HP 81531A
KIN-01398 #9 ±0.15dB, ±1pW
September 14, 2010
September 14, 2011*
Power Meter
Load Cell Load Cell w/READOUT
Straincert Daytronics
TLNS-10 (10,000 lbs) 3170
19679-0
#1 19678-0
±1% of Reading March 29, 2011 March 29, 2012
Cable Tension
V-Scope PLP - KIN-00971 #3 < 1% November 1, 2010 November 1, 2011 Amplitude Measurement
Digital Protractor Mitutoyo Pro 3600 19693-0 0 to -0.1 deg April 27, 2011 April 27, 2012
Cable Sag Angle
Measuring Tape Mastercraft 57-7190-0 KIN-00314 < 0.1% of Reading April 18, 2011 April 18, 2013 Cable Length
* Kinectrics Quality Assurance System allows for a one month extension on calibration due dates.
Appendix C
– Page 64 of 68
K
-419274-RC
-0001-R00

Appendix D – Page 65 of 68 K-419274-RC-0001-R00
APPENDIX D
KINECTRICS ISO 9001 QUALITY MANAGEMENT SYSTEM REGISTRATION CERTIFICATE
and
KINECTRICS ISO 17025 CERTIFICATE of ACCREDITATION (for High Voltage, High Current, and Mechanical Testing Laboratories)

Appendix D – Page 66 of 68 K-419274-RC-0001-R00

Appendix D
– Page 67 of 68
K
-419274-RC
-0001-R00

Page 68 of 68 K-419274-RC-0001-R00
DISTRIBUTION Jaclyn Whitehead (2) AFL
150 Ridgeview Circle Duncan, SC 29334 United States
Telephone: (864) 486-7026 Email: [email protected] C. Dimnik (1) Transmission and Distribution Technologies Business, KB223

Page 1 of 40 K-419169-RC-0001-R00
To: AFL Telecommunications 150 Ridgeview Circle Duncan, SC 29334
KINECTRICS NORTH AMERICA INC. TEST REPORT FOR AFL TELECOMMUNICATIONS
(Ref. CC-57/453 OPGW, 11.5 mm, 24 fibres)
Kinectrics North America Inc. Report: K-419169-RC-0001-R00
March 26, 2010
C. Dimnik Transmission and Distribution Technologies Business
Two (2) tests were performed for AFL Telecommunications on an 11.5 mm diameter, 24 fibre optical ground wire (OPGW). The cable was manufactured by AFL Telecommunications and is designated CC-57/453. The conductor and hardware was received in good condition, on February 23, 2010. All tests were performed in accordance to IEEE Std. 1138-2009. The cable successfully met all the requirements in this specification. This document is a compilation of all the individual test reports. The reports are assembled in the following order. TEST STANDARD TEST TEST DATE (IEEE Std. 1138-2009) 1. Short Circuit Test February 26, 2010 Paragraph 6.4.3.3 2. Lightning Arc Test March 5, 2010 Paragraph 6.4.3.4 Each test report is self-contained with dedicated figures. The four (4) appendices located at the back of this document are common to each test report. A copy of Kinectrics ISO 9001 and 17025 Accreditation Certificates are included in Appendix D.
All tests were performed by Kinectrics North America Inc. personnel at 800 Kipling Avenue, Toronto, Ontario, M8Z 6C4, Canada.
PRIVATE INFORMATION Contents of this report shall not be disclosed without authority of the client.
Kinectrics North America Inc., 800 Kipling Avenue, Toronto, Ontario M8Z 6C4.

Page 2 of 40 K-419169-RC-0001-R00
ACKNOWLEDGEMENTS The assistance of Mr. C. Maurice for the Short Circuit Test is greatly appreciated.
Prepared by: C. Dimnik Engineer Transmission and Distribution Technologies Business
M. J. Kastelein Technologist
Transmission and Distribution Technologies Business
M. Colbert Technologist Transmission and Distribution Technologies Business
Reviewed by: C.J. Pon Principal Engineer Transmission and Distribution Technologies Business
Approved by: R. Lings General Manager Transmission and Distribution Technologies Business CD:MJK:MC:CJP:RL
DISCLAIMER
Kinectrics North America, Inc (KNAI) has taken reasonable steps to ensure that all work performed meets industry standards as set out in Kinectrics Quality Manual, and that, for the intended purpose of this report, is reasonably free of errors, inaccuracies or omissions. KNAI DOES NOT MAKE ANY WARRANTY OR REPRESENTATION WHATSOEVER, EXPRESS OR IMPLIED, WITH RESPECT TO THE MERCHANTABILITY OR FITNESS FOR ANY PARTICULAR PURPOSE OF ANY INFORMATION CONTAINED IN THIS REPORT OR THE RESPECTIVE WORKS OR SERVICES SUPPLIED OR PERFORMED BY KNAI. KNAI does not accept any liability for any damages, either directly, consequentially or otherwise resulting from the use of this report. Kinectrics North America Inc. has prepared this report in accordance with the terms and conditions of Purchase Order 192928 dated February 12, 2010. Kinectrics North America Inc., 2010.

Test No. 1 – Page 3 of 40 K-419169-RC-0001-R00
KINECTRICS NORTH AMERICA INC. TEST REPORT FOR AFL TELECOMMUNICATIONS
(Ref. CC-57/453 OPGW, 11.5 mm, 24 fibres) Test Name: SHORT CIRCUIT TEST Test Date: February 26, 2010 Test Laboratory: Kinectrics North America Inc. 800 Kipling Avenue Toronto, Ontario, M8Z 5S4 CANADA Cable Manufacturer: AFL Telecommunications Cable Designation: CC-57/453 Accessories: Dead-ends provided by AFL: AFL ODEC450/459 G08 Kinectrics Staff: Mr. Craig Pon Mr. Claude Maurice
Mr. Mike Kastelein Ms. Corrine Dimnik Witnesses: None TEST OBJECTIVE The objective of the Short Circuit Test is to verify that the OPGW can withstand repeated short circuit applications without exceeding optical, physical or thermal requirements. TEST STANDARD The test was performed in accordance with IEEE Std. 1138-2009, Paragraph 6.4.3.3.

Test No. 1 – Page 4 of 40 K-419169-RC-0001-R00
TEST SET-UP The Short Circuit Test was carried out at Kinectrics’ Indoor High Current Test Facility. A schematic of the electrical circuit is shown in Figure 1. Typical photos of the set-up for the test are shown in Figures 2a and 2b. Test Apparatus Two (2) OPGW samples were used for this test. One sample was used to monitor the performance of the optical fibres and to observe any physical damage that might occur during the test. The other sample was used only to measure the temperature at several points in the cross-section of the cable. The cables were positioned about 1 m apart and about 2 m above the ground. The cables were electrically connected in series so that they would be subjected to the same short circuit current. The short circuit current was provided by a high level current transformer. A separate low-level transformer was also connected to the test span. It provided a current of several hundred amperes to maintain the cable temperature to at least 40ºC between short circuit applications. Optical Sample The cable and fibre terminations and the method to measure optical attenuation are described in Appendix B. The length of cable between the current injection points was 11.3 m. The optical fibres were terminated beyond each dead-end clamp. A turnbuckle was used to tension the cable to the required value. A dynamometer was used to measure the tension. The optical sample was tensioned to about 1,498 kgf at 40ºC. This is about 20% of the rated tensile strength of the cable (7,489 kgf). Temperature Sample The temperature in this sample was measured at three (3) locations using three (3) fast responding thermocouples. They were spaced approximately one (1) m apart at the following locations. Thermocouple #1 – Between two (2) aluminum-clad steel (ACS) wires Thermocouple #2 – Between ACS wire and aluminum pipe Thermocouple #3 – Inside optical core The thermocouples were optically isolated from other instrumentation to prevent electrical interference. A turnbuckle was used to tension the cable to nominally the same value as the optical sample. A typical thermocouple installation is shown in Figure 3. Optical Network Optical Sample For power attenuation measurements, all twenty-four (24) fibres were spliced producing a total fibre length under test of 271.2 m (24 fibres x 11.3 m).

Test No. 1 – Page 5 of 40 K-419169-RC-0001-R00
Temperature Sample Optical signals were not measured in this cable sample. Instrumentation and Data Acquisition For each short circuit application, or “shot”, a high-speed data acquisition system recorded the short circuit current at 10,000 samples/second. The optical power readings from the optical sample were recorded at 500 samples/second. The thermocouple readings from the temperature sample were recorded at 200 samples/second. The optical readings and the temperature from thermocouple #1 were also recorded once every two (2) seconds. This provided a “digital strip chart” of the entire test. The measuring instruments used in this test are listed in Appendix C. TEST PROCEDURE The cable was first subjected to one (1) low-level calibration shot and then five (5) “official” shots. The purpose of the calibration shot was to ensure that the current level was correct. For the “official” shots, the target values for the electrical parameters were:
Parameter Target Value
Energy 31.0 Minimum kA2-sec
Fault Current 5.5 kA
Duration 1 sec
Asymmetry Maximum possible
For each shot, the fault current and duration may vary slightly from the target values. The objective was to achieve the minimum energy level for each shot. To ensure the optical signals were stable, the power meters were powered on and operating for at least fifteen (15) minutes before the first shot. The optical measurement was normalized to zero before the first official shot. The cables were visually inspected for birdcaging or other damage during and after the test. The optical and temperature data were acquired for at least fifteen (15) minutes after the fifth shot. The cable was maintained at 40C during this hold period.

Test No. 1 – Page 6 of 40 K-419169-RC-0001-R00
TEST RESULTS The cable temperature, optical attenuation and short circuit electrical data for the calibration shot and the five (5) “official” shots are summarized in the "Data Monitoring Summary" sheet. The data for each shot is shown in the figures labeled Shot #1 (Test # 10-1165) to Shot #5 (Test # 10-1169). The top panel displays the cable temperature for the duration of the test as measured by Thermocouple #1. The second panel displays the optical attenuation for the duration of the test. All data are summarized in the table at the bottom of the page. The permanent increase in optical attenuation was less 0.02 dB/test fibre km at 1550 nm. The maximum absolute temperature reached was 189.3 ºC (147 + 42.3), and was measured during Shot #4 on Thermocouple #2 (between ACS wire and aluminum pipe). A section of cable from the mid-span, and near both dead-ends were dissected after the test and visually examined for damage. The components were compared to an untested section.
Cable Component North Dead-end Midpoint South Dead-end
Aluminum Clad Steel Wires
No signs of excessive wear or breakdown
No signs of excessive wear or breakdown
No signs of excessive wear or breakdown
Aluminum Pipe No signs of excessive wear or breakdown
No signs of excessive wear or breakdown
No signs of excessive wear or breakdown
Fibres No signs of excessive discoloration
No signs of excessive discoloration
No signs of excessive discoloration
Binders No signs of excessive wear or discoloration
No signs of excessive wear or discoloration
No signs of excessive wear or discoloration
Compound No signs of excessive discoloration (slight discoloration)
No signs of excessive discoloration (slight discoloration)
No signs of excessive discoloration (slight discoloration)
ACCEPTANCE CRITERIA According to IEEE Std. 1138-2009 Paragraph 6.4.3.3, the following acceptance criteria must be met:
a) There shall be no cracking or breaking of any component of the optical sample. This assessment is made with the naked eye.
b) There shall be no birdcaging of any of the strands of the optical sample. Birdcaging is defined as one or more cable strands that permanently protrude greater than one strand diameter from the normal cable geometry. A strand will be considered to have birdcaged if light can be seen between the protruding strand and the cable. This observation will be made after the cable has cooled to the reference temperature after the last pulse. Temporary birdcaging during the pulses shall not constitute failure.
c) There shall be no permanent increase in optical attenuation greater than 0.05 dB/fibre at nominally 1550 nm ± 20 nm for single-mode fibres.
d) The temperature of the optical core shall not exceed 180 oC at any time during the test. e) There shall be no excessive wear, discoloration of fibres, deformation, or other signs of
breakdown.

Test No. 1 – Page 7 of 40 K-419169-RC-0001-R00
CONCLUSION The cable, as tested, met the requirements for the Short Circuit Test as specified by IEEE Std. 1138-2009, Paragraph 6.4.3.3. Kinectrics North America Inc. Craig Pon Principal Engineer Transmission and Distribution Technologies Business

Test No. 1 – Page 8 of 40 K-419169-RC-0001-R00
Splice TrayOptics to Control Room
Tower
Dynamometer
Turnbuckle
Insulator
Thermocouples
Isolation Switch Isolation Switch
Splice Tray(loop end)
Tower
Insulator
Deadend HardwareDeadend Hardware
25 Volts
0-240VoltPre-HeatingCircuit
CurrentLimitingImpedance
Make Switch
Supply Transformer
OPGW Under Test
High Current Circuit
Dummy Cable
Figure 1 Electrical Circuit for Short Circuit Test

Test No. 1 – Page 9 of 40 K-419169-RC-0001-R00
Figure 2a Set-up for Short Circuit Test in High Current Lab
Figure 2b Typical Set-up for Short Circuit Test in High Current Lab
Dynamometer
Temperature Sample Cable
Optical Sample Cable

Test No. 1 – Page 10 of 40 K-419169-RC-0001-R00
Figure 3 Typical Installation of Thermocouple on Temperature Sample

Test No. 1 – Page 11 of 40 K-419169-RC-0001-R00

Test No. 1 – Page 12 of 40 K-419169-RC-0001-R00

Test No. 1 – Page 13 of 40 K-419169-RC-0001-R00

Test No. 1 – Page 14 of 40 K-419169-RC-0001-R00

Test No. 1 – Page 15 of 40 K-419169-RC-0001-R00

Test No. 1 – Page 16 of 40 K-419169-RC-0001-R00

Test No. 2 – Page 17 of 40 K-419169-RC-0001-R00
KINECTRICS NORTH AMERICA INC. TEST REPORT FOR AFL TELECOMMUNICATIONS
(Ref. CC-57/453 OPGW, 11.5 mm, 24 fibres) Test Name: LIGHTNING ARC TEST Test Date: March 5, 2010 Test Laboratory: Kinectrics North America Inc. 800 Kipling Avenue Toronto, Ontario, M8Z 6C4 CANADA Cable Manufacturer: AFL Telecommunications Cable Designation: CC-57/453 Accessories: Klein Grips provided by Kinectrics Kinectrics Staff: Mr. Craig Pon Mr. Mike Colbert Ms. Corrine Dimnik Mr. Emanuel Petrache Witnesses: None TEST OBJECTIVE The objective of this test was to verify the ability of the OPGW to withstand a lightning strike. TEST STANDARD The test was performed in accordance with IEEE Std. 1138-2009, Paragraph 6.4.3.4.

Test No. 2 – Page 18 of 40 K-419169-RC-0001-R00
TEST SET-UP Figure 1 shows a schematic diagram of the configuration for this test. Test Apparatus An OPGW sample was installed between two fixed abutments. The length of the cable between the load points of the dead-end assembly was 11.0 m. A load cell was installed at one end to measure the tension in the cable. Optical Network All twenty-four (24) fibres of the test cable sample were spliced together to form one continuous loop. The test sample was terminated beyond both dead-ends such that the optical fibres could not move relative to the OPGW. The cable and fibre terminations and the method for measuring optical attenuation are described in Appendix B. Instrumentation and Data Acquisition The GPIB outputs of the optical power meters were monitored and recorded every one-third second by a digital data logging system. The load cell readings were manually recorded. The measuring instruments used in this test are listed in Appendix C. TEST PROCEDURE Five (5) sections of the cable sample were tested separately as follows. Each section was tensioned to between 15% and 20% of the cable RTS. The test conditions were based on Table 5, Class 0 parameters. A nominal arc current of 100 A with negative polarity was applied to the cable through a six (6) cm long thin filament. The filament was blown and the current increased and created an arc to the cable. The duration of the arc was nominally 0.50 seconds. This produced a nominal charge transference of 50 coulombs. The tolerance on the charge transference was ±10%. The tests were carried out at room ambient temperature. After the Lightning Arc test, the remaining breaking strength was calculated for each of the five (5) sections of the cable sample. RESULTS A summary of the test results is listed in Table 1. The maximum change in optical attenuation during the tests was less than 0.01 dB. The current waveforms for the arcs are shown in Figures 2a, 3a, 4a, 5a and 6a. Photographs of the arcs are shown in Figures 2b, 3b, 4b, 5b and 6b.

Test No. 2 – Page 19 of 40 K-419169-RC-0001-R00
Table 1 Summary of Test Results
Test (Figure)
Total Charge
(coulombs)
Change in Attenuation
(dBm)
Cable Tension
During Test. Before/After
(kgf)
Number Of Wires
Broken or Damaged
Calculated Residual Strength
(kgf)
% of RTS
Hit 1
(2a,b) 53.8 < 0.01 1,356 / 1,293
- 2 ACS broken - 1 ACS damaged - No damage to Al
pipe
5,915 79%
Hit 2
(3a,b) 50.5 0.0 1,402 / 1,367
- 1 ACS broken - 3 ACS damaged - No damage to Al pipe
6,702 89%
Hit 3
(4a,b) 51.0 0.0 1,376 / 1,346
- 1 ACS broken - 2 ACS damaged - No damage to Al pipe
6,702 89%
Hit 4
(5a,b) 53.2 0.0 1,417 / 1,355
- 2 ACS broken - 1 ACS damaged - No damage to Al pipe
5,915 79%
Hit 5
(6a,b) 54.2 0.0 1,402 / 1,321
- 2 ACS broken - 1 ACS damaged - No damage to Al pipe
5,915 79%
The residual remaining strength for each of the five (5) sections of the cable sample was calculated by adding the nominal breaking strength for each unbroken component. As provided by Ramon Franco of AFL, the strength of each component was: an ACS wire 787 kgf; the aluminium pipe 222 kg; and the stainless steel tube 183 kgf. The remaining calculated breaking strength for each of the five (5) sections of cable was greater than 75% of the cable RTS. ACCEPTANCE CRITERIA According to IEEE Std. 1138-2009 Paragraph 6.4.3.4, the following acceptance criteria must be met:
a) There shall be no permanent increase in optical attenuation greater than 0.05 dB/fibre at nominally 1550 nm ± 20 nm for single-mode fibres.
b) The minimum remaining strength of any of the test cable sections shall be greater than 75% of the cable RTS.

Test No. 2 – Page 20 of 40 K-419169-RC-0001-R00
CONCLUSION The cable, as tested, met the requirements for the Lightning Arc Test as specified by IEEE Std. 1138-2009 Paragraph 6.4.3.4. Kinectrics North America Inc. Craig Pon Principal Engineer Transmission and Distribution Technologies Business

Test No. 2 – Page 21 of 40 K-419169-RC-0001-R00
Turnbuckle
Deadend Clamp
Typical Optical Setup
Splice to cable fibers
Fusion Splice of Fibers
Loopback
OPGW
Optical Splitter
Laser
ReferenceMeter
Test MeterComputer
Test span
Arc Gap Pulse
Generator
Load Measurement
Figure 1 Set-up of Lightning Arc Test

Test No. 2 – Page 22 of 40 K-419169-RC-0001-R00
0
20
40
60
80
100
120
0 0.2 0.4 0.6 0.8 1
Currents [A]
Time [seconds]
Charge Transfer: 53.8 C
Figure 2a Current Waveform for Lightning Arc – Hit 1, 53.8 C
Figure 2b Photograph of OPGW after Lightning Arc – Hit 1

Test No. 2 – Page 23 of 40 K-419169-RC-0001-R00
0
20
40
60
80
100
120
0 0.2 0.4 0.6 0.8 1
Currents [A]
Time [seconds]
Charge Transfer: 50.5 C
Figure 3a Current Waveform for Lightning Arc – Hit 2, 50.5 C
Figure 3b Photograph of OPGW after Lightning Arc – Hit 2

Test No. 2 – Page 24 of 40 K-419169-RC-0001-R00
0
40
80
120
160
200
0 0.2 0.4 0.6 0.8 1
Currents [A]
Time [seconds]
Charge Transfer: 51.0 C
Figure 4a Current Waveform for Lightning Arc - Hit 3, 51.0 C
Figure 4b Photograph of OPGW after Lightning Arc – Hit 3

Test No. 2 – Page 25 of 40 K-419169-RC-0001-R00
0
20
40
60
80
100
120
0 0.2 0.4 0.6 0.8 1
Currents [A]
Time [seconds]
Charge Transfer: 53.2 C
Figure 5a Current Waveform for Lightning Arc – Hit 4, 53.2 C
Figure 5b Photograph of OPGW after Lightning Arc – Hit 4

Test No. 2 – Page 26 of 40 K-419169-RC-0001-R00
0
20
40
60
80
100
120
0 0.2 0.4 0.6 0.8 1
Currents [A]
Time [seconds]
Charge Transfer: 54.2 C
Figure 6a Current Waveform for Lightning Arc – Hit 5, 54.2 C
Figure 6b Photograph of OPGW after Lightning Arc – Hit 5

Appendix A – Page 27 of 40 K-419169-RC-0001-R00
APPENDIX A
DESCRIPTION OF AFL TELECOMMUNICATIONS OPGW CABLE (Ref. CC-57/453 OPGW, 11.5 mm, 24 fibres)

Appendix A – Page 28 of 40 K-419169-RC-0001-R00

Appendix A – Page 29 of 40 K-419169-RC-0001-R00

Appendix A – Page 30 of 40 K-419169-RC-0001-R00

Appendix A – Page 31 of 40 K-419169-RC-0001-R00

Appendix A – Page 32 of 40 K-419169-RC-0001-R00

Appendix B – Page 33 of 40 K-419169-RC-0001-R00
APPENDIX B
OPTICAL MEASUREMENTS General Set-up and Procedures
OPTICAL ATTENUATION MEASUREMENTS The set-up to monitor the optical attenuation for the mechanical and electrical tests is recommended by IEEE Std. 1138-1994, "Standard Construction of Composite Fiber Optic Groundwire (OPGW) For Use on Electric Utility Power Lines". To increase the sensitivity to changes in attenuation, a number of fibers in each test sample are spliced together, or concatenated, to form one continuous length. Typically, twelve (12) fibers may be spliced for each test sample. A laser source with a nominal wavelength of 1550 nm is injected to an optical splitter. The splitter divides the source signal into two signals each with nominally one-half the power as the original source signal. One of the split signals is sent directly to an optical power meter and serves as the reference signal. The other split signal is spliced into one of the free ends of the concatenated test fibers. A second power meter is connected to the returning end of the test fibers. This measurement is the test signal. During the tests the readings from both optical power meters are monitored continuously. The data are stored periodically in a computer for future analysis. Manual readings are taken periodically to confirm the logged data. Any changes in the difference between the reference and test signals indicate a change in the attenuation in the test fiber. A net increase in attenuation means a loss in the optical signal. A net decrease in attenuation indicates a gain in the signal. TEST SAMPLE TERMINATION ARRANGEMENT The test samples are terminated in a manner such that the optical fibers at both ends of the sample cannot move relative to the OPGW. The general arrangement of preparing loops between the test sample and the fiber splice tray is shown in Figure B-1.

Appendix B – Page 34 of 40 K-419169-RC-0001-R00
Dead End Clamp
3 turns = 2.8 m
splice tray = 1.0m
1.2m
3 turns = 9.4m
0.8m
OPGW
Total length: 9.4 + 0.8 + 1.2 + 2.8 + 1.0 = 15.2m
OPGWNominal 1 meter diameter
Optical UnitNominal 0.3 meter diameter
Figure B-1: Test Sample Termination Arrangement

ISO-9001 Form: QF11-1 Rev 0, 97-10
APPENDIX C INSTRUMENT SHEET
AFL TELECOMMUNICATIONS (Ref.: CC-57/453, 11.5 mm, 24 fibres)
Test Description: SCT and LAT on OPGW Test Start Date: February 26, 2010 Project Number: K-419169 Test Finish Date: March 5, 2010
TEST DESCRIPTION
EQUIPMENT DESCRIPTION
MAKE MODEL ASSET # or
SERIAL # ACCURACY
CLAIMED CALIBRATION
DATE CALIBRATION
DUE DATE TEST USE
Short Circuit Test
Dynamometer Dillion 4000 KG 10721-0 ±1% of Full Scale February 17, 2010 February 17, 2011 Cable Tension
Resistive Instrumentation Shunt 0.5 ohm HCL-SP 15029 0.1% April 23, 2010 April 23, 2011
Non inductive Shunt
Waveform Recorder Lecroy 6810 A61181 0.5%
November 27, 2009
November 27, 2010
Recording Cable Temperatures
Waveform Recorder Lecroy 6810 A60497 0.5%
November 27, 2009
November 27, 2010
Recording Fault Current
Waveform Recorder Kinectic Systems 4004 10000026-0 0.5% April 2, 2009 April 2, 2010
Recording Optical Source & Test Meters
Current Instrumentation Transformer Raccal-Decca CT2463-2 Z014565-0 -
December 30, 2009
December 30, 2010
Resistive Shunt for current measurements
Optical Power Sensor Module HP 81531A
11140-0-3 #7 ±0.15dB, ±1pW
November 30, 2009
November 30, 2010
Reference Meter
Optical Power Sensor Module HP 81531A
2947G02843
#8 ±0.15dB, ±1pW November 30, 2009
November 30, 2010
Test Meter
Thermocouple Calibrator Kinectrics Type K KTHL-2 - November 3, 2009 November 3, 2010
Calibration of Thermocouple Isolation Transducer
Appendix C
– Page 35 of 40
K
-419169-RC
-0001-R00

TEST DESCRIPTION
EQUIPMENT DESCRIPTION
MAKE MODEL ASSET # or
SERIAL # ACCURACY
CLAIMED CALIBRATION
DATE CALIBRATION
DUE DATE TEST USE
Lightning Arc Test
Optical Power Sensor Module HP 81531A
11140-0-3
#7 ±0.15dB, ±1pW November 30, 2009
November 30, 2010
Reference Meter
Optical Power Sensor Module HP 81531A
2947G02843 #8 ±0.15dB, ±1pW
November 30, 2009
November 30, 2010
Test Meter
A/D Datalogger
National Instruments PCI-6034E KIN-00235 H
±0.1% of Reading
September 24, 2009
September 24, 2010
Data Acquisition
Load Cell Conditioner w/READOUT
Artech Electro-Numerics
20210-10K (10,000 lbs) M20000SG
50268-0 #7
±1% of Reading
February 17, 2010
February 17, 2011
Cable Tension
Digital Temperature Meter Thermocouple Probe
Fluke Omega
52 Type k
KIN-00033 KIN-00146
±1 degree C ±1 degree C
December 2, 2009 August 18, 2009
December 2, 2010 August 18, 2010
Ambient Air Temperature
Appendix C
– Page 36 of 40
K
-419169-RC
-0001-R00

Appendix D – Page 37 of 40 K-419169-RC-0001-R00
APPENDIX D
KINECTRICS ISO 9001 QUALITY MANAGEMENT SYSTEM REGISTRATION CERTICATE
and
KINECTRICS ISO 17025 CERTIFICATE of ACCREDITATION (for High Voltage, High Current, and Mechanical Testing Laboratories)

Appendix D – Page 38 of 40 K-419169-RC-0001-R00

Appendix D
– Page 39 of 40
K
-419169-RC
-0001-R00

Page 40 of 40 K-419169-RC-0001-R00
DISTRIBUTION R. Franco (2) AFL Telecommunications
150 Ridgeview Circle Duncan, SC 29334 Telephone: (864) 433-5428 Email: [email protected]
C. Dimnik (1) Transmission and Distribution Technologies Business, KB223