somany ceramics limited · ... gspc and ioc for supply of natural gas ... •pan india distribution...
TRANSCRIPT

SOMANY CERAMICS LIMITED Q3/9M’FY15 – Investor Update
January, 2015
Key Industry highlights
2
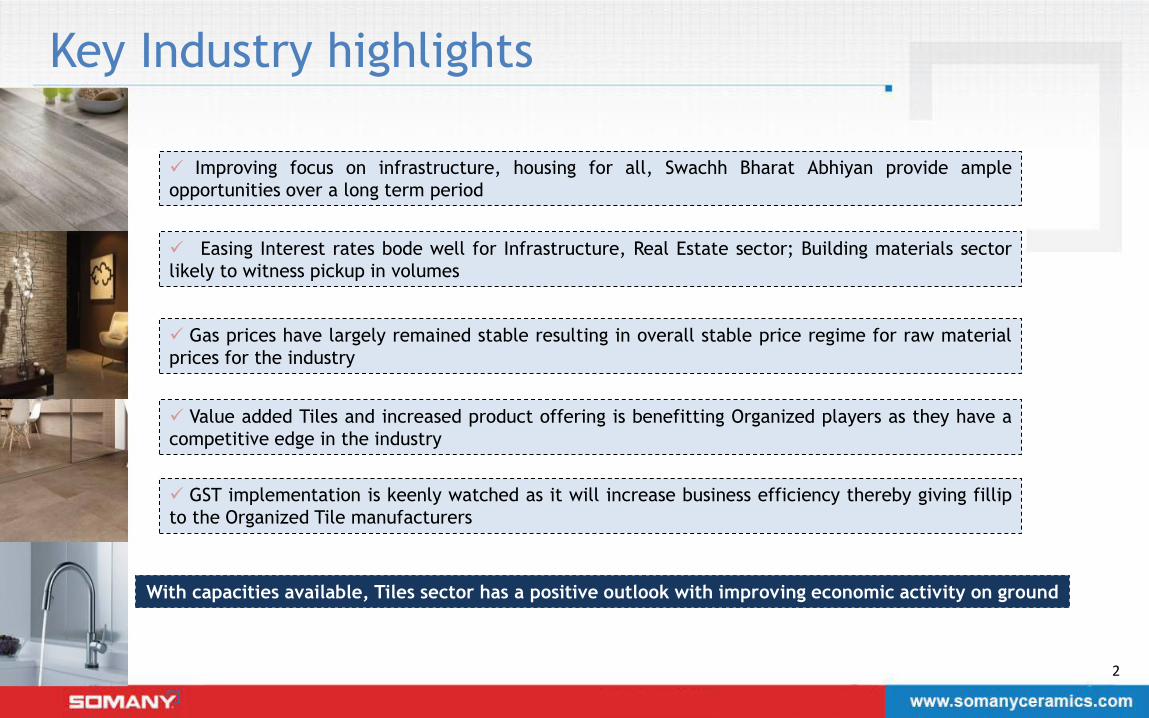
Improving focus on infrastructure, housing for all, Swachh Bharat Abhiyan provide ample
opportunities over a long term period
Easing Interest rates bode well for Infrastructure, Real Estate sector; Building materials sector
likely to witness pickup in volumes
Gas prices have largely remained stable resulting in overall stable price regime for raw material
prices for the industry
Value added Tiles and increased product offering is benefitting Organized players as they have a
competitive edge in the industry
GST implementation is keenly watched as it will increase business efficiency thereby giving fillip
to the Organized Tile manufacturers
With capacities available, Tiles sector has a positive outlook with improving economic activity on ground

Quarterly overview
3
•Q3’FY15 tiles sales volume at 10.18 msm vs. 8.54 msm, a growth of 19% YoY
•9m’FY15 tiles sale volume at 29.77 msm vs. 26.02 msm, a growth of 14% YoY
•Sales in 9m’FY15 – Own manufacturing (40%), JV (38%) and Others (22%)
•Net Sales increased by 31% YoY to Rs. 371.18 cr in Q3’FY15
•Q3’FY15 PBT grew by 139% to Rs. 17.01 cr with margin at 4.6%
•Q3’FY15 PAT grew by 131% to Rs. 11.02 cr with margin at 3.0%
•Access to capacity to be at ~55 msm by March, 2015
•Amora Tiles Pvt. Ltd., a subsidiary company expanded by 2.44 msm per annum
•Acer Granito Pvt. Ltd., an associate company expanded by 3.06 msm per annum
•Expansion at Kadi plant for 2.40 msm per annum likely to commence in February, 2015
Operational
Performance
Financial
Performance
Capacities
Msm - mn sq mtr

Quarterly overview
4
Exports for the quarter stood at Rs. 19.24 cr up by 223%
Geographical Sales – North (39%), South (28%), West (11%), East (17%), Exports (5%)
Sanitaryware and bath fittings sales at Rs. 17.72 cr up by 47%

Recognition at ABLS, 2014
5
Asian Brand and leadership Summit (ABLS), 2014 honored our company with Asia’s Most Promising
Brand Award in Buildings Material Category. Our Joint Managing Director – Mr. Abhishek
Somany was received award for one of Asia’s Most Promising Leader.
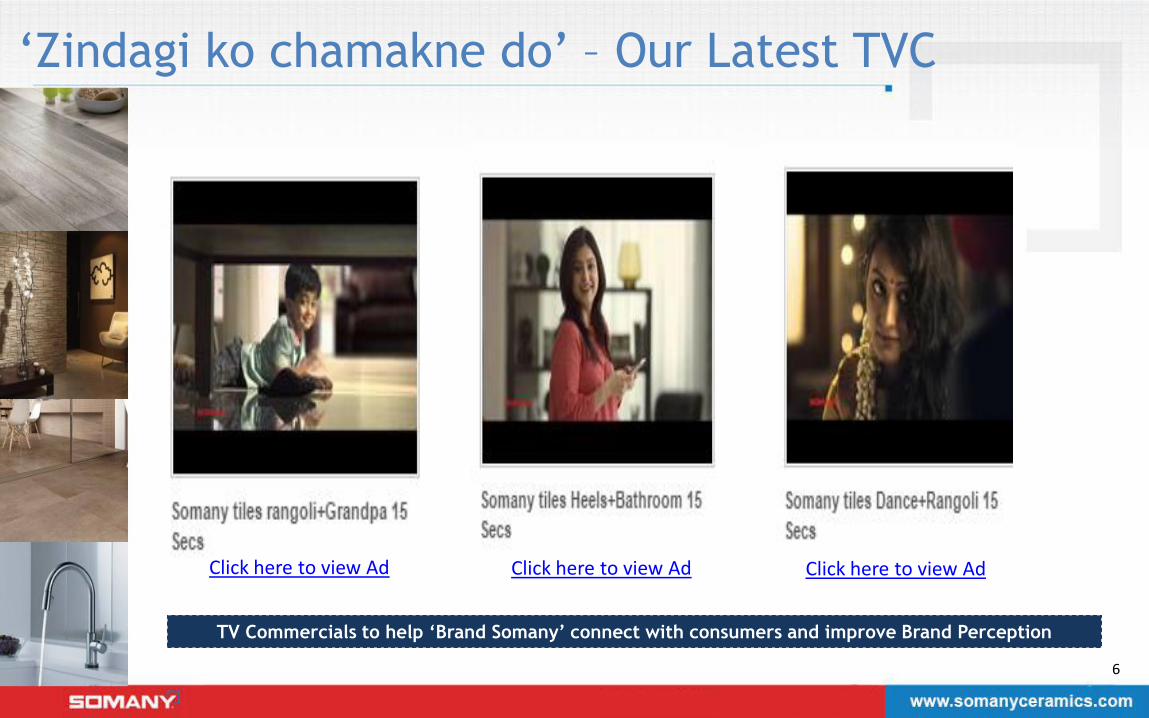
‘Zindagi ko chamakne do’ – Our Latest TVC
6
TV Commercials to help ‘Brand Somany’ connect with consumers and improve Brand Perception
Click here to view Ad
Click here to view Ad
Click here to view Ad

Sales Performance (Gross)
7
Q3’FY15 vs Q3’FY14 9m’FY15 vs 9m’FY14
Figures in Rs. cr
93 80
48
165
161
141
386
Q3FY14
301
+28%
Others
JV
Own
Manufacturing
Q3FY15
299 255
149
420
446
442
1,117
9mFY14
894
Others
JV
Own
Manufacturing
+25%
9mFY15

Volume Performance (Tiles)
8
Q3’FY15 vs Q3’FY14 9m’FY15 vs 9m’FY14
Figures in mn sq mtr
2.812.00
0.913.97
4.82
4.21
Others
8.54
Own
Manufacturing
JV
Q3FY14
10.18
Q3FY15
+19%
9.596.58
2.98 10.11
13.45
13.08
Others
26.02
Own
Manufacturing
JV
9mFY14
29.77
9mFY15
+14%

Q3/9M’FY15 Profit & Loss
9
Particulars Q3’FY15 Q3’FY14 Growth 9m’FY 15 9m’FY 14 Growth
Net Sales 371.18 283.54 30.9% 1069.72 845.33 26.5%
EBIDTA 26.77 17.43 53.6% 73.41 55.70 31.8%
Depreciation 5.64 5.73 -1.6% 16.29 16.45 -1.0%
Finance cost 4.12 4.58 -10.0% 11.55 13.83 -16.5%
Profit before tax 17.01 7.12 138.9% 45.57 25.42 79.3%
Tax expenses 5.99 2.34 156.0% 15.98 8.57 86.5%
Profit after tax 11.02 4.78 130.5% 29.59 16.85 75.6%
Basic EPS (Rs.) 2.84 1.38 105.8% 7.62 4.88 56.1%
Standalone figures in Rs.cr

Debt Management
10
Working Capital Days* Leverage Ratio
*excludes Current Investment of Rs. 37 cr in F’Y14 and Rs. 34.78 cr in H1’FY15
3437
47
54
70
-8%
-23%
-21%
FY’13
-13%
FY’14 H1’FY15 FY’12 FY’11
0.70.8
1.2
1.5
1.9
H1’FY15 FY’14 FY’13 FY’12 FY’11
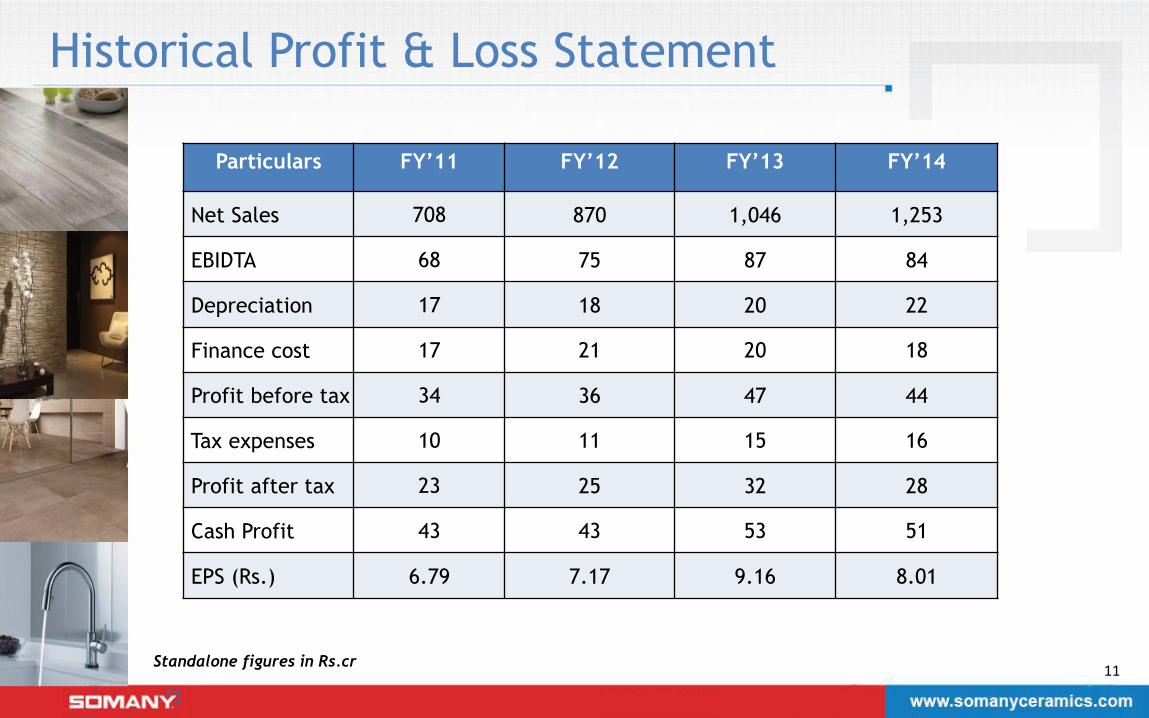
Historical Profit & Loss Statement
11 Standalone figures in Rs.cr
Particulars FY’11 FY’12 FY’13 FY’14
Net Sales 708 870 1,046 1,253
EBIDTA 68 75 87 84
Depreciation 17 18 20 22
Finance cost 17 21 20 18
Profit before tax 34 36 47 44
Tax expenses 10 11 15 16
Profit after tax 23 25 32 28
Cash Profit 43 43 53 51
EPS (Rs.) 6.79 7.17 9.16 8.01

Historical Balance Sheet
12 Standalone figures in Rs.cr
Particulars FY’11 FY’12 FY’13 FY’14 H1’FY15
Equity Share
Capital 7 7 7 8 8
Reserves & Surplus 96 117 144 213 230
Net Worth 102 124 151 221 238
Total Debt 191 181 176 170 166
Net Block 176 194 209 219 226
Investments 2 6 9 22 22
Net Current Assets 137 128 133 165 165

Key Strengths
13
•Committed to value enhancement by adopting asset light model and increasing share of value add products
•1st in the Indian Tile industry to have Government recognized R&D facilities, thereby giving credibility to ‘Brand Somany’
•Long term firm contract with GAIL, GSPC and IOC for supply of natural gas
•High credibility & reputation for ‘Brand Somany’ and its Promoters amongst dealers, suppliers and financial institutions
•Pan India distribution and marketing network creating stronger Brand Somany
•Around 10,000 touch points which include dealer, retailer, showrooms/display centers
•Strong brand recall in retail segment which contributes ~65% of overall sales
•Formidable association with large institutional clients comprising of Governments, Corporates and Private Builders
•Wide product range covering Ceramic, Vitrified Tiles, Sanitaryware & Bath fittings
•India’s largest in-house designing team dedicated to developing designs, products and concepts in collaboration with Spanish and Italian design houses
•Asset model allows company to respond faster to changing trends and market dynamics
14
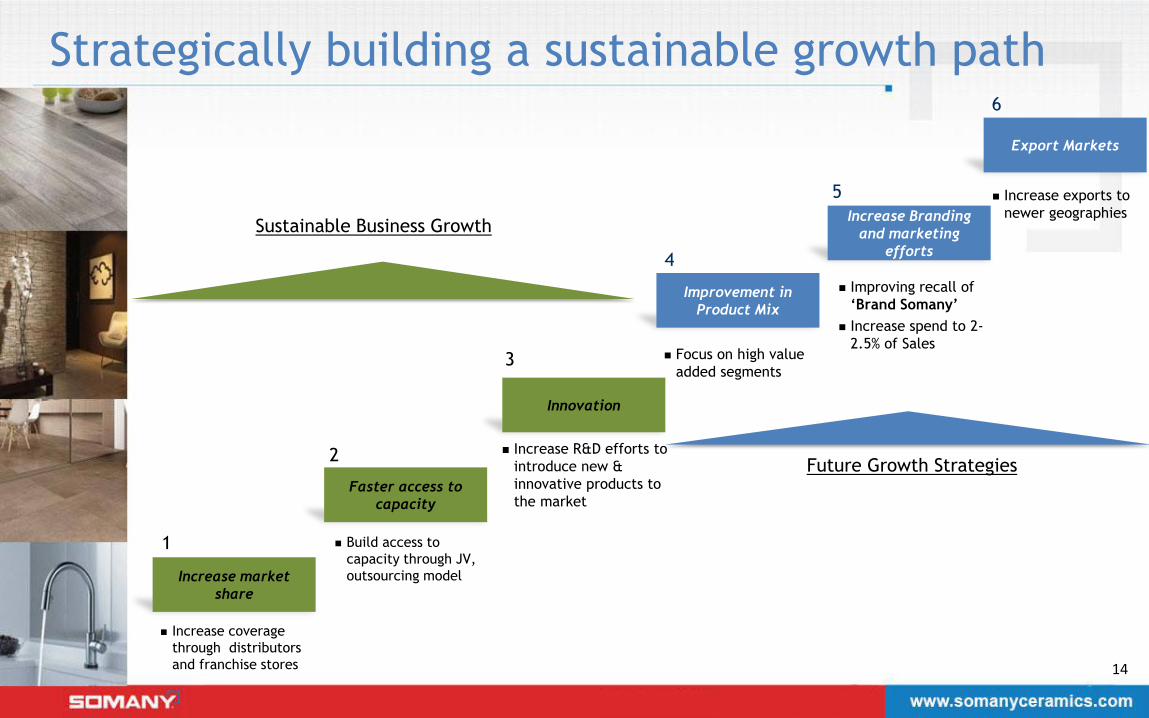
Improvement in
Product Mix
Increase coverage
through distributors
and franchise stores
Build access to
capacity through JV,
outsourcing model
Focus on high value
added segments
1
2
3
4
Innovation
Faster access to
capacity
Increase market
share
Increase Branding
and marketing
efforts
Improving recall of
‘Brand Somany’
Increase spend to 2-
2.5% of Sales
5
Future Growth Strategies
Sustainable Business Growth
Increase R&D efforts to
introduce new &
innovative products to
the market
Export Markets
Increase exports to
newer geographies
6
Strategically building a sustainable growth path

Disclaimer
The information contained herein has been prepared to assist prospective investors in making their own
evaluation of the Company and does not purport to be all-inclusive or to contain all of the information a
prospective or existing investor may desire.
This Information may include certain statements and estimates provided by the Company with respect to the
projected future performance of the Company. Such statements, estimates and projections reflect various
assumptions by management concerning possible anticipated results, which assumptions may or may not be
correct.
Prospective investors will be expected to have conducted their own due diligence investigation regarding
these and all other matters pertinent to investment in the Company.
This presentation may contain statements that are “forward looking statements.” The company’s actual future
results may differ materially from those suggested by such statements, depending on various factors for which
the company and its management does not take any responsibility.
15
Company : Investor Relations Advisors :
Somany Ceramics Ltd. CIN - L40200DL1968PLC005169 Mr. R. K. Lakhotia, VP – Finance [email protected] www.somanyceramics.com
Strategic Growth Advisors Pvt. Ltd. CIN - U74140MH2010PTC204285 Mr. Shogun Jain/Ms. Sanjita Ghosh [email protected] / [email protected] www.sgapl.net
For further information, please contact: