some concepts in reaction dynamics · some concepts in reaction dynamics nobel lecture, december 8,...
TRANSCRIPT

SOME CONCEPTS IN REACTION DYNAMICS
Nobel lecture, December 8, 1986.
byJOHN C. POLANYI
Department of Chemistry, University of Toronto, Toronto M5S 1Al. Canada
The objective in this work has been one which I have shared with the two other1986 Nobel lectures, D. R. Herschbach and Y. T. Lee, as well as with a widegroup of colleagues and co-workers who have been responsible for bringing thisfield to its current state. That state is summarized in the title; we now havesome concepts relevant to the motions of atoms and molecules in simplereactions, and some examples of the application of these concepts. We are,however, richer in vocabulary than in literature. The great epics of reactiondynamics remain to be written. I shall confine myself to some simple stories.
1 . EXPERIMENTAL AND THEORETICAL APPROACHES.In this section I shall say something about the experimental and theoreticaltools we have used, and give some indication of their origins.
Our principal experimental method has been the study of infrared chemilu-minescence. The most valuable theoretical tool has been, and remains, thecomputer-integration of the classical equations of motion. Though both of thesemethods belong to the modern period of reaction dynamics, both have clearantecedents in earlier times.
Infrared chemiluminescence derives from the presence of vibrationally ex-cited molecules in the products of reaction. Indirect evidence for the existenceof such species was obtained by M. Polanyi and his co-workers in 1928 in thecourse of studies of the reactions of alkali metal atoms and halogens [1].Following a suggestion by Bates and Nicolet [2], and by Herzberg [3], McKin-ley, Garvin, and Boudart [4] looked for and found visible emission fromvibrationally excited hydroxyl radicals formed in the reaction of atomic hydro-gen with ozone. This finding was followed soon after by the identification, byabsorption spectroscopy, of vibrational excitation in the products of the reac-tions of atomic oxygen with NO2 and ClO2 [5] .
Reference [5] appeared in the year that, in collaboration with J. K. Cashion,we undertook to look for infrared chemiluminescence from vibrationally excitedhydrogen halides (and other hydrogen containing compounds) formed in sim-ple exchange and addition reactions. The first reaction studied was that ofatomic hydrogen with molecular halogens [6, 7]. Infrared emission was ob-served in the region 1.5-4.5 µm arising from the low-pressure (~10 -l t o r r )room temperature reaction,

360 Chemistry 1986
At that date there was lively discussion of the possibility of a visible analogue ofthe maser, that would operate on population-inverted electronic states (aworking laser was still in the future) [8]. Given our interests it was natural tospeculate about the properties of a vibrational laser. In our communication(“Proposal for an Infrared Laser Dependent on Vibrational Excitation”) [9]we pointed to a number of virtues of such a device, of which we shall note twohere.
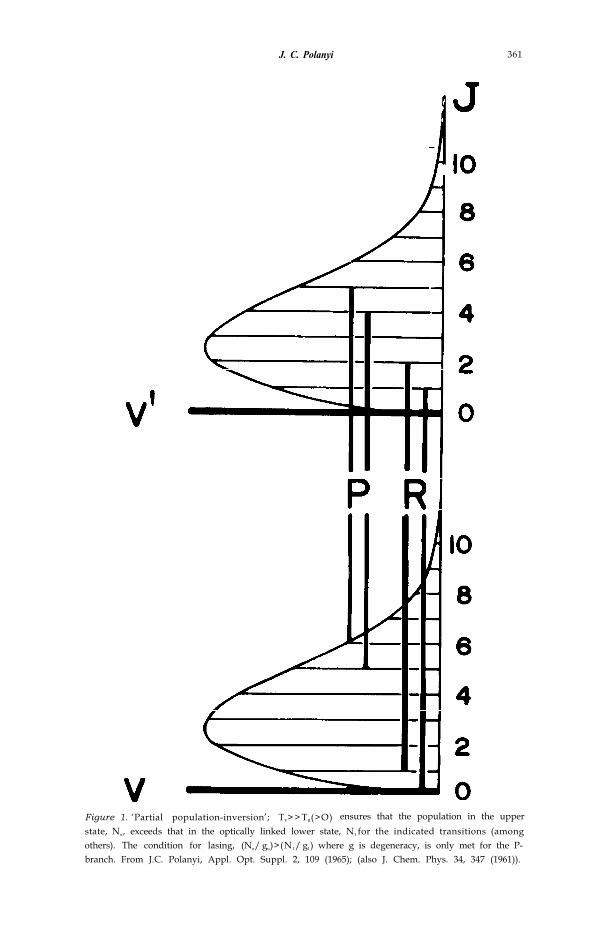
(1) Provided that the vibrational temperature, Tv, sufficiently exceeds therotational temperature, TR, (both temperatures being positive, in contrast tothe negative temperatures associated with population inversion in the discus-sions of that date) a large number of P-branch transitions will exhibit popula-tion inversion (fig. 1). We gave the name `partial population inversion’ to thisphenomenon, and noted that lasing based on partial population inversioncould ensue shortly after a thermal pulse (arising from a pulsed arc, or shockwave), since ‘partial cooling’ would ensure Tv >> TR. (2) A chemical reactioncould be used to obtain either ‘partial’ or ‘complete’ population inversion. Wewere struck by the fact that the upper atmosphere could constitute a naturallaser in the infrared favoured by its long path length and large number ofpartially population inverted transitions [9, 10].
Vibrational lasing was first achieved by Pate1 and co-workers [11]. Chemicalreaction as the working material in a vibrational laser followed shortly after-ward, through the work of Pimentel and his associates [12]. In both cases themajor contribution to lasing came from partial population inversion, as indicat-ed by the predominance of P-branch emission.
In our first communication regarding infrared chemiluminescence, we ex-pressed the view that the method “promises to provide for the first timeinformation concerning the distribution of vibrational and possibly rotationalenergy among the products of a three-centre reaction” [6]. This outcome wasnot so readily achieved.
By 1962 it was evident that reaction (1), despite the fact that it had proved tobe a ready source of infrared chemiluminescence, converted its heat of reactioninto vibration with the modest efficiency of ≤50% [13]. This finding met withscepticism, since it was pointed out, correctly, that it implied for the reverseendothermic process that one could have so much vibration in the reagents thatthe reaction probability would be markedly diminished [14]. The somewhatlame reply at that date was that “though odd, it could still be the case” [15].
Today we would surmise that it is the case since for the endothermic processCl + + H a heavy particle (Cl) must approach during the brief timethat the H-Cl bond remains extended; too much vibrational excitation canhave the consequence that the Cl + HCl interaction is averaged over manyvibrational periods, resulting in an ‘adiabaticity’ with respect to the flow ofenergy into the bond to be broken. At that date the importance of the relativetiming of molecular motions (though recognised for other types of inelasticencounters) had not yet been documented for chemical reactions.
J. C. Polanyi 361
Figure 1. ‘Partial population-inversion’; TV> > TR(>O) ensures that the population in the upperstate, Nu, exceeds that in the optically linked lower state, N1 for the indicated transitions (amongothers). The condition for lasing, (Nu/ gu)>(N1/ g1) where g is degeneracy, is only met for the P-branch. From J.C. Polanyi, Appl. Opt. Suppl. 2, 109 (1965); (also J. Chem. Phys. 34, 347 (1961)).
362 Chemistry 1986
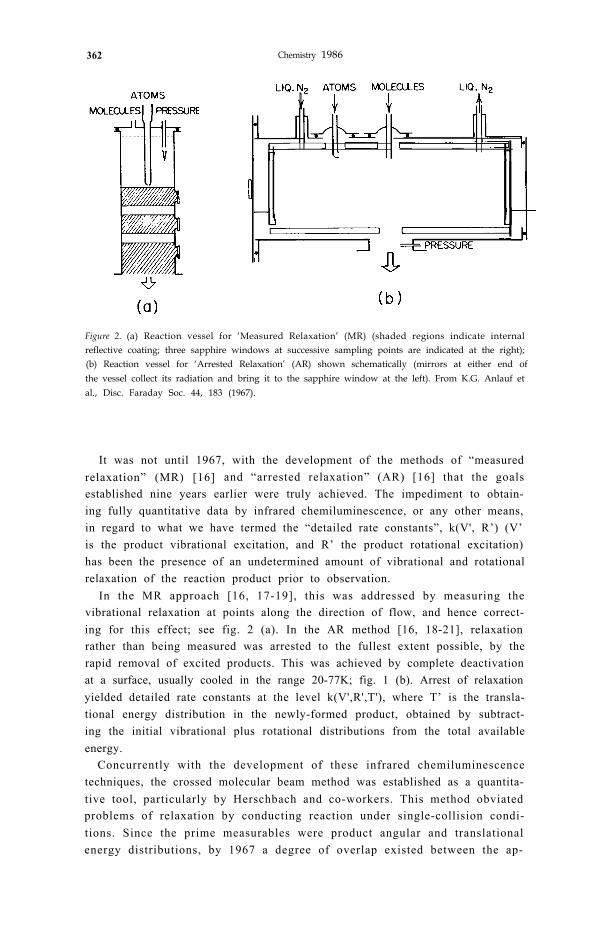
Figure 2. (a) Reaction vessel for ‘Measured Relaxation’ (MR) (shaded regions indicate internalreflective coating; three sapphire windows at successive sampling points are indicated at the right);(b) Reaction vessel for ‘Arrested Relaxation’ (AR) shown schematically (mirrors at either end ofthe vessel collect its radiation and bring it to the sapphire window at the left). From K.G. Anlauf etal., Disc. Faraday Soc. 44, 183 (1967).
It was not until 1967, with the development of the methods of “measuredrelaxation” (MR) [16] and “arrested relaxation” (AR) [16] that the goalsestablished nine years earlier were truly achieved. The impediment to obtain-ing fully quantitative data by infrared chemiluminescence, or any other means,in regard to what we have termed the “detailed rate constants”, k(V', R’) (V’is the product vibrational excitation, and R’ the product rotational excitation)has been the presence of an undetermined amount of vibrational and rotationalrelaxation of the reaction product prior to observation.
In the MR approach [16, 17-19], this was addressed by measuring thevibrational relaxation at points along the direction of flow, and hence correct-ing for this effect; see fig. 2 (a). In the AR method [16, 18-21], relaxationrather than being measured was arrested to the fullest extent possible, by therapid removal of excited products. This was achieved by complete deactivationat a surface, usually cooled in the range 20-77K; fig. 1 (b). Arrest of relaxationyielded detailed rate constants at the level k(V',R',T'), where T’ is the transla-tional energy distribution in the newly-formed product, obtained by subtract-ing the initial vibrational plus rotational distributions from the total availableenergy.
Concurrently with the development of these infrared chemiluminescencetechniques, the crossed molecular beam method was established as a quantita-tive tool, particularly by Herschbach and co-workers. This method obviatedproblems of relaxation by conducting reaction under single-collision condi-tions. Since the prime measurables were product angular and translationalenergy distributions, by 1967 a degree of overlap existed between the ap-
J. C. Polanyi 363
proaches. It was not, however, until the incorporation of universal detectors byLee and Herschbach, following what we have come to know as the ‘alkali age’of beam chemistry, that the same systems could be studied by both infraredchemiluminescence and molecular beam scattering.
By the t ime that the f i rs t quant i ta t ive data began to appear , powerfultheoretical tools were available which could be used to link the potential fieldoperating between atoms A, B, and C in a reaction
In parallel with Blais and Bunker [26] our laboratory [27] employed Wall’s,Hiller’s and Mazur’s approach in an attempt to map out the major determi-nants of A + BC reaction dynamics. Both groups were inspired by the proposalmade by M. G. Evans and M. Polanyi [28], over two decades earlier, thatvibration in a newly-formed bond might originate from the release of reactionenergy as the reagents approached. Detailed computation indicated that thissuggestion embodied an important kernel of truth, though the full story, asmight have been expected, revealed a substantially richer range of scenarios.
2 . ENERGY DISTRIBUTION AMONG REACTION PRODUCTS2.1 ExperimentIn the MR method (see previous section), several observation windows forrecording infrared ( ir) chemiluminescence were located along the l ine ofstreaming flow. Provided that the observation windows were situated at dis-tances corresponding to times during which relaxation was moderate, a simplegraphical extrapolation back to zero time yielded adequate values for therelative k(v') (v’ is the vibrational quantum number corresponding to theproduct vibrational energy V’) [16, 17]. Detailed numerical analyses were alsomade, which included the effects of reaction, diffusion, flow, radiation, andcollisional deactivation [17]. A model of this sort permitted, in effect, a moreintelligent extrapolation to time t=0.
Subsequently the flow-tube approach was applied to the determination ofvibrational energy distributions in a substantial number of infrared chemi-luminescent reactions, particularly by Setser and his co-workers [29] and byKaufman [30]. Infrared chemiluminescence experiments in flow tubes havealso been extended to the elucidation of product energy-distributions from ion-molecule reactions [31].
In the A. R. method two uncollimated beams of reagent met in the centre of avessel, exhibiting a background pressure, with reagents flowing, of ~ 10-4- 10-5
torr. Reaction occurred at the intersection of the beams (as demonstrated in ref.[18]). The products of reaction were transferred, following a few secondary
364 Chemistry 1986
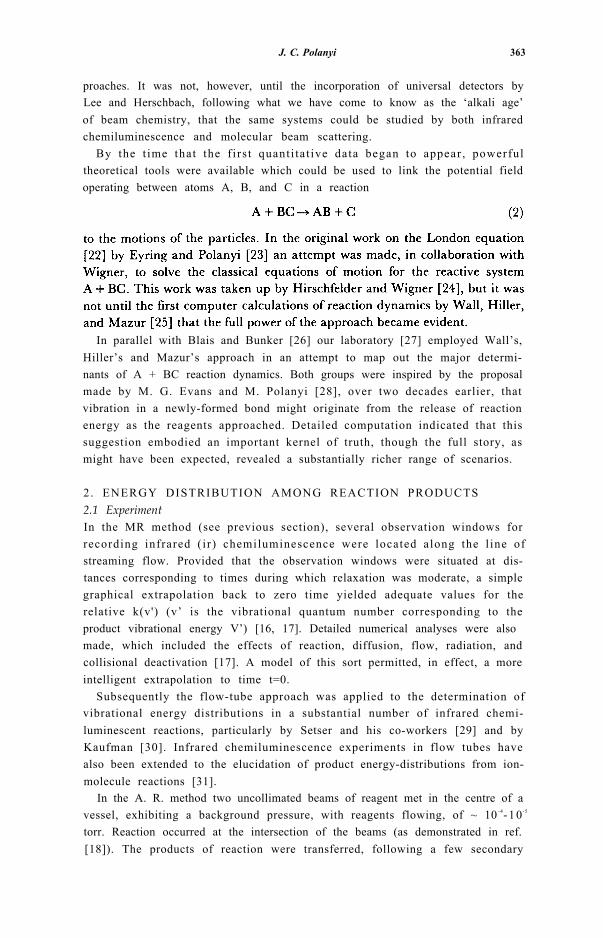
Figure 3. Semi-logarithmic plot of the probability that a fraction fv, of the energy in the products ofthe reaction H+Cl2+ HCI+Cl enters vibration in the newly-formed bond. The data were obtainedindependently by the MR and AR methods, as indicated. The vibrational quantum states v' = l-6correspond to the values of fv, indicated by arrows across the centre of the figure. From K.G.Anlauf et al., Disc. Faraday Soc. 44, 183 (1967).
collisions, to a deactivating surface which surrounded the reaction zone. De-pending on the reagents, this surface acted as a cryo-pump, as a getter pump(trapping non-condensibles in excess condensible), or simply as an adsorbercapable of bringing about complete vibrational deactivation (adsorbing prod-uct for a time sufficient to deactivate the material to its ground vibrationalstate, v=0).
The infrared chemiluminescence stemming from the small fraction of mole-cules that emitted early in their lifetimes, was collected by gold front-surface

365
mirrors, freshly coated for each experiment; this procedure increased theeffective solid angle being viewed by almost 50x [32]. By this means ~ 10 -9 torrof vibrationally excited product could be detected in one v, J (vibrational)state, using the liquid-nitrogen cooled PbS semiconductor detectors that be-came available in the late 1950’s. The emission spectrum (fig. 3) was recordedin early work on a (NaCl, then LiF) prism spectrometer, later on a gratingspectrometer and (from the early 1970’s, for e. g. [33]) on a variety of Fouriertransform interferometric spectrometers.
The AR method was adopted by several laboratories, notably N. Jonathan’s[34], D.W. Setser’s [35], and J.D. McDonald’s [36]. It is characterised bymolecular flow of the reactants and hence low densities in the reaction zone,permitting observation of reaction products with highly non-Boltzmann rota-tional distribution, as well as non-Boltzmann vibrational distributions.
The effectiveness of the combination of molecular flow plus rapid removal ofreaction products in reducing relaxation to an insignificant amount in themajority of systems studied was indicated by the fact that the steady-statedistribution observed under these conditions was in satisfactory agreementwith the initial vibrational distribution obtained by the MR method, (fig. 4)and the observed rotational distribution was largely unrelaxed, (fig. 5) indicat-ing that collisional deactivation of vibrators-generally a less efficient process -was insignificant. In the case of a few very fast reactions (notably F + HBr HF + Br [29]) k(v') from MR were at variance with those from AR. At the lowflows used in the AR machine, it appears that reaction and deactivation were

366
0
Figure 5. Solid lines record the decreasing contribution of the peak at low J’ to the observedrotational distribution (for H+Cl2+HCI(v' = 2, J')+Cl) as the pressure in the beam-crossingregion is decreased (in the sequence in an A.R. vessel. The broken lines superimposed onthe solid lines give relaxed distributions computed from 3. Based on fig. I of J.C. Polanyi and K:B.Woodall, J. Chem. Phys. 56, 1563 (1972).
occurring within the inlets, invalidating the results [37]; in such a case the ARrotational distributions were also found to have been relaxed [38].
The observed rotational distributions were typically bimodal, comprising anon-thermal distribution at high rotational quantum number (high J’) and athermal distribution peaking at low J’. The contribution of the peak at low J’relative to that at high J’ decreased with diminishing pressure in the reactionzone (fig. 5). Accordingly the low J’ peak was ascribed to collisional relaxation,the relaxation mechanism being analyzed in detail [39].
Some detailed rate constants, k(v'), for the reaction

J. C. Polanyi 367
unobservable. Also included are the findings from crossed-molecular beamstudies performed in Y.T. Lee’s laboratory. In these demanding experimentsthe vibrational distribution was obtained from structure in the product transla-tion energy-distribution, which was the measured quantity (the findings are forsomewhat different reagent energy distributions than for the other experimentstabulated). The reaction F + H2 HF + H is of considerable fundamentalinterest since it involves only 11 electrons, and should therefore be amenable toab initio computation (see below). The agreement between determinations ofk(v') is satisfactory.
When these experiments and those described below were undertaken, quan-titative data regarding k(v') did not exist. The prior observation of highlyvibrationally excited reaction products noted in section 1, since it was aqualitative finding, left open the question of the form of k(v') which could havepeaked anywhe re f rom v '=0 t o v '=v 'm a x (the highest accessible vibrationalstate). In fact the distributions observed by ir chemiluminescence were found

368 Chemistry 1986
Figure 6. ‘Triangle plot’ for H+Cl2HCI+Cl reaction showing the distribution of vibrational,rotational, and translational energy as contours of equal detailed rate constant k(V’,R’,T’). Theordinate is product vibrational energy, and the abscissa is the product rotational energy. Since thetotal available energy is approximately constant (E’tot = 48.4 kcal/mole), translational energy, T’,given by the broken diagonal lines, increases to 48.4 kcal/mole at V’ = 0, R’ = 0. The rate constantkf= k(v’) = the subscript f denotes the ‘forward’, exothermic, direction. Contours havebeen normalized to k(v’) = 1.00 where v’is the most-populated vibrational level. From K.G.Anlaufet al., J. Chem. Phys. 57, 1561 (1972).
An early finding was that the product vibrational energy distribution k(v')altered dramatically with isotopic substitution, but was roughly invariant ifrepresented in the reduced form k(f'v) [41]. This is what one would expect ifclassical mechanics applied rather than conservation laws involving quantumstates. The finding gave us courage in applying classical mechanics to thesereactions (despite the fact that they were characterised by widely spaced

J. C. Polanyi 369
Figure 7. Triangle plot for H+F (see caption to fig. 6). E’tot = 102 kcal/mole for thisreaction. From J.C. Polanyi and J.J. Sloan, J. Chem. Phys. 57, 4988 (1972).
vibrational and rotational states), and also encouraged us to record our resultsin a graphical form that rode rough-shod over the quantised nature of k(v'J').
Four examples of the graphs that we have used (as a supplement to thetabulation of the actual k(v'J') values) as an aid to the visualisation of theexperimentally determined product energy distributions, are shown in figs. 6-9. By interpolation between permitted combinations of V',R', and T’, weobtain contours of equal k(V',R',T'). In these “triangle plots” contours areshown in V',R',T' space. They delineate a “hill” of detailed rate constant inthat space. Portions of the hill that lie between vibrational energy states aremerely included to guide the eye as to the breadth and shape of the productenergy distribution over the axis’ corresponding to V',R' and T’. Since classi-cal mechanics is widely used in order to interpret energy distributions, theseclassical “fingerprints” of differing chemical reactions help us to picture con-trasting types of behaviour.

370 Chemistry 1986
Figure 8. Triangle plot for F+H2 (see caption to fig. 6). E’tot = 34.7 kcal/mole for thisreaction. From J.C. Polanyi and K.B. Woodall, J. Chem. Phys. 57, 1574 (1972).
It is readily apparent that the first two reactions, H + Cl 2 and H + F2 (figs.6 and 7), though they liberate markedly different energies, both exhibit ineffi-cient vibrational and rotational excitation and consequently efficient transla-t ional excitat ion. The third reaction, F + H 2 (fig. 8), gives rise to highlyefficient vibrational excitation together with inefficient rotational excitation.The fourth reaction pictured, Cl + Hl (fig. 9), combines efficient vibrationalexcitation with exceptionally efficient rotational excitation (< fR' > = 0.13 forCl + Hl in contrast to < fR' > = 0.03 for H+F2). In concurrent work, alludedto in the following section, we linked these changes in dynamics to the release ofrepulsive energy in systems having differing mass combination and preferredgeometries of the intermediate.
The ridge of the “detailed rate constant hill” is almost vertical in the case ofthe first reactions, moving out to higher R’ at lower V’ in the fourth of ther eac t i ons p i c tu r ed (C l + H1) , ( for a tabulat ion of mean < fv' > <fR ' >,< fT' >, and the slope of the ridge for these reactions see table IV of

J. C. Polanyi 371
Figure 9. Triangle plot for Cl+HI+HCI+I. See caption to fig. 7. E’ tot = 34 kcal/mole. .. From D.H.Maylotte et al., J. Chem. Phys. 57, 1547 (1972).
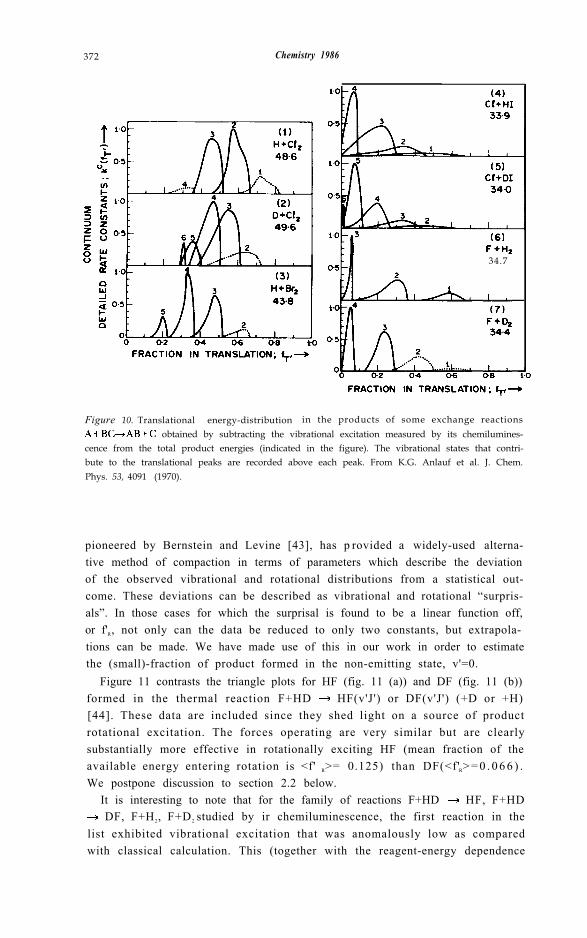
ref. [21]) leaving aside the dynamical implications of this distinctive behaviour(see 2.2 below). It is noteworthy that successively lower vibrational statesexhibit marked increases in translational energy in the first three cases, but asomewhat overlapped “translational energy spectrum” in the fourth case. Thisfinding was seen to have interesting implications for the crossed molecularbeam chemistry in which T’ (as already noted) is the prime measurable. Figure10 gives sample distributions over fT' (blending rotational states into a contin-uum, since they cannot be resolved in molecular beam time-of-flight (tof)studies). The reaction H + F2, not pictured here, gives rise to eight well-resolved translational peaks (fig. 5 of [21]). In the case of the F + H2 reactionand its isotopic analogues in addition to resolving these peaks by tof, Y.T. Lee’slaboratory have in recent times fully characterised the angular distribution ofeach [42].
The triangle plots, exemplified in figs. 6-9, constitute one way of “compact-ing” the substantial data embodied in k(v 'J ' ,T ') . The information-theory,
372 Chemistry 1986
34.7
Figure 10. Translational energy-distribution in the products of some exchange reactions obtained by subtracting the vibrational excitation measured by its chemilumines-
cence from the total product energies (indicated in the figure). The vibrational states that contri-bute to the translational peaks are recorded above each peak. From K.G. Anlauf et al. J. Chem.Phys. 53, 4091 (1970).
pioneered by Bernstein and Levine [43], has p rovided a widely-used alterna-tive method of compaction in terms of parameters which describe the deviationof the observed vibrational and rotational distributions from a statistical out-come. These deviations can be described as vibrational and rotational “surpris-als”. In those cases for which the surprisal is found to be a linear function off,or f'R, not only can the data be reduced to only two constants, but extrapola-tions can be made. We have made use of this in our work in order to estimatethe (small)-fraction of product formed in the non-emitting state, v'=0.
Figure 11 contrasts the triangle plots for HF (fig. 11 (a)) and DF (fig. 11 (b))formed in the thermal reaction F+HD HF(v'J') or DF(v'J') (+D or +H)[44]. These data are included since they shed light on a source of productrotational excitation. The forces operating are very similar but are clearlysubstantially more effective in rotationally exciting HF (mean fraction of theavailable energy entering rotation is <f' R>= 0.125) than DF(<f'R> = 0 . 0 6 6 ) .We postpone discussion to section 2.2 below.
It is interesting to note that for the family of reactions F+HD HF, F+HD DF, F+H2, F+D2 studied by ir chemiluminescence, the first reaction in the
list exhibited vibrational excitation that was anomalously low as comparedwith classical calculation. This (together with the reagent-energy dependence

J. C. Polanyi 373
Figure 11. Triangle plots for both branches of the F+HD exchange reaction. The total availableenergy in the products was taken to be E’tot = 34.3 kcal/mole for the HF product, and E'tot = 36.1kcal/mole for DF, in calculating product translation T’. From D.S. Perry and J.C. Polanyi, Chem.Phys. 12. 419 (1976).
374 Chemistry 1986
2 . 4
- 0 . 8
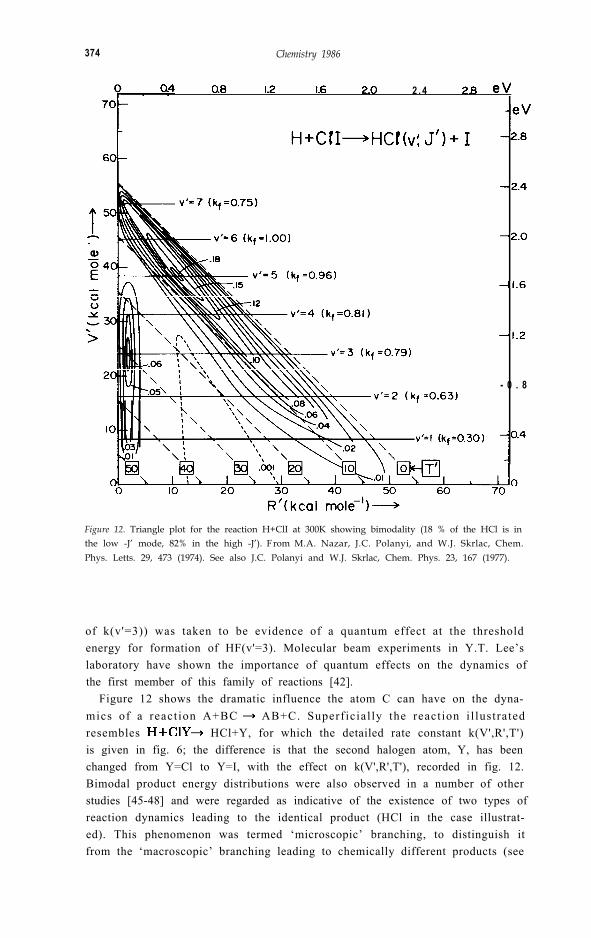
Figure 12. Triangle plot for the reaction H+ClI at 300K showing bimodality (18 % of the HCl is inthe low -J’ mode, 82% in the high -J’). F rom M.A. Nazar, J.C. Polanyi, and W.J. Skrlac, Chem.Phys. Letts. 29, 473 (1974). See also J.C. Polanyi and W.J. Skrlac, Chem. Phys. 23, 167 (1977).
of k(v'=3)) was taken to be evidence of a quantum effect at the thresholdenergy for formation of HF(v'=3). Molecular beam experiments in Y.T. Lee’slaboratory have shown the importance of quantum effects on the dynamics ofthe first member of this family of reactions [42].
Figure 12 shows the dramatic influence the atom C can have on the dyna-mics of a react ion A+BC AB+C. Superficial ly the react ion i l lustratedresembles HCl+Y, for which the detailed rate constant k(V',R',T')is given in fig. 6; the difference is that the second halogen atom, Y, has beenchanged from Y=Cl to Y=I, with the effect on k(V',R',T'), recorded in fig. 12.Bimodal product energy distributions were also observed in a number of otherstudies [45-48] and were regarded as indicative of the existence of two types ofreaction dynamics leading to the identical product (HCl in the case illustrat-ed). This phenomenon was termed ‘microscopic’ branching, to distinguish itfrom the ‘macroscopic’ branching leading to chemically different products (see
J. C. Polanyi 375
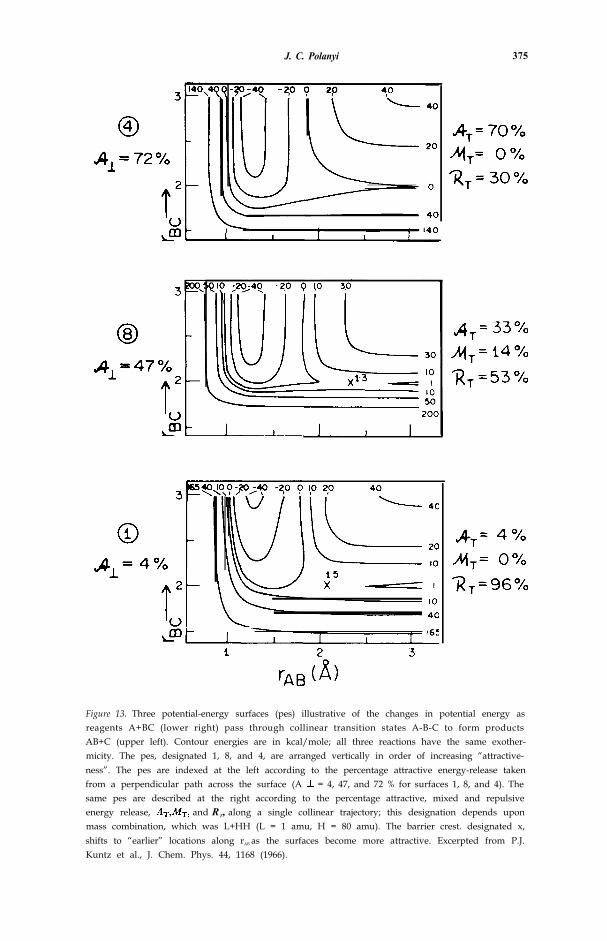
Figure 13. Three potential-energy surfaces (pes) illustrative of the changes in potential energy asreagents A+BC (lower right) pass through collinear transition states A-B-C to form productsAB+C (upper left). Contour energies are in kcal/mole; all three reactions have the same exother-micity. The pes, designated 1, 8, and 4, are arranged vertically in order of increasing “attractive-ness”. The pes are indexed at the left according to the percentage attractive energy-release takenfrom a perpendicular path across the surface (A = 4, 47, and 72 % for surfaces 1, 8, and 4). Thesame pes are described at the right according to the percentage attractive, mixed and repulsiveenergy release, and RT, along a single collinear trajectory; this designation depends uponmass combination, which was L+HH (L = 1 amu, H = 80 amu). The barrier crest. designated x,shifts to “earlier” locations along rAB as the surfaces become more attractive. Excerpted from P.J.Kuntz et al., J. Chem. Phys. 44, 1168 (1966).
376 Chemistry 1986
for example fig. 11). As we shall indicate in section 2.2, these two types ofbranching are linked.
It is interesting to consider the strengths and weaknesses of ir spectroscopyas a tool in the s tudy of react ion dynamics. The major l imitat ions havestemmed from the low transition probabilities in the ir, the insensitivity of irdetectors, and the lack of a sufficiently precise timescale against which tomeasure the vibrational and especially rotational relaxation. Substantial im-provements in sensitivity have been achieved using the important new methodsof laser-induced fluorescence (LIF) [48] and resonantly enhanced multiphotonionization (REMPI) [49]. However, since these make use of electronic transi-tions, they cannot so readily scan the full manifold of product vibrotationalenergy states to yield data as complete as that exemplified in figs. 7-9, whichremains the most complete available.
Tunable ir lasers, combined with adequate time-resolution, could give a newlease of life to the vibrotational spectroscopy of reaction products. A promisingdevelopment employing ir chemiluminescence is the introduction of time-resolved fourier transform spectroscopy following the pulsed photolytic initi-ation of exchange reaction [50].
2.2 TheoryThe origin of these theoretical studies is outlined in section 1, above. In theearly 1960’s two groups [26, 27] became interested in using the computer-based classical trajectory method [25] (often called the Monte Carlo approach)to explore, for the first time, a suggestion made over two decades earlier [28],that energy released as reagents approach is responsible for vibration in thenewly-formed bond.
Figure 13 shows three potential-energy surfaces (pes), all of a modifiedLondon, Eyring, Polanyi, Sato (LEPS) variety [27, 52, 53], selected from awider group examined in ref. [53]. T he energy released as the reagents ap-proached (termed the attractive energy release, and defined as or AT [ 5 3 ,54]; see the caption of fig. 13) increases as one moves upwards in the figure.There is, in related families of reaction, a concurrent diminution in the heightof the energy-barrier, and a shift of the barrier to earlier locations along thecoordinate of approach with increased A. It has proved possible to give anempirical expression to these correlations [55, 56].
In fig. 14 it can be seen that for a group of 8 pes moderate percentages ofenergy release along the coordinate of approach (% A ⊥) are converted quanti-tatively into product vibration for a particular reagent mass combination(L+HH; see caption). For high % the reaction moves into a new regime inwhich product vibration decreases with increased attractive energy release.Examination of the trajectories indicates that a transition is occurring frompredominantly direct reaction (products once they start to separate continue todo so [57]) to indirect reaction in which subsequent “clutching” and “clouting”secondary encounters drain the incipient vibration out of the new bond intorotation and translation [58, 59], What we are seeing is the onset of statistical

J C. Polanyi
Figure 14. Mean vibrational excitation in the products of 3D L+HH reaction on 8 potential energyhypersurfaces (pes) plotted against the perpendicular attractive energy-release, AΙ. The collinearcuts through pes 1,8, and 4 are to be found in the previous figure. The fall-off in <E’v> at high A is due to the prevalence of secondary encounters (see text). From P.J. Kuntz et al., J. Chem. Phys.44, 1168 (1966).
behaviour, in the limit of which product vibration will receive no more than itsmodest equipartition allocation.
At the other end of the scale in fig. 14, where repulsive energy-releasepredominates, the low vibrational excitation shown in the figure is by no meansthe rule; the observed vibrational excitation is strongly dependant on the chosenmass-combination. The L+HH mass combination shown is in fact anomalousin fulfilling the initial expectation that repulsive energy-release R (energyreleased along the coordinate of separation of the pes) will be inefficientlychannelled into vibration. For L+HH the attacking atom A approaches BCrapidly up to the normal bonding separation before the repulsion is released(dynamics in which rAB decreases to its equilibrium separation, r0
A B, and only
378 Chemistry 1986
then does rBC increase, correspond on the pes to a rectilinear path). Since therepulsion operates on an already existent AB bond, vibrational excitation isindeed inefficient (left end of fig. 14). This behaviour is sufficiently atypical tobe described as the “light-atom anomaly” [53].
For the more general case of a heavier at tacking atom relat ive to themolecule under attack, the new bond is still extendend (r A B > r0
A B at the timethat the bulk of the repulsion is released; we can symbolise this as A- -B . C.In this case repulsion between the separating atoms B and C results in recoil ofB, rather than of AB as a whole; i.e. it gives rise to efficient internal excitation ofthe new bond, AB.
Since the solution of the collinear equations of motion can be pictured interms of the motion of a sliding mass across a suitably scaled and skewedrepresentation of the pes, it is instructive to consider the characteristic pathacross the pes in the latter more general case. The fact that r AB decreases at thesame time as rBC increases (we term the energy-released in this phase, “mixed”;M) means that the sliding mass, rather than following a rectilinear path, iscutting the corner of the pes. Instead, therefore, of approaching the exit valleyfrom its head, it approaches the valley from the side; consequently it oscillatesfrom side to side of the exit valley indicating that the new bond is vibrationally-excited.
The proportion of the energy released during corner-cutting is clearly re-levant to the efficiency with which the repulsive energy is channelled intovibration. We have determined the extent of mixed energy-release, M T, from aspecimen collinear trajectory employing the appropriate mass-combinationand the pes in question [10, 53, 60]. F gi ure 13 shows that % M T is insignificantfor L+HH . For other mass-combinations it is so great that the points on a plotof the type shown in fig. 14 begin at substantial <E'v>, and the region oflinearity prior to the fall-off in < E'v > due to the onset of indirect dynamicsbecomes a very short region (see the case of the heavy attacking atom in fig. 7 of[53]).
Turning to the experimental findings of 2.1, it was evident that the moderatemean fractional conversion of reaction energy into product vibration, <f'v>,could be explained either by a highly attractive interaction leading to secon-dary encounters, or by a predominantly repulsive energy-release. The first ofthese alternatives appeared implausible since it implied a substantially broaderdistribution over product vibrational and also rotational states than was ob-served [16]. Instead the evidence favoured a strongly repulsive pes, with thel ight-atom anomaly explaining the markedly reduced <f 'v> for H+X2 a sc o m p a r e d w i t h X + H2 or X+HY, and the lower barrier leading to a slightlyincreased AI in H+Br2 a s c o m p a r e d w i t h H + C l2 (cf . the correlat ion notedabove) accounting for the greater <f'v> observed for H+Br2 than for H+Cl2
[16].The success of a strongly repulsive pes in accounting for the general form of
the triangle plot for Cl+Hl HCl + I is illustrated, by way of an example, infig. 15 [61], which should be compared with fig. 9 above. Similar success hasbeen obtained for the reaction F+H2, HF+H (fig. 8) above using a strongly

J.C. Polanyi 379
repulsive pes [62-64]. In this case there is now dependable evidence from ab initio
varational treatments of FHH [65, 66] that the energy-release is indeed substantially
repulsive. The success of a repulsive pes in describing L+HH dynamics will be
demonstrated (for H+F2 HF+F; cf. fig. 7 above) in section 3.2 below.
The discussion of the previous paragraphs as it relates to repulsive energy-release is
summarized pictorially in fig. 16. Though visualisation of reaction dynamics is
generally, and often adequately, based on the collinear pes to which the sliding-mass
analysis applies, tests of the validity of pes’ are made by 3D trajectories.
Product rotational excitation is eliminated from the picture in the collinear world.
Though this is a minor constituent of the product energy, it is revealing of the
dynamics. In the visualisation of fig. 16, we have included the effect of

repulsive energy release in bent configurations as one source of product rota-tion. The experimental data in the triangle plots of fig. 11 give persuasiveevidence of the significance of this effect in the important reaction F+H 2.Product repulsion would be expected [47, 67] on the basis of momentumconservation to give rise to decreasing <f'R> in the series FH . D > FH . H >F D > FD H (the dot indicated the locus of the repulsion); this is foundtheoretically, in 3D trajectory studies, and also experimentally. The triangleplots of fig. 11 correspond to the extremes of this range of isotopic mass-combinat ions; <f 'R> for the FH . D pathway substantially exceeds that for
Qualitative pictures of the type given in fig. 16 suggest simple models of thereactive event. Several such models are indicated in fig. 17, all of which stressthe role of the forces operating along the coordinate of separation of the pes.The implications of each of these models are discussed in ref. [59]. Despite theircrudity simple models have the important virtue that their “moving parts” areopen to inspection. Model (c), called the Simple Harmonic model, has been

Figure 17. Five types of simple “product-force models”, that interpret product energy-distributionsin terms of the mode of relaxation of ABC in its retreat from the activated Arepulsive force is assumed to be located between the separating atoms B.C. Various assumptionsare made regarding the bond A-B which is forming. Model (a) is the Impulsive model, (b) is theConstant Force model, (c) is the Simple Harmonic model, (d) is the DIPR (Direct Interaction withProduct Repulsion) model, and (e) is the FOTO (Forced Oscillation in a Tightening Oscillator)model. From J.C. Polanyi, Faraday Disc. Chem. Soc., 55, 389 (1973).
382 Chemistry 1986
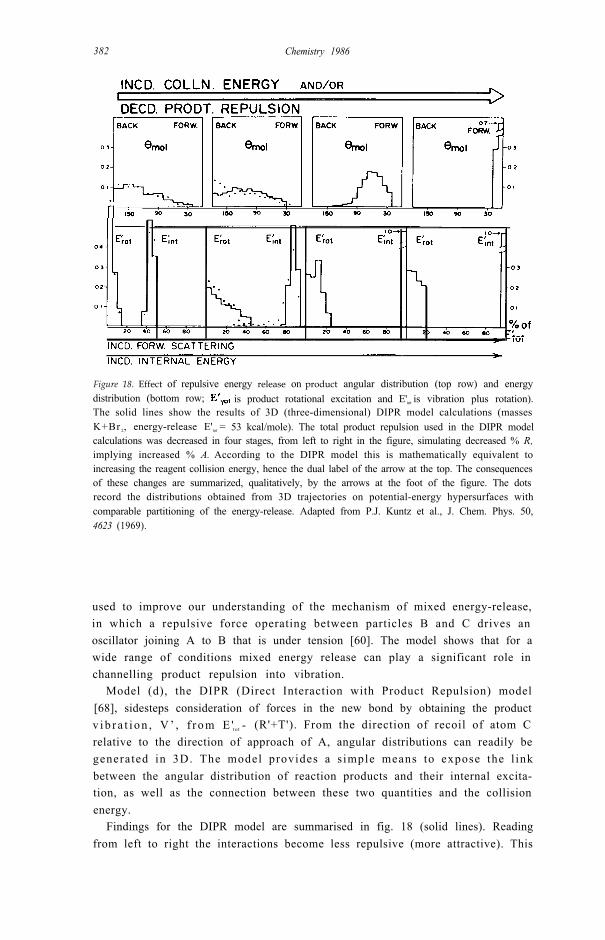
Figure 18. Effect of repulsive energy release on product angular distribution (top row) and energydistribution (bottom row; is product rotational excitation and E'int is vibration plus rotation).The solid lines show the results of 3D (three-dimensional) DIPR model calculations (massesK+Br 2, energy-release E'tot = 53 kcal/mole). The total product repulsion used in the DIPR modelcalculations was decreased in four stages, from left to right in the figure, simulating decreased % R,implying increased % A. According to the DIPR model this is mathematically equivalent toincreasing the reagent collision energy, hence the dual label of the arrow at the top. The consequencesof these changes are summarized, qualitatively, by the arrows at the foot of the figure. The dotsrecord the distributions obtained from 3D trajectories on potential-energy hypersurfaces withcomparable partitioning of the energy-release. Adapted from P.J. Kuntz et al., J. Chem. Phys. 50,4623 (1969).
used to improve our understanding of the mechanism of mixed energy-release,in which a repulsive force operating between particles B and C drives anoscillator joining A to B that is under tension [60]. The model shows that for awide range of conditions mixed energy release can play a significant role inchannelling product repulsion into vibration.
Model (d), the DIPR (Direct Interaction with Product Repulsion) model[68], sidesteps consideration of forces in the new bond by obtaining the productv i b r a t i o n , V ’ , f r o m E 'tot - (R'+T'). From the direction of recoil of atom Crelative to the direction of approach of A, angular distributions can readily begenerated in 3D. The model provides a s imple means to expose the l inkbetween the angular distribution of reaction products and their internal excita-tion, as well as the connection between these two quantities and the collisionenergy.
Findings for the DIPR model are summarised in fig. 18 (solid lines). Readingfrom left to right the interactions become less repulsive (more attractive). This
J. C. Polanyi 383
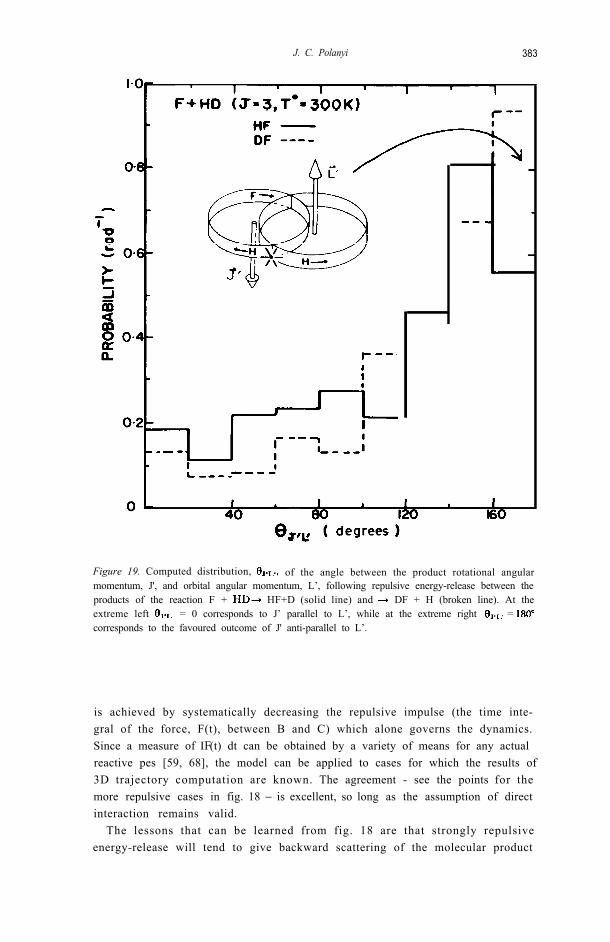
Figure 19. Computed distribution, of the angle between the product rotational angularmomentum, J', and orbital angular momentum, L’, following repulsive energy-release between theproducts of the reaction F + HF+D (solid line) and DF + H (broken line). At theextreme left = 0 corresponds to J’ parallel to L’, while at the extreme right = corresponds to the favoured outcome of J' anti-parallel to L’.
is achieved by systematically decreasing the repulsive impulse (the time inte-gral of the force, F(t), between B and C) which alone governs the dynamics.Since a measure of IF(t) dt can be obtained by a variety of means for any actualreactive pes [59, 68], the model can be applied to cases for which the results of3D trajectory computation are known. The agreement - see the points for themore repulsive cases in fig. 18 − is excellent, so long as the assumption of directinteraction remains valid.
The lessons that can be learned from fig. 18 are that strongly repulsiveenergy-release will tend to give backward scattering of the molecular product

384 Chemistry 1986
REACTION
Figure 20. Pictorial representation of the alternative dynamics - direct and indirect - in the micro-scopic branching underlying the bimodality of product energy distribution exemplified in fig. 12.(Based on a classical trajectory study; J.C. Polanyi et al., Faraday Disc. Chem. Soc. 67, 66 (1979)).
Herschbach and co-workers have injected physical content into the DIPRmodel in their DIPR-DIP extension, in which the repulsive impulse is assumedto be “Distributed as In Photodissociation” [69]. The model then accountsnicely for product distributions observed in a number of reactions. Morerecently Zare’s laboratory has shown how the DIPR approach can be used tounderstand the plane of rotation of new-born reaction products [70].
The FOTO (Forced Oscillation in a Tightening Oscillator) model [71], item(e) of fig. 17, gives a fuller rendition of the forces on a collinear pes; the B repulsion operates on an AB oscillator whose force constant is in the process ofincreasing, and whose equilibrium separation, is decreasing. The model,which has been applied to ten reactions for which experimental or theoreticaldata exist, is sufficiently complete to embody analogues of the “attractive”,“mixed”, and “repulsive” phases of energy-release.
To the extent that the rotation in a newly-formed reaction product ABoriginates in repulsion the rotational motion should be coplanar withthe repulsive force, and B in AB should recoil away from C. This implies thatthe angle between the product rotational angular momentum vector, J', andthe product orbital angular momentum vector, L’, should be 180° .
J. C. Polanyi 385
0
Analyses of product distributions from 3D trajectory studies [64,72] bear thisout. Experimental studies of correlations between such vector attributes willadd materially to the mosaic from which our picture of reaction dynamics iscomposed.
The richer the detail in the rate constants k(V', R’, T’), the clearer themessage. The striking bimodality in the product energy-distribution fromH + ClI J’) + I recorded in fig. 12 can be ascribed to “microscopicbranching”; two patterns of molecular dynamics result in the formation of thesame reaction product (HCI in this example). The dynamics have been ex-plored in 3D. They are shown schematically in fig 20. In the case of H + ClI themigratory microscopic pathway (at the right of fig. 20) is thought to dominate.This is for the same reason that macroscopic branching favours formation of HIrather than HCl, namely the existence of a smaller energy barrier for approach
386 Chemistry 1986
from the I end of ICl (see [73] for the greater stability of ClIH than HClI). Incollisions of H with the I end of ICl that fails to yield HI, the H atom canmigrate to the Cl end of the molecule to yield highly internally-excited HCl.The HCl product with low internal excitation comes from H that have reacteddirectly at the Cl end of ClI. Since the barrier to this mode of reaction is higher,the yield (at normal reagent energies) is lower. It is evident that the relativeyields of HCl and HI in macroscopic branching are linked to the yields of lowE ’int and high E'int HCl by way of microscopic branching.
Microscopic branching is thought to constitute more than merely an interest-ing curiosi ty, s ince i t can contr ibute to the dynamics in any case wheremacroscopic branching is possible - a large class of reactions. As would beexpected, the importance of microscopic branching, in common with macro-scopic branching, depends sensitively on the reagent energy [49, 50, 74].
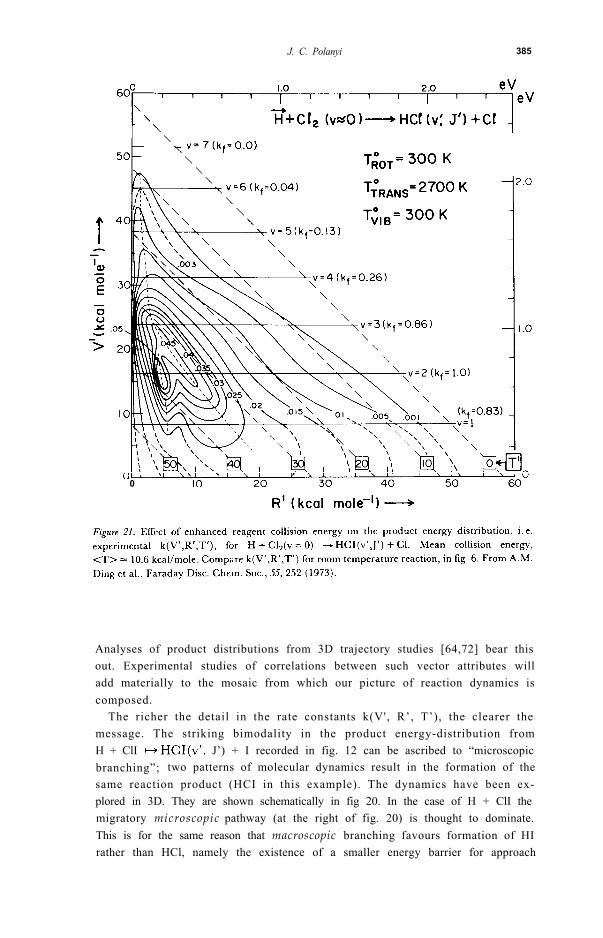
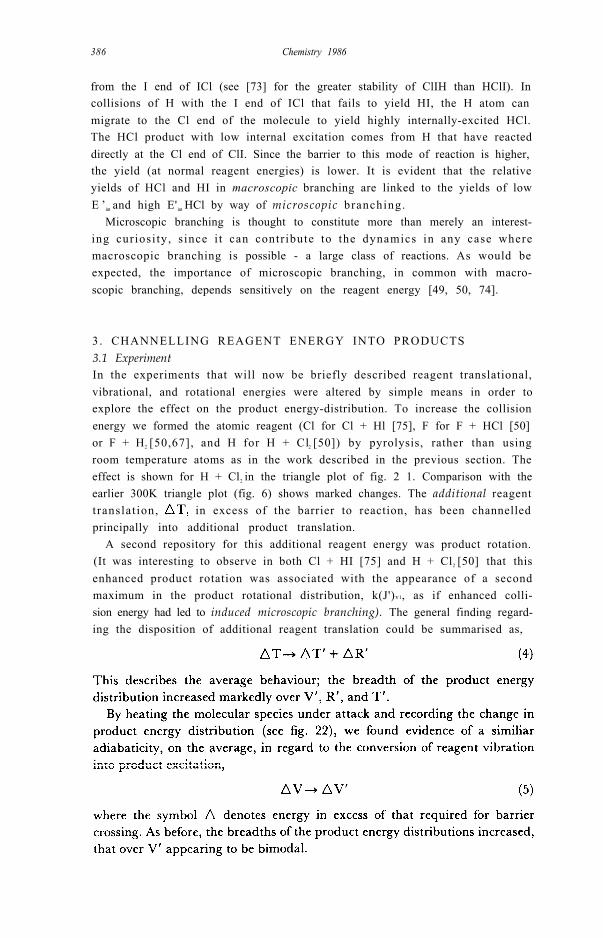
3 . CHANNELLING REAGENT ENERGY INTO PRODUCTS3.1 ExperimentIn the experiments that will now be briefly described reagent translational,vibrational, and rotational energies were altered by simple means in order toexplore the effect on the product energy-distribution. To increase the collisionenergy we formed the atomic reagent (Cl for Cl + Hl [75], F for F + HCl [50]or F + H2 [50,67], and H for H + Cl2 [50]) by pyrolysis, rather than usingroom temperature atoms as in the work described in the previous section. Theeffect is shown for H + Cl2 in the triangle plot of fig. 2 1. Comparison with theearlier 300K triangle plot (fig. 6) shows marked changes. The additional reagenttranslat ion, in excess of the barrier to reaction, has been channelledprincipally into additional product translation.
A second repository for this additional reagent energy was product rotation.(It was interesting to observe in both Cl + HI [75] and H + Cl2 [50] that thisenhanced product rotation was associated with the appearance of a secondmaximum in the product rotational distribution, k(J')v1, as if enhanced colli-sion energy had led to induced microscopic branching). The general finding regard-ing the disposition of additional reagent translation could be summarised as,

J C. Polanyi 387
1.0
A more stringent test of this tendency toward vibrational adiabaticity wasobtained using the method of ir chemiluminescence depletion (CD; section 4.1below) and ir emission. Vibrationally excited reagent, OH(v), was formed in aselected “pre-reaction”. Pulses of a further reagent - Cl in the present case -were introduced, and a record was made of the depletion of chemiluminescence(at the pulsing frequency) in OH(v), as well as of the appearance of chemilu-minescence in reaction product HCl(v'). The reaction responsible for bothemissions was
388 Chemistry 1986
Figure 23. Experimental evidence for the conversion of high reagent vibrational excitation into thecorresponding degree of freedom of the product in the reaction Cl + OH(vJ) HCI(v'J') + O.The curves at the left show the decrease in population of each OH vibrotational level resulting fromthe introduction of Cl atoms; the curves at the right were taken from a concurrent record of theamount of HCl formed in each vibrotational level. In experiment 1 (top of figure), the OH wasformed in v = 6-9 by the pre-reaction H + O3. In experiment 2 (lower part of figure), the OH wasformed in v = 1-3 by the pre-reaction H + NO2. The numbers in the boxes at the left give therelative fractional depletions of each OH v-level (summed over J), and those at the right give thecorresponding information for the product HCI. From B.A. Blackwell et al., Chem. Phys. 24, 25(1977).

J. C. Polanyi 389
Figure 24. Computed triangle plots for the H + F2 reaction. In (a) the reagents were Monte Carloselected from a 300K Boltzmann distribution. In (b) the F2 reagent vibrational excitation, V, wasincreased to v = 4 (reagent collision energy 2.0 kcal/mole), and in (c) the reagent relative transla-tional energy, T, was increased to 11.43 kcal/mole (reagent vibrational energy corresponded tov = 0). From J.C. Polanyi et al., Chem. Phys, 9, 403 (1975).

390 Chemistry 1986
Evidence regarding the fate of reagent rotation was more fragmentary,coming from studies of the reaction F + H2(J) with J varied systematically from
1 2 [77]. A small but significant decrease was observed in the fraction ofthe total energy entering product vibration when J = 1, followed by anincrease in this fraction as J = 1 2. This finding was in accord with an earlierless detailed study by Coombe and Pimentel [78]. As is often the case at presentwith the effects of reagent rotation (see 4.2 below), detailed understanding islacking.
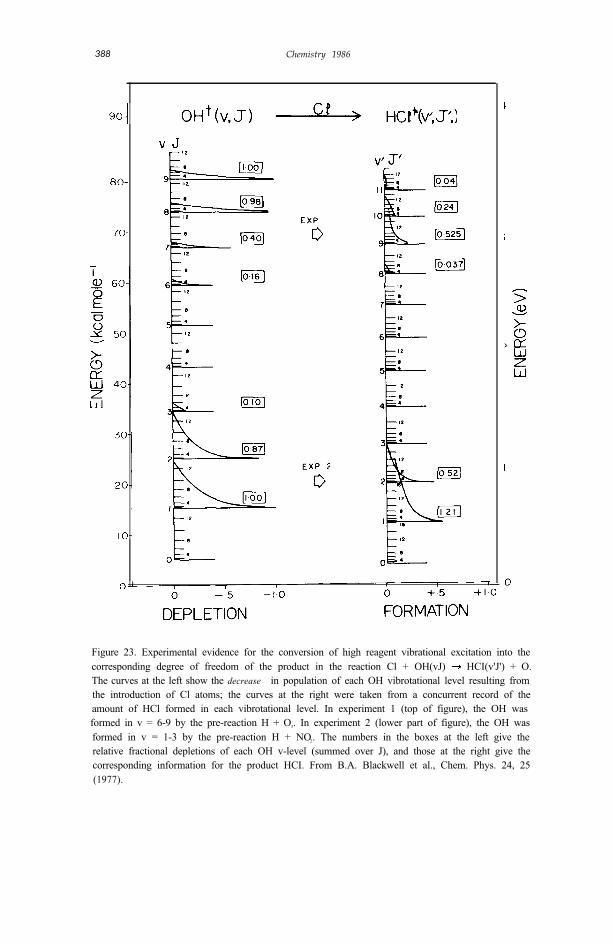
3.2 TheoryThe nature and the origins of the approximate adiabaticity relations (4) and(5) have been discussed in a number of places [49,50,54,61,67,79-82]. Thesuccess of the 3D classical trajectory method in describing the types of changein detailed rate constant observed experimentally (see figs. 21 and 22) can bejudged from fig. 24 [81]. This figure shows a computed triangle plot for the300K H + HF(v'J') + F reaction at the centre (see fig. 7 for the experi-mental counterpart), and the predictions for enhanced reagent translation (ref.[82] fig. 3 has the experimental counterpart) and vibration, below and aboverespectively. It is evident from inspection of fig. 24 that AT’ + AR’,and In addition the increased breadths of product energy distri-butions over T’ and R’ in the former case, and over V’ in the latter areapparent, as also is the bimodality over V’ resulting from enhanced V. (See[50] for comparable trajectory studies using parameters chosen for H + Cl 2).
The origin of this adiabaticity is evident from an inspection of trajectorieswith and without the additional reagent energy. The effect of enhanced transla-tion is to shift the characteristic pathway across the collinear pes (used as adiagnostic of 3D behaviour) toward more-compressed configurations - the slid-ing mass impelled by i ts enhanced momentum along r A B caroms into thecorner of the pes in the region of in fig. 25. The compressed intermediate
C if collinear then flies apart to give translation in AB + C, and if bent togive enhanced rotation in AB. For enhanced reagent vibration the most com-mon paths to product are shifted to the region in fig. 25; the effect is tofavour a more stretched intermediate A-B-C that pulls together along r A B t ogive AB(v 0) + C. The opposite phase of vibration to that pictured in fig. 25,drives the intermediate into region giving rise to the low V’ peak in theproduct distribution. Since energy released along rBC has been characterised asrepulsive and that along rA B as attractive, we have termed these changes indynamics induced repulsive energy-release in the first case, and induced attractiveenergy-release in the second. For a strongly exothermic reaction such as H + F2
(fig. 24), these shifts affect not only the channelling of the additional reagentenergy, but also the channelling of the exothermicity into product excitation, sothat + and exceed unity [81].
J. C. Polanyi
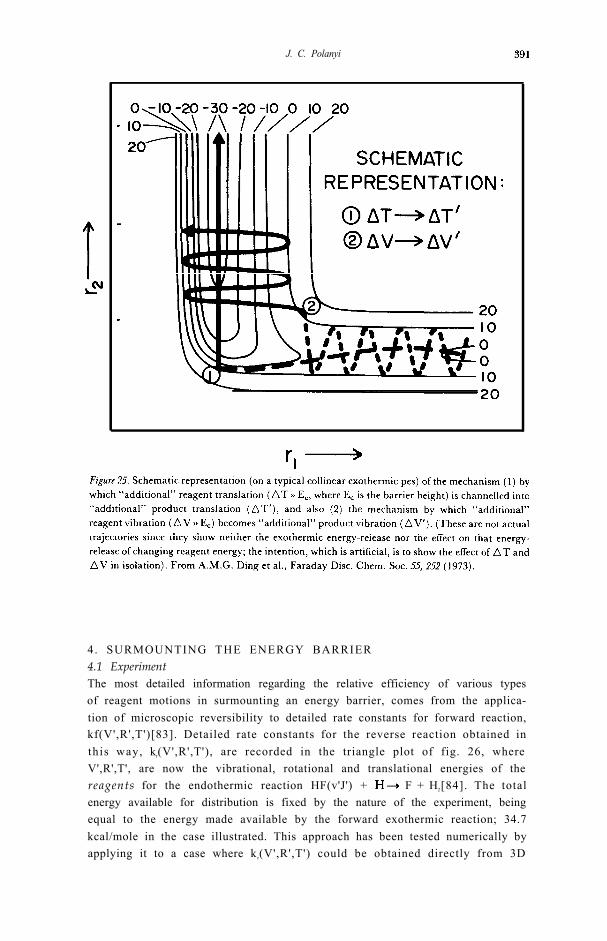
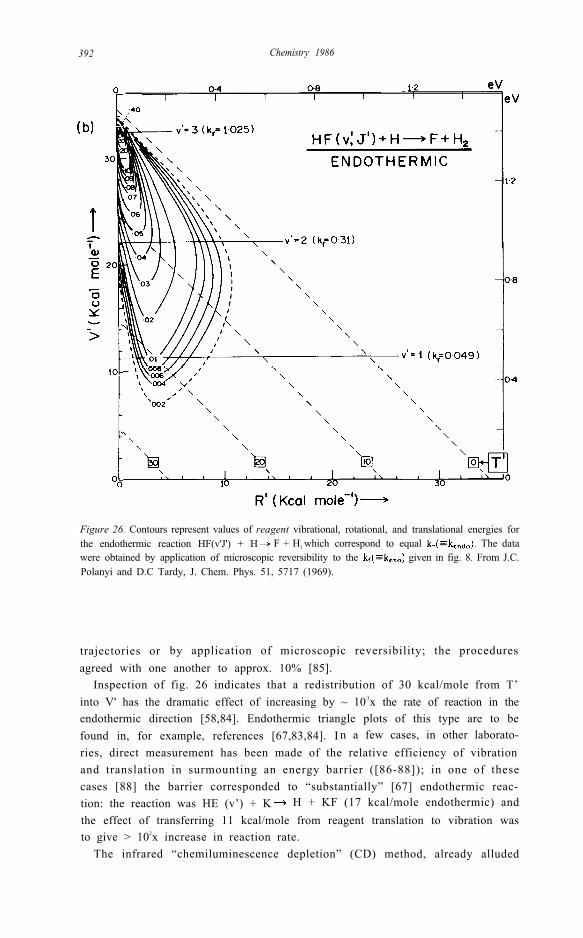
4. SURMOUNTING THE ENERGY BARRIER4.1 ExperimentThe most detailed information regarding the relative efficiency of various typesof reagent motions in surmounting an energy barrier, comes from the applica-tion of microscopic reversibility to detailed rate constants for forward reaction,kf(V',R',T')[83]. Detailed rate constants for the reverse reaction obtained inthis way, kr(V',R',T'), are recorded in the triangle plot of fig. 26, whereV',R',T', are now the vibrational, rotational and translational energies of thereagents for the endothermic reaction HF(v'J') + F + H2[84]. The totalenergy available for distribution is fixed by the nature of the experiment, beingequal to the energy made available by the forward exothermic reaction; 34.7kcal/mole in the case illustrated. This approach has been tested numerically byapplying it to a case where kr(V',R',T') could be obtained directly from 3D
392 Chemistry 1986
Figure 26. Contours represent values of reagent vibrational, rotational, and translational energies forthe endothermic reaction HF(v'J') + H F + H2 which correspond to equal The datawere obtained by application of microscopic reversibility to the given in fig. 8. From J.C.Polanyi and D.C Tardy, J. Chem. Phys. 51, 5717 (1969).
trajectories or by application of microscopic reversibility; the proceduresagreed with one another to approx. 10% [85].
Inspection of fig. 26 indicates that a redistribution of 30 kcal/mole from T’into V' has the dramatic effect of increasing by ~ 10 3x the rate of reaction in theendothermic direction [58,84]. Endothermic triangle plots of this type are to befound in, for example, references [67,83,84]. I n a few cases, in other laborato-ries, direct measurement has been made of the relative efficiency of vibrationand translation in surmounting an energy barrier ([86-88]); in one of thesecases [88] the barrier corresponded to “substantially” [67] endothermic reac-tion: the reaction was HE (v’) + K H + KF (17 kcal/mole endothermic) andthe effect of transferring 11 kcal/mole from reagent translation to vibration wasto give > 102x increase in reaction rate.
The infrared “chemiluminescence depletion” (CD) method, already alluded

J. C. Polanyi 393
6
Figure 28. A portion (one fifth) of the spectrum recorded in an ir chemiluminescence depletion (CD)study of the endothermic reaction HCl(v' = 1-4) + B Cl + HBr. At the top (labelled N) is theemission from the HCl(v' = l-4) formed in a pre-raction. Below (∆N) is the concurrent record ofthe depletion, due to pulses of Br (trace enlarged 2.5x). The fraction for (Excursions of above the baseline can be identified with product emission (HBr(v=1,2)rather than reagent depletion.) From DJ. Douglas et al., J. Chem. Phys.. 59, 6679 (1973).
394 Chemistry 1986
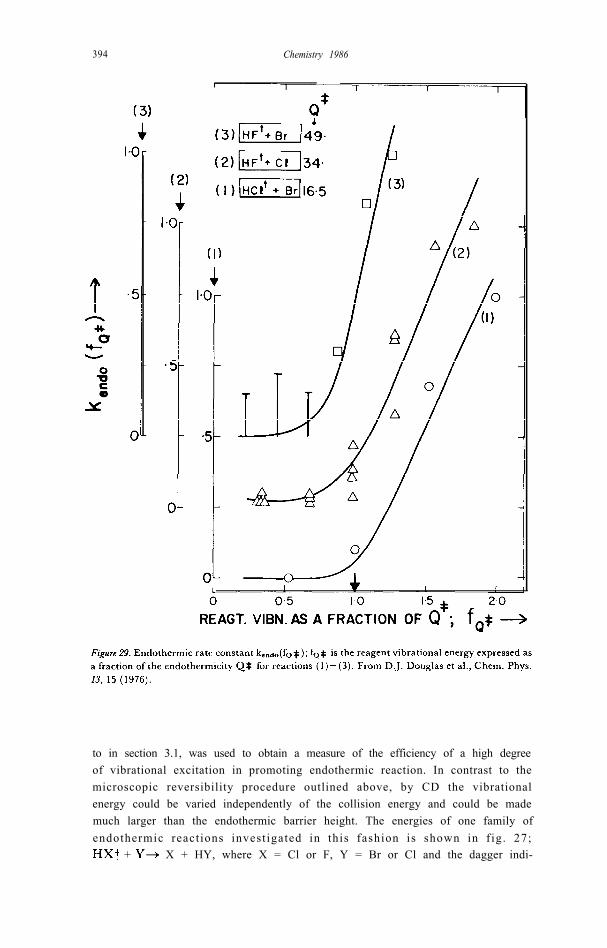
to in section 3.1, was used to obtain a measure of the efficiency of a high degreeof vibrational excitation in promoting endothermic reaction. In contrast to themicroscopic reversibility procedure outlined above, by CD the vibrationalenergy could be varied independently of the collision energy and could be mademuch larger than the endothermic barrier height. The energies of one family ofendothermic react ions invest igated in this fashion is shown in f ig. 27;
+ X + HY, where X = Cl or F, Y = Br or Cl and the dagger indi-
J C. Polanyi 395
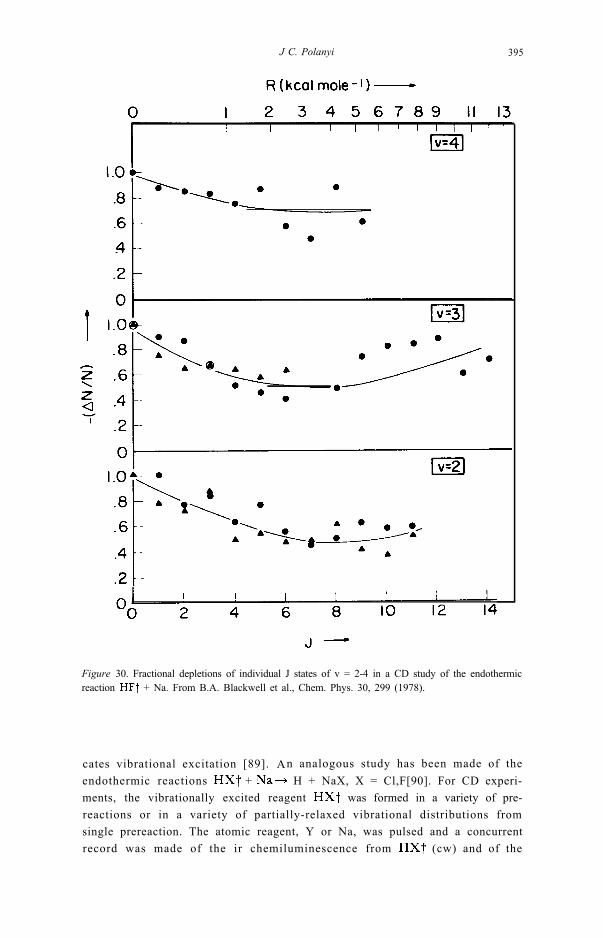
Figure 30. Fractional depletions of individual J states of v = 2-4 in a CD study of the endothermicreaction + Na. From B.A. Blackwell et al., Chem. Phys. 30, 299 (1978).
cates vibrational excitation [89]. An analogous study has been made of theendothermic reactions + H + NaX, X = Cl,F[90]. For CD experi-ments, the vibrationally excited reagent was formed in a variety of pre-reactions or in a variety of partially-relaxed vibrational distributions fromsingle prereaction. The atomic reagent, Y or Na, was pulsed and a concurrentrecord was made of the ir chemiluminescence from (cw) and of the
396 Chemistry 1986
depletion (CD was measured on an amplifier locked to the pulsing frequency ofthe Y or Na beam).
A small portion of the concurrent spectral traces from an experiment onHCl(v'J') + Br [89] is given in fig. 28. The fractional depletions (aN(v’J’)/N(v 'J ' ) ) , which should be independent of N(v 'J ' ) , gave a measure of theendothermic ra te constant , kendo(v'J'). Values of kendo(v ' ) (summed over J’ )are shown plotted against the reagent energy expressed as a fraction of theendothermic barrier height, Q # in fig. 29 [89]. The onset of k endo is marked foreach reaction by a threshold at the expected Q # (Q#= 16.5, 34 and 49 kcal/mole for the reactions indicated in the figure). The reagent translation energycorresponded to 300K; it follows that approx. 95% of the reagent energy waspresent as vibration. Calibrations showed that the reactive cross section forhigh v’, exceeded i.e. the collision efficiencies for reaction approached-0.1. With an analogous preponderance of vibrat ion in the reagents of
the collision efficiences approached unity [90]. We conclude thatvibrational excitation is highly efficient in carrying these reactions over theirendothermic energy-barriers.
The CD approach was also used to map out the dependence of reaction rateon reagent rotational excitation. The results shown in fig. 30 for the endother-mic processes are typical of the findings from CD.Comparable results were obtained (by a cruder approach) for the exothermicreaction [50]. There is an initial decline in reaction probabilitywith increasing J, followed by a rise in reaction probability. Similar behaviourhas been noted in crossed beam experiments [92,93]. Nonetheless our knowl-edge of k(J) leaves much to be desired.
4.1 TheoryWe have found it useful and revealing to link the preferred type of reagentenergy-distribution to the location of the energy-barrier on the collinear pes(termed a “diagnostic cut” through the full hypersurface which gives the 3Ddynamics). In the first approximation we have looked for a correlation betweenthe dynamics of barrier-crossing and the location of the barrier crest relative tothe point at which the entry and exit valleys of the pes may be said to meet onthe collinear pes, namely the equal-stretch configuration, for which rA B-
[94]. Duff and Truhlar [95] have examined an alternativedefinition of the point where entry and exit valleys meet, namely the point ofmaximum curvature, C*, of the minimum-energy path across the collinear pes(a concept pre-figure in work of Hofacker and Levine [96]). Since the twobonds change length with minimum expenditure of energy at their maximumextension, it is understandable that [97].
Figure 31 shows the dynamics characteristic of equal masses reacting acrossa pes with “early barrier” (surface I), at the left, and “late barrier” (surface II)at the right [94]. The barrier crest was located approx. 0.03 Å ahead of onsurface I, and 0.03 Å beyond on II (these surfaces are designated + I and +II in fig. 31. since the labels -I and -II were used for potential hollows similarly

J. C. Polanyi 397
Figure 31. At the left (a) and (b) hs ow specimen trajectories with (a) largely reagent translation(T = 9,V = 0) and (b) largely reagent vibration (T = 1.5 and V = 14.5) on an “early barrier”surface, i. e., type I. At the right (c) and (d) show trajectories with (c) largely reagent vibration(T = 1.5 and V = 7.5) and (d) largely reagent translation (T= 16.0, V = 0). All energies are kcal/mole; reagent vibration relative to E(v=0). Three equal masses, mA = mB = mC . Positive andnegative vibrational phases in solid and broken lines. Barrier heights on both surfaces I and II are 7kcal/mole; contours are labelled in kcal/mole. From J.C. Polanyi and W H. Wong, J. Chem. Phys.51, 1439 (1969).
displaced from [58]). The effect of these displacements of the barrier crestupon the preferred mode of motion in the reagents was dramatic. As illustratedin fig. 32, on surface I a reagent translational energy only slightly in excess ofthe 7 kcal/mole barrier height gave a calculable cross section, whereas areagent vibrational energy double the barrier height gave a reactive crosssection too small to be computed in our study. The converse behaviour is seen
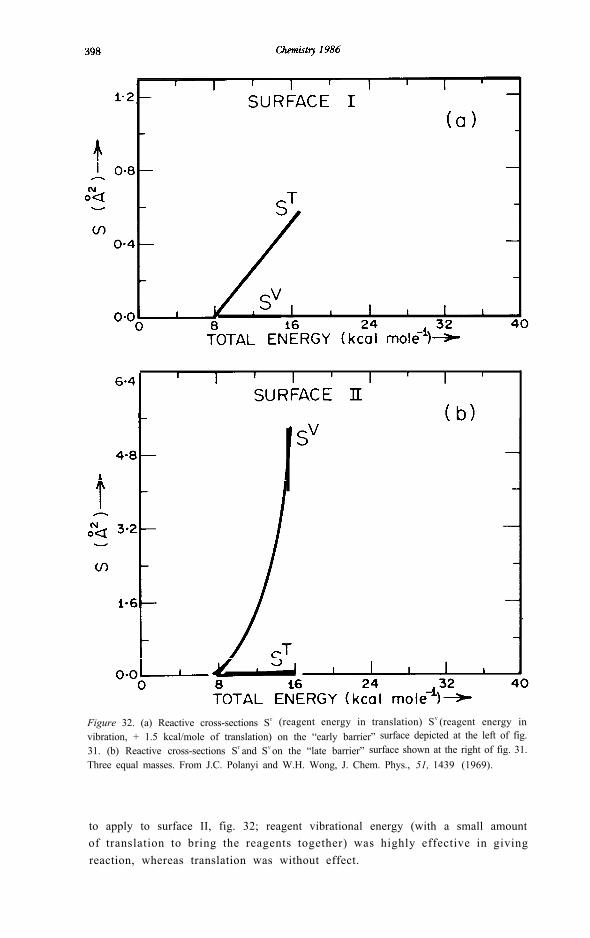
Figure 32. (a) Reactive cross-sections ST (reagent energy in translation) SV (reagent energy invibration, + 1.5 kcal/mole of translation) on the “early barrier” surface depicted at the left of fig.31. (b) Reactive cross-sections ST and SV on the “late barrier” surface shown at the right of fig. 31.Three equal masses. From J.C. Polanyi and W.H. Wong, J. Chem. Phys., 51, 1439 (1969).
to apply to surface II, fig. 32; reagent vibrational energy (with a small amountof translation to bring the reagents together) was highly effective in givingreaction, whereas translation was without effect.

J. C. Polanyi 399
As we have remarked, these correlations are of more than empirical value; byfocussing attention on certain simple attributes of the pes, we can shed lightupon dominant features of the dynamics. In terms of the dynamics of thereaction A + BC the correlations noted in the preceding paragraph reduce tothe proposition that a barrier predominantly along the coordinate of approach,r A B, is best t raversed by motion in that same coordinate, namely reagenttranslation, whereas a barrier predominantly along the coordinate of separa-tion, rB C, is best traversed by motion in that coordinate, i.e., vibration in thebond under attack. The trajectories in fig. 31 (obtained by solution of theequatons of motion, but capable of being pictured as the motion of a slidingmass across the pes) illustrate this; the reactive cases are (a) and (c) (early andlate barriers), the nonreactive are (b) and (d) (early and late barriers oncemore). The effect illustrated is sufficiently striking that it may also haverelevance to the dynamics of reactions involving many atoms (cf. [99]), pro-vided that these occur by a direct pathway.
The interest of these correlations is greatly increased if we can link the formof the pes to the nature of the chemical reaction. Though unrecognised byreaction dynamicists, Hammond’s postulate [100] that for endothermic reac-tions the transition state resembles reaction products might have pointed theway to the desired connection.
Instead a systematic study of a considerable number of exchange reactionsA + + C in terms of both the London, Eyring, Polanyi, Sato (LEPS),and the Bond-Energy Bond-Order (BEBO) methods led to the conclusion thatfor substantially exothermic reactions the barrier-crest is located in the en-trance valley (“early barrier”) of the pes, and for substantially endothermicreactions it is in the exit valley (“late barrier”) [55]. From this, and thedynamical study of early and late barriers, it followed (as previously surmised[101]) that the favoured degree of freedom for barrier-crossing in substantiallyexothermic reactions would be translation, whereas reagent vibration would bemost effective in giving rise to substantially endothermic reaction. (In theBEBO approximation “substantially” has the meaning kcal/mole [67]).
Behaviour of the type illustrated in fig. 32(a), computed for the well-studiedexothermic reaction F + + H is shown in ref. [64]. Behaviour of thetype illustrate in fig. 32(b) is in accord with the evidence of section 4.1 above.There is, nonetheless, a clear need for comparisons of what we have termed(fig. 32) ST w i t h SV for a range of reactions, and within related series ofreactions.
If barrier location is to be made to any degree a quantitative index of therelative efficacy of translation and vibration in bring about barrier-crossing, thelocation of the barrier must be considered as it appears on a surface skewed andscaled for the appropriate masses mA, mB, and mC, so that a sliding mass willcorrectly solve the equations of (collinear) motion [98]. The mass combinationH + HL accentuates surface I behaviour while diminishing the surface IIeffect, whereas L + HH has the converse effect. The qualitative behaviournoted above remains unaltered.
A further significant refinement in understanding the controlling features of
400 Chemistry 1986
the pes takes note of the fact that in the case of a late barrier-crest some part ofthe energy-barrier is located along the coordinate of approach. This furtherelement was included in the picture by distinguishing between type “IIS” and“IIG” barriers, where S and G differentiate late-barriers approached by aSudden or Gradual potential rise [97]. The gradual rise implies the existence ofa significant fraction of the type II barrier in the coordinate of approach, with acorresponding requirement for a minimum reagent translational energy alongwith the (dominant) vibrational contribution.
A further dividend that accrues from the inclusion of this refinement is that ithas the effect of tying in the considerations raised in this section regarding thefavoured type of reagent energy for endothermic barrier crossing, with thosedescribed in section 2.2 in regard to the channelling of exothermic energy intoproduct degrees of freedom. The portion of the (late) barrier to endothermicreaction that extends into the coordinate of approach for ‘reverse’ reaction, isthe portion of the exothermic energy release that occurs in the coordinate ofseparation for ‘forward’ reaction; we are viewing the same hill from below andabove. Similarly the reagent translational energy required for endothermicreaction is related to the translational energy derived from repulsive energy-release in the corresponding exothermic reaction. Since the pes is a singlewhole, it is to be hoped that the various indices of reactive behaviour bear anevident relationship to one another.
The “indices of reactive behaviour” referred to in the previous paragraph(see 2.2, 3.2 and 4.2) make frequent use of the collinear “diagnostic” pes. Sincethis allows for neither reagent nor product angular momenta, it gives no insightinto the sources of product rotation (section 2.2), nor into the channelling ofreagent rotation into motion across the barrier.
The experimentally observed dependence of reaction probability on J canplausibly be explained as follows [91]. In the great majority of reactions therewill be a preferred orientation for the required close-approach of the attackingatom to the molecule under attack. With increased J, the time that the systemspends in this orientation will decrease, as will the detailed rate constant, k(J).With further increase in J, the preferred orientation will be recovered at shortintervals during the approach of A to BC, resul t ing in a reversal of thedownward trend in k(J). At high J, the attacking atom responds to an averageinteraction around BC; k(J) would be expected to level off. There is, however, afurther contributing factor at J sufficiently high that the rotational energy issignificant in terms of the energy required for barrier-crossing; this is the effectof rotation in carrying the system across the barrier to reaction. If the barrier is“late”, this would be expected to occur largely through vibration-rotationinteraction; if “early” through the component of force along r AB as BC rotatesinto A (see [72b] for the geometry of this collision).
These scenarios are speculative. What can be said with assurance is that theratio of time spent along the approach coordinate to the rotational period of themolecule under attack will play an important role in the outcome of a potential-ly-reactive encounter, in addition to the energy vested in rotation.
J. C. Polanyi 401
5 . F U T U R E D I R E C T I O N SThis talk has described the development of one type of “state specified”chemistry, from which some simple lessons regarding reaction dynamics can bedrawn. What we see obscurely today, we shall in the future see much moreclearly through the more rigorous application of state-selection, an increase inthe range of attributes being selected, and also an extension in the range ofreactions amenable to study. All of this will add up to a maturation of the fieldof state-to-state chemistry.
In closing I mention two further approaches which could assist materially inthe quest for understanding of the choreography of chemical reaction. In thefirst, attempts are being made to observe the molecular partners while they are,so to speak, on the stage, rather than immediately prior to and following thereactive dance. This we term “transition state spectroscopy” (TSS); it is ayoung but burgeoning field. In the second novel approach, the intention, stateda little grandiosely, is to have a hand in writing the script according to whichthe dynamics occurs; the reagents are aligned by the forces at a crystal surfaceand held in a fixed arrangement immediately prior to the initiation of thereaction by light, thus restricting the subsequent pattern of motion. This fieldof “surface aligned photochemistry” (SAP) has only very recently made itsappearance. SAP may initiate reaction part way across the pes and hence isrelated to TSS, since the adsorbed reactants can be held together in configura-tions that locate them at the outset part way up the reactive barrier. In the SAPexperiments performed till now the forces holding the reactants to the surfacehave been physisorptive.
These two approaches, TSS and SAP, will be briefly reviewed.The impetus for transition state spectroscopy, TSS, came from a series of
theoretical studies of the effect of laser fields on reactive encounters [102]. Avariety of intriguing alterations in dynamics were predicted, exemplifying inthe reactive domain the effects being explored at that date for non-reactiveencounters under the heading of “laser assisted collisions”. However, the laserpowers thought to be required lay in the gigawatt to terawatt range (powersassociated with the electrical breakdown of gases) so that the outlook forsuccess appeared bleak.
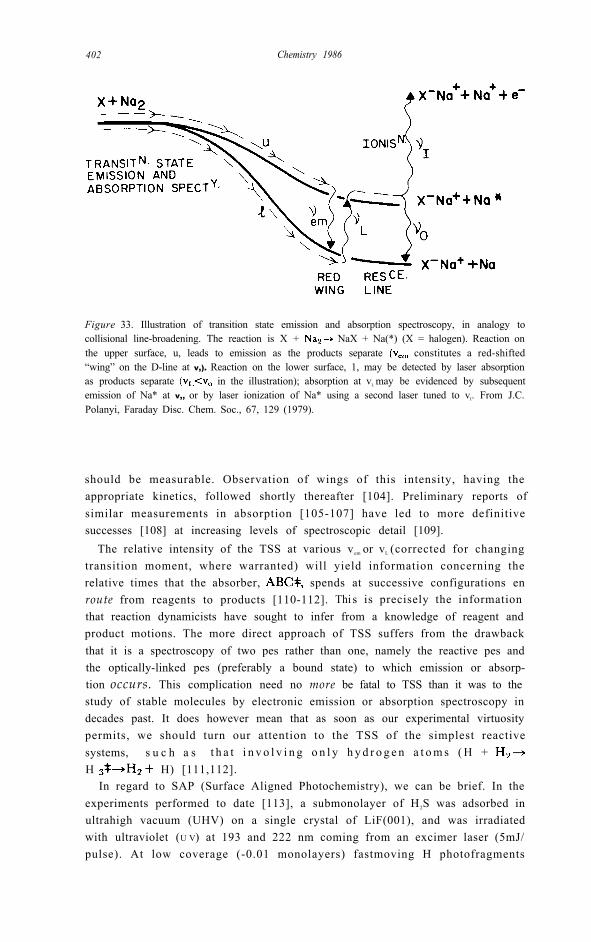
It was pointed out that a simple alternative would be to look for emissionfrom electronically-excited transition-state configurations [103]. (Inreaction rate theory “transition states” are sets of intermediate configurationsvariously defined; in the spectroscopic context we use the term to denote thefull range of configurations intermediate between reactants A + BC and pro-ducts AB + C). An example is shown in fig. 33. In collisional line-broadening ofNa* + NaX the wings of the atomic line emission would be due to the approachof Na* to NaX (moving from right to left in the figure) followed by emission offrequency ve m. In TSS comparable wings should be observed due to the factthat every Na* is formed by separation from NaX (moving from left to right inthe figure); separation can be preceded by emission at frequency A simplecalculation showed that the emission intensity at a of -1 cm-’ band-width, would total ~ 1 0-6x the chemiluminescent intensity of Na*, and that this
Chemistry 1986402
Figure 33. Illustration of transition state emission and absorption spectroscopy, in analogy tocollisional line-broadening. The reaction is X + NaX + Na(*) (X = halogen). Reaction onthe upper surface, u, leads to emission as the products separate constitutes a red-shifted“wing” on the D-line at v,). Reaction on the lower surface, 1, may be detected by laser absorptionas products separate in the illustration); absorption at vL may be evidenced by subsequentemission of Na* at v,, or by laser ionization of Na* using a second laser tuned to vI. From J.C.Polanyi, Faraday Disc. Chem. Soc., 67, 129 (1979).
should be measurable. Observation of wings of this intensity, having theappropriate kinetics, followed shortly thereafter [104]. Preliminary reports ofsimilar measurements in absorption [105-107] have led to more definitivesuccesses [108] at increasing levels of spectroscopic detail [109].
The relative intensity of the TSS at various vem or vL (corrected for changingtransition moment, where warranted) will yield information concerning therelative times that the absorber, spends at successive configurations enroute from reagents to products [110-112]. Thi s is precisely the informationthat reaction dynamicists have sought to infer from a knowledge of reagent andproduct motions. The more direct approach of TSS suffers from the drawbackthat it is a spectroscopy of two pes rather than one, namely the reactive pes andthe optically-linked pes (preferably a bound state) to which emission or absorp-tion occurs. This complication need no more be fatal to TSS than it was to thestudy of stable molecules by electronic emission or absorption spectroscopy indecades past. It does however mean that as soon as our experimental virtuositypermits, we should turn our attention to the TSS of the simplest reactivesystems, s u c h a s t h a t i n v o l v i n g o n l y h y d r o g e n a t o m s ( H + H H) [111,112].
In regard to SAP (Surface Aligned Photochemistry), we can be brief. In theexperiments performed to date [113], a submonolayer of H2S was adsorbed inultrahigh vacuum (UHV) on a single crystal of LiF(001), and was irradiatedwith ultraviolet (U V) at 193 and 222 nm coming from an excimer laser (5mJ/pulse). At low coverage (-0.01 monolayers) fastmoving H photofragments

J. C. Polanyi 403
were observed to leave the surface. From their energy and angular distributionthese were clearly due to the uv photolysis of H2S still held at the surface at theinstant of photofragmentation. With increasing coverage monolayers)t h e p h o t o p r o d u c t s i n c l u d e d f a s t - m o v i n g H2 f o r m e d i n t h e r e a c t i o nH + + HS. The yield of H2 increased with coverage at a rate and toan extent that could only be explained by the reaction of photorecoiling H withadsorbed H 2S; accordingly the reaction is ascribed to SAP. The H 2 product isfast and directional.
This is a small first step along the way to inducing reactions under conditionswhere the range of reagent angles-of-approach and impact parameters is re-stricted by surface alignment and (by choice of crystal, crystal face and cover-age) is controllable. A trajectory study [113] illustrates the simplified linkbetween product attributes and reactive geometries that applies under thesemore disciplined conditions.
Even in the world of molecules the civilising influence of modest restraints isa cause for rejoicing.
A C K N O W L E D G M E N T S
The research described here in so far as it relates to the work of my laboratorywas performed over a thirty year period at the University of Toronto. It is apleasure to express my indebtedness to my colleagues at this University - mostespecially to the late Prof. D.J. LeRoy who fostered this work from its incep-tion - and to my students and postdoctoral associates whose talents, generosityand friendship have made this undertaking possible under fulfilling.

404 Chemistry 1986
REFERENCES
1. M. Beutler and M. Polanyi, Z. Phys. Chem B1, 3 (1928); St. v. Bogdandy and M.Polanyi ibid. 1, 21 (1928); M. Polanyi and G. Schay, ibid. 1, 30 (1928).
2. D.R. Bates and M. Nicolet, J. Geophys. Res. 55, 301 (1950).3. G. Herzberg, J. Roy. Astron. Soc. Canada 4.5, 100 (1951).4. J.D. McKinley, D. Garvin and M. Boudart, J. Chem. Phys. 23, 784 (1955); T.M.
Cawthorn and J.D. McKinley, ibid. 2.5, 583 (1956).5. F.J. Lipscomb, R.G.W. Norrish and B.A. Thrush, Proc. Roy. Soc. A 233, 455
(1956).6. J.K. Cashion and J.C. Polanyi, J. Chem. Phys. 29, 455 (1958).7. J.K. Cashion and J.C. Polanyi, J. Chem. Phys., 30, 1097 (1959); same authors
Proc. Roy. Soc. (London) A258, 529, 564,570 (1960).8. A.L. Schawlow and C.H. Townes, Phys. Rev. 112 1940 (1958); A.M. Prokhorov,
Zh. Eksptl. i. Teor. Fiz. 34 1658 (1958) and Sov. Phys.-JETP 7, 1140 (1958).9. J.C. Polanyi, Proc. Roy. Soc. (Canada) 54(C), 25 (1960); J. Chem. Phys. 34, 347
(1.961).10. J.C. Polanyi, Applied Optics Supplement 2, 109 (1965).11. C.K.N. Patel, W.L Faust, and R.A. McFarlane, Bull. Am. Phys. Soc. 119, 500
(1964); C.K.N. Pate1 and R.J. Kerl, Appl. Phys. Letts. 5, 81 (1964); C.K. N. Patel,Phys. Rev. Letts. 12. 588 (1964).
12. J.V.V. Kasper and G.C. Pimentel, Phys. Rev. Lett., 14,352 (1965); G.C. Pimentel,Sci. Am., 214, 32 (1966).
13. P.E. Charters and J.C. Poianyi, Disc. Faraday. Soc 33. 107 (1962).14. H.O. Pritchard, Trans. Faraday Soc., 33, 278 (1962).15. J.C. Polanyi, Trans. Faraday Soc., 33, 279 (1962).16. K.G. Anlauf, P.J. Kuntz, D.H. Maylotte, P.D. Pacey and J.C. Polanyi, Disc.
Faraday Soc. 44, 183 (1967).17. P.D. Pacey and J.C. Polanyi, J. Applied Optics, JO, 1725 (1971).18. D.H. Maylotte, J.C. Polanyi and K.B. Woodall, J. Chem. Phys. 57, 1547 (1972).19. K.G. Anlauf, D.S. Horne, R.G. Macdonald, J.C. Polanyi and K.B. Woodall, J.
Chem. Phys. 57 1561 (1972).20. J.D. Polanyi and K.B. Woodall, J, Chem. Phys. 57, 1574 (1972).21. J.C. Polanyi and J.J. Sloan, J. Chem. Phys. 57, 4988 (1972).22. F. London, Problem der Modernen Physik (Sommerfeld Festschrift) p. 104 (1928); Z.
Elektrochem. 35, 552 (1924).23. H. Eyring and M. Polanyi, Z. Physik. Chem. B12, 279 (1931).24. J.O. Hirschfelder and E. Wigner, J. Chem. Phys. 7, 616 (1929).25. F.T. Wall, L.A. Hiller, and J. Mazur, J. Chem. Phys. 29,255 (1958).; ibid. 35, 1284
(1961).26. N.C. Blais and D.L. Bunker, J. Chem. Phys., 37, 2713 (1962); ibid. 39, 315 (1962).27. J.C. Polanyi in Transfert d’Energie dans les Gaz, Ed. R. Stoops, p. 177-182, 526-
528, Interscience Publishers, N.Y. (1962); J.C. Polanyi and S.D. Rosner, J. Chem.Phys. 38, 1028 (1963).
28. M.G. Evans and M. Polanyi, Trans. Faraday Soc., 35, 178 (1939).29. For a review see B.S. Agrawala and D.W. Setser in ‘Gas Phase Chemiluminescence and
Chemi-ionization’, Ed. A. Fontijn, p. 157, Elsevier (1985).30. B.M. Berquist, J.W. Bozzelli, L.S. Dzelzkalns, L.G. Piper and F. Kaufman, J.
Chem. Phys. 76, 2976 (1982); B.M. Berquist, L.S. Dzelzkalns, F. Kaufman, ibid.76, 2984 (1982); L.S. Dzelzkalns, and F. Kaufman, ibid. 77, 3508 (1982); L.S.Dzelzkalns and F. Kaufman, ibid. 79, 3836 (1983).
31. J.C. Weisshaar, T.S. Zwier and S.R. Leone, J. Chem. Phys. 75, 4873 (1981); for areview see C.E. Hamilton and S.R. Leone in ‘Gas Phase Chemiluminescence and Chemi-ionization' , Ed. A. Fontijn, p. 139, Elsevier (1985).

J C. Polanyi 405
32. H.L. Welsh, C. Cumming, and E.J. Stansbury. J. Opt. Soc. Am. 41, 712 (1951);H.L. Welsh, E.J. Stansbury, J. Romanko, and T. Feldman, J. Opt. Soc. Am. 45,338 (1955).
33. P.E. Charters, R.G. Macdonald, and J.C. Polanyi, Appl. Optics, IO, 1747 (1971).34. N. Jonathan, C.M. Melliar-Smith, and D.H. Slater, Mol. Phys. 20, 93 (1971); N.
Jonathan, C.M. Melliar-Smith, S. Okuda, D.M. Slater, and D. Timlin, Mol. Phys.22, 561 (1971).
35. H.W. Chang and D.W. Setser, J. Chem. Phys. 58, 2298 (1973); D.J. Bogan andD.W. Setser, ibid. 64, 586 (1976).
36. J.C. Moehlmann and J.D. McDonald, J. Chem. Phys. 62, 3061 (1975); J.W.Hudgens and J.D. McDonald, ibid. 67, 3401 (1977).
37. P.M. Aker, D.J. Donaldson, and J.J. Sloan, J. Phys. Chem., 40, 3110 (1986).38. D. Brandt, L.W. Dickson, L.N.Y. Kwan, and J.C. Polanyi, Chem. Phys. 39, 189
(1979); L.W. Dickson, Ph.D Thesis, Univ. of Toronto, 1982.39. J.C. Polanyi and K.B. Woodall, J. Chem. Phys. 56, 1563 (1872).40. J.H. Parker and G.C. Pimentel, J. Chem. Phys. 51, 91 (1969); R.D. Coombe and
G.C. Pimentel, ibid. 59, 251, 1535 (1973); M.J. Berry, ibid. 59, 6229 (1973).41. K.G. Anlauf, J.C. Polanyi, W.H. Wong, and K.B. Woodall, J. Chem. Phys., 49,
5189 (1968).42. D.M. Neumark, A.M. Wodtke, G.N. Robinson, C.C. Hayden, and Y.T. Lee, J.
Chem. Phys. 82, 3045 (1985); D.M. Neumark, A.M. Wodtke, G.N. Robinson, C.C.Hayden, K. Shobotake, R.K. Sparks, T.P. Schaefer, and Y.T. Lee, J. Chem. Phys.82, 3967 (1985).
43. R.B. Bernstein and R.D. Levine, J. Chem. Phys. 57, 434 (1972); R.B. Bernsteinand R.D. Levine ‘Advances in Atomic and Molecular Physics’, Vol. 11 (AcademicPress, New York, 1975); R.B. Bernstein and R.D. Levine in ‘Modern TheoreticalChemistry’, Vol. 3, Dynamics of Molecular Collisions, Part B, Ed. W.H. Miller(Plenum Press, New York, 1976) Chapter 7.
44. R.N. Zare and P.J. Dagdigian, Science, 185, 739 (1974).45. “Multiphoton Spectroscopy of Molecules”, by S.H. Lin, Y. Fujimura, H.J. Neus-
ser, and E.W. Schlag (Academic Press, 1984).46. P.M. Aker and J.J. Sloan, J. Chem. Phys. 85, 1412 (1986); P.M. Aker, J.J. Sloan,
and J.S. Wright, Chem. Phys., In press (1986).47. D.S. Perry and J.C. Polanyi, Chem. Phys. 12, 419 (1976).48. K.G. Anlauf, P.E. Charters, D.S. Horne, R.G. Macdonald, D.H. Maylotte, J.C.
Polanyi, W.J. Skrlac, D.C. Tardy, and K.B. Woodall, J. Chem. Phys. 53, 4091(1970); H. Heydtmann and J.C. Polanyi, J. Appl. Optics, 10, 2738 (1971); M.A.Nazar, J.C. Polanyi, and WJ. Skrlac, Chem. Phys. Letts. 29, 473 (1974); J.C.Polanyi and W.J. Skrlac, Chem. Phys. 23, 167 (1977); D. Brandt and J.C. Polanyi,Chem. Phys. 35, 23 (1978); ibid. 45, 65 (1980).
49. L.T. Cowley, D.S. Horne, and J.C. Polanyi, Chem. Phys. Letts., 12, 144 (1971).50. A.M.G. Ding. L.J. Kirsch, D.S. Perry, J.C. Polanyi, and J.L. Schreiber, Faraday
Disc. Chem. Soc., 55, 252 (1973).51. J.C. Polanyi, J.L. Schreiber, and W.J. Skrlac, Faraday Disc. Chem. Soc. 67, 66
(1979).52. J.C. Polanyi, J. Quant. Spectrosc. Radiat. Transfer 3, 471 (1963).53. P.J. Kuntz, E.M. Nemeth, J.C. Polanyi, S.D. Rosner, and C.E. Young, J. Chem.
Phys. 44, 1168 (1966).54. D.S. Perry, J.C. Polanyi, and C. Woodrow Wilson Jr., Chem. Phys. 3. 317 (1974).55. M.H. Mok and J.C. Polanyi, J. Chem. Phys. 52, 1451 (1969).56. T.H. Dunning Jr, J. Phys. Chem. 88. 2469 (1984).57. J.C. Polanyi, Disc Faraday Soc. 44, 293 (1967).58. For a review see: J.C. Polanyi, Accounts, Chem. Res. 5, 161 (1972).59. For a review see: J.C. Polanyi and J.L. Schreiber, Physical Chemistry - An
Advanced Treatise, Vol. VIA. Kinetics of Gas Reactions, Eds., H. Eyring, W. Jostand D. Henderson (Academic Press, New York, 1974) Chap. 6, p. 383.
406 Chemistry 1986
60. P.J. Kuntz, E.M. Nemeth, and J.C. Polanyi, J. Chem. Phys. 50, 4607 (1969).61. C.A. Parr, J.C. Polanyi, and W.H. Wong, J. Chem. Phys. 585 (1973).62. J.T. Muckerman, J. Chem. Phys. 54, 1155 (1971); ibid. 56, 2997 (1972); ibid. 57,
3388 (1972).63. J.C. Polanyi and J.L. Schreiber, Chem. Phys. Letts. 29, 319 (1974).64. J.C. Polanyi and J.L. Schreiber, Faraday Disc. Chem. Soc. 62, 267 (1977).65. C.F. Bender, S.V. O’Neill, P.K. Pearson, and H.F. Schaefer III, Science 176, 1412
(1972).66. H.F. Schaefer III, J. Phys. Chem. 89, 5336 (1985).67. D.S. Perry and J.C. Polanyi, Chem. Phys. 12, 419 (1976).68. P.J. Kuntz, M.H. Mok, and J.C. Polanyi, J. Chem. Phys. 50,4623 (1969).69. D.R. Herschbach, Faraday Disc. Chem. Soc., 55,233 (1973).70. M.G. Prisant, C.T. Rettner, and R.N. Zare, J. Chem. Phys. 81, 2699 (1984).71. M.D. Pattengill and J.C. Polanyi, Chem. Phys. 3, 1 (1974).72. (a) N.H. Hijazi and J.C. Polanyi, J. Chem. Phys. 63, 2249 (1975);
(b) N.H. Hijazi and J.C. Polanyi, Chem. Phys. 11, 1 (1975).73. J.J. Valentini, M.J. Coggiola, and Y.T. Lee, J. Am. Chem. Soc. 98, 853 (1976);
Faraday Disc., Chem. Soc., 62, 232 (1977).74. J.W. Hudgens and J.D. McDonald, J. Chem. Phys. 67, 3401 (1977).75. L.T. Cowley, D.S. Horne, and J.C. Polanyi, Chem. Phys. Letts. 12, 144 (1971).76. B.A. Blackwell, J.C. Polanyi, and J.J. Sloan, Chem. Phys. 24, 25 (1977).77. D.J. Douglas and J.C. Polanyi, Chem. Phys. 16, 1 (1976).78. R.D. Coombe and G.C. Pimentel, J. Chem. Phys. 59, 1535 (1973).79. D.L. Thompson, J. Chem. Phys. 56, 3570 (1972).80. J.C. Polanyi, Faraday Disc. Chem. Soc. 55, 389 (1973).81. J.C. Polanyi, J.L. Schreiber, and J.J. Sloan, Chem. Phys. 9, 403 (1975).82. J.C. Polanyi, J.J. Sloan, and J. Wanner, Chem. Phys. 13, 1 (1976).83. K.G. Anlauf, D.H. Maylotte, J.C. Polanyi, and R.B. Bernstein, J. Chem. Phys. 51,
5716 (1969).84. J.C. Polanyi, and D.C. Tardy, J. Chem. Phys. 51, 5717 (1969).85. D.S. Perry, J.C. Polanyi and C. Woodrow Wilson Jr., Chem. Phys. Letts. 24, 484
(1974).86. T.J. Odiorne, P.R. Brooks, and J.V.V. Kasper, J. Chem. Phys. 55, 1980 (1971;
J.G. Pruett, F.R. Grabiner, and P.R. Brooks, ibid. 63, 3335 (1974); J.G. Pruett,F.R. Grabiner, and P.R. Brooks, ibid. 63, 1173 (1975).
87. A Gupta, D.S. Perry, and R.N. Zare, J. Chem. Phys. 72, 6237, 6250 (1980).88. F. Heismann and H.J. Loesch, Chem. Phys. 64, 43 (1982).89. D.J. Douglas, J.C. Polanyi, and J.J. Sloan, J. Chem. Phys. 59, 6679 (1973).90. F.E. Bartozek, B.A. Blackwell, J.C. Polanyi, and J.J. Sloan, J. Chem. Phys 74 3400
(1981).91. B.A. Blackwell, J.C. Polanyi, and J.J. Sloan, Chem. Phys. 30,299 (1978).92. H.H. Dispert, M.W. Geis, and P.R. Brooks, J. Chem. Phys. 70, 5317 (1979).93. M.Hoffmeister, L. Potthast, and H.J. Loesch, Book of Abstracts, XII Interna-
tional Conf. on the Physics of Elektronic and Atomic Collisions, Gatlinburg(1981).
94. J.C. Polanyi and W.H. Wong, J. Chem. Phys. 51, 1439 (1969).95. J.W. Duff and D.G. Truhlar, J. Chem. Phys. 62, 2477 (1975).96. G.L. Hofacker and R.D. Levine, Chem. Phys. Letts. 9, 617 (1971).97. J.C. Polanyi and N. Sathyamurthy, Chem. Phys. 33, 287 (1978).98. B.A. Hodgson and J.C. Polanyi, J. Chem. Phys. 55, 4745 (1971).99. M.H. Mok and J.C. Polanyi, J. Chem. Phys. 53, 4588 (1970).
100. G.S. Hammond, J. Amer. Chem. Soc. 77, 334 (1955).101. J. C. Polanyi, J. Phys. Chem. 31, 1338 (1959).102. (a) T.F. George, J. Phys. Chem. 86, 10 (1982) and references therein; (b) A.M.F.
Lau, Phys. Rev. A13, 139 (1976); 14, 279 (1976); Phys. Rev. Lett. 43, 1009 (1978);
J. C. Polanyi 407
Phys. Rev A22, 614 (1980); (c) V.S. Dubov, L.I. Gudzenko, L.V. Gurvich and S.I.Yakovlenko, Chem. Phys. Lett. 45, 330 (1977); S.I. Yakovlenko, Sov. J. QuantumElectron, 8, 151 (1977); (d) A.E. Ore1 and W.H. Miller, Chem. Phys. Lett. 57, 362(1979); J. Chem. Phys. 70, 4393 (1979); (e) J.C. Light and A. Altenberger-Siczek,ibid. 70, 4108 (1979).
103. J.C. Polanyi, Faraday Disc. Chem. Soc. 67, 129 (1979).104. P. Arrowsmith, F.E. Bartoszek, S.H.P. Bly, T. Carrington, Jr., P.E. Charters, and
J.C. Polanyi, J. Chem. Phys. 73, 5895 (1980); H.-J.. Foth, J.C. Polanyi, and H.H.Telle, J. Phys. Chem. 86, 5027 (1982); P. Arrowsmith, S.H.P. Bly, P.E. Charters,and J.C. Polanyi, J. Chem. Phys. 79, 283 (1983).
105. P. Hering, P.R. Brooks, R.F. Curl Jr., R.S. J du son, and R.S. Lowe, Phys. Rev.Lett. 44, 657 (1980); P.R. Brooks, R.F. Curl, and T.C. Maguire, Ber. Bunsenges.Phys. Chem. 86, 401 (1982).
106. H.P. Grieneisen, H. Xue-Jing, and K.L. Kompa, Chem. Phys. Letts. 82, 421(1981).
107. J.K. Ku, G. Inoue, and D.W. Setser, J. Phys. Chem. 87, 2989 (1983).108. T.C. Maguire, P.R. Brooks R.F. Curl, J.H. Spence, and S. Ulrick, J. Chem. Phys.
85, 844 (1986); T.C. Maguire, P.R. Brooks, R.F. Curl, J.H. Spence, and S. Ulrick,Phys. Rev. A34, 4418 (1986).
109. P.D. Kleiber, A.M. Lyyra, K.M. Sando, S.P. Heneghan, and W.C. Stwalley,Phys. Rev. Letts. 54, 2003 (1985); P.D. Kleiber, A.M. Lyyra, K.M. Sando, V.Zafiropolos, and W.C. Stwalley, J. Chem. Phys. 85, 5493 (1986).
110. J.C. Polanyi and R.J. Wolf, J. Chem. Phys. 75, 5951 (1981).111. H.R. Mayne, R.A. Poirier, and J.C. Polanyi, J. Chem. Phys. 80, 4025 (1984); H.R.
Mayne, J.C. Polanyi, N. Sathyamurthy, and S. Raynor, ibid. 88, 4064 (1984).112. V. Engel, Z. Bacic, R. Schinke, and M. Shapiro, J. Chem. Phys. 82, 4844 (1985);
V. Engel and R. Schinke, Chem. Phys. Letts. 122, 103 (1985).113. E.B.D. Bourdon, J.P. Cowin, I. Harrison, J.C. Polanyi, J. Segner, C.D. Stanners,
and P.A. Young, J. Phys. Chem. 88, 6100 (1984); E.B.D. Bourdon, P. Das, I.Harrison, J.C. Polanyi, J. Segner, C.D. Stanners, R.J. Williams, and P.A. Young,Faraday Disc. Chem. Soc. 82, 343 (1986).