some theory for multiple point statistics - k. gerald van den boogaart
TRANSCRIPT
Int. Assoc. for Mathematical GeologyXIth International Congress
Universite de Liege - Belgium
Some theory for Multiple Point Statistics: Fitting, checking andoptimally exploiting the training image
K.G. van den Boogaart1
1 Institute for Mathematics and Informatics, Greifswald University, GermanyCorresponding author: [email protected]
ABSTRACT: In multiple point statistics, training images are used as a model for high orderjoint distributions. However this model does not necessarily represent the true joint distribu-tion of the random field under consideration, like an arbitrarily guessed or estimated variogramdoes not necessarily represent the true correlation structure. This contribution thus tries to startsomething like variography for training images. However only first pictures fit on four pages.
KEYWORDS: multiple point statistics, training image, isotropy, selfsimilarity, scale, repro-ducibility, goodness of fit
1. Introduction
The Multiple Point Statistics approach of Strebel (2002) was introduced as an alternate approachto categorical geostatistics and uses instead of a variogram a user given training image to es-timate the conditional probability at interpolation location given the observed and the alreadyinterpolated data.The purpose of this contribution is to emphasis the conceptual proximity, similarities and dif-ferences of training images and variogram models and to show how well known concepts fromvariogram can be applied to the training image.
2. Training images replace variograms
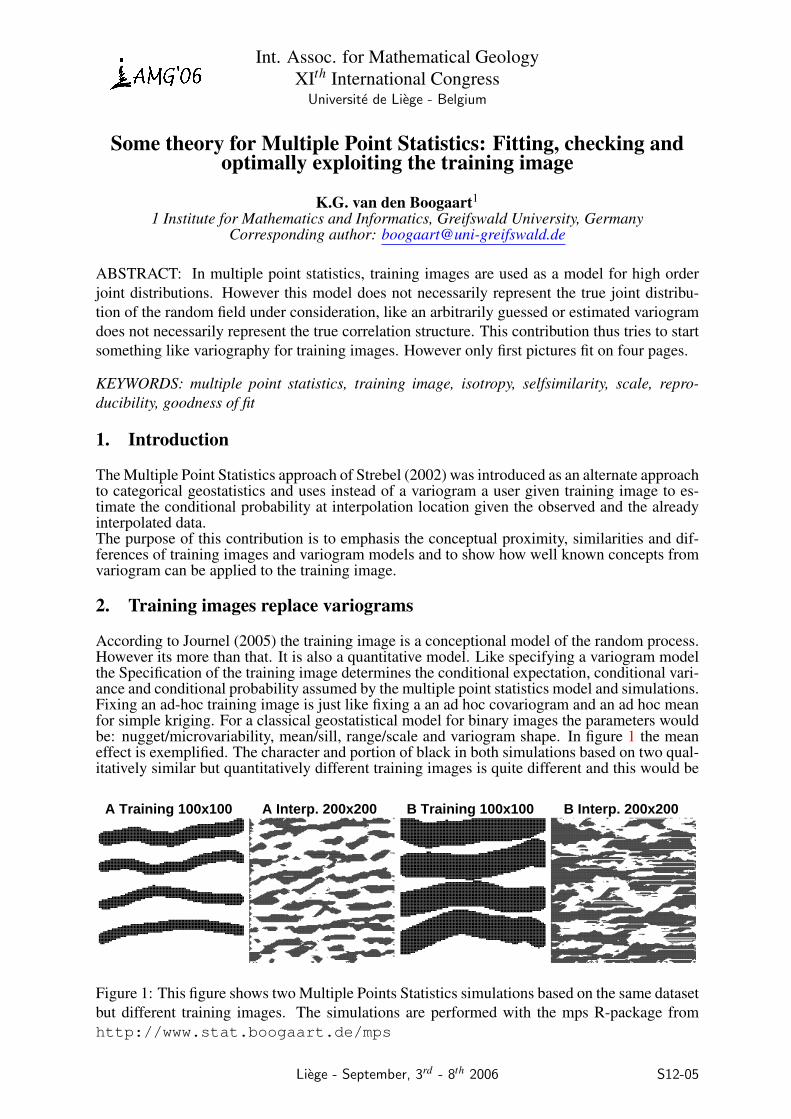
According to Journel (2005) the training image is a conceptional model of the random process.However its more than that. It is also a quantitative model. Like specifying a variogram modelthe Specification of the training image determines the conditional expectation, conditional vari-ance and conditional probability assumed by the multiple point statistics model and simulations.Fixing an ad-hoc training image is just like fixing a an ad hoc covariogram and an ad hoc meanfor simple kriging. For a classical geostatistical model for binary images the parameters wouldbe: nugget/microvariability, mean/sill, range/scale and variogram shape. In figure 1 the meaneffect is exemplified. The character and portion of black in both simulations based on two qual-itatively similar but quantitatively different training images is quite different and this would be
A Training 100x100 A Interp. 200x200 B Training 100x100 B Interp. 200x200
Figure 1: This figure shows two Multiple Points Statistics simulations based on the same datasetbut different training images. The simulations are performed with the mps R-package fromhttp://www.stat.boogaart.de/mps
Liege - September, 3rd - 8th 2006 S12-05
Int. Assoc. for Mathematical GeologyXIth International Congress
Universite de Liege - Belgium
the same for replica. A similar effect on the resulting image is illustrated in figure 2. With var-iogram the variogram model can be considered as the conceptual model of coregionalisation.However still the parameters of variograms are estimated from the data. To do similar thingswith training image we need have an idea how to parameterize a training image, which is pic-ture drawn by an expert and we need an idea how to quantify the goodness of fit. Furthermorelike understanding that a the empirical variogram does not give the true variogram we need tobe clear that even the best training image does not give the true joint distribution of arbitrarilymany points.
3. Parameterizing the training image
In our example the conceptual model is that of parallel channels. However without knowingthe random field we can not know orientation, size, or portion of the channels. We will shortlydiscuss which parameters and decisions could be introduced
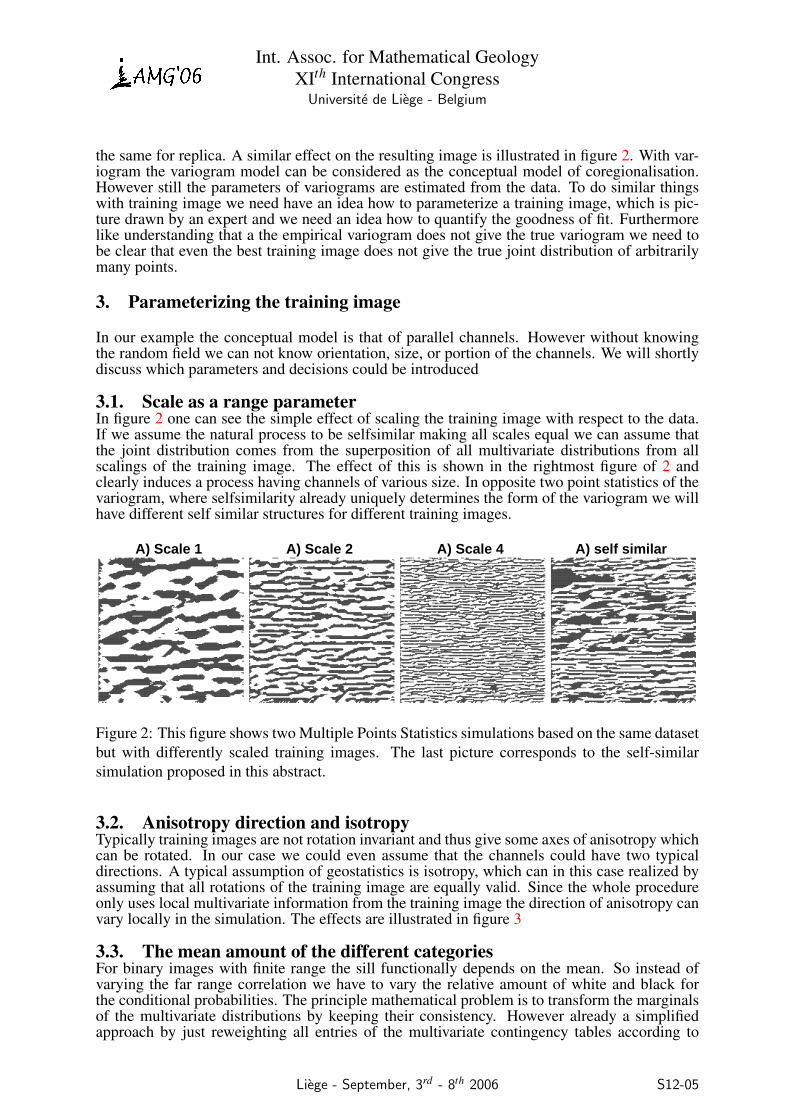
3.1. Scale as a range parameterIn figure 2 one can see the simple effect of scaling the training image with respect to the data.If we assume the natural process to be selfsimilar making all scales equal we can assume thatthe joint distribution comes from the superposition of all multivariate distributions from allscalings of the training image. The effect of this is shown in the rightmost figure of 2 andclearly induces a process having channels of various size. In opposite two point statistics of thevariogram, where selfsimilarity already uniquely determines the form of the variogram we willhave different self similar structures for different training images.
A) Scale 1 A) Scale 2 A) Scale 4 A) self similar
Figure 2: This figure shows two Multiple Points Statistics simulations based on the same datasetbut with differently scaled training images. The last picture corresponds to the self-similarsimulation proposed in this abstract.
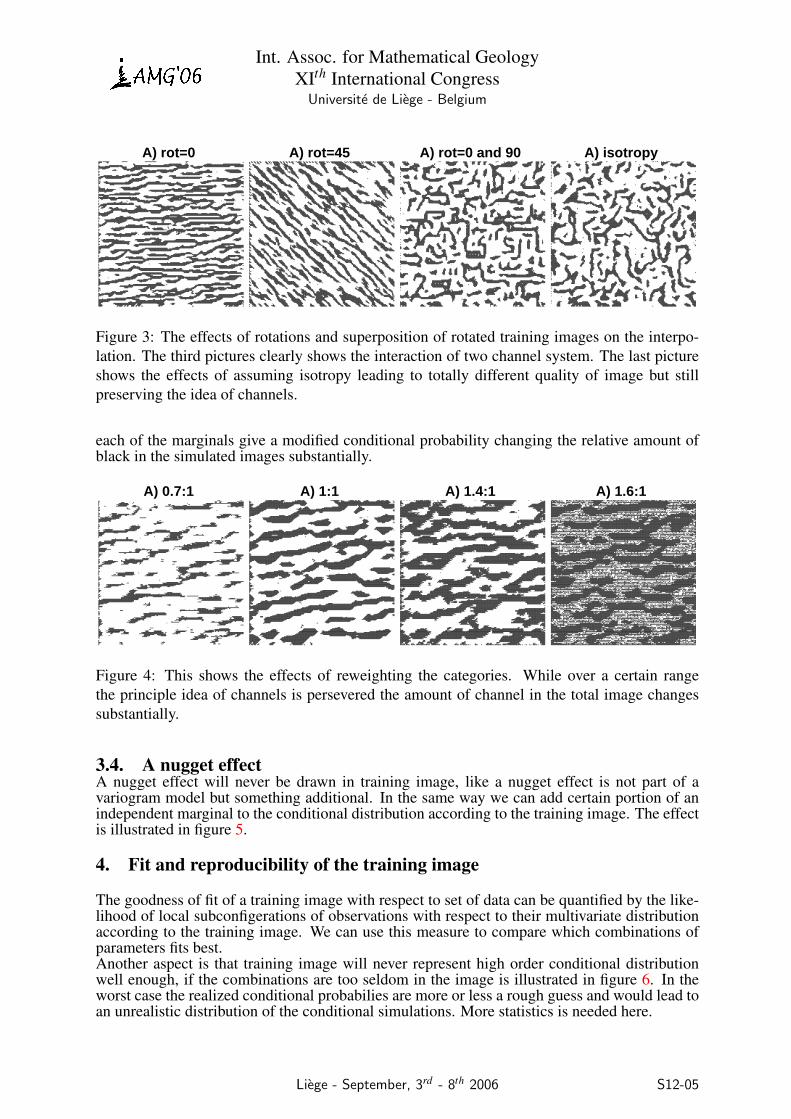
3.2. Anisotropy direction and isotropyTypically training images are not rotation invariant and thus give some axes of anisotropy whichcan be rotated. In our case we could even assume that the channels could have two typicaldirections. A typical assumption of geostatistics is isotropy, which can in this case realized byassuming that all rotations of the training image are equally valid. Since the whole procedureonly uses local multivariate information from the training image the direction of anisotropy canvary locally in the simulation. The effects are illustrated in figure 3
3.3. The mean amount of the different categoriesFor binary images with finite range the sill functionally depends on the mean. So instead ofvarying the far range correlation we have to vary the relative amount of white and black forthe conditional probabilities. The principle mathematical problem is to transform the marginalsof the multivariate distributions by keeping their consistency. However already a simplifiedapproach by just reweighting all entries of the multivariate contingency tables according to
Liege - September, 3rd - 8th 2006 S12-05
Int. Assoc. for Mathematical GeologyXIth International Congress
Universite de Liege - Belgium
A) rot=0 A) rot=45 A) rot=0 and 90 A) isotropy
Figure 3: The effects of rotations and superposition of rotated training images on the interpo-lation. The third pictures clearly shows the interaction of two channel system. The last pictureshows the effects of assuming isotropy leading to totally different quality of image but stillpreserving the idea of channels.
each of the marginals give a modified conditional probability changing the relative amount ofblack in the simulated images substantially.
A) 0.7:1 A) 1:1 A) 1.4:1 A) 1.6:1
Figure 4: This shows the effects of reweighting the categories. While over a certain rangethe principle idea of channels is persevered the amount of channel in the total image changessubstantially.
3.4. A nugget effectA nugget effect will never be drawn in training image, like a nugget effect is not part of avariogram model but something additional. In the same way we can add certain portion of anindependent marginal to the conditional distribution according to the training image. The effectis illustrated in figure 5.
4. Fit and reproducibility of the training image
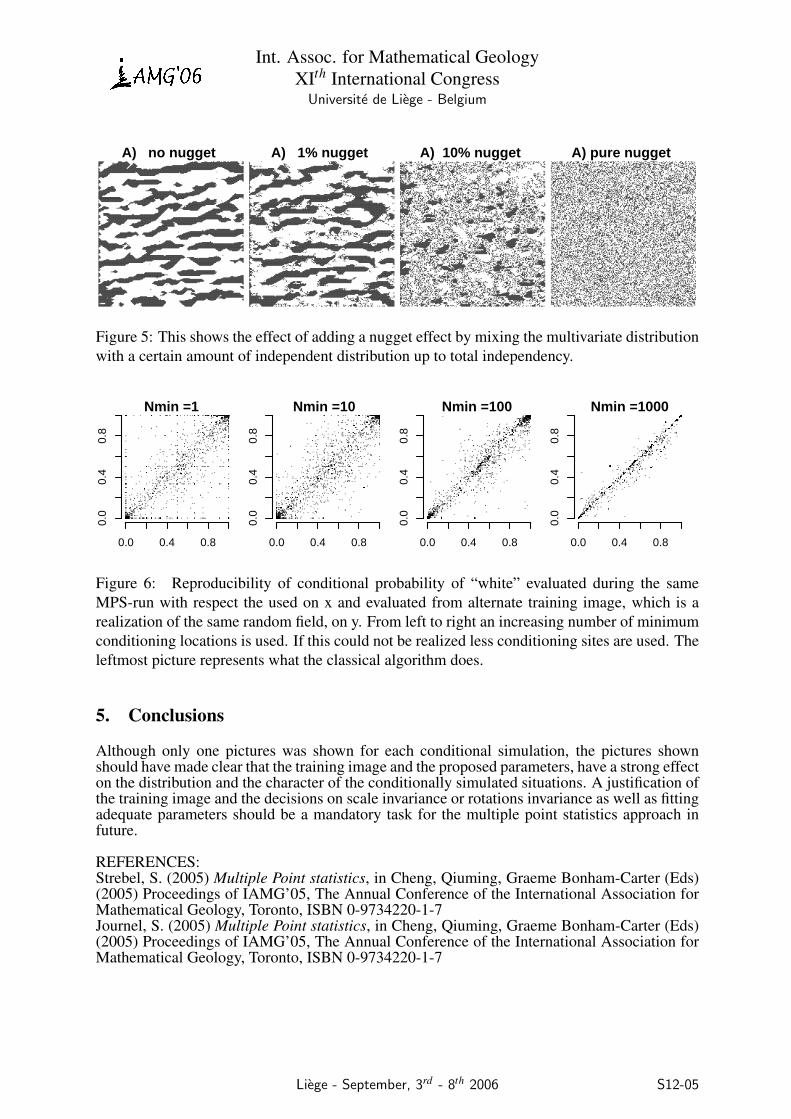
The goodness of fit of a training image with respect to set of data can be quantified by the like-lihood of local subconfigerations of observations with respect to their multivariate distributionaccording to the training image. We can use this measure to compare which combinations ofparameters fits best.Another aspect is that training image will never represent high order conditional distributionwell enough, if the combinations are too seldom in the image is illustrated in figure 6. In theworst case the realized conditional probabilies are more or less a rough guess and would lead toan unrealistic distribution of the conditional simulations. More statistics is needed here.
Liege - September, 3rd - 8th 2006 S12-05
Int. Assoc. for Mathematical GeologyXIth International Congress
Universite de Liege - Belgium
A) no nugget A) 1% nugget A) 10% nugget A) pure nugget
Figure 5: This shows the effect of adding a nugget effect by mixing the multivariate distributionwith a certain amount of independent distribution up to total independency.
0.0 0.4 0.8
0.0
0.4
0.8
Nmin =1
0.0 0.4 0.8
0.0
0.4
0.8
Nmin =10
0.0 0.4 0.8
0.0
0.4
0.8
Nmin =100
0.0 0.4 0.80.
00.
40.
8
Nmin =1000
Figure 6: Reproducibility of conditional probability of “white” evaluated during the sameMPS-run with respect the used on x and evaluated from alternate training image, which is arealization of the same random field, on y. From left to right an increasing number of minimumconditioning locations is used. If this could not be realized less conditioning sites are used. Theleftmost picture represents what the classical algorithm does.
5. Conclusions
Although only one pictures was shown for each conditional simulation, the pictures shownshould have made clear that the training image and the proposed parameters, have a strong effecton the distribution and the character of the conditionally simulated situations. A justification ofthe training image and the decisions on scale invariance or rotations invariance as well as fittingadequate parameters should be a mandatory task for the multiple point statistics approach infuture.
REFERENCES:Strebel, S. (2005) Multiple Point statistics, in Cheng, Qiuming, Graeme Bonham-Carter (Eds)(2005) Proceedings of IAMG’05, The Annual Conference of the International Association forMathematical Geology, Toronto, ISBN 0-9734220-1-7Journel, S. (2005) Multiple Point statistics, in Cheng, Qiuming, Graeme Bonham-Carter (Eds)(2005) Proceedings of IAMG’05, The Annual Conference of the International Association forMathematical Geology, Toronto, ISBN 0-9734220-1-7
Liege - September, 3rd - 8th 2006 S12-05