somis (soil map internet information server)...
TRANSCRIPT
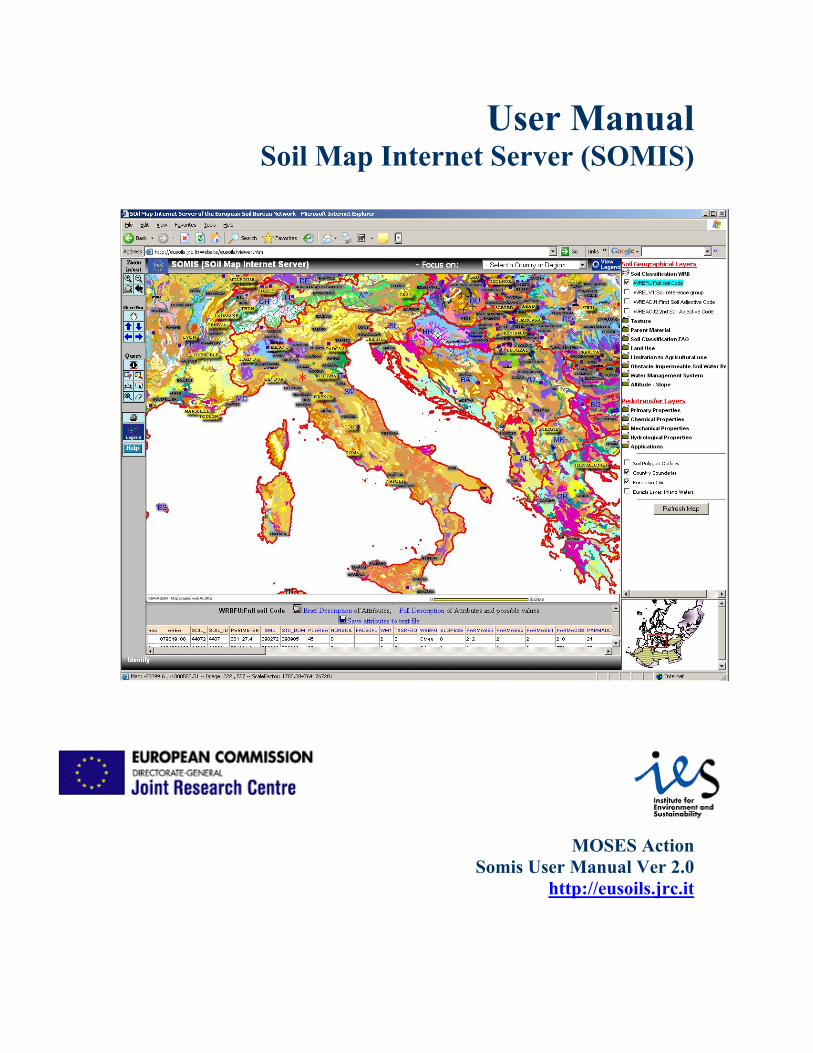
User Manual Soil Map Internet Server (SOMIS)
MOSES Action Somis User Manual Ver 2.0
http://eusoils.jrc.it
Introduction Welcome to the SOil Map Internet Service (SOMIS) of the European Soil Database. This is an interactive GIS mapping website. This site will allow you to search, view, measure, and print information and data from the European Soil Data Base version 2. The SOMIS viewer offers tools for both viewing and querying spatial and attributes data, performing spatial analysis tasks such as selecting and viewing data.
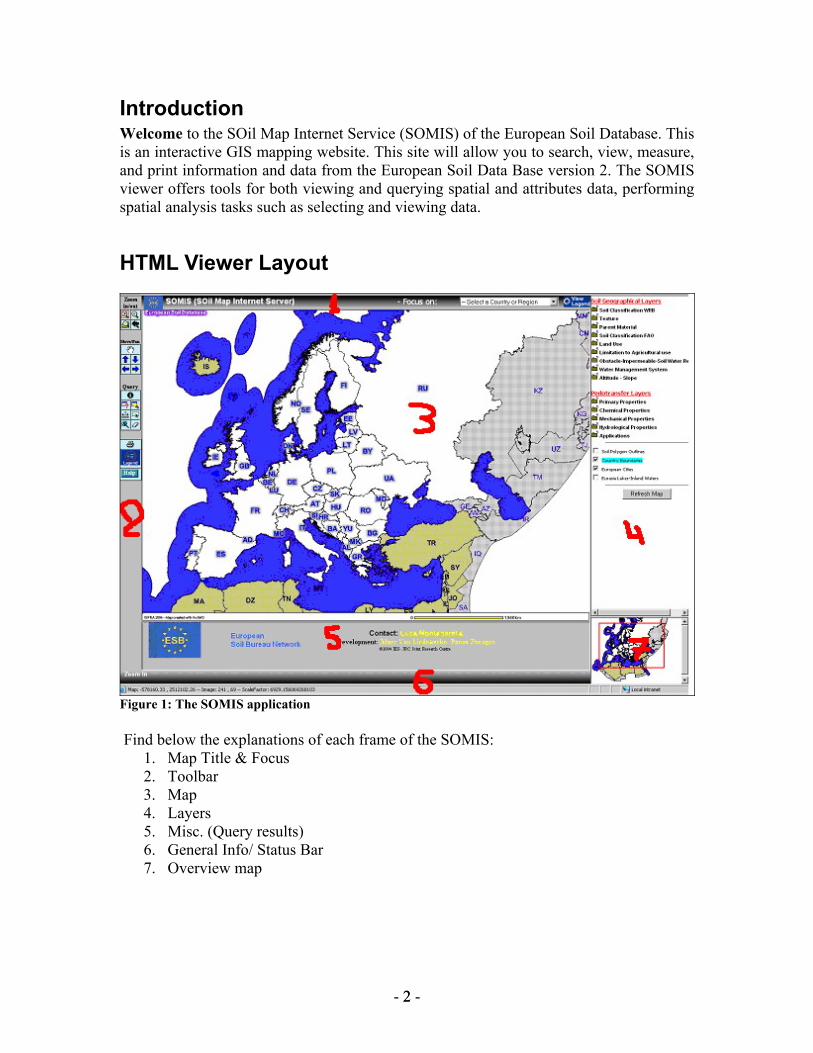
HTML Viewer Layout
Figure 1: The SOMIS application
Find below the explanations of each frame of the SOMIS: 1. Map Title & Focus 2. Toolbar 3. Map 4. Layers 5. Misc. (Query results) 6. General Info/ Status Bar 7. Overview map
- 2 - 2
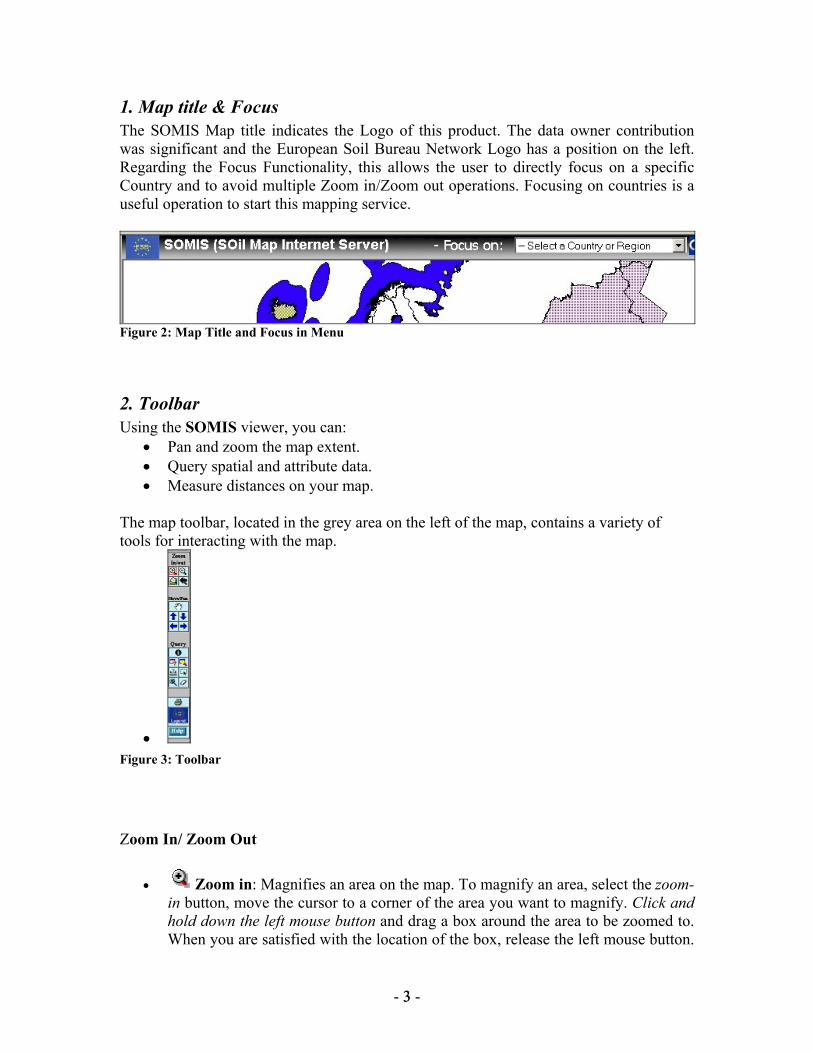
1. Map title & Focus The SOMIS Map title indicates the Logo of this product. The data owner contribution was significant and the European Soil Bureau Network Logo has a position on the left. Regarding the Focus Functionality, this allows the user to directly focus on a specific Country and to avoid multiple Zoom in/Zoom out operations. Focusing on countries is a useful operation to start this mapping service.
Figure 2: Map Title and Focus in Menu
2. Toolbar Using the SOMIS viewer, you can:
• Pan and zoom the map extent. • Query spatial and attribute data. • Measure distances on your map.
The map toolbar, located in the grey area on the left of the map, contains a variety of tools for interacting with the map.
• Figure 3: Toolbar Zoom In/ Zoom Out
• Zoom in: Magnifies an area on the map. To magnify an area, select the zoom-in button, move the cursor to a corner of the area you want to magnify. Click and hold down the left mouse button and drag a box around the area to be zoomed to. When you are satisfied with the location of the box, release the left mouse button.
- 3 - 3

You may also use this tool to center and zoom to an area of interest by just single-clicking on the map. The Zoom In tool allows you to zoom in to an area smaller than the area currently visible on the screen.
• Zoom out: Displays a larger portion of the map. To zoom-out, select the zoom-out button, move the cursor over the point of interest, and click once with the left mouse button. You may also use this tool to click and drag a box to zoom-out to an area twice the size of your box. The Zoom Out tool allows you to zoom out to an area larger than what is currently visible on the screen. NOTE: Unlike the Zoom In tool, the zoom-out factor is inversely proportional to the size of the box you draw. This means the smaller the box you draw, the more you zoom out.
• View the Whole Extent: Zooms-out to the entire viewing area. Select the View WholeExtent button to reset the map viewing area. If you click this button you will view the whole Eurasian Soil Map.
• Go Back to Previous Extent: Go back to the previous map view. Select the Previous Extent button to go back to the previous map view.
Move / Pan
• Pan: Moves the map view in any direction. To pan, click the pan icon and the cursor will change to a hand. With the hand, left-click and drag the map in any direction. When you let go of the mouse button, the map will redraw.
• Pan East, Pan West, Pan North, Pan South: To pan in different
directions o The zoom and pan tools allow you to change the map extent. o Click the zoom to full extent button to see the full extent of the map o Click a layer in the legend to make it active. o Click the zoom to active layer button to see the extend of the active layer o Click pan one direction button and click a direction to pan the map o Click the zoom in button and click and drag a rectangle on the map to
Zoom in to an area. Zoom out works the same way. o Click the pan button and then drag on the map to pan to a new area.
Query
• Identify Features: Gets more information about the active layer (See 'Layers' below) on the map. Once you have zoomed in to a point where you would like to
- 4 - 4

identify an item on the screen, click the identify button then the item. A Star "*" will be marked temporarily in a red Colour on the polygon clicked. Concurrently, the information about this polygon will be displayed in the text in the Misc. dialog box. The Identify tool allows you to get attribute information about a feature by clicking on it.
o Click a layer in the layer to make it active. o Click the identify button. o Click a feature on the map. o The results of the "identify" are shown in the Misc. dialog box.
• Build a query
The query builder features are based on the attribute values of the layers. Numeric or text is acceptable search strings.
o Click a layer in the layer in the legend to make it active. o Click query builder button. o Select and click a field to query. o Click an operator to be used in the expression. o Click a sample value or type a value for the expression. o Click on add to query string. o Click execute
Figure 4: Query box
• Stored query: This functionality is enabled on the viewer if the Map Service has been created with stored query. Only Country Boundaries have been enabled this functionality.
o Click on a checkbox to make a layer " Country Boundaries" active. o Click on the stored Query button o In the Misc. dialog box you will receive a selection of stored queries for
that Particular layer (Query Based on the Countries). o Select the country for which you want to view the polygons.
- 5 - 5

• Measure Distance: The Measure Tool tool allows you to measure distances on the map. To use the Measure Tool, click the Measure Tool icon. Two text boxes labeled "Total" and "Segment" will appear at the top of the screen. Using your cursor, click the points you wish to measure. Notice that every time you click a red point gets added to the map and the "Segment" distance gets added to the "Total" distance. You can create a polygon (e.g., square, rectangle, or your own shape) or use the tool to measure a line. Note that polygons are limited to 10 points.
• Select Rectangle: The Select by Rectangle tool allows you to select properties from the map by drawing a rectangle on the screen. To use the Select by Rectangle tool, left-click and drag a selection box around the area in which you wish to select properties (for example, a neighborhood.). The selected properties will be highlighted and added to the selection set below the map.
• Select Line: Select all the polygons inside a selection of a line. Similar to Select Rectangle operation.
• Clear Selection: This tool allows you to clear all the properties from the selection set
Printing a Map
This tool allows you to send the current map to your printer.
• Click the print button • Type a title and click create print page • A new browser page will appear with your map. See below the Prompting
Printing Page. The user has some options: o Type the TITLE that he would like view in the Printed page o Select the Page Layout: Portrait (Default) or Landscape o Select the Page Size: 8.5 X 11 (A4) or 11 X 17 (A3) o Resolution: Normal is recommended
NOTE: Recommendations for the best use of this functionality: Minimize the Page setup in your Printer Settings to minimum levels (25 inches). Also for layers with long Legend, please use Landscape Layout in order to fit in a single page.
- 6 - 6

Figure 5: Print a map through the SOMIS interface
Legend
Displays a legend for the map in a separate window. Click the Legend button to display the legend! The legend shows the layer name and the symbols used to draw each layer. The Legend can be printed or saved as an image file.
- 7 - 7
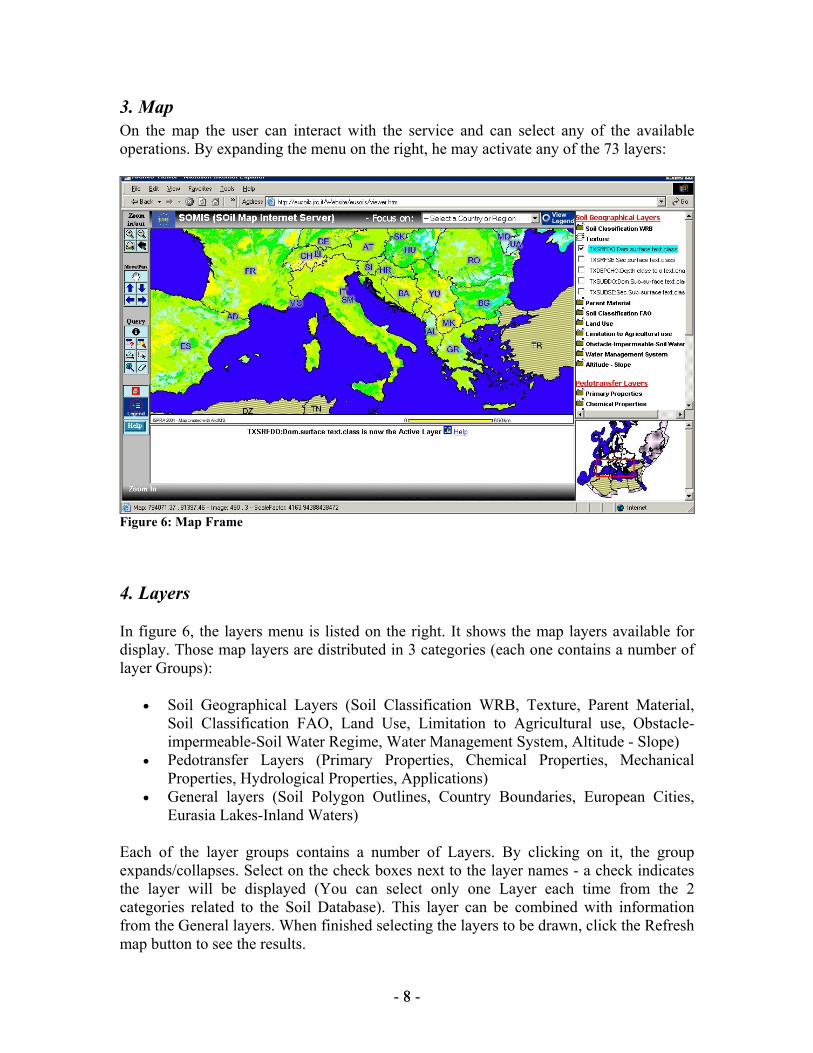
3. Map On the map the user can interact with the service and can select any of the available operations. By expanding the menu on the right, he may activate any of the 73 layers:
Figure 6: Map Frame
4. Layers
In figure 6, the layers menu is listed on the right. It shows the map layers available for display. Those map layers are distributed in 3 categories (each one contains a number of layer Groups):
• Soil Geographical Layers (Soil Classification WRB, Texture, Parent Material, Soil Classification FAO, Land Use, Limitation to Agricultural use, Obstacle-impermeable-Soil Water Regime, Water Management System, Altitude - Slope)
• Pedotransfer Layers (Primary Properties, Chemical Properties, Mechanical Properties, Hydrological Properties, Applications)
• General layers (Soil Polygon Outlines, Country Boundaries, European Cities, Eurasia Lakes-Inland Waters)
Each of the layer groups contains a number of Layers. By clicking on it, the group expands/collapses. Select on the check boxes next to the layer names - a check indicates the layer will be displayed (You can select only one Layer each time from the 2 categories related to the Soil Database). This layer can be combined with information from the General layers. When finished selecting the layers to be drawn, click the Refresh map button to see the results.
- 8 - 8

To get additional information about individual features of a layer from the map, click on
the identify features button (it is located in the Misc. dialog box). Active is always the selected layer. Setting the active layer allows you to retrieve information regarding that layer, using the Identify tool.
5. Misc. (Query results) On the following figure you can see the results of an Identify Features operation:
Figure 7: Query Results
The user has available the option to read the "Brief Description" or the "Full Description" of the Attributes. Those are the on-line help provided for the user. The user can have either a brief overview of the existing attributes or a very detailed attributes coding with all the available values.
This tool allows you to export the entire selection set to a comma separated value (CSV) file. CSV files can be imported into many different types of applications such as spreadsheets and databases. The number of records allowed to be saved is limited to a maximum 25 because of data ownership restrictions.
- 9 - 9

6. General Info/ Status Bar The Status bar is in the right lower corner and indicates the status of the Current operation:
Figure 8: Identify Toolbar
7. OVerview Map Displays the overview location map. The map shows you where you have zoomed to in relation to the entire map area. A red rectangle or a point on the Overview map indicates the area that you are displaying in the Normal map.
Figure 9: OVerview map of SOMIS
- 10 - 10