source: mankiw (2000) macroeconomics, chapter 3 p. 42-761 3. determinants of demand for goods and...
Post on 22-Dec-2015
220 views
TRANSCRIPT
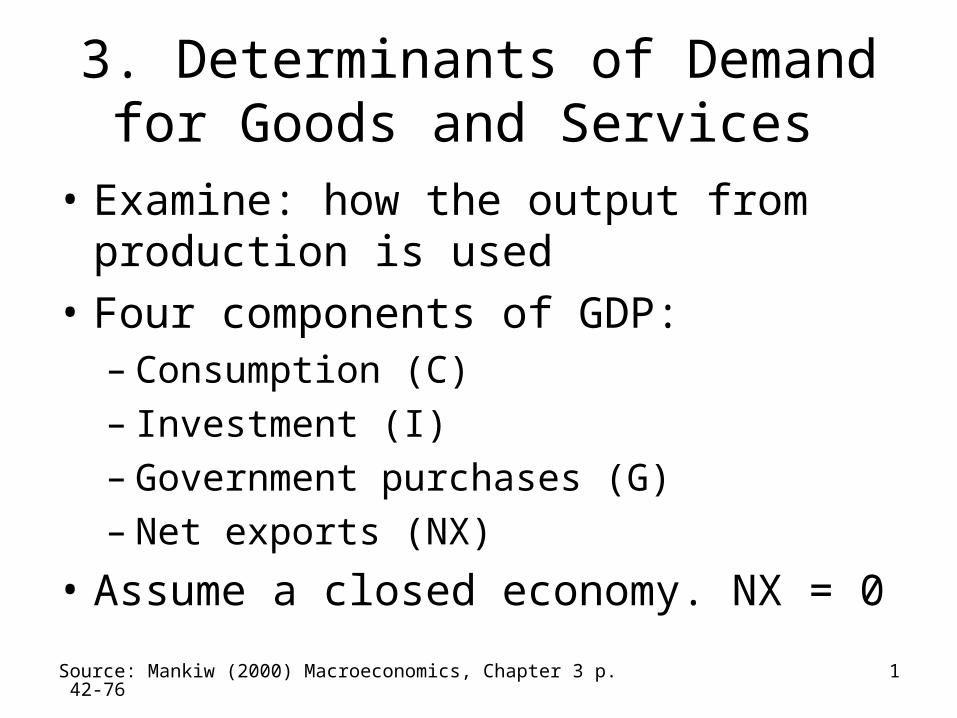
Source: Mankiw (2000) Macroeconomics, Chapter 3 p. 42-76 1
3. Determinants of Demand for Goods and Services
• Examine: how the output from production is used
• Four components of GDP:– Consumption (C)– Investment (I)– Government purchases (G)– Net exports (NX)
• Assume a closed economy. NX = 0
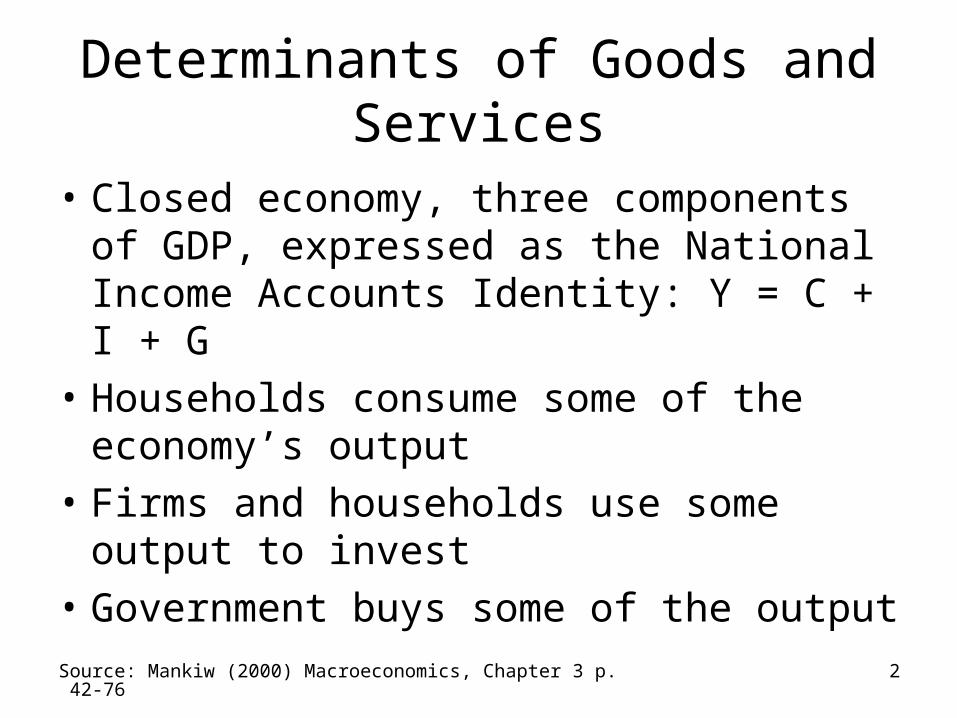
Source: Mankiw (2000) Macroeconomics, Chapter 3 p. 42-76 2
Determinants of Goods and Services
• Closed economy, three components of GDP, expressed as the National Income Accounts Identity: Y = C + I + G
• Households consume some of the economy’s output
• Firms and households use some output to invest
• Government buys some of the output

Source: Mankiw (2000) Macroeconomics, Chapter 3 p. 42-76 3
Determinants of Goods and Services
• Consumption:– We consume some of the output produced in
the economy (e.g. food, clothing, going to the cinema)
– Consumption makes up two thirds of GDP– Households get income from their labour and
ownership of capital, pay taxes to the government and decide how much of what is left to consume and/or save
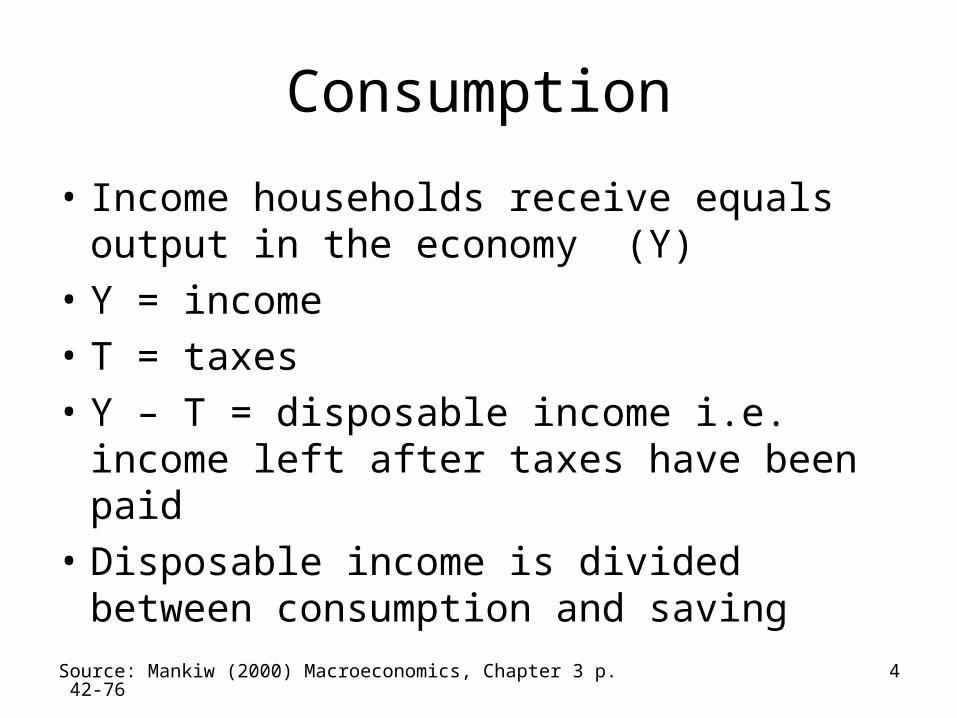
Source: Mankiw (2000) Macroeconomics, Chapter 3 p. 42-76 4
Consumption
• Income households receive equals output in the economy (Y)
• Y = income
• T = taxes
• Y – T = disposable income i.e. income left after taxes have been paid
• Disposable income is divided between consumption and saving

Source: Mankiw (2000) Macroeconomics, Chapter 3 p. 42-76 5
Consumption
• C = C(Y-T)
• Consumption is a function of disposable income
• Consumption function – Graph
• Marginal Propensity to Consume (MPC): amount by which consumption changes when disposable income increases by one Euro.
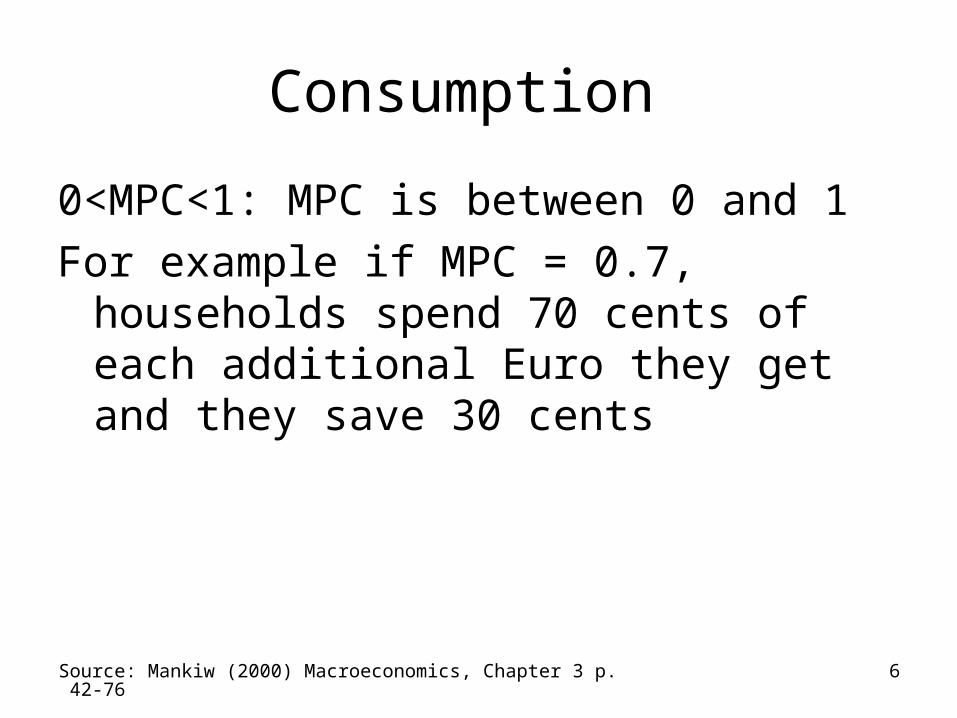
Source: Mankiw (2000) Macroeconomics, Chapter 3 p. 42-76 6
Consumption
0<MPC<1: MPC is between 0 and 1
For example if MPC = 0.7, households spend 70 cents of each additional Euro they get and they save 30 cents
Source: Mankiw (2000) Macroeconomics, Chapter 3 p. 42-76 7
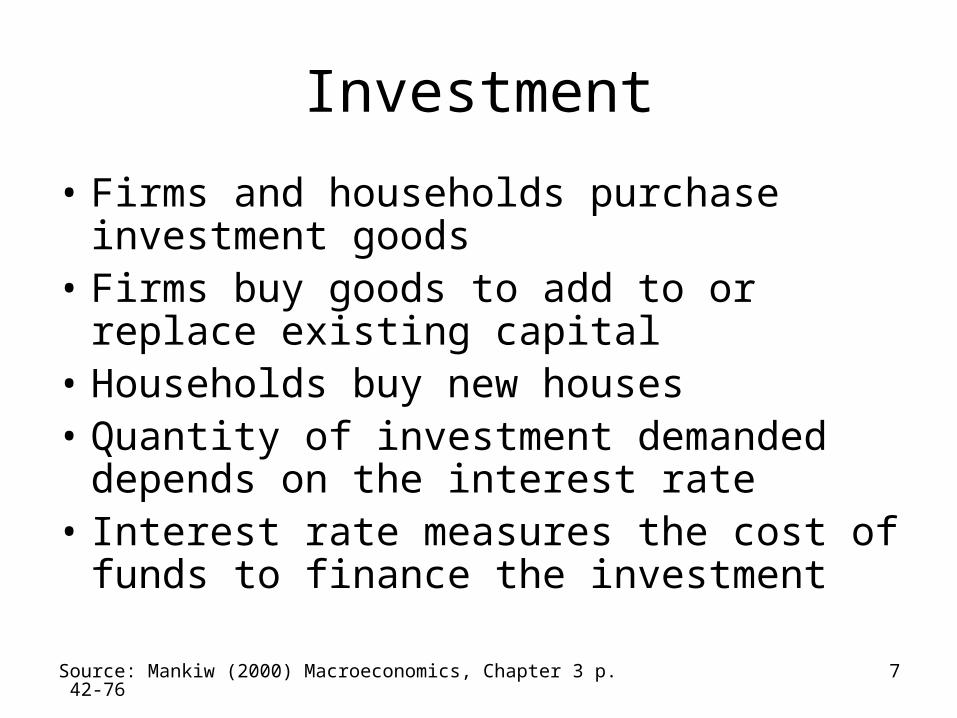
Investment
• Firms and households purchase investment goods
• Firms buy goods to add to or replace existing capital
• Households buy new houses• Quantity of investment demanded
depends on the interest rate• Interest rate measures the cost of funds to
finance the investment
Source: Mankiw (2000) Macroeconomics, Chapter 3 p. 42-76 8
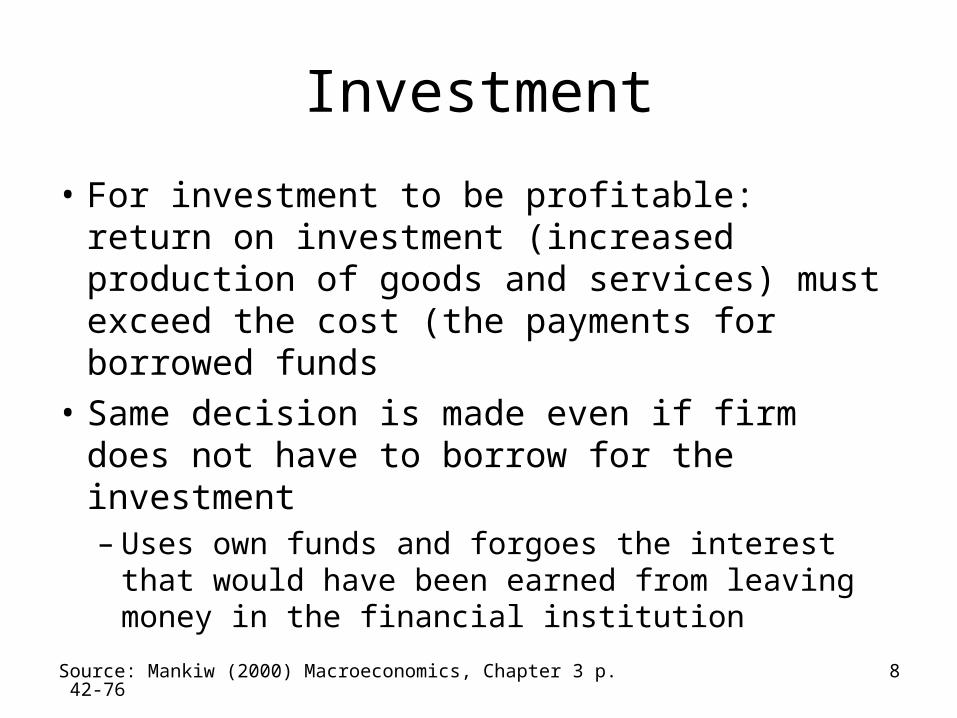
Investment
• For investment to be profitable: return on investment (increased production of goods and services) must exceed the cost (the payments for borrowed funds
• Same decision is made even if firm does not have to borrow for the investment– Uses own funds and forgoes the interest that
would have been earned from leaving money in the financial institution

Source: Mankiw (2000) Macroeconomics, Chapter 3 p. 42-76 9
Investment
• Nominal and real interest rates
• Real interest rate is corrected for the effects of inflation
• Real interest rates measure the true cost of borrowing and determines the quantity of investment
I = I(r)
Graph: the investment function

Source: Mankiw (2000) Macroeconomics, Chapter 3 p. 42-76 10
Government Purchases
• Government purchases e.g. services of public employees, schools, colleges etc.
• Transfer payments are not included in G:– e.g. social welfare, social security payments to
elderly. Payments are not made in exchange for some of the economy’s output
• Transfer payments are opposite to taxes:– Transfer payments increase disposable income– Taxes decrease disposable income
• Y-T: disposable income includes negative impact of taxes and positive impact of transfer payments)
Source: Mankiw (2000) Macroeconomics, Chapter 3 p. 42-76 11
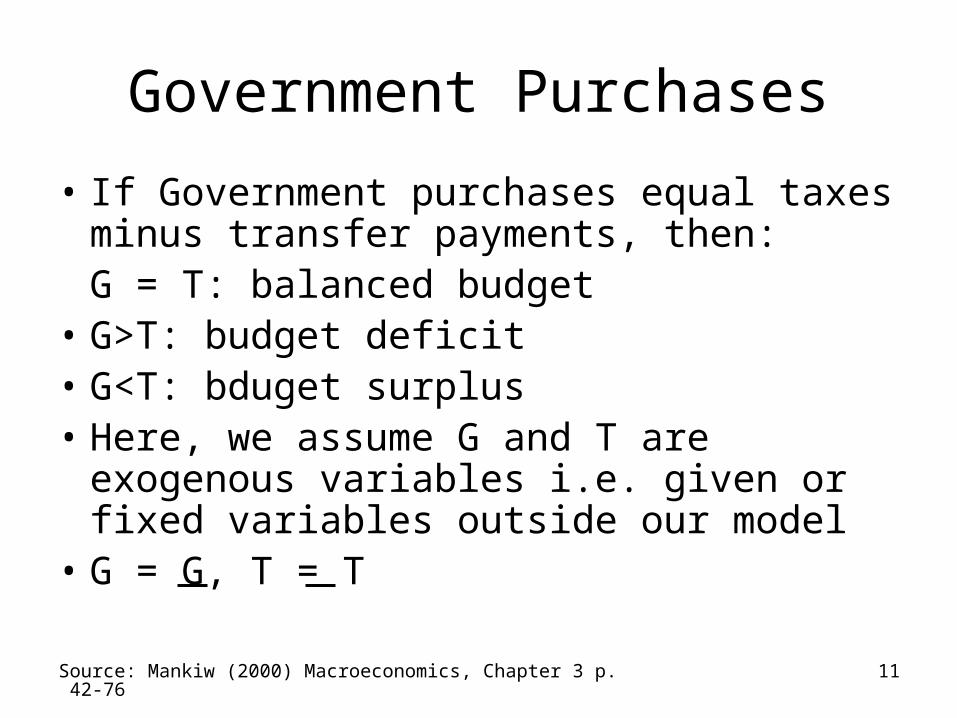
Government Purchases
• If Government purchases equal taxes minus transfer payments, then:G = T: balanced budget
• G>T: budget deficit• G<T: bduget surplus• Here, we assume G and T are exogenous
variables i.e. given or fixed variables outside our model
• G = G, T = T
Source: Mankiw (2000) Macroeconomics, Chapter 3 p. 42-76 12
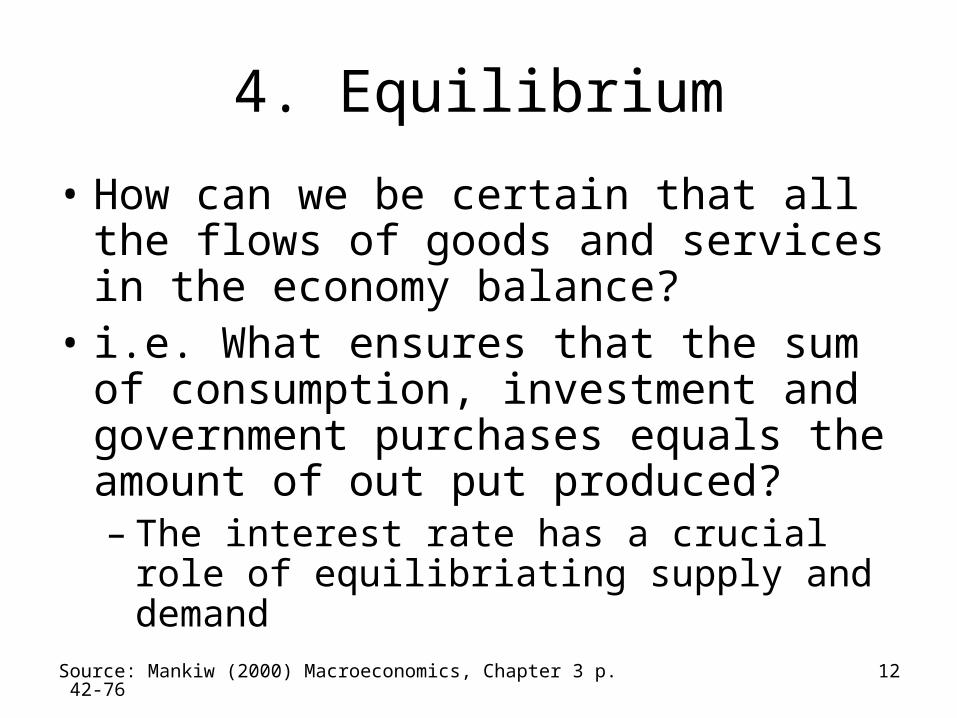
4. Equilibrium
• How can we be certain that all the flows of goods and services in the economy balance?
• i.e. What ensures that the sum of consumption, investment and government purchases equals the amount of out put produced?– The interest rate has a crucial role of
equilibriating supply and demand
Source: Mankiw (2000) Macroeconomics, Chapter 3 p. 42-76 13
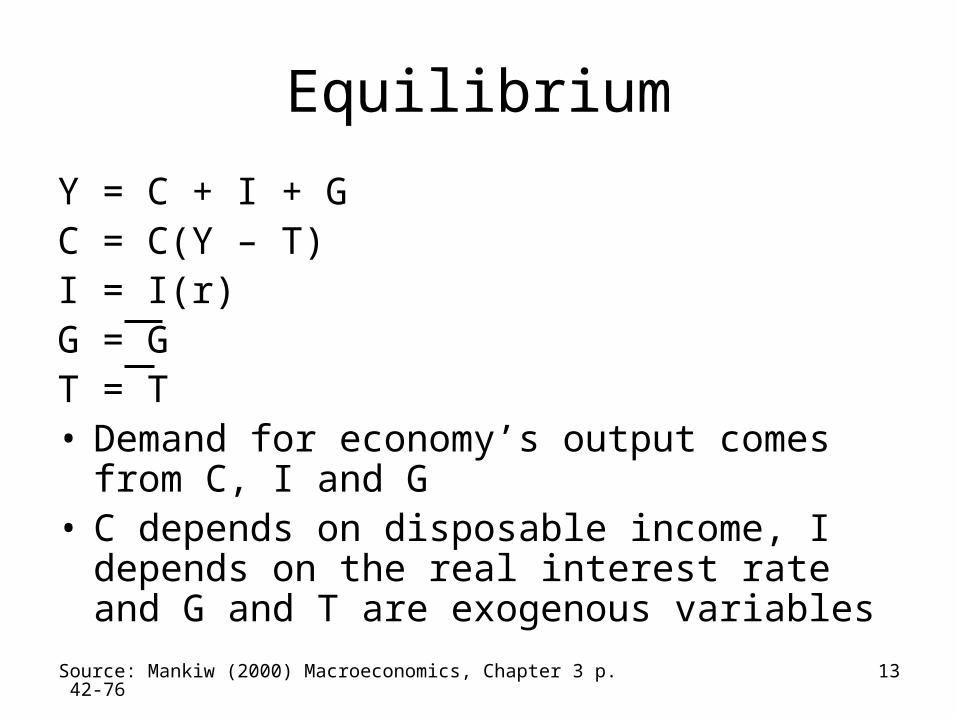
Equilibrium
Y = C + I + GC = C(Y – T)I = I(r)G = GT = T• Demand for economy’s output comes from C, I
and G• C depends on disposable income, I depends on
the real interest rate and G and T are exogenous variables
Source: Mankiw (2000) Macroeconomics, Chapter 3 p. 42-76 14
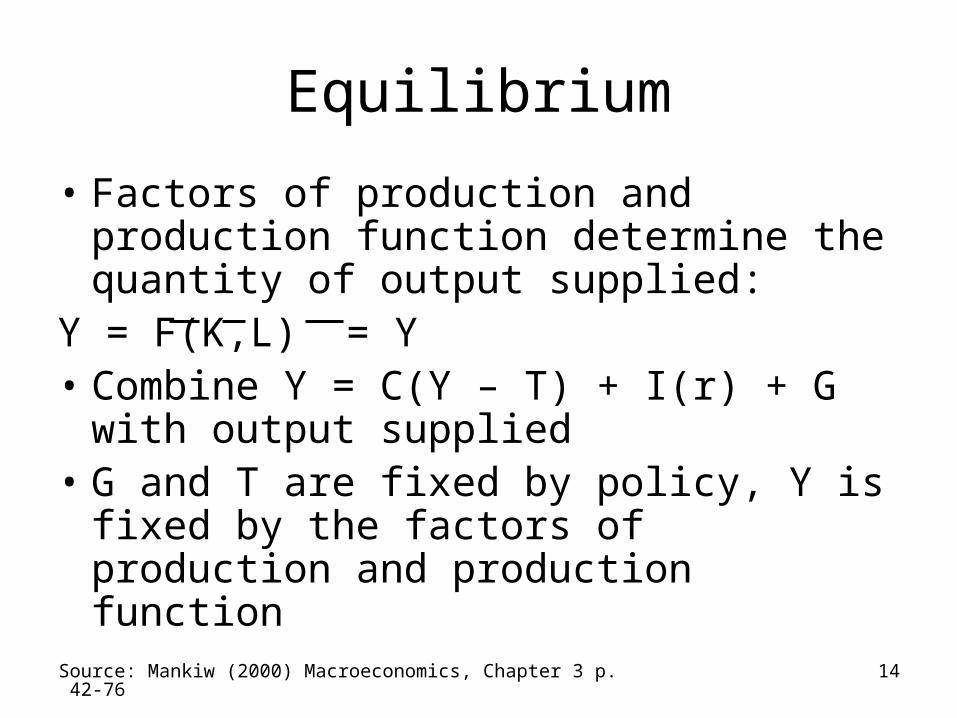
Equilibrium
• Factors of production and production function determine the quantity of output supplied:
Y = F(K,L) = Y• Combine Y = C(Y – T) + I(r) + G with
output supplied• G and T are fixed by policy, Y is fixed by
the factors of production and production function
Source: Mankiw (2000) Macroeconomics, Chapter 3 p. 42-76 15
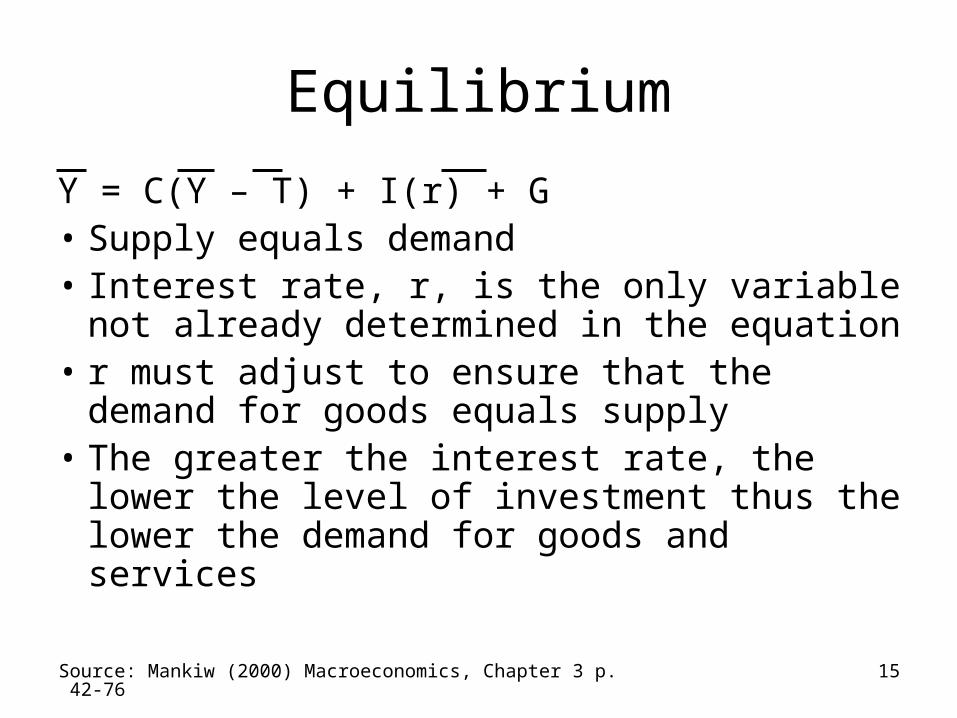
Equilibrium
Y = C(Y – T) + I(r) + G• Supply equals demand• Interest rate, r, is the only variable not
already determined in the equation• r must adjust to ensure that the demand
for goods equals supply• The greater the interest rate, the lower the
level of investment thus the lower the demand for goods and services
Source: Mankiw (2000) Macroeconomics, Chapter 3 p. 42-76 16
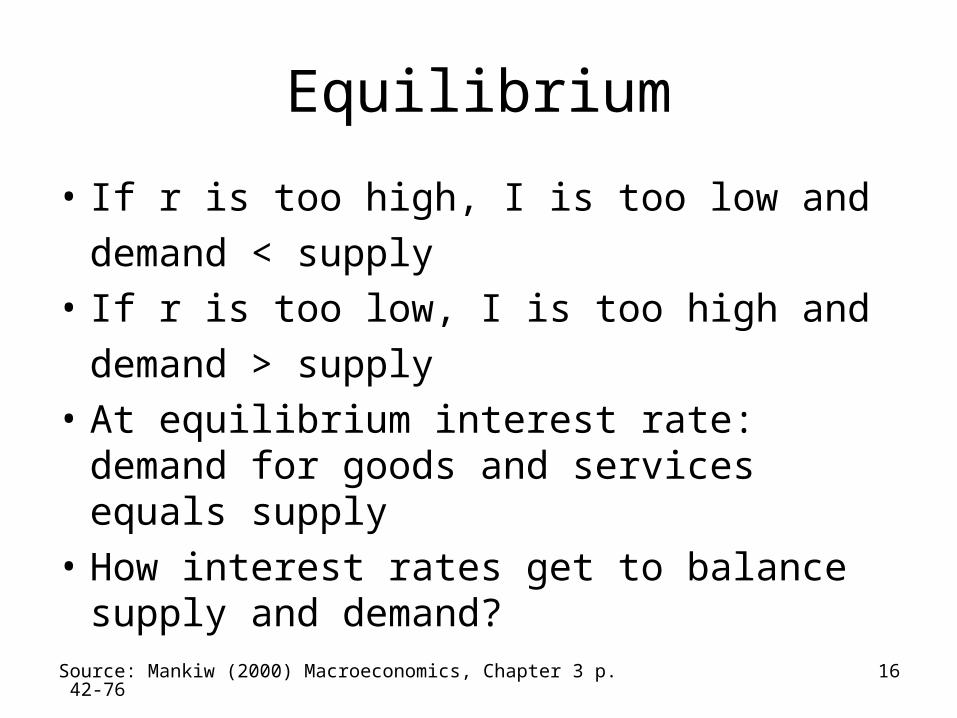
Equilibrium
• If r is too high, I is too low and
demand < supply
• If r is too low, I is too high and
demand > supply
• At equilibrium interest rate: demand for goods and services equals supply
• How interest rates get to balance supply and demand?
Source: Mankiw (2000) Macroeconomics, Chapter 3 p. 42-76 17
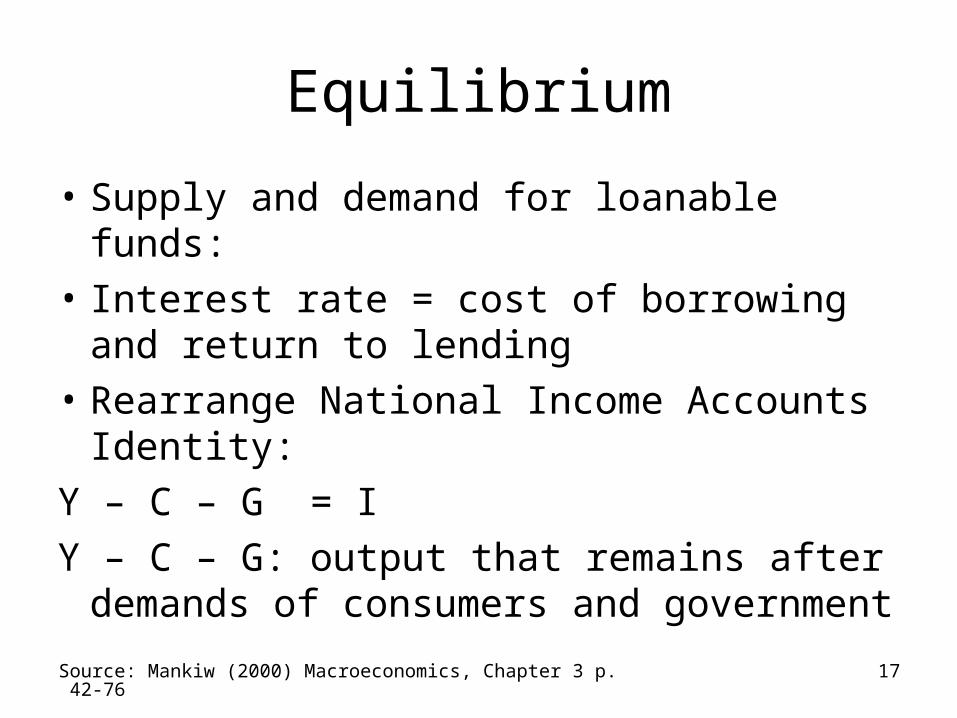
Equilibrium
• Supply and demand for loanable funds:
• Interest rate = cost of borrowing and return to lending
• Rearrange National Income Accounts Identity:
Y – C – G = I
Y – C – G: output that remains after demands of consumers and government
Source: Mankiw (2000) Macroeconomics, Chapter 3 p. 42-76 18
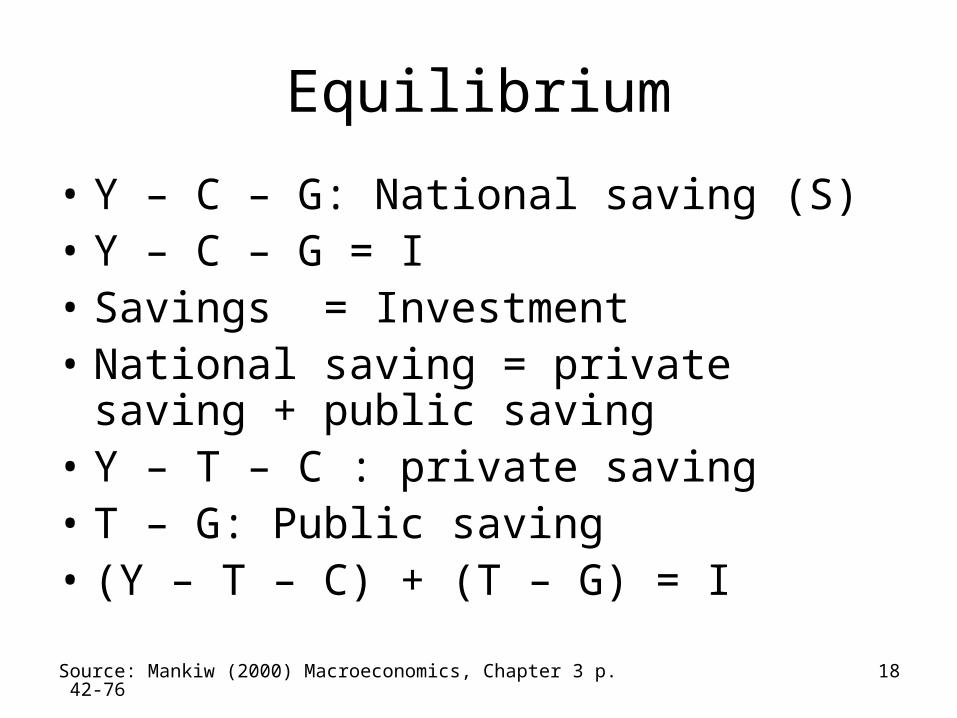
Equilibrium
• Y – C – G: National saving (S)• Y – C – G = I• Savings = Investment• National saving = private saving + public
saving• Y – T – C : private saving• T – G: Public saving• (Y – T – C) + (T – G) = I
Source: Mankiw (2000) Macroeconomics, Chapter 3 p. 42-76 19
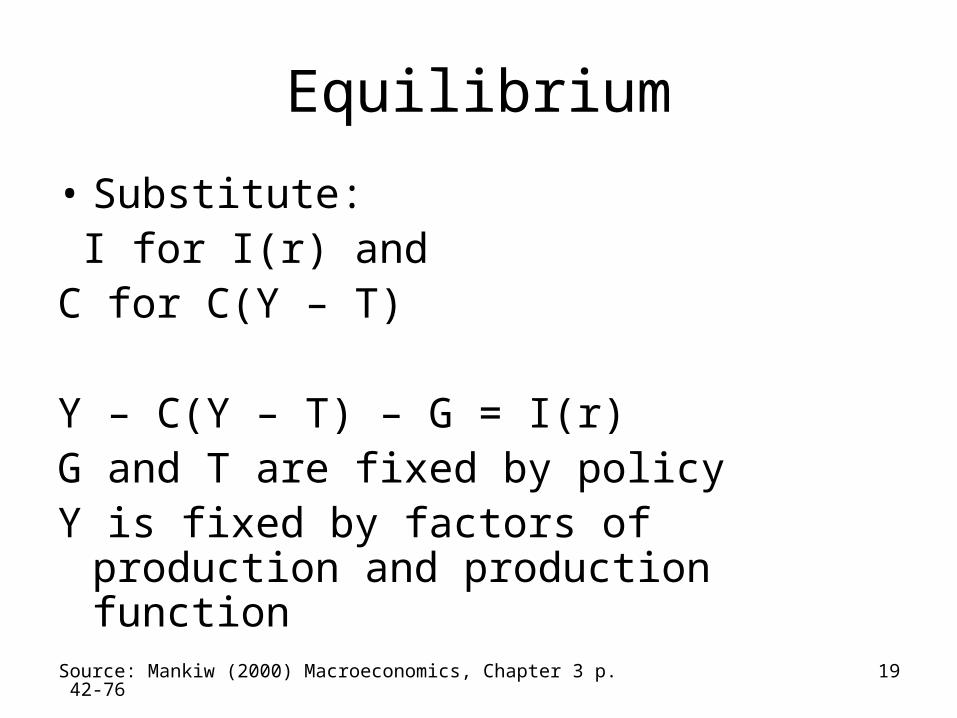
Equilibrium
• Substitute: I for I(r) andC for C(Y – T)
Y – C(Y – T) – G = I(r)G and T are fixed by policyY is fixed by factors of production and
production function

Source: Mankiw (2000) Macroeconomics, Chapter 3 p. 42-76 20
Equilibrium
• Y – C(Y – T) – G = I(r)
S = I(r)
• National saving depends on Y, G and T, which are all fixed, so National Saving is fixed
• Graph of saving and investment
• The interest rate adjusts to bring saving and investment into balance
Source: Mankiw (2000) Macroeconomics, Chapter 3 p. 42-76 21
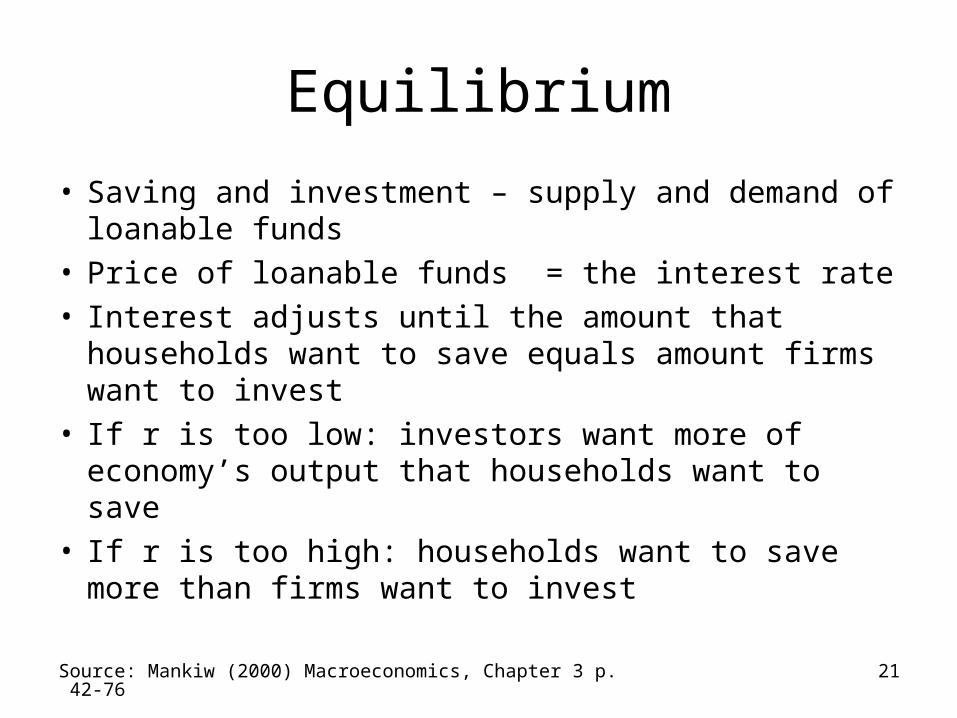
Equilibrium
• Saving and investment – supply and demand of loanable funds
• Price of loanable funds = the interest rate• Interest adjusts until the amount that households
want to save equals amount firms want to invest• If r is too low: investors want more of economy’s
output that households want to save• If r is too high: households want to save more
than firms want to invest
Source: Mankiw (2000) Macroeconomics, Chapter 3 p. 42-76 22
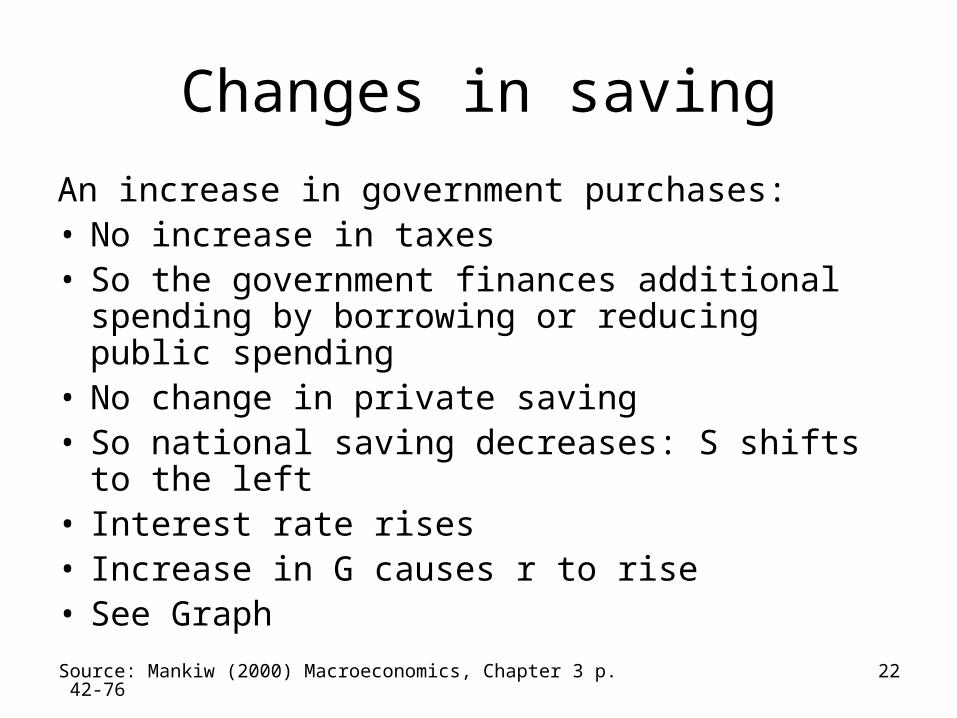
Changes in saving
An increase in government purchases:• No increase in taxes• So the government finances additional spending
by borrowing or reducing public spending• No change in private saving • So national saving decreases: S shifts to the left • Interest rate rises • Increase in G causes r to rise• See Graph
Source: Mankiw (2000) Macroeconomics, Chapter 3 p. 42-76 23
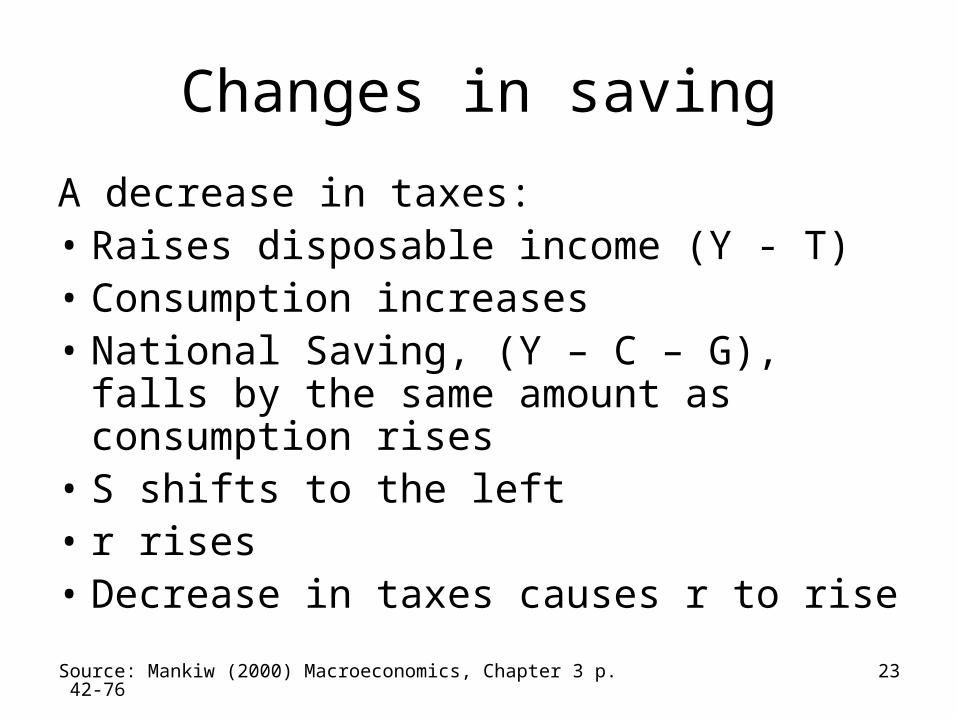
Changes in saving
A decrease in taxes:• Raises disposable income (Y - T) • Consumption increases• National Saving, (Y – C – G), falls by the
same amount as consumption rises• S shifts to the left• r rises• Decrease in taxes causes r to rise

Source: Mankiw (2000) Macroeconomics, Chapter 3 p. 42-76 24
Changes in investment demand
• An increase in the demand for investment might be because of an increase in technological innovation
• An increase in demand for investment shifts I to the right and raises interest rates
• See graph
Source: Mankiw (2000) Macroeconomics, Chapter 3 p. 42-76 25
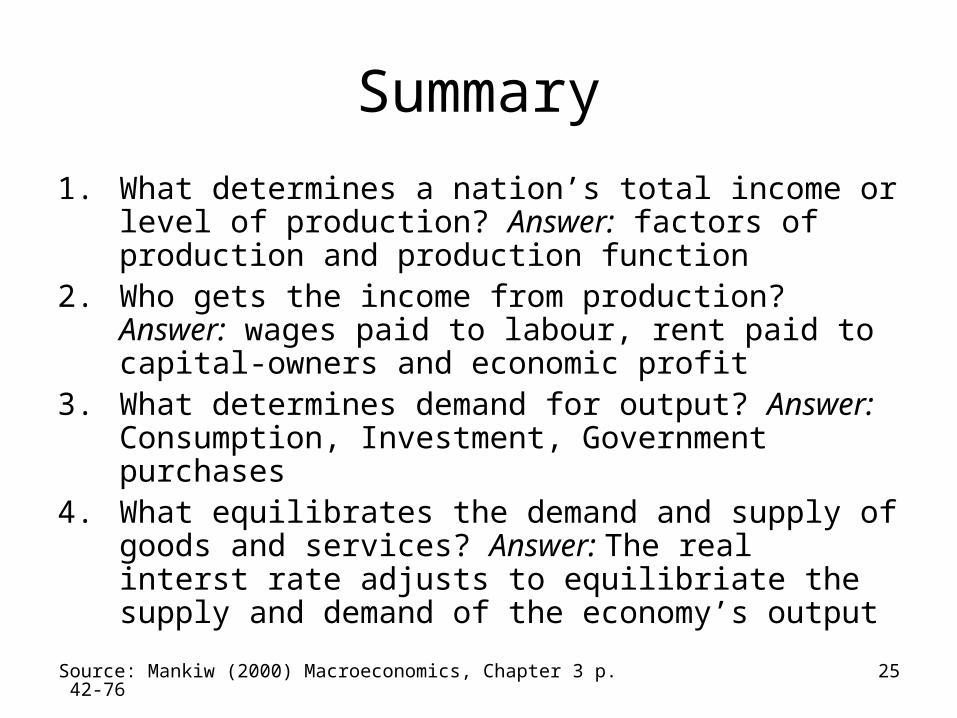
Summary
1. What determines a nation’s total income or level of production? Answer: factors of production and production function
2. Who gets the income from production? Answer: wages paid to labour, rent paid to capital-owners and economic profit
3. What determines demand for output? Answer: Consumption, Investment, Government purchases
4. What equilibrates the demand and supply of goods and services? Answer: The real interst rate adjusts to equilibriate the supply and demand of the economy’s output