south bend station alternatives
TRANSCRIPT

South Bend Station Alternatives
Feasibility Study Findings
April 19, 2018

AECOM Scope for City of South Bend
Four Station Locations
1. Chocolate Factory (SWC
US 20 & US 31)
2. Honeywell Site
3. Amtrak Station Site
4. Downtown South Bend –
near Union Station
Four Tasks
1. Technical / Physical
feasibility analysis
a. Capital Costs
b. O&M Costs
2. Ridership / Schedule
analysis
3. Economic Impacts analysis
a. TOD / Real Estate potential
b. Economic impacts
4. Final report / presentation
materials
2April 19, 2018

Alternative Station Sites
3April 19, 2018

Travel Times and Ridership

Comparative Travel Times,
Fastest Train to Millennium Station
82 82 82 84 84
115
0
20
40
60
80
100
120
140
ChocolateFactory
Honeywell Amtrak Downtown ProposedRealigned
AirportStation (Alt
G)
CurrentAirportStation
5April 19, 2018
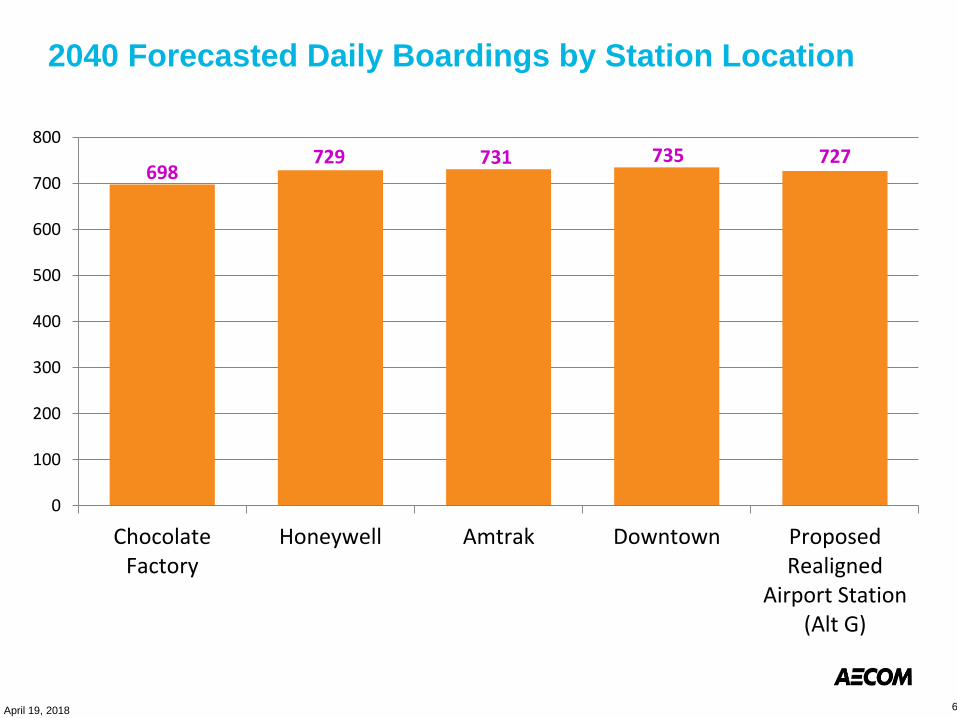
2040 Forecasted Daily Boardings by Station Location
698729 731 735 727
0
100
200
300
400
500
600
700
800
ChocolateFactory
Honeywell Amtrak Downtown ProposedRealigned
Airport Station(Alt G)
6April 19, 2018

Capital and O&M Costs

Capital Costs by SCC Category (in thousands of 2017 $)
FTA Cost Category
Chocolate
Factory Honeywell Amtrak Downtown
Proposed
Realigned
Airport
Station
(Alt G)
10 Guideway & Track Elements $7,537 $3,434 $3,552 $27,579 $4,424
20 Stations, Stops, Terminals $7,040 $7,040 $7,040 $7,040 $2,640
30 Support Facilities: Yards, Shops $776 $0 $3,559 $3,785 $0
40 Sitework & Special Conditions $5,324 $3,056 $4,115 $10,213 $3,854
50 Systems $7,636 $4,358 $5,759 $11,928 $7,949
CONSTRC SUBTOTAL (10-50) $28,312 $17,888 $24,024 $60,544 $18,866
60 ROW, Land, Existing Improvements $91 $200 $225 $5,400 $3,000
80 Professional Srvs. (Cat. 10-50) $10,096 $3,612 $4,594 $15,898 $3,769
Subtotal $38,499 $21,700 $28,843 $81,842 $25,635
90 Unallocated Contingency$5,775
15%
$2,170
10%
$2,884
10%
$20,460
25%
$3,845
15%
Total (in thousands of 2017 $) $44,274 $23,870 $31,727 $102,302 $29,480
8April 19, 2018

Capital Costs Summary (in millions of 2017 $)
$0
$20
$40
$60
$80
$100
$120
ChocolateFactory
Honeywell Amtrak Downtown ProposedRealigned
Airport Station(Alt G)
$44.3
$23.9$31.7
$102.3
$29.5
9April 19, 2018

Operations & Maintenance Costs (Annual, in 2017 $)
$247,430
$577,430 $577,430 $577,430
$247,430
$0
$100,000
$200,000
$300,000
$400,000
$500,000
$600,000
$700,000
Choc Factory Honeywell Amtrak Downtown ProposedRealigned
Airport Station(Alt G)
10April 19, 2018
Economic Analysis: TOD and Impacts

Approach
1. Identify the amount of developable land, existing values and
compatible land uses in each ½ mile station area
2. Determine the potential market demand per station based on a share
of the city’s capture rate, calibrated to each station’s value
premium/discount to market
3. Develop 10-year program for each station based on market trends,
estimated market demand, developable land, and zoning/density
constraints
4. Estimate future property tax revenues of new development using
assessed values from each scenario
5. Estimate each alternative’s total economic impact and other tax
revenues using construction costs and station capital costs
12April 19, 2018
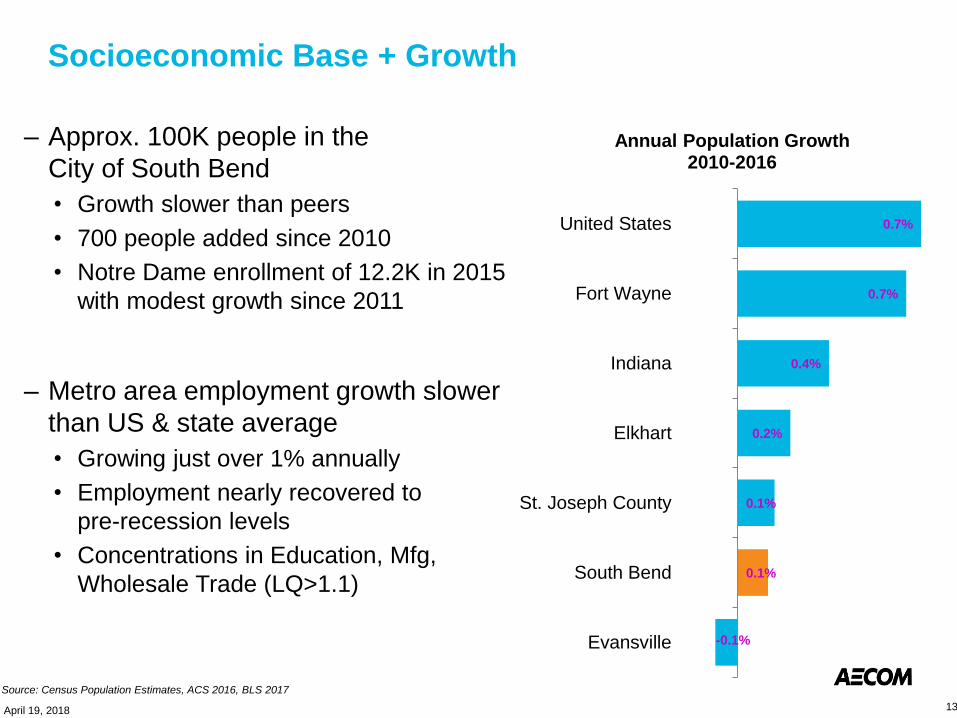
Socioeconomic Base + Growth
– Approx. 100K people in the
City of South Bend
• Growth slower than peers
• 700 people added since 2010
• Notre Dame enrollment of 12.2K in 2015
with modest growth since 2011
– Metro area employment growth slower
than US & state average
• Growing just over 1% annually
• Employment nearly recovered to
pre-recession levels
• Concentrations in Education, Mfg,
Wholesale Trade (LQ>1.1)
-0.1%
0.1%
0.1%
0.2%
0.4%
0.7%
0.7%
Evansville
South Bend
St. Joseph County
Elkhart
Indiana
Fort Wayne
United States
Annual Population Growth 2010-2016
Source: Census Population Estimates, ACS 2016, BLS 2017
13April 19, 2018
Employment + Real Estate Growth
– Retail & Industrial market strength:
faster growth in occupied space than
inventory
– Office market weakness:
growth in inventory faster than
occupancy
– Jobs are growing faster than either
inventory or occupied space
1.6%
1.0%
1.3%
0.2%
0.4%
0.5%0.6%
0.1%
0.8%
Retail Office Industrial
Annualized Growth 2010-2017
Jobs
Inventory
Occupied Space
Source: Emsi data for St. Joseph County (QCEW & Non-QCEW employees); CoStar real estate data
14April 19, 2018

Transportation Connections
– Existing South Bend Airport Station experiences unusually high
weekend ridership, with a typical trip purpose of shopping/recreation
• Notable Notre Dame game day ridership (4%)
– Combination of double-track & new terminal station location reduces
travel time to Chicago to become competitive with Metra-served
communities, enhancing market position
– ~400 (and growing) Chicago CBD workers living in station marketshed
• Compare to Metra stations with ~90 min. travel time, such as Harvard, Ingleside,
Kenosha, Fox Lake, which see 10-60% commuter rail capture rates of CBD workers
15
Source: Bureau of Transportation Statistics, LEHD O-D data, Metra0.8%
4.2%4.9%
6.2%
Within 50 miles Within 20 miles Within 10 miles Within 1 mile
Annual Growth in Chicago CBD Workers near South Bend Station (2010-2015)
15April 19, 2018

10 Year Program
Programmed Use in Developable Acres in Quarter Mile
Residential Industrial Retail Office
Open/
Stormwater
Chocolate 0% 45% 30% 0% 25%
Honeywell Industrial 35% 25% 15% 0% 25%
Honeywell Mixed-Use 55% 5% 15% 0% 25%
Amtrak 45% 20% 10% 0% 25%
Downtown 45% 15% 10% 5% 25%
Current Airport Station 0% 75% 0% 0% 25%
Proposed Airport Station 0% 75% 0% 0% 25%
Programmed Use in Developable Acres in Half Mile
Residential Industrial Retail Office
Open/
Stormwater
Chocolate 50% 15% 5% 0% 30%
Honeywell Industrial 40% 15% 5% 0% 40%
Honeywell Mixed-Use 57% 5% 8% 0% 30%
Amtrak 60% 5% 5% 0% 30%
Downtown 45% 12% 8% 5% 30%
Current Airport Station 0% 50% 20% 0% 30%
Proposed Airport Station 0% 50% 20% 0% 30%
– Residential includes single-family and multi-family land uses
– Industrial includes both production and flex facilities
18April 19, 2018

10 Year Program and Deliveries
– Chocolate Factory • Mix of production & flex industrial
• Retail based on Choc. Factory plan
• Low-density single-family residential
– Honeywell Mixed-Use• Industrial flex reflective of likely employment
• Shopping center retail format
• Residential a mix of dense single-family, duplex, townhome, & low-rise apartments
– Amtrak• Smaller program due to less attractive values
for developers; incentives likely necessary
• Shopping center retail format
• Residential a mix of dense single-family,
duplex, townhome, & low-rise apartments
– Downtown• Larger program due to more attractive values
related to CBD density & trends
• Proportion of Downtown retail deliveries equivalent to ground-floor retail in the delivered 3- to 4-floor multifamily developments
• Industrial flex facilities south of rail line
– Airport• Proposed Airport station has a smaller program
due to less developable land (presence of RPZ & land dedicate to airport/terminal operations)
• Industrial includes flex and manufacturing
Total Estimated DeliveriesDwelling Units Industrial SF Retail SF Office SF
Chocolate 50 398,000 85,000 0
Honeywell Industrial 220 184,000 68,000 0
Honeywell Mixed-Use 470 48,000 80,000 0
Amtrak 270 76,000 37,000 0
Downtown 670 217,000 109,000 52,000
Current Airport Station 0 394,000 66,000 0
Proposed Airport Station 0 271,000 56,000 0
19April 19, 2018

10 Year Estimated Deliveries & Value
– Values reflect only the estimated value of new construction, not the uplift
to adjacent property values
– Values are estimates based on averages and rounded
Total Estimated ValueResidential Industrial Retail Office Total Value
Chocolate $11,660,000 $19,970,000 $8,600,000 $0 $40,230,000
Honeywell Industrial $32,990,000 $8,280,000 $6,050,000 $0 $47,320,000
Honeywell Mixed-Use $63,650,000 $2,260,000 $7,160,000 $0 $73,070,000
Amtrak $19,700,000 $1,820,000 $1,730,000 $0 $23,250,000
Downtown $116,780,000 $12,750,000 $12,200,000 $6,090,000 $147,810,000
Current Airport Station $0 $19,150,000 $5,440,000 $0 $24,590,000
Proposed Airport Station $0 $13,200,000 $4,620,000 $0 $17,820,000
Total Estimated DeliveriesDwelling Units Industrial SF Retail SF Office SF
Chocolate 50 398,000 85,000 0
Honeywell Industrial 220 184,000 68,000 0
Honeywell Mixed-Use 470 48,000 80,000 0
Amtrak 270 76,000 37,000 0
Downtown 670 217,000 109,000 52,000
Current Airport Station 0 394,000 66,000 0
Proposed Airport Station 0 271,000 56,000 0
2017 Dollars 20

Results Summary
% Station Capital
Cost Recovered in
Est. Tax Revenue
Economic Impact as
% of Station Capital
Cost
Chocolate Factory 33% 310%
Honeywell Industrial 56% 526%
Honeywell Mixed-Use 77% 684%
Amtrak 34% 419%
Downtown 42% 386%
Proposed Airport Station 28% 271%
Current Airport Station N/A N/A
Estimated TOD Development and Economic Impact Summary (10 Year)
New
Construction
(sq. ft.)
Assessed Value
(2017 $)
Development
Construction
Cost
(2017 $)
Station Capital
Cost
(2017 $)
Economic Output
(Year of Occurrence $)
Tax Revenues
(Year of Occurrence $)
Chocolate Factory 580,000 $40,230,000 $31,300,000 $44,274,000 $144,400,000 $15,400,000
Honeywell Industrial 600,000 $47,320,000 $42,460,000 $23,870,000 $132,000,000 $14,110,000
Honeywell Mixed-Use 740,000 $73,070,000 $60,580,000 $23,870,000 $171,500,000 $19,410,000
Amtrak 490,000 $23,250,000 $38,400,000 $31,727,000 $139,700,000 $11,440,000
Downtown 1,280,000 $147,810,000 $107,440,000 $102,302,000 $415,300,000 $45,150,000
Proposed Airport
Station330,000 $17,820,000 $15,040,000 $29,480,000 $83,800,000 $8,800,000
Current Airport Station 460,000 $24,590,000 $20,710,000 $0 $39,000,000 $7,210,000
21April 19, 2018

Results & Implications
– Alternatives with large residential programs (Downtown, Honeywell Mixed-Use)
show greatest potential impact due to higher development values and densities
entailed
– Highest estimated values in Downtown, along with highest costs
– Amtrak’s modest home values are a challenge for new construction
– Limited land available near Existing & especially Proposed Airport Station due
to airport/terminal operations and protection zones
– Airport land use compatibility proximity would tend to dictate non-
residential/industrial uses in Chocolate Factory, Existing Airport Station, &
Proposed Airport Station locations
– Airport Authority interest in cargo-oriented development could support growth
during this 10-year horizon.
22April 19, 2018

Conclusions and Comparisons
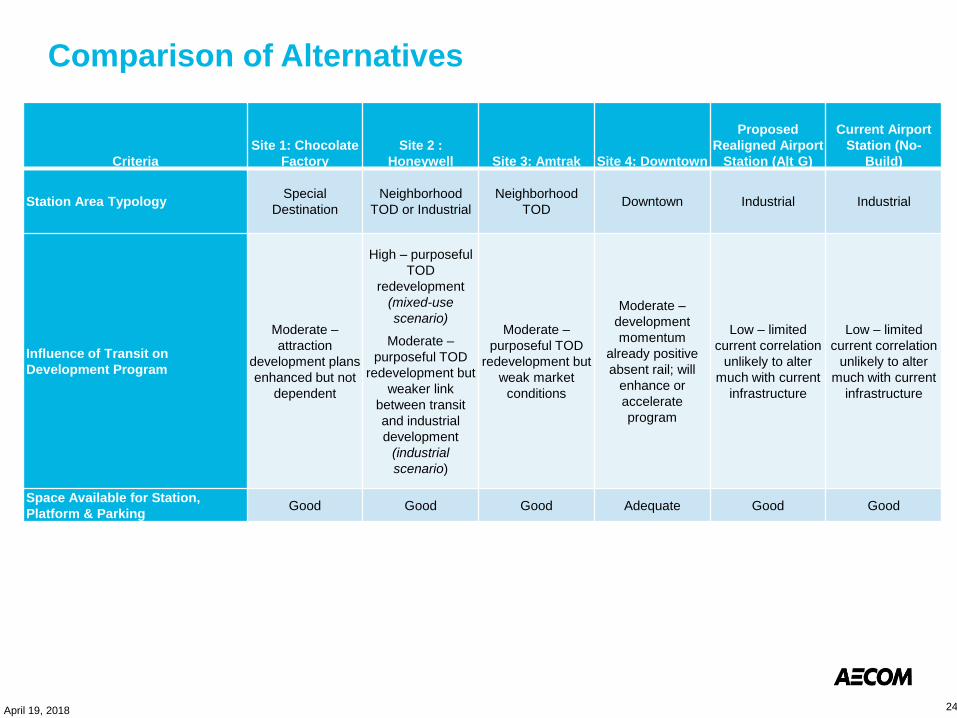
Comparison of Alternatives
Criteria
Site 1: Chocolate
Factory
Site 2 :
Honeywell Site 3: Amtrak Site 4: Downtown
Proposed
Realigned Airport
Station (Alt G)
Current Airport
Station (No-
Build)
Station Area TypologySpecial
Destination
Neighborhood
TOD or Industrial
Neighborhood
TODDowntown Industrial Industrial
Influence of Transit on
Development Program
Moderate –
attraction
development plans
enhanced but not
dependent
High – purposeful
TOD
redevelopment
(mixed-use
scenario)
Moderate –
purposeful TOD
redevelopment but
weaker link
between transit
and industrial
development
(industrial
scenario)
Moderate –
purposeful TOD
redevelopment but
weak market
conditions
Moderate –
development
momentum
already positive
absent rail; will
enhance or
accelerate
program
Low – limited
current correlation
unlikely to alter
much with current
infrastructure
Low – limited
current correlation
unlikely to alter
much with current
infrastructure
Space Available for Station,
Platform & ParkingGood Good Good Adequate Good Good
24April 19, 2018

Comparison of Alternatives
Criteria
Site 1: Chocolate
Factory Site 2 : Honeywell Site 3: Amtrak Site 4: Downtown
Proposed
Realigned Airport
Station (Alt G)
Current Airport
Station (No-
Build)
Station Area Acres Available for
Development within Half-Mile221 86 64 83 34 63
Potential New Construction Value
within Half-Mile$40,230,000
$73,070,000
(mixed-use
scenario)
$47,320,000
(industrial use
scenario)
$23,250,000 $147,810,000 $17,820,000 $24,590,000
Potential Economic Impact (10 yr) $144,400,000
$171,500,000
(mixed-use
scenario)
$132,000,000
(industrial use
scenario)
$139,700,000 $415,300,000 $83,800,000 $39,000,000
Potential Fiscal Impact (10 yr)
$5,921,000
(property)
$15,400,000
(all taxes)
$8,563,000
(property)
$19,410,000
(all taxes)
(mixed-use
scenario)
$5,640,000
(property)
$14,110,000
(all taxes)
(industrial scenario)
$2,556,000
(property)
$11,440,000
(all taxes)
$18,639,000
(property)
$45,150,000
(all taxes)
$3,251,000
(property)
$8,800,000
(all taxes)
$4,486,000
(property)
$7,210,000
(all taxes)
25April 19, 2018
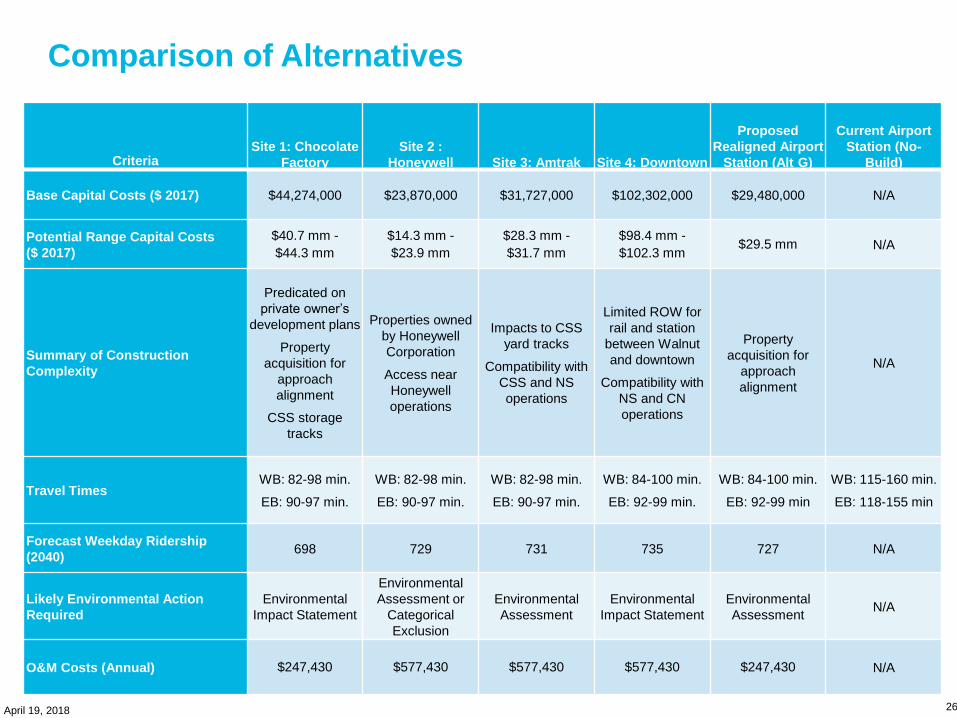
Comparison of Alternatives
CriteriaSite 1: Chocolate
Factory
Site 2 :
Honeywell Site 3: Amtrak Site 4: Downtown
Proposed
Realigned Airport
Station (Alt G)
Current Airport
Station (No-
Build)
Base Capital Costs ($ 2017) $44,274,000 $23,870,000 $31,727,000 $102,302,000 $29,480,000 N/A
Potential Range Capital Costs
($ 2017)
$40.7 mm -
$44.3 mm
$14.3 mm -
$23.9 mm
$28.3 mm -
$31.7 mm
$98.4 mm -
$102.3 mm$29.5 mm N/A
Summary of Construction
Complexity
Predicated on
private owner’s
development plans
Property
acquisition for
approach
alignment
CSS storage
tracks
Properties owned
by Honeywell
Corporation
Access near
Honeywell
operations
Impacts to CSS
yard tracks
Compatibility with
CSS and NS
operations
Limited ROW for
rail and station
between Walnut
and downtown
Compatibility with
NS and CN
operations
Property
acquisition for
approach
alignment
N/A
Travel TimesWB: 82-98 min.
EB: 90-97 min.
WB: 82-98 min.
EB: 90-97 min.
WB: 82-98 min.
EB: 90-97 min.
WB: 84-100 min.
EB: 92-99 min.
WB: 84-100 min.
EB: 92-99 min
WB: 115-160 min.
EB: 118-155 min
Forecast Weekday Ridership
(2040)698 729 731 735 727 N/A
Likely Environmental Action
Required
Environmental
Impact Statement
Environmental
Assessment or
Categorical
Exclusion
Environmental
Assessment
Environmental
Impact Statement
Environmental
AssessmentN/A
O&M Costs (Annual) $247,430 $577,430 $577,430 $577,430 $247,430 N/A
26April 19, 2018

Discussion
April 19, 2018