south dakota - gfp.sd.gov · annual fish population and angler use, harvest and preference surveys...
TRANSCRIPT

ANNUAL FISH POPULATION
AND
ANGLER USE, HARVEST AND PREFERENCE SURVEYS
ON
LAKE OAHE, SOUTH DAKOTA, 2015
South Dakota
Department of
Game, Fish and Parks
Wildlife Division
Joe Foss Building
Pierre, South Dakota 57501-3182
Annual Report No. 16-03
ompletipletion Report
SOUTH
DAKOTA

ii
ANNUAL FISH POPULATION
AND
ANGLER USE, HARVEST AND PREFERENCE SURVEYS
ON
LAKE OAHE, SOUTH DAKOTA, 2015
By
Kyle Potter, Hilary Meyer, Robert Hanten, Mike Greiner, Mark Fincel and Mike Smith
Ft. Pierre District Office
South Dakota Dept. of Game, Fish, and Parks
Annual Report
Dingell-Johnson Project ------------------------------------------------------------------ F-21-R-48
Job Numbers -------------------------------------------------------------------------- 2102 and 2109
Date ----------------------------------------------------------------------------------------- April 2016
Research and Management
Program Administrator
Geno Adams
Department Secretary
Kelly Hepler
Production
Program Administrator
Will Sayler
Wildlife Division Director
Tony Leif
Grants Coordinator
Tanna Zabel
Aquatics Section Chief
John Lott

iii
PREFACE
Information collected during 2015 is summarized in this report. Copies of this report and
references to the data can be made with permission from the authors or the Director of the
Division of Wildlife, South Dakota Department of Game, Fish and Parks, 523 E. Capitol,
Pierre, SD 57501.
The authors would like to thank the following individuals from the South Dakota
Department of Game, Fish and Parks who helped with data collection, data entry,
manuscript preparation, and report editing: J. Aberle, C. Anderson, C. Burback, L.
Collett, E. Felts, D. Jones, D. Jost, J. Jungwirth, N. Kludt, C. Kruse, A. McGuigan, W.
Radigan, B. Schwery, G. Tibbs, J. Tostenson, and F. Turner.
The collection and analysis of data for these surveys was funded, in part, by Federal Aid
in Sport Fish Restoration, (D-J) project F-21-R-48, Statewide Fish Management Surveys.
Some of these data have been presented previously in F-21 segments 23 through 47.
iv
EXECUTIVE SUMMARY
This report includes data from annual fish population surveys and angler use and
harvest surveys collected during 2015 on Lake Oahe, South Dakota. Fish population data
and angler use and harvest survey data from previous years are referenced in this report.
Results of these surveys are used to evaluate progress towards objectives outlined in the
Missouri River Fisheries Management Area Strategic Plan.
Walleye comprised 26% and channel catfish comprised 40% of the fish caught in
the 2015 coolwater gill net survey. Twenty species were collected in the coolwater gill
net survey, and mean catch per unit effort (CPUE) for most species was similar to 2014
except walleye, which was lower than in 2014. Black and white crappie were the most
abundant species captured during the August seining survey. Yellow perch and emerald
shiners were also abundant in seine catches. Overall, seine catches were above the long
term mean and were the 4th
highest since the beginning of the survey. No gizzard shad
were captured in standard shoreline seining or gill net surveys.
Mean walleye abundance, as indexed by catch per unit effort (CPUE) was lower
(8.7 walleye/net night) than the ten year average (16.0 walleye/net night) and has
continually declined since 2011 when 25.1 walleye/net night were collected. Upper zone
walleye CPUE remained similar to the 10-year mean of 15.1 walleye/net night.
Proportional size distribution (PSD) was higher than the five year average but PSD-
Preferred (510-629-mm) was lower. Approximately 80% of the walleye collected by gill
nets were less than 381-mm (15-in). Walleye condition had improved from the low in
2012, but a decline was seen in 2015 for all sizes of walleye except preferred size fish
and larger. Growth of walleye aged -1, -2, and-3 improved to rates greater than the five
year mean. Incremental growth for all age classes increased as well, indicating better prey
availability for walleye in Lake Oahe.
Estimated fishing pressure for the South Dakota portion of Lake Oahe was
738,360 h. Angling pressure was lower than the 10 year average (778,617 h). An
estimated 571,664 walleye were caught in Lake Oahe during the May-July 2015 period.
Anglers harvested 56% of walleye caught or 308,513 fish, which was lower than the 10
year average of 350,446 walleye.
Resident anglers represented 76% of the parties interviewed on Lake Oahe. Four
states represented the majority of non-resident anglers which included Minnesota,
Nebraska, Iowa and North Dakota. In 2015, 33% of anglers traveled more than 200 miles
(one way) and 52% of anglers traveled more than 100 miles (one way) to fish Lake Oahe.
Anglers generated an estimated ~$10 million of economic input to local communities
during the May-July period.
Overall angler satisfaction on Lake Oahe from May-July 2015 was 83%. Median
satisfaction rating for angling parties that harvested zero to three walleye per person was
“moderately satisfied”, while parties harvesting three to four walleye per person had a
median rating of “very satisfied”. Anglers that were not “very satisfied” were asked what
would improve their satisfaction rating. “Catch more fish” was the most frequently (57%)
given response, with “improve weather” and “catch larger fish” as the next most popular
responses given by anglers.

v
TABLE OF CONTENTS
PREFACE ......................................................................................................................... iii
EXECUTIVE SUMMARY ............................................................................................. iv
LIST OF TABLES ........................................................................................................... vi
LIST OF FIGURES ......................................................................................................... ix
LIST OF APPENDICES .................................................................................................. x
INTRODUCTION ............................................................................................................ 1
STUDY AREA ................................................................................................................... 2
REGULATION HISTORY .............................................................................................. 6
SAMPLING METHODS ................................................................................................. 8
Fish Population Surveys .................................................................................................. 8 Data Collection ............................................................................................................. 8 Data Analysis ............................................................................................................... 9
Angler Use, Sportfish Harvest and Preference Surveys ................................................ 10 Data Collection ........................................................................................................... 10 Data Analysis ............................................................................................................. 10
RESULTS AND DISCUSSION ..................................................................................... 11
Fish Population Surveys ................................................................................................ 11 Species Composition and Relative Abundance .......................................................... 11 Population Characteristics of Walleye ....................................................................... 11 Population Characteristics of Channel Catfish........................................................... 12
Hydro-acoustic and Suspended Gill Net Surveys .......................................................... 12 Angler Use, Sportfish Harvest and Preference Surveys .............................................. 27
Angler Use.................................................................................................................. 27 Catch, Harvest and Release Estimates ....................................................................... 27 Hourly Catch, Harvest, and Release Rates ................................................................. 27 Angler Demographics and Economic Input ............................................................... 28 Angler Satisfaction and Attitudes .............................................................................. 28
ONGOING AND COOPERATIVE RESEARCH PROJECTS ................................. 47
FISHERY STATUS AND 2016 OUTLOOK ................................................................ 47
MANAGEMENT RECOMMENDATIONS ................................................................ 48
LITERATURE CITED .................................................................................................. 49
APPENDICES ................................................................................................................. 52
vi
LIST OF TABLES
Table 1. Physical characteristics and management classification of Lake Oahe, South
Dakota. .................................................................................................................. 3 Table 2. History of harvest regulations for walleye on Lake Oahe, South Dakota, 1968-
2015. ..................................................................................................................... 7
Table 3. Rainbow smelt and lake herring age and size classes used for size classification
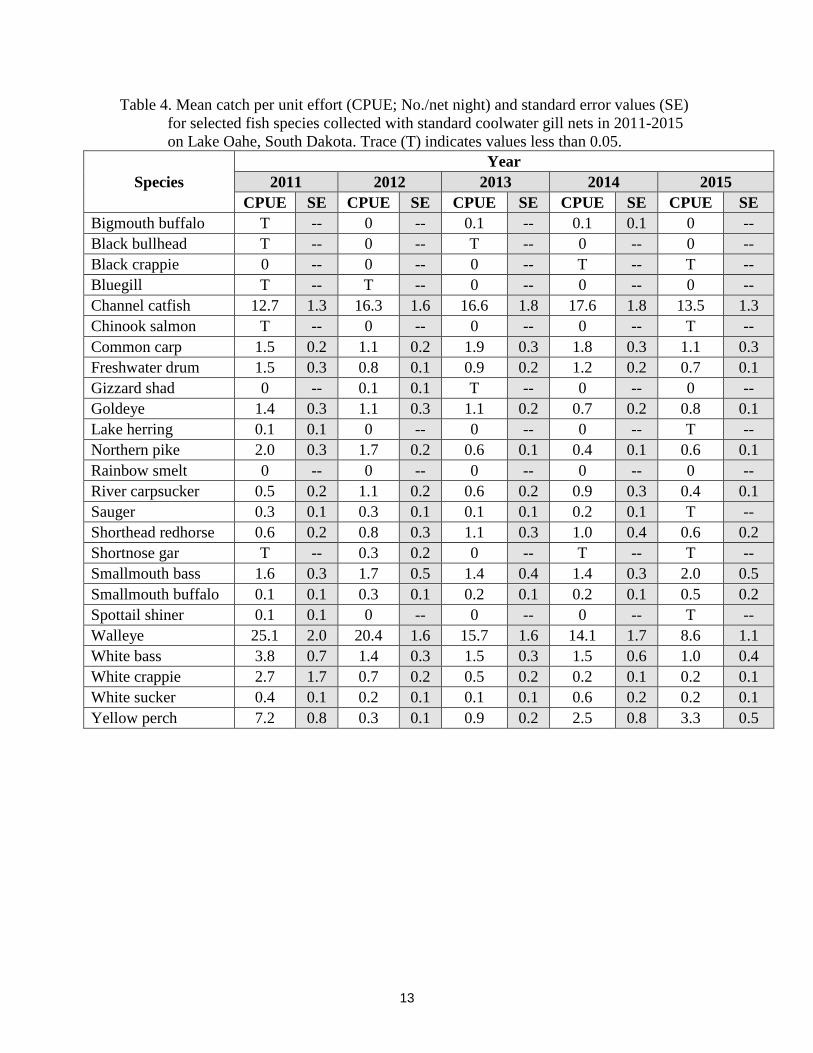
of hydro-acoustic assessment on Lake Oahe, South Dakota. ............................. 10 Table 4. Mean catch per unit effort (CPUE; No./net night) and standard error values (SE)
for selected fish species collected with standard coolwater gill nets in 2011-2015
on Lake Oahe, South Dakota. Trace (T) indicates values less than 0.05. .......... 13
Table 5. Relative species composition, expressed as percent of total catch of all fish
species collected during the standard coolwater gill net survey on Lake Oahe,
South Dakota from 2011-2015. .......................................................................... 14
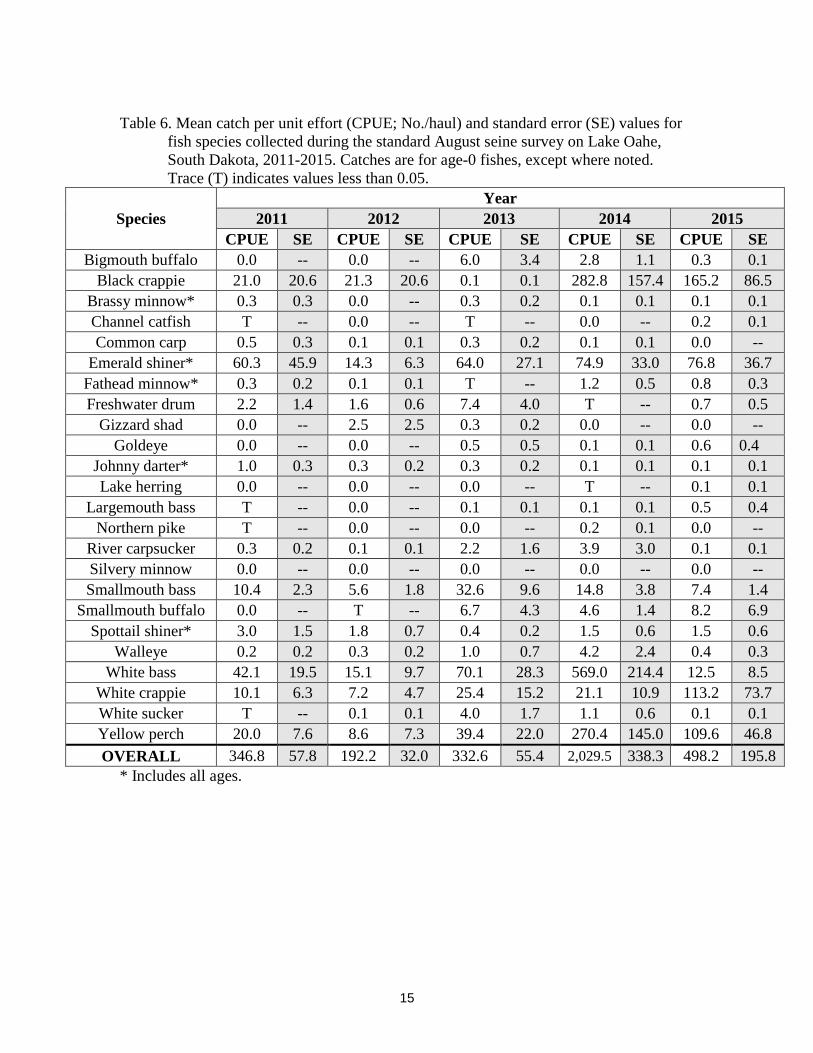
Table 6. Mean catch per unit effort (CPUE; No./haul) and standard error (SE) values for
fish species collected during the standard August seine survey on Lake Oahe,
South Dakota, 2011-2015. Catches are for age-0 fishes, except where noted.
Trace (T) indicates values less than 0.05. ........................................................... 15 Table 7. Proportional size distribution of walleye (PSD, PSD-Preferred, PSD-
Memorable) by reservoir zone, for fish collected during the standard coolwater
gill net survey on Lake Oahe, South Dakota, 2011-2015. .................................. 16 Table 8. Mean relative weight (Wr) of walleye by length group and reservoir zone on
Lake Oahe, South Dakota from 2011-2015. N is the number of fish in a length
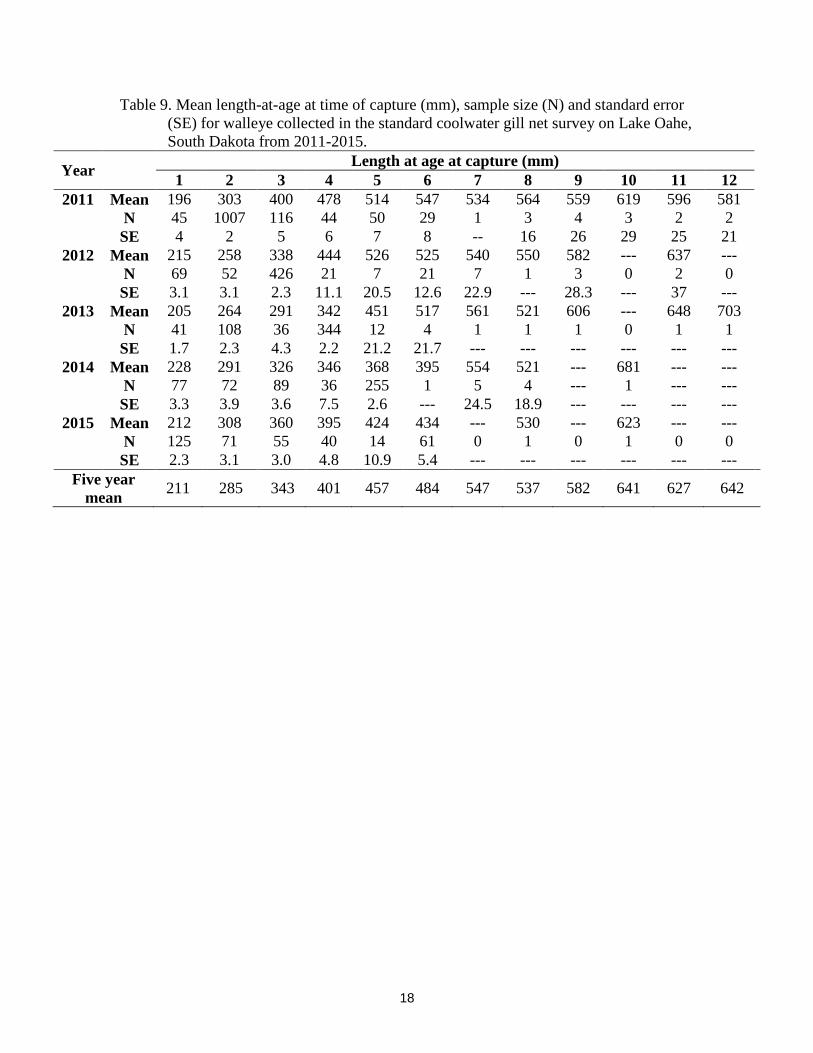
group. .................................................................................................................. 17 Table 9. Mean length-at-age at time of capture (mm), sample size (N) and standard error
(SE) for walleye collected in the standard coolwater gill net survey on Lake
Oahe, South Dakota from 2011-2015. ................................................................ 18 Table 10. Mean length-at-time of capture (mm) by reservoir zone, for walleye collected
in the coolwater gill net survey on Lake Oahe, South Dakota from 2013-2015. N
is sample size and SE is standard error. ............................................................. 19 Table 11. Mean annual growth increment (mm/y) estimates for walleye collected in the
coolwater gill net survey on Lake Oahe, South Dakota for the 2010-2011, 2011-
2012, 2012-2013, 2013-2014 and 2014-2015 periods. ....................................... 20 Table 12. Age distribution of walleye captured in standard coolwater gill net survey from
2011-2015 on Lake Oahe, South Dakota as determined using sagittal otoliths for
age-estimation. .................................................................................................... 20
Table 13. Proportional size distribution (PSD), preferred (PSD-P) and memorable length
(PSD-M) for channel catfish and mean relative weight (Wr) values for 2011-
2015 for Lake Oahe, South Dakota. Mean Wr values are for stock-length fish
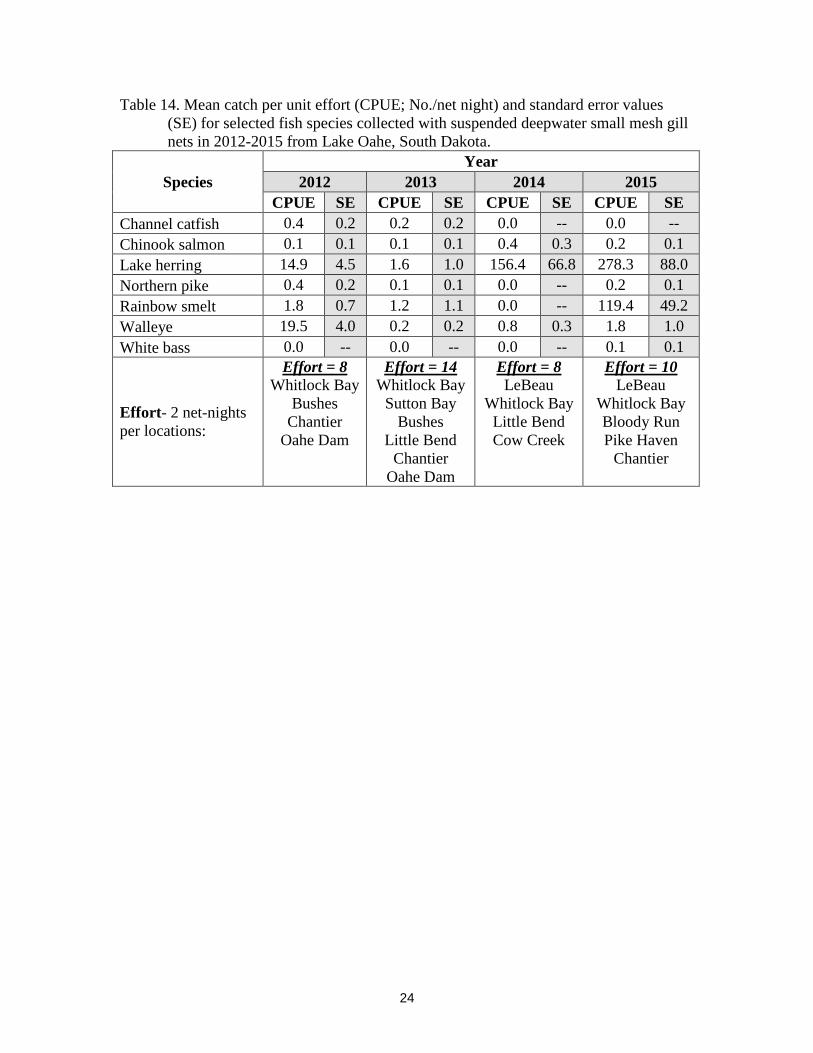
and longer. .......................................................................................................... 23 Table 14. Mean catch per unit effort (CPUE; No./net night) and standard error values
(SE) for selected fish species collected with suspended deepwater small mesh
gill nets in 2012-2015 from Lake Oahe, South Dakota. ..................................... 24
Table 15. Angler use and harvest estimates for surveys conducted from 2006-2015. All
surveys were conducted during the May-July daylight period on Lake Oahe,
South Dakota. ..................................................................................................... 30

vii
Table 16. Estimated fishing pressure (angler-h) by month and zone with 80% confidence
intervals (CI) during the May-July 2015 daylight period on Lake Oahe, South
Dakota. ................................................................................................................ 31 Table 17. Estimated fishing pressure, expressed as angler-h and hours per hectare (h/ha)
by type of fishing with 80% confidence intervals (CI), during the May-July
daylight period from 2011-2015 on Lake Oahe, South Dakota. ........................ 31 Table 18. Estimated fishing pressure, expressed as angler-h and hour per hectare (h/ha)
by reservoir zone, for standard creel surveys conducted during the May-July
daylight period from 2006-2015 on Lake Oahe, South Dakota. ........................ 32
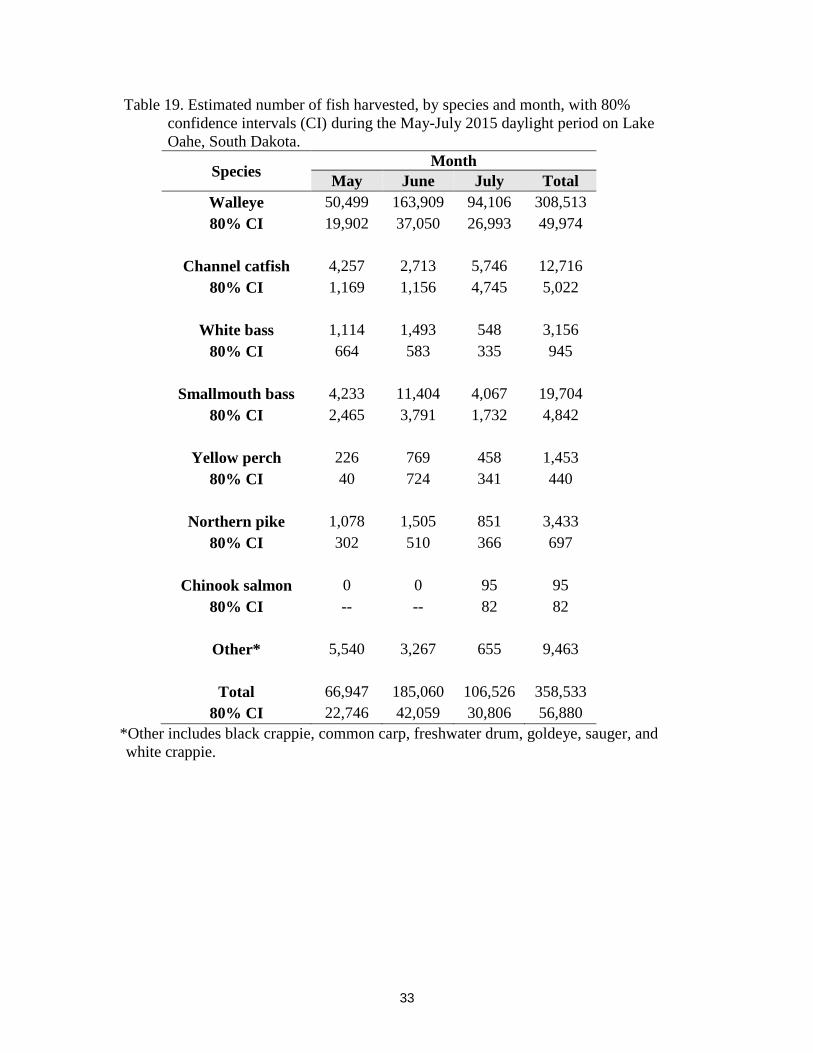
Table 19. Estimated number of fish harvested, by species and month, with 80%
confidence intervals (CI) during the May-July 2015 daylight period on Lake
Oahe, South Dakota. ........................................................................................... 33 Table 20. Estimated number of fish harvested for selected species, by zone with 80%
confidence intervals (CI) during the May-July 2015 daylight period on Lake
Oahe, South Dakota. ........................................................................................... 34
Table 21. Estimated number of fish released by species and month, with 80% confidence
intervals (CI) during the May-July daylight period in 2015 on Lake Oahe, South
Dakota. ................................................................................................................ 35 Table 22. Estimated number of walleye caught, harvested or released during the May-
July daylight period by year from 2006-2015 on Lake Oahe, South Dakota. .... 36
Table 23. Estimated hourly catch rates (fish/angler-h) for walleye, smallmouth bass,
white bass, channel catfish and all fish combined, by year, for all anglers during
the May-July daylight period on Lake Oahe, South Dakota from 2006-2015. .. 38 Table 24. Estimated hourly catch, harvest and release rates (fish/angler-h), by species for
species-specific anglers during the May-July 2015 daylight period on Lake
Oahe, South Dakota. ........................................................................................... 39
Table 25. Estimated hourly catch, harvest and release rates (fish/angler-h) for walleye and
all species combined, by month during the May-July 2015 daylight period on
Lake Oahe, South Dakota. .................................................................................. 39
Table 26. Percentage of angling parties that caught (top panel) or harvested (bottom
panel) a specified number of walleye and sauger per angler in each zone during
the May-July 2014 and 2015 daylight period on Lake Oahe, South Dakota. .... 40 Table 27. Percent of total angler contacts for resident and non-resident anglers fishing
Lake Oahe, South Dakota during the May-July daylight period from 2011-2015.
N is the number of parties interviewed. .............................................................. 41 Table 28. Percent of anglers that drove a specific distance, one way, to fish Lake Oahe,
South Dakota during the May-July daylight period from 2011-2015. ............... 41 Table 29. Percent of non-resident angler contacts, by state during the May-July daylight
period from 2011-2015, on Lake Oahe, South Dakota. ..................................... 42 Table 30. Percent of anglers targeting a specific species on Lake Oahe, South Dakota
during the May-July daylight period from 2011-2015. Trace (T) indicates values
>0.0 but <0.5. ..................................................................................................... 42 Table 31. Percent of resident angler contacts on Lake Oahe, South Dakota by county of
residence during the May-July daylight period from 2011-2015. ...................... 43

viii
Table 32. Responses of anglers fishing Lake Oahe, South Dakota who were asked the
following question during the May-July 2015 daylight period: “Considering all
factors, how satisfied are you with your fishing trip today?” 1 = very satisfied, 2
= moderately satisfied, 3 = slightly satisfied, 4 = neutral/no opinion (N.O.), 5 =
slightly dissatisfied, 6 = moderately dissatisfied, and 7 = very dissatisfied. N is
sample size and includes “neutral/no opinion” responses. ................................. 45 Table 33. Responses of anglers fishing Lake Oahe, South Dakota who were asked the
following question during the May-July 2015 daylight period: “Considering all
factors, how satisfied are you with your fishing trip today?” compared to the
number of walleye harvested per person per trip. 1 = very satisfied, 2 =
moderately satisfied, 3 = slightly satisfied, 4 = neutral/no opinion (N.O.), 5 =
slightly dissatisfied, 6 = moderately dissatisfied and 7 = very dissatisfied. N is
sample size. ......................................................................................................... 45
Table 34. Responses of anglers fishing Lake Oahe, South Dakota who were asked the
following question during the May-July 2015 daylight period: “What would help
increase your satisfaction level to “very satisfied”?” after being asked their
overall satisfaction rating (Table 32). ................................................................. 46
Table 35. Response of all anglers fishing Lake Oahe, South Dakota who were asked the
following question during the May-July 2015 daylight period: “Are you aware
of the new regulations for boat plug removal and live bait transport?” ............. 46

ix
LIST OF FIGURES
Figure 1. Reservoir zones and fish population sampling locations on Lake Oahe, South
Dakota. .................................................................................................................. 4
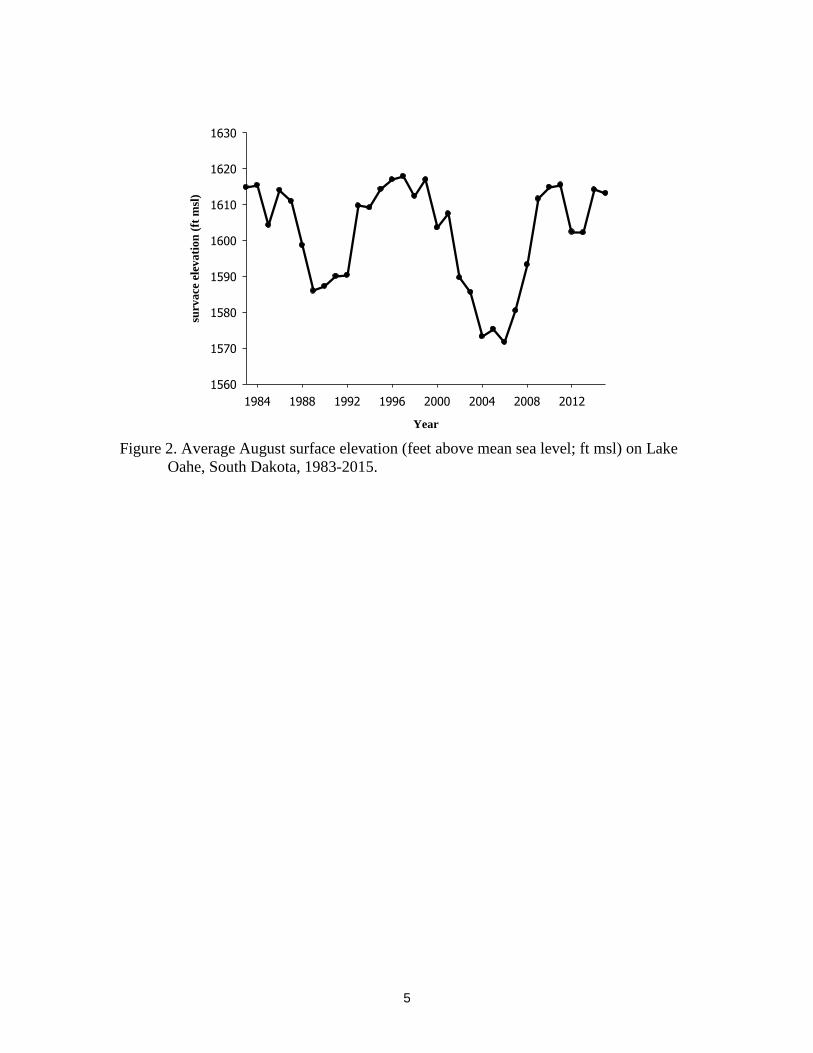
Figure 2. Average August surface elevation (feet above mean sea level; ft msl) on Lake
Oahe, South Dakota, 1983-2015. ......................................................................... 5 Figure 3. Mean walleye catch per unit effort (CPUE; No./net night) in the coolwater gill
net survey for lower, middle and upper zones, and lake-wide average, of Lake
Oahe, South Dakota, 2006-2015. ....................................................................... 16
Figure 4. Incremental catch per unit effort (CPUE; No./net night) for walleye by year, as
sampled by the standard coolwater gill net survey from 2006-2015 on Lake
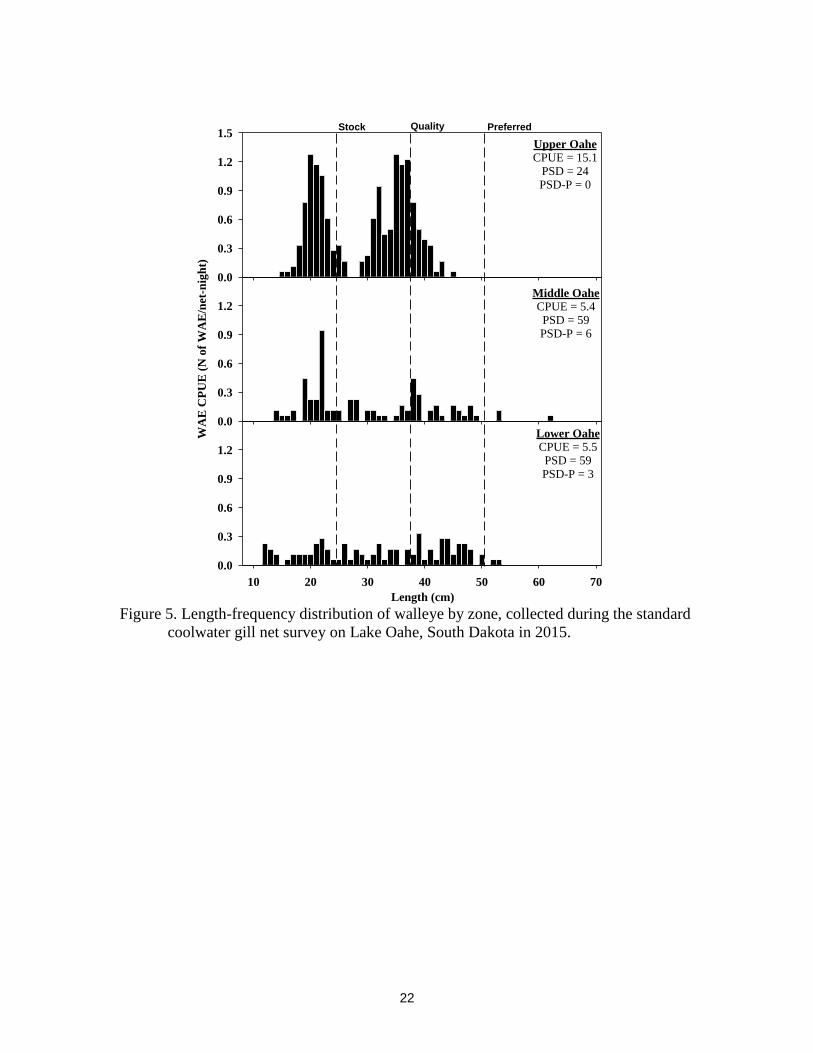
Oahe, South Dakota. ........................................................................................... 21 Figure 5. Length-frequency distribution of walleye by zone, collected during the standard
coolwater gill net survey on Lake Oahe, South Dakota in 2015. ....................... 22 Figure 6. Length-frequency distribution of channel catfish collected during the standard
coolwater gill net survey on Lake Oahe, South Dakota in 2014 and 2015. N is
the number of channel catfish sampled. ............................................................. 23
Figure 7. Length-frequency distribution of lake herring, displayed as percent of catch,
collected during suspended deepwater gill net surveys in 2012 through 2015 on
Lake Oahe, South Dakota. Vertical bars represent age-0, age-1 and age-2+ size
class cut-offs. Catch per unit effort (CPUE) is No./net night, and N is the
number of lake herring sampled. ........................................................................ 25
Figure 8. Length-frequency distribution of rainbow smelt, displayed as percent of catch,
collected during suspended deepwater gill net surveys from 2012 through 2015
on Lake Oahe, South Dakota. Catch per unit effort (CPUE) is No./net night, and
N is the number of rainbow smelt sampled. ....................................................... 26
Figure 9. Length-frequency distribution of walleye harvested by anglers during the May-
July 2015 daylight period on Lake Oahe, South Dakota. Vertical lines represent
15 and 20 in. and N is sample size. .................................................................... 36
Figure 10. Length-frequency distribution of walleye harvested by anglers fishing lower
Lake Oahe, South Dakota during the May-July 2015 daylight period. Vertical
lines represent 15 and 20 in. and N is sample size. ............................................ 37 Figure 11. Length-frequency distribution of walleye harvested by anglers fishing middle
Lake Oahe, South Dakota during the May-July 2015 daylight period. Vertical
lines represent 15 and 20 in. and N is sample size. ............................................ 37 Figure 12. Length-frequency distribution of walleye harvested by anglers fishing upper
Lake Oahe, South Dakota during the May-July 2015 daylight period. Vertical
lines represent 15 and 20 in. and N is sample size. ............................................ 38
Figure 13. County of residence for South Dakota residents fishing upper Lake Oahe,
South Dakota during the May-July 2015 daylight period. ................................. 43
Figure 14. County of residence for South Dakota residents fishing middle Lake Oahe,
South Dakota during the May-July 2015 daylight period. ................................. 44 Figure 15. County of residence for South Dakota residents fishing lower Lake Oahe,
South Dakota during the May-July 2015 daylight period. ................................. 44

x
LIST OF APPENDICES
Appendix 1. Common and scientific names of common fishes of South Dakota. ........... 52 Appendix 2. Minimum lengths (mm) of length-class designations used when calculating
proportional size distribution values for fish population survey samples
(Gabelhouse 1984). ............................................................................................. 53 Appendix 3. Angler satisfaction, preference and attitude questions asked as part of the
May-July 2015 angler use and harvest survey on Lake Oahe, South Dakota.
Question series A and B were asked in an alternating order as part of the survey.
............................................................................................................................ 54

1
INTRODUCTION
Lake Oahe is the largest and one of the most economically important fisheries in
the state of South Dakota averaging 157,464 angler trips during the May-July day-light
period, over the last ten years. Anglers often travel more than 200 miles (one-way) to
take advantage of the fishing opportunities in Lake Oahe. Approximately 151,269 trips
occurred during the May-July 2015 daylight period on Lake Oahe, for an estimated
economic input of ~$10 million (U.S. Dept. of Interior, Fish and Wildlife Service, and
U.S. Dept. of Commerce, Bureau of the Census 2011).
Because the Lake Oahe fishery is an important resource to the state of South
Dakota, it must be effectively managed to produce optimal recreational benefits. A
prerequisite to the development of effective management strategies is the acquisition and
analysis of data describing fish assemblages and population characteristics, angler
preferences, use and harvest, and angler satisfaction data. These surveys provide
information used to evaluate progress towards objectives of the South Dakota
Department of Game, Fish and Parks Missouri River Fisheries Management Area
Strategic Plan.

2
STUDY AREA
Lake Oahe is a mainstem Missouri River storage reservoir located in north-central
South Dakota. Lake Oahe is a large reservoir with a surface area of 110,660 ha, 3,620 km
of shoreline and mean and maximum depths of 18.3 and 62.5 m, respectively (Table 1;
Michaletz et al. 1986, Warnick 1987). Lake Oahe has been separated into three zones for
survey purposes. Each zone includes approximately three sampling locations (Figure 1).
Because Lake Oahe is a storage reservoir, elevation, surface area, and volume
change over time (Figure 2). Consequently, sampled habitats are not the same each
August when coolwater gill net surveys are conducted. Additionally, Lake Oahe water
elevation fluctuations can have dramatic effects on aquatic habitat, lake productivity,
water temperatures, water residency time and many other physical variables. Drastic
changes in water elevation likely influence year-to-year variation of survey efficiency
and precision.

3
Table 1. Physical characteristics and management classification of Lake Oahe, South
Dakota.
Oahe Dam closed in: 1958 *Reservoir length: 372 km
Elevation at full
pool: 1617 msl *Shoreline length: 3,620 km
Surface area
(SD portion): 110,660 ha
*Shoreline development
index: 26.4
Water volume: 2.9x10³ L Drainage area: 630,639 km
2
*+Coldwater habitat 47,755 ha *Average depth: 18.3 m
Trophic status: Oligo/meso *Maximum depth: 62.5 m
Substrate
composition:
Sand, gravel, clay,
and shale Morpho-edaphic index: 28.4
Management
classification:
Cold, cool, and
warmwater
permanent Water source:
Missouri River
and tributaries
*Denotes values for water elevation at full pool.
+Denotes upper surface area of water 15oC in August.

4
Figure 1. Reservoir zones and fish population sampling locations on Lake Oahe, South
Dakota.
5
Year
1984 1988 1992 1996 2000 2004 2008 2012
surv
ace
ele
vati
on
(ft
msl
)
1560
1570
1580
1590
1600
1610
1620
1630
Figure 2. Average August surface elevation (feet above mean sea level; ft msl) on Lake
Oahe, South Dakota, 1983-2015.
6
REGULATION HISTORY
Walleye harvest regulations for Lake Oahe have differed from standard statewide
regulations since 1990. Initially, a 356-mm (14-in) minimum length limit was placed on
Lakes Oahe, Sharpe and Francis Case from April through June with a daily limit of four
fish (Table 2). In 1999, the harvest regulations were amended so one fish in the daily
limit could be 457-mm (18-in) or longer and the April through June minimum length
limit was removed. The objective of this regulation change was to concentrate harvest on
abundant walleye less than 381-mm (15-in) and reduce harvest of larger walleye to
maintain a quality fishery with a high size structure.
The daily walleye limit on Lake Oahe was increased from four to 14 fish in 2001
of which, at most, four fish could be 381-mm (15-in) and one fish could be over 457-mm
(18-in). The objective of this regulation was two-fold: to reduce predation on rainbow
smelt which saw rapid population declines in the late 1990’s and to reduce the high
abundance of walleye less than 381-mm (15-in; Lott et al. 2002).
Following liberalization of the Lake Oahe walleye regulations, a decrease in
angler satisfaction was associated with anglers unable to attain high daily limits (Lott et
al. 2004). Thus, the daily limit was reduced to ten fish in 2002 and six fish in 2004. In an
effort to standardize regulations statewide, the daily limit was reduced to four walleye
with only one fish allowed over 508-mm (20-in) in 2006, and the possession limit of 12
fish was reduced to eight fish in 2007.
In 2011, the Missouri River experienced a massive flood that moved much of the
Lake Oahe prey fish biomass through Oahe Dam. Following this high entrainment event,
prey fish populations plummeted resulting in poor condition and high natural mortality of
Lake Oahe walleye (Fincel et al. 2013). At the same time, a massive 2009 walleye year
class attained a size sought by anglers. Thus, the population was made up of fewer large
fish of poor condition and many small fish (less than 381-mm) of below average
condition. In reaction to the change in population size structure a change to the 2013
walleye regulations was made in an effort to take advantage of the exceptionally large
2009 year class. This regulation permitted the harvest of four additional walleye less than
381-mm (15-in) complimentary to the state-wide limit of four walleye, of which, one
may be over 508-mm (20-in). The 2013 regulation for four additional walleye on Lake
Oahe was removed in 2014, and fishing limits returned to the state-wide limit of four
walleye.

7
Table 2. History of harvest regulations for walleye on Lake Oahe, South Dakota, 1968-
2015.
Species Period Daily
limit
Possession
limit Length restrictions
Walleye,
sauger, and
hybrids, in
combination
1968-1983 8 16 None
1984-1989 6 12 None
1990-1998 4 8 April-June 356-mm minimum
length (14-in)
1999-2000 4 8 At most one equal to or longer
than 457-mm (18-in)
2001 14 42
At most four equal to or longer
than 381-mm (15-in)
At most one equal to or longer
than 457-mm (18-in)
2002-2003 10 30
At most four equal to or longer
than 381-mm (15-in)
At most one equal to or longer
than 457-mm (18-in)
2004-2005 6 18
At most four equal to or longer
than 381-mm (15-in)
At most one equal to or longer
than 508-mm (20-in)
2006 4 12 At most one equal to or longer
than 508-mm (20-in)
2007-2012 4 8 At most one equal to or longer
than 508-mm (20-in)
2013 8 24
At most four equal to or longer
than 381-mm (15-in)
At most one equal to or longer
than 508-mm (20-in)
2014-2015 4 8 At most one equal to or longer
than 508-mm (20-in)

8
SAMPLING METHODS
Fish Population Surveys
Data Collection
A suite of gears was used to collect fish throughout the summer of 2015 in Lake
Oahe. The standard coolwater fish population survey consisted of setting three standard
gill nets overnight (approximately 20 h) in two depth zones (0- to 10-m and 10- to 20-m).
Gill nets were placed on the bottom in each depth zone (where possible), for a total of six
nets at each station. A standard gill net of multifilament nylon was 107-m long by 1.8-m
deep with 15.2-m panels of the following bar mesh sizes: 12.7-mm, 19.1-mm, 25.4-mm,
31.8-mm, 38.1-mm, 50.8-mm, and 63.5-mm.
All walleye collected during the standard coolwater gill net survey were measured
for total length (mm) and weighed (g). Sagittal otoliths were removed from ten fish
(maximum) within each 25-mm length class for walleye, sauger and hybrids at each
sampling station. When possible, representative samples (up to 50 individuals per
sampling station) of all other species were measured and weighed.
Age was estimated using whole otoliths from walleye and sauger less than 300-
mm. Otoliths were viewed under a thin layer of glycerol in a black dish with an overhead
light source. For fish greater than 300-mm, otoliths were cracked through the focus and
charred prior to age-estimation. Otoliths were read independently by at least two
experienced readers.
A 6.4-mm nylon mesh bag seine, measuring 30.5-m long by 2.4-m deep with a
1.8-m by 1.8-m bag, was used to collect age-0 and small-bodied littoral fishes. A quarter-
arc seine haul was accomplished using methods described in Martin et al. (1981). Four
seine hauls were made at each sampling station. All fish collected were identified and
counted.
Hydro-acoustic surveys have been conducted since the late 1980’s to monitor cold
water species that are less susceptible to gill net surveys. Equipment specification used
during the 2003 -2005 surveys can be found in Nelson-Statsny (2001). Data from 2008-
2015 were collected with a Biosonics DT-X digital Echosounder and a split-beam
transducer.
Beginning in 2012, a suspended deep water gill net survey was introduced and
paired with the hydro-acoustic survey. Hydro-acoustic transects were completed, and
targets were visually located on the echogram. An approximate depth where targets were
located was noted and two overnight net sets were deployed within a few days in the
identified zone. Suspended deep water gill nets were 38.1 m long and 7.3 m deep and
consisted of 7.6 m length of the following multifilament meshes in the following order:
19.1-mm, 9.5-mm, 12.7-mm, 15.9-mm, and 25.4-mm. Nets were hung with sufficient
flotation to allow for neutral buoyancy while in the water column. Netting effort has
varied between years depending upon staffing, weather conditions, and locations of
transects.

9
Data Analysis
Relative abundance of fish species is expressed as mean catch per unit effort
(CPUE) for gill net (No./net night) and seine (No./haul) catches. Standard error (SE)
values were calculated for gill net and seining CPUE as a measure of sample variance.
Incremental growth rates were estimated by subtracting the mean length of fish at
time of capture from the mean length at capture of the same year class one year prior.
Age distributions were developed by assigning ages to all walleye captured during the
survey based on length-at-capture information.
Proportional size distribution (PSD; Anderson and Weithman 1978) was
calculated for walleye and channel catfish (Gabelhouse 1984; Appendix 2). Relative
weight (Wr; Anderson 1980) was calculated using standard-weight (Ws) equations
developed for walleye (Murphy et al. 1990) and channel catfish (Brown et al. 1995).
Proportional size distribution PSD and Wr were calculated using WinFin software
(Francis 2000).
Delineation of rainbow smelt age classes was accomplished by assigning
fish to an age class based on target strengths determined from fish collected in historic
mid-water trawl surveys (Table 3). The bottom line and thermocline depth line were
identified for each file. Thermocline depths were created by assigning a fixed depth line
in the echogram that was: 1) near the depth region of the thermocline in the nearest
available temperature profile and 2) vertically stratified fish targets were visually
separated. Each echogram was horizontally subdivided into 100-m intervals for analysis,
and targets enumerated.
For single target detection, the expected mean target strength below the
thermocline was -44.4 dB. The estimates of year class densities were calculated by
averaging the back scattering cross section for each transect, converting to target strength
and computing length using the empirical formula from Love (1977). Back scattering
cross section for individual echoes was converted into target strength by:
TS = 10Log (σbs)
where TS = target strength (dB), σbs = back scattering cross section. Target strength to
length was calculated from Love’s equation:
TS = 19.1 Log (L) – 0.9(F) – 62
where TS = target strength (dB), L = fish length (cm) and F = acoustic frequency. The
proportion of each age/size class was then calculated (number of echoes in size class “X”
/ total number of echoes) for each transect. The proportions of each age class were
multiplied by the estimated overall density to derive densities for each individual age
class. Acoustic data were processed using Sonar 5 Professional, Version 6.0.3 (Balk and
Lindem 2015; Lindem Data Acquisition A/S). New methodology was used to analyze
hydro-acoustics data collected in 2015; therefore, estimates were not compared to
previous years.

10
Angler Use, Sportfish Harvest and Preference Surveys
Data Collection
Angler use and sport fish harvest surveys conducted on Lake Oahe are patterned
after a study designed by Schmidt (1975) for Lake Sharpe. Sampling includes aerial
counts of boat and shore anglers to estimate fishing pressure, and angler interviews at
lake access areas to estimate harvest rates, catch rates, release rates, mean party size,
mean angler day length, target species and angler state of residency. Flight dates and
interview dates were selected using a stratified random design based on the assumption of
different levels of fishing pressure for weekdays and weekend days/holidays. Lake access
areas for angler interviews were also assigned using a stratified random design with
probabilities of assignment differing by access area and month (Stone et al. 1994).
Sampling was conducted from 1-May through 31-July, 2015, for the sunrise to
sunset period. Angler satisfaction and attitude questions were included in angler
interviews in 2015. In addition to asking anglers how satisfied they were with their
fishing trip, anglers were asked what factor would increase their satisfaction level to
“very satisfied”. Anglers were also asked questions pertaining to an ongoing walleye
tagging research project and a question regarding new Aquatic Invasive Species (AIS)
regulations. A complete list of satisfaction, attitude and preference questions asked in
conjunction with the 2015 angler use and harvest survey appears in (Appendix 3).
Data Analysis
Pressure count and angler interview data were entered and analyzed using the
Creel Application Software package (Soupir and Brown 2002) and 80% confidence
intervals were calculated for estimates of fishing pressure and harvest.
Table 3. Rainbow smelt and lake herring age and size classes used for size classification
of hydro-acoustic assessment on Lake Oahe, South Dakota.
Age Class Size Range Target Strength Range
Age-0 rainbow smelt 21-79 mm -58.2 to -47.2 dB
Age-0 lake herring 80-110 mm -44.9 to -41.1
Age-1+ rainbow smelt 100-180 mm -47.1 to -40.4 dB
Age-1 lake herring 180 - 269 mm -40.3 to -37.1 dB
Other Large > 270 mm > -37 dB

11
RESULTS AND DISCUSSION
Fish Population Surveys
Species Composition and Relative Abundance
Twenty species were captured in the coolwater gill net survey samples in 2015
(Table 4). Walleye comprised 26% and channel catfish comprised 40% of all fish caught
in the 2015 coolwater gill net survey (Table 5). Mean CPUE for fish species in 2015 was
similar to 2014, with a decrease in catches of channel catfish and walleye (Table 4).
Catch per unit effort has historically been used as an index of population abundance or
density; however, changes in fish behavior (Hubert 1996) and lake volume can affect
CPUE estimates. Therefore, caution should be used when inferring density or abundance
of fish species based on temporal comparisons of CPUE.
Black and white crappie were the most abundant species captured during the 2015
August seine survey, with a mean CPUE of 165 fish/haul and 113 fish/haul, respectively
(Table 6). Also abundant in 2015 were yellow perch and emerald shiner with CPUE of
110 and 77 fish/haul, respectively. Age-0 gizzard shad were the most abundant species in
seine survey catches from 2003 to 2009; however, catches began declining in 2006 and
no gizzard shad were captured in 2010 and 2011.As a result, an intensive gizzard shad
stocking program was implemented from 2012 to 2015. Adult gizzard shad were
collected from Lake Sharpe (Hipple Lake) and stocked into various embayments within
Lake Oahe with 326 and 168 stocked in 2014 and 2015, respectively. Age-0 gizzard shad
were captured in shoreline seining surveys in 2012 and 2013 (Table 6). No age-0 gizzard
shad were collected during the standard seining survey in 2014 and 2015.
Population Characteristics of Walleye
Mean CPUE of walleye captured in gillnets was lower than the 10-year average of
16.0 walleye/net night (Figure 3). The CPUE in the lower zone (5.5 walleye/net night)
and middle zone (5.4 walleye/net night) was lower than the upper zone (15.1 walleye/net
night; Figure 3). Walleye PSD in 2015 increased from 2014 and 2013 (Table 7). Walleye
PSD-P increased slightly in the lower and middle zones (Table 7).
Relative weight (Wr) of walleye fluctuates as a function of changes in prey
abundance. All zones within Lake Oahe saw a slight decrease in Wr from 2014 to 2015
(Table 8). The greatest increase was the Wr of preferred and greater size fish (91).
However, there was a low sample size (n = 5) of preferred and greater size fish during the
survey, with no preferred and greater walleye collected in the upper zone. Length-at-age-
at-capture has improved, and is similar to the five-year mean for age-1 to age-3 walleye.
Walleye age-4 and older were generally smaller when compared to the five-year mean
(Table 9). Walleye growth varies by zone, where age-3 fish grow faster in the middle
(374-mm) and upper (362-mm) zones when compared to the lower zone (343 mm). Age-
6 walleye showed a slightly greater mean length-at-age in the lower zone (454-mm)
compared to the middle (451-mm) and upper (401-mm) zones (Table 10).
Mean annual incremental growth of walleye was greater than the five year mean
(Table 11). All ages of walleye showed an increase in growth compared to the previous
year. The strong 2009 year class was still present in gill net catches, comprising 14% of
the overall walleye catch. The 2014 year class appears to comprise a large percentage

12
(38%) of the gill net catch. All year classes from age-0 to age-6 were present in our gear,
and the oldest fish collected was age-10 (Table 12).
Lake wide gill net CPUE of walleye has decreased annually from 2011 to 2015
(Figure 3). The proportion of the walleye in the 254- to 380-mm (10 to 15 inch) length
group has also decreased from 2014 to 2015 (Figure 4). Catch rates of larger (greater than
508-mm; 20-inches) walleye have also decreased from 2011 to 2015. The number of
stock-quality size fish captured in gill nets was greatest in the upper zone (Figure 5).
Population Characteristics of Channel Catfish
Similar to previous years, channel catfish comprised 40% of the gill net catch
(Table 5). Catch per unit effort of channel catfish decreased slightly from 17.6 fish/net
night in 2014 to 13.0 fish/net night in 2015 (Table 4). Eight age-0 channel catfish were
collected by shoreline seining in 2015 (0.2 fish /haul) indicating a reproducing population
(Table 6). A wide range of sizes of channel catfish were collected in 2015 by gill nets,
with fish ranging from 220 to 735 mm (Figure 6). Relative weight, PSD, PSD-P, and
PSD-M has remained similar to the past five years (Table 13).
Hydro-acoustic and Suspended Gill Net Surveys
The 2015 annual hydro-acoustic survey estimated 24,890,873 age-0 rainbow
smelt and 18,868,034 age-1+ rainbow smelt. The hydro-acoustic survey also documented
a large number (13,899,525) of age-0 and age-1 (5,605,178) lake herring in 2015. Years
when rainbow smelt abundance is low and age-0 and age-1 lake herring is high may
provide sufficient prey for sportfish in Lake Oahe. Age-0 and age-1 lake herring are
similar to the size range of rainbow smelt, and may provide a suitable alternative in years
of low rainbow smelt abundance (Figure 7).
Suspended deep water gill net CPUE has varied between years and species. In
2012, walleye and lake herring comprised the majority of fish captured (20 and 15
fish/net night, respectively; Table 14). Lake herring and rainbow smelt had the highest
CPUE in 2015 (278 and 119 fish/net night, respectively). Size distribution of lake herring
shifted between years, with fish captured from a large year-class produced in 2014
recruiting to the age-1 size class in 2015 (Figure 7). Lake herring ranged in size from 80
to 490 mm in the years of 2012 to 2015. Rainbow smelt CPUE in suspended deep water
gill nets was the highest in 2015 (119 fish/net night; Table 14). No rainbow smelt were
captured in 2014. The size distribution of rainbow smelt ranged from 80 to 220 mm in
2015, with a large percentage in the 110 and 120 mm length groups (Figure 8).
13
Table 4. Mean catch per unit effort (CPUE; No./net night) and standard error values (SE)
for selected fish species collected with standard coolwater gill nets in 2011-2015
on Lake Oahe, South Dakota. Trace (T) indicates values less than 0.05.
Species
Year
2011 2012 2013 2014 2015
CPUE SE CPUE SE CPUE SE CPUE SE CPUE SE
Bigmouth buffalo T -- 0 -- 0.1 -- 0.1 0.1 0 --
Black bullhead T -- 0 -- T -- 0 -- 0 --
Black crappie 0 -- 0 -- 0 -- T -- T --
Bluegill T -- T -- 0 -- 0 -- 0 --
Channel catfish 12.7 1.3 16.3 1.6 16.6 1.8 17.6 1.8 13.5 1.3
Chinook salmon T -- 0 -- 0 -- 0 -- T --
Common carp 1.5 0.2 1.1 0.2 1.9 0.3 1.8 0.3 1.1 0.3
Freshwater drum 1.5 0.3 0.8 0.1 0.9 0.2 1.2 0.2 0.7 0.1
Gizzard shad 0 -- 0.1 0.1 T -- 0 -- 0 --
Goldeye 1.4 0.3 1.1 0.3 1.1 0.2 0.7 0.2 0.8 0.1
Lake herring 0.1 0.1 0 -- 0 -- 0 -- T --
Northern pike 2.0 0.3 1.7 0.2 0.6 0.1 0.4 0.1 0.6 0.1
Rainbow smelt 0 -- 0 -- 0 -- 0 -- 0 --
River carpsucker 0.5 0.2 1.1 0.2 0.6 0.2 0.9 0.3 0.4 0.1
Sauger 0.3 0.1 0.3 0.1 0.1 0.1 0.2 0.1 T --
Shorthead redhorse 0.6 0.2 0.8 0.3 1.1 0.3 1.0 0.4 0.6 0.2
Shortnose gar T -- 0.3 0.2 0 -- T -- T --
Smallmouth bass 1.6 0.3 1.7 0.5 1.4 0.4 1.4 0.3 2.0 0.5
Smallmouth buffalo 0.1 0.1 0.3 0.1 0.2 0.1 0.2 0.1 0.5 0.2
Spottail shiner 0.1 0.1 0 -- 0 -- 0 -- T --
Walleye 25.1 2.0 20.4 1.6 15.7 1.6 14.1 1.7 8.6 1.1
White bass 3.8 0.7 1.4 0.3 1.5 0.3 1.5 0.6 1.0 0.4
White crappie 2.7 1.7 0.7 0.2 0.5 0.2 0.2 0.1 0.2 0.1
White sucker 0.4 0.1 0.2 0.1 0.1 0.1 0.6 0.2 0.2 0.1
Yellow perch 7.2 0.8 0.3 0.1 0.9 0.2 2.5 0.8 3.3 0.5

14
Table 5. Relative species composition, expressed as percent of total catch of all fish
species collected during the standard coolwater gill net survey on Lake Oahe,
South Dakota from 2011-2015.
Species Year
2011 2012 2013 2014 2015
Channel catfish 21 32 38 40 40
Walleye 41 41 36 32 26
Smallmouth bass 3 3 3 3 6
Freshwater drum 2 2 2 3 2
River carpsucker 1 2 1 2 1
Yellow perch 11 4 2 6 10
Common carp 2 2 4 4 3
Goldeye 2 2 2 2 2
White bass 6 3 4 3 3
*Other species 10 9 6 6 7
*Other species include bigmouth buffalo, black bullhead, black crappie, bluegill,
Chinook salmon, gizzard shad, lake herring, northern pike, sauger, shorthead
redhorse, shortnose gar, smallmouth buffalo, spottail shiner, white crappie, and
white sucker.
15
Table 6. Mean catch per unit effort (CPUE; No./haul) and standard error (SE) values for
fish species collected during the standard August seine survey on Lake Oahe,
South Dakota, 2011-2015. Catches are for age-0 fishes, except where noted.
Trace (T) indicates values less than 0.05.
Species
Year
2011 2012 2013 2014 2015
CPUE SE CPUE SE CPUE SE CPUE SE CPUE SE
Bigmouth buffalo 0.0 -- 0.0 -- 6.0 3.4 2.8 1.1 0.3 0.1
Black crappie 21.0 20.6 21.3 20.6 0.1 0.1 282.8 157.4 165.2 86.5
Brassy minnow* 0.3 0.3 0.0 -- 0.3 0.2 0.1 0.1 0.1 0.1
Channel catfish T -- 0.0 -- T -- 0.0 -- 0.2 0.1
Common carp 0.5 0.3 0.1 0.1 0.3 0.2 0.1 0.1 0.0 --
Emerald shiner* 60.3 45.9 14.3 6.3 64.0 27.1 74.9 33.0 76.8 36.7
Fathead minnow* 0.3 0.2 0.1 0.1 T -- 1.2 0.5 0.8 0.3
Freshwater drum 2.2 1.4 1.6 0.6 7.4 4.0 T -- 0.7 0.5
Gizzard shad 0.0 -- 2.5 2.5 0.3 0.2 0.0 -- 0.0 --
Goldeye 0.0 -- 0.0 -- 0.5 0.5 0.1 0.1 0.6 0.4
Johnny darter* 1.0 0.3 0.3 0.2 0.3 0.2 0.1 0.1 0.1 0.1
Lake herring 0.0 -- 0.0 -- 0.0 -- T -- 0.1 0.1
Largemouth bass T -- 0.0 -- 0.1 0.1 0.1 0.1 0.5 0.4
Northern pike T -- 0.0 -- 0.0 -- 0.2 0.1 0.0 --
River carpsucker 0.3 0.2 0.1 0.1 2.2 1.6 3.9 3.0 0.1 0.1
Silvery minnow 0.0 -- 0.0 -- 0.0 -- 0.0 -- 0.0 --
Smallmouth bass 10.4 2.3 5.6 1.8 32.6 9.6 14.8 3.8 7.4 1.4
Smallmouth buffalo 0.0 -- T -- 6.7 4.3 4.6 1.4 8.2 6.9
Spottail shiner* 3.0 1.5 1.8 0.7 0.4 0.2 1.5 0.6 1.5 0.6
Walleye 0.2 0.2 0.3 0.2 1.0 0.7 4.2 2.4 0.4 0.3
White bass 42.1 19.5 15.1 9.7 70.1 28.3 569.0 214.4 12.5 8.5
White crappie 10.1 6.3 7.2 4.7 25.4 15.2 21.1 10.9 113.2 73.7
White sucker T -- 0.1 0.1 4.0 1.7 1.1 0.6 0.1 0.1
Yellow perch 20.0 7.6 8.6 7.3 39.4 22.0 270.4 145.0 109.6 46.8
OVERALL 346.8 57.8 192.2 32.0 332.6 55.4 2,029.5 338.3 498.2 195.8
* Includes all ages.

16
Year
06 07 08 09 10 11 12 13 14 15
WA
E C
PU
E (
N p
er n
et-n
igh
t)
0
5
10
15
20
25
30
Lower
Middle
Upper
Average
Figure 3. Mean walleye catch per unit effort (CPUE; No./net night) in the coolwater gill
net survey for lower, middle and upper zones, and lake-wide average, of Lake
Oahe, South Dakota, 2006-2015.
Table 7. Proportional size distribution of walleye (PSD, PSD-Preferred, PSD-
Memorable) by reservoir zone, for fish collected during the standard coolwater
gill net survey on Lake Oahe, South Dakota, 2011-2015.
Year
Zone
Lower Middle Upper Lake-Wide
Average
PSD -P -M PSD -P -M PSD -P -M PSD -P -M
2011 51 15 1 17 4 0 19 5 1 29 8 1
2012 32 7 1 14 4 1 8 3 0 18 4 1
2013 21 2 0 8 1 1 5 2 0 10 2 1
2014 19 1 1 19 2 0 24 0 0 22 2 0
2015 59 3 0 59 6 0 24 0 0 39 2 0
Mean 36 6 1 23 3 0 16 2 0 24 4 1

17
Table 8. Mean relative weight (Wr) of walleye by length group and reservoir zone on
Lake Oahe, South Dakota from 2011-2015. N is the number of fish in a length
group.
Zone/Year
Length group
Stock-quality Quality-
preferred Preferred Total sample
Wr N Wr N Wr N Wr N
Lower
2011 86 173 91 90 90 54 88 358
20 12 77 222 76 72 72 22 76 326
2013 75 148 76 36 71 4 75 188
2014 87 149 87 34 75 2 87 185
2015 76 28 84 37 91 2 81 67
Middle
2011 81 349 84 57 81 18 81 424
2012 76 271 75 32 68 13 76 316
2013 82 260 78 22 65 4 81 286
2014 88 168 86 37 77 4 88 209
2015 76 21 78 27 91 3 78 51
Upper
2011 84 205 89 41 83 15 85 261
2012 83 301 76 18 72 9 82 328
2013 83 237 81 8 75 4 83 218
2014 85 168 84 62 81 4 85 234
2015 83 111 82 41 -- 0 83 152
Lake Wide
2011 83 729 89 229 87 79 84 1,045
2012 79 794 76 132 71 41 78 970
2013 81 633 77 66 69 12 80 711
2014 87 485 86 133 78 10 86 628
2015 81 160 82 105 91 5 82 270
18
Table 9. Mean length-at-age at time of capture (mm), sample size (N) and standard error
(SE) for walleye collected in the standard coolwater gill net survey on Lake Oahe,
South Dakota from 2011-2015.
Year Length at age at capture (mm)
1 2 3 4 5 6 7 8 9 10 11 12
2011 Mean 196 303 400 478 514 547 534 564 559 619 596 581
N 45 1007 116 44 50 29 1 3 4 3 2 2
SE 4 2 5 6 7 8 -- 16 26 29 25 21
2012 Mean 215 258 338 444 526 525 540 550 582 --- 637 ---
N 69 52 426 21 7 21 7 1 3 0 2 0
SE 3.1 3.1 2.3 11.1 20.5 12.6 22.9 --- 28.3 --- 37 ---
2013 Mean 205 264 291 342 451 517 561 521 606 --- 648 703
N 41 108 36 344 12 4 1 1 1 0 1 1
SE 1.7 2.3 4.3 2.2 21.2 21.7 --- --- --- --- --- ---
2014 Mean 228 291 326 346 368 395 554 521 --- 681 --- ---
N 77 72 89 36 255 1 5 4 --- 1 --- ---
SE 3.3 3.9 3.6 7.5 2.6 --- 24.5 18.9 --- --- --- ---
2015 Mean 212 308 360 395 424 434 --- 530 --- 623 --- ---
N 125 71 55 40 14 61 0 1 0 1 0 0
SE 2.3 3.1 3.0 4.8 10.9 5.4 --- --- --- --- --- ---
Five year
mean 211 285 343 401 457 484 547 537 582 641 627 642

19
Table 10. Mean length-at-time of capture (mm) by reservoir zone, for walleye collected
in the coolwater gill net survey on Lake Oahe, South Dakota from 2013-2015. N
is sample size and SE is standard error.
Zone Age 2013 2014 2015
Length N SE Length N SE Length N SE
Lower 1 210 11 2 196 13 3 209 20 6
2 274 41 4 273 18 10 282 15 9
3 298 12 8 314 31 6 343 10 13
4 355 124 4 318 14 10 391 13 10
5 538 1 -- 363 107 4 459 5 8
6 496 3 8 -- -- -- 454 26 8
7 560 1 -- 466 1 -- -- -- --
8 521 1 -- 471 1 -- -- -- --
9 -- -- -- -- -- -- -- -- --
10 -- -- -- -- -- -- -- -- --
11 -- -- -- -- -- -- -- -- --
12 -- -- -- -- -- -- -- -- --
Middle 1 198 14 2 235 22 6 211 33 5
2 258 51 3 275 16 6 297 13 6
3 290 13 7 325 38 5 374 6 6
4 337 126 4 369 12 13 405 12 10
5 467 4 11 365 79 5 423 3 29
6 -- -- -- -- -- -- 451 13 12
7 -- -- -- 616 1 -- -- -- --
8 -- -- -- 531 2 18 530 1 --
9 606 1 -- -- -- -- -- -- --
10 -- -- -- 681 1 -- 623 1 --
11 648 1 -- -- -- -- -- -- --
12 703 1 -- -- -- -- -- -- --
Upper 1 208 16 3 234 42 4 214 72 3
2 259 16 5 307 38 4 321 43 2
3 286 11 6 349 20 8 362 39 2
4 332 94 3 359 10 12 389 15 5
5 430 7 33 380 69 5 395 6 13
6 580 1 -- 395 1 -- 401 22 4
7 -- -- -- 563 3 6 -- -- --
8 -- -- -- 552 1 -- -- -- --
9 -- -- -- -- -- -- -- -- --
10 -- -- -- -- -- -- -- -- --
11 -- -- -- -- -- -- -- -- --
12 -- -- -- -- -- -- -- -- --

20
Table 11. Mean annual growth increment (mm/y) estimates for walleye collected in the
coolwater gill net survey on Lake Oahe, South Dakota for the 2010-2011, 2011-
2012, 2012-2013, 2013-2014 and 2014-2015 periods.
Year Growth increment added (mm/y)
1-2 2-3 3-4 4-5 5-6 6-7 7-8 8-9 9-10
2010 -2011 55 61 45 26 31 40 -- -- 64
2011-2012 62 35 44 48 11 -- 16 18 --
2012-2013 49 33 4 7 -- 36 -- 56 ---
2013-2014 86 62 55 26 -- 37 -- --- 75
2014-2015 80 69 69 78 66 --- --- --- ---
Five year mean 66 52 43 37 36 38 16 37 70
Table 12. Age distribution of walleye captured in standard coolwater gill net survey from
2011-2015 on Lake Oahe, South Dakota as determined using sagittal otoliths for
age-estimation.
Age
Year 0 1 2 3 4 5 6 7 8 9 10 11 12
2011 12 36 647 102 41 47 29 1 3 4 3 2 2
2012 14 76 84 852 23 8 26 7 2 4 0 2 0
2013 25 45 141 59 553 13 4 1 1 1 0 1 1
2014 28 89 90 124 51 369 1 5 4 0 1 0 0
2015 8 178 76 76 48 15 63 0 1 0 1 0 0

21
Year
06 07 08 09 10 11 12 13 14 15
WA
E C
PU
E (
No
./n
et n
igh
t)
0
5
10
15
20
25
30
Age-0
< 10"
10" - 15"
15" - 20"
> 20"
Figure 4. Incremental catch per unit effort (CPUE; No./net night) for walleye by year, as
sampled by the standard coolwater gill net survey from 2006-2015 on Lake Oahe,
South Dakota.
22
Length (cm)
10 20 30 40 50 60 70
0.0
0.3
0.6
0.9
1.2
WA
E C
PU
E (
N o
f W
AE
/net
-nig
ht)
0.0
0.3
0.6
0.9
1.2
0.0
0.3
0.6
0.9
1.2
1.5Upper OaheCPUE = 15.1
PSD = 24PSD-P = 0
Middle OaheCPUE = 5.4PSD = 59PSD-P = 6
Lower OaheCPUE = 5.5PSD = 59PSD-P = 3
Stock Quality Preferred
Figure 5. Length-frequency distribution of walleye by zone, collected during the standard
coolwater gill net survey on Lake Oahe, South Dakota in 2015.

23
Length (mm)
200 300 400 500 600 700
0.0
0.5
1.0
1.5
Ch
an
nel
ca
tfis
h C
PU
E (
No
./n
et n
igh
t)
0.0
0.5
1.0
1.5
2.02014
N = 952CPUE = 17.6
PSD = 41PSD-P = 4
2015
N = 729CPUE = 13.5
PSD = 49PSD-P = 6
Sto
ck
Qu
ali
ty
Pe
rferr
ed
Figure 6. Length-frequency distribution of channel catfish collected during the standard
coolwater gill net survey on Lake Oahe, South Dakota in 2014 and 2015. N is the
number of channel catfish sampled.
Table 13. Proportional size distribution (PSD), preferred (PSD-P) and memorable length
(PSD-M) for channel catfish and mean relative weight (Wr) values for 2011-2015
for Lake Oahe, South Dakota. Mean Wr values are for stock-length fish and
longer.
Year PSD PSD-P PSD-M Wr Sample size
2011 48 6 0 87 406
2012 55 7 0 81 335
2013 49 6 0 81 579
2014 41 4 0 85 534
2015 49 6 0 81 548
24
Table 14. Mean catch per unit effort (CPUE; No./net night) and standard error values
(SE) for selected fish species collected with suspended deepwater small mesh gill
nets in 2012-2015 from Lake Oahe, South Dakota.
Species
Year
2012 2013 2014 2015
CPUE SE CPUE SE CPUE SE CPUE SE
Channel catfish 0.4 0.2 0.2 0.2 0.0 -- 0.0 --
Chinook salmon 0.1 0.1 0.1 0.1 0.4 0.3 0.2 0.1
Lake herring 14.9 4.5 1.6 1.0 156.4 66.8 278.3 88.0
Northern pike 0.4 0.2 0.1 0.1 0.0 -- 0.2 0.1
Rainbow smelt 1.8 0.7 1.2 1.1 0.0 -- 119.4 49.2
Walleye 19.5 4.0 0.2 0.2 0.8 0.3 1.8 1.0
White bass 0.0 -- 0.0 -- 0.0 -- 0.1 0.1
Effort- 2 net-nights
per locations:
Effort = 8
Whitlock Bay
Bushes
Chantier
Oahe Dam
Effort = 14
Whitlock Bay
Sutton Bay
Bushes
Little Bend
Chantier
Oahe Dam
Effort = 8
LeBeau
Whitlock Bay
Little Bend
Cow Creek
Effort = 10
LeBeau
Whitlock Bay
Bloody Run
Pike Haven
Chantier

25
0
20
40
60
0
20
40
60
Length (mm)
100 200 300 400
0
20
40
60
2015 - LAH
La
ke
her
rin
g p
erce
nt
(%)
of
catc
h
0
20
40
60
2012CPUE = 14.9
N = 119
2013CPUE = 1.6
N = 128
2014CPUE = 156.4
N = 1,251
2015CPUE = 278.3
N = 2,783
Age-0 Age-1 Age-2+
Figure 7. Length-frequency distribution of lake herring, displayed as percent of catch,
collected during suspended deepwater gill net surveys in 2012 through 2015 on Lake
Oahe, South Dakota. Vertical bars represent age-0, age-1 and age-2+ size class cut-offs.
Catch per unit effort (CPUE) is No./net night, and N is the number of lake herring
sampled.

26
X Data
80 100 120 140 160 180 200 220 240
0
20
40
60
80
X Data
80 100 120 140 160 180 200 220 240
0
20
40
60
80
Length (mm)
80 100 120 140 160 180 200 220 240
0
20
40
60
80
2015 - RBS
Ra
inb
ow
sm
elt
per
cen
t (%
) o
f ca
tch
0
20
40
60
80
2012CPUE = 1.8
N = 14
2013CPUE = 1.2
N = 30
2014CPUE = 0.0
N = 0
2015CPUE = 119.4
N = 1,194
Figure 8. Length-frequency distribution of rainbow smelt, displayed as percent of catch,
collected during suspended deepwater gill net surveys from 2012 through 2015 on
Lake Oahe, South Dakota. Catch per unit effort (CPUE) is No./net night, and N is
the number of rainbow smelt sampled.

27
Angler Use, Sportfish Harvest and Preference Surveys
Angler Use
Anglers fished an estimated 151,269 angler-days on the South Dakota portion of
Lake Oahe during May-July of 2015, which is slightly lower than the 10 year average of
157,464 angler-days (Table 15). Estimated lake-wide fishing pressure was highest during
June (344,588 angler-h), accounting for 47% of the total fishing pressure during the May-
July period (Table 16). Angler use was the highest during June for the upper and middle
zones while angler use was highest in the lower zone during July (Table 16). Total
fishing pressure in the middle and upper zones were similar during the May-July period
(Table 18). The majority (96%) of anglers on the South Dakota portion of Lake Oahe are
fishing by boat during the months of May-July (Table 17). The middle and upper zones
had similar angler use in 2015 at 7.8 and 7.7 angler-h/ha, respectively. Estimated angling
pressure in the lower zone during 2015 (4.7 angler-h/ha) was the lowest since 2010
(Table 18).
Catch, Harvest and Release Estimates
Of the estimated 358,533 fish harvested from Lake Oahe during the May-July
2015 daytime period, 308,513 (86%) were walleye (Table 15). Smallmouth bass, channel
catfish, northern pike, and white bass were also harvested, to a lesser extent (Table 20).
Approximately 53% of walleye harvest occurred in June (Table 19). Walleye harvest was
similar in the upper and middle zones (39% and 37% of total walleye harvest,
respectively) and was lowest in the lower zone (Table 20).Walleye compromised the
majority of fish released (263,151 fish) followed by smallmouth bass (70,151 fish). The
months of June and July had similar numbers of total fish released (Table 21). Anglers
harvested 54% of the 571,664 walleye caught in 2015, similar to the 10-year average of
53% of walleye harvested that were caught (Table 22).
Anglers generally begin harvesting walleye at approximately 300-mm (11.8-in) in
length, however, the majority of the harvest occurs when fish reach 350-mm (13.7-in) or
greater (Figure 9). The average length of walleye harvested by anglers increased from
2014, and was 402-mm (15.8-in). Mean length of harvested walleyes was similar across
all three zones (Figure 10; Figure 11; Figure 12).
Hourly Catch, Harvest, and Release Rates
Walleye catch rates exceeding 0.3 fish/angler-h are generally considered excellent
(Colby et al. 1979), and mean angler catch rates for walleye on Lake Oahe have exceeded
this number over the last 10 years (average of 0.94 fish/angler-h; Table 23). Although
walleye catch rate (0.77 fish/angler-h) exceeded the standard set by Colby et al. (1979) it
was lower than the long-term average (Table 23). During 2015, catch rates for
smallmouth bass (0.12 fish/angler-h), white bass (0.02 fish/angler-h), channel catfish
(0.09 fish/angler-h), and all fish combined (1.15 fish/angler-h) were near the 10 year
mean for these species (Table 23). Additionally, catch rates for anglers actively fishing
for walleye were 1.86 fish/angler-h, representing a sharp decrease from 2014 when
anglers caught 3.57 fish/angler-h (Table 24). Catch and harvest rates for walleye were the
highest in June (0.87 fish caught/angler-h and 0.48 fish harvested/angler-h), followed
closely by July (0.81 fish caught/angler-h and 0.39 fish harvested/angler-h; Table 25).

28
The percentage of angling parties catching zero walleye was similar between
years (13% in 2014 to 14% in 2015; Table 26). Twenty-two percent of angling parties
fishing the lower zone in 2015 caught zero walleye compared to 13% of anglers in the
middle zone and 11% in the upper zone. The percent of angling parties harvesting a daily
limit (four fish/person) decreased slightly from 30% in 2014 to 26% in 2015. A greater
percent of parties harvested a daily limit in the upper zone (31%) than in the lower zone
(20%; Table 26).
Angler Demographics and Economic Input
Lake Oahe is one of the largest and most economically important fisheries in the
state of South Dakota, with anglers averaging 157,464 trips annually over the last ten
years. Anglers often travel more than 200 miles (one-way) to take advantage of the
fishing opportunities in Lake Oahe. Approximately 151,269 trips occurred during the
May-July 2015 daylight period on Lake Oahe, for an estimated economic input of $10.1
million in local revenues. This is down from $11.0 million in 2014 and $12.6 million in
2013.
Resident anglers represented 76% of the parties interviewed on Lake Oahe, which
was similar to previous years (Table 27). The lower zone had a slightly higher proportion
of resident anglers than the upper and middle zones (Table 27). Lake Oahe continues to
be recognized as a destination walleye fishery and 2015 was no exception, with 52% of
anglers traveling ≥ 100 miles (one-way) to fish. However, this number has been declining
since 2011 (Table 28). Non-resident anglers were predominantly from Minnesota (31%),
Nebraska (20%), Iowa (15%), and North Dakota (10%) with non-residents from 34 other
states and Canadian Providences interviewed during the survey (Table 29). Walleye were
the most sought after species for the last five years, with 90% of anglers targeting walleye
in 2015 (Table 30). The proportion of anglers targeting Chinook salmon remained low in
2015 at <0.5%.
Anglers from Hughes (19%) and Brown (17%) counties were the most common
resident angler contacts in 2015 (Table 31). Resident anglers fishing Lake Oahe have a
tendency to fish the zone closest to their county of residence.
Angler Satisfaction and Attitudes
Overall satisfaction on Lake Oahe during the May-July period was 83% which is
above the Lake Oahe Strategic Plan objective of 70% (Table 32). Median satisfaction was
highest (trip rating of “very satisfied”) during the month of June. Trip satisfaction
generally increased with the percent of daily limits attained by anglers (Table 33).
Median satisfaction rating for angling parties that harvested less than three walleye per
person was “moderately satisfied”.
If an angler responded to trip satisfaction as anything less than “very satisfied”,
creel clerks then asked the respondent what it would take to increase their ranking to
“very satisfied.” This question was intended to assess motivations of anglers (e.g. catch
motivated, harvest motivated, trophy angler, etc.; see appendix 3 for full list of
responses). Of the anglers that rated their satisfaction as “moderately satisfied” or below,
57% of parties indicated that catching more fish would increase their satisfaction rating.
“Improve weather” and “catch larger fish” were the next most common responses to
improve an angler’s satisfaction rating (Table 34).

29
In May 2015, regulations to pull all boat and live-well plugs were promulgated to
restrict the movement of water between South Dakota waterbodies. During the May to
July period, anglers were asked if they were aware of these new regulations. Ninety-
seven percent of anglers interviewed were aware of new regulations (Table 35).

30
Table 15. Angler use and harvest estimates for surveys conducted from 2006-2015. All
surveys were conducted during the May-July daylight period on Lake Oahe,
South Dakota.
Year
Fishing
pressure
(h)
Angler
trips
Estimated
fish harvest
Estimated
walleye
harvest
Reference
2006 541,432 107,080 218,521 195,869 Lott et al. (2007)
2007 531,751 103,706 204,646 177,671 Adams et al. (2008)
2008 718,557 144,416 315,469 290,089 Adams et al. (2009)
2009 872,900 166,223 294,637 259,668 Longhenry et al. (2010)
2010 800,728 149,998 242,562 194,977 Longhenry et al. (2011)
2011 1,036,972 203,613 502,945 438,322 Fincel et al. (2012)
2012 949,690 196,507 602,703 536994 Fincel et al. (2013)
2013 929,830 188,238 802,968 729,501 Fincel et al. (2014)
2014 771,419 163,586 423,944 369,929 Meyer et al. (2015)
2015 738,360 151,269 358,533 308,513 This Report

31
Table 16. Estimated fishing pressure (angler-h) by month and zone with 80% confidence
intervals (CI) during the May-July 2015 daylight period on Lake Oahe, South
Dakota.
Zone Month
May June July Total
Lower 22,857 72,368 102,276 197,500
80% CI 7,051 34,819 43,987 56,541
Middle 34,759 149,907 85,708 270,373
80% CI 22,152 64,016 41,597 79,492
Upper 94,005 122,314 54,167 270,486
80% CI 37,214 22,623 25,542 50,488
Total 151,621 344,588 242,151 738,360
80% CI 43,878 76,303 65,708 109,841
Table 17. Estimated fishing pressure, expressed as angler-h and hours per hectare (h/ha)
by type of fishing with 80% confidence intervals (CI), during the May-July
daylight period from 2011-2015 on Lake Oahe, South Dakota.
Type of fishing Year
2011 2012 2013 2014 2015
Boat (h) 1,004,064 899,910 874,930 741,698 709,521
80% CI 195,407 98,153 153,293 95,186 110,177
h/ha 9.1 8.1 7.9 6.7 6.4
Shore (h) 32,907 50,797 54,900 29,721 28,839
80% CI 5,911 8,290 9,453 4,528 4,281
h/ha 0.3 0.5 0.5 0.3 0.3
Combined (h) 1,036,972 950,707 929,829 771,419 738,360
80% CI 197,148 128,904 155,572 96,807 109,841
h/ha 9.4 8.6 8.4 7.0 6.7

32
Table 18. Estimated fishing pressure, expressed as angler-h and hour per hectare (h/ha)
by reservoir zone, for standard creel surveys conducted during the May-July
daylight period from 2006-2015 on Lake Oahe, South Dakota.
Year
Zone
Lower Middle Upper Total
h h/ha h h/ha h h/ha h h/ha
2006 115,855 2.8 272,057 8.0 140,136 4.0 528,048 4.7
2007 139,038 3.3 277,018 8.2 105,984 3.0 522,040 4.7
2008 118,402 2.8 313,844 9.3 238,469 6.8 670,715 6.1
2009 233,504 5.6 357,274 10.5 258,471 7.3 849,249 7.7
2010 182,271 4.4 311,733 9.2 294,860 8.4 788,864 7.1
2011 216,667 5.2 496,502 14.7 323,803 9.2 1,036,972 9.4
2012 389,772 9.4 301,819 8.9 259,117 7.4 950,708 8.6
2013 355,563 8.5 282,387 8.3 291,879 8.3 929,829 8.4
2014 221,092 5.3 260,895 7.7 289,434 8.2 771,421 7.0
2015 197,500 4.7 270,373 7.8 270,486 7.7 738,360 6.7
Zone size
(ha) 41,598 33,890 35,172 110,660
33
Table 19. Estimated number of fish harvested, by species and month, with 80%
confidence intervals (CI) during the May-July 2015 daylight period on Lake
Oahe, South Dakota.
Species Month
May June July Total
Walleye 50,499 163,909 94,106 308,513
80% CI 19,902 37,050 26,993 49,974
Channel catfish 4,257 2,713 5,746 12,716
80% CI 1,169 1,156 4,745 5,022
White bass 1,114 1,493 548 3,156
80% CI 664 583 335 945
Smallmouth bass 4,233 11,404 4,067 19,704
80% CI 2,465 3,791 1,732 4,842
Yellow perch 226 769 458 1,453
80% CI 40 724 341 440
Northern pike 1,078 1,505 851 3,433
80% CI 302 510 366 697
Chinook salmon 0 0 95 95
80% CI -- -- 82 82
Other* 5,540 3,267 655 9,463
Total 66,947 185,060 106,526 358,533
80% CI 22,746 42,059 30,806 56,880
*Other includes black crappie, common carp, freshwater drum, goldeye, sauger, and
white crappie.

34
Table 20. Estimated number of fish harvested for selected species, by zone with 80%
confidence intervals (CI) during the May-July 2015 daylight period on Lake
Oahe, South Dakota.
Species Zone
Lower Middle Upper Total
Walleye 73,269 114,222 121,022 308,513
80% CI 24,434 37,135 22,834 49,974
Channel catfish 4,022 5,308 3,386 12,716
80% CI 1,998 4,595 344 5,022
White bass 1,423 639 1,093 3,156
80% CI 767 257 438 945
Smallmouth bass 5,854 10,519 3,331 19,704
80% CI 2,689 3,620 1,762 4,842
Yellow perch 478 615 360 1,453
80% CI 359 188 170 440
Northern pike 1,061 1,261 1,112 3,433
80% CI 384 506 286 697
Chinook salmon 95 0 0 95
80% CI 82 -- -- 82
Other* 898 1,054 7,511 9,463
Total 87,100 133,618 137,815 358,533
80% CI 28,190 42,718 24,815 56,880
* Other includes black crappie, common carp, freshwater drum, goldeye, sauger, and
white crappie.

35
Table 21. Estimated number of fish released by species and month, with 80% confidence
intervals (CI) during the May-July daylight period in 2015 on Lake Oahe, South
Dakota.
Species Month
May June July Total
Walleye 26,525 134,239 102,386 263,151
80% CI 13,545 30,155 29,918 44,586
Channel catfish 2,199 10,940 42,123 55,262
80% CI 657 3,849 15,675 16,154
White bass 3,619 6,191 2,728 12,538
80% CI 1,564 2,234 1,320 3,030
Smallmouth bass 8,258 32,088 29,805 70,151
80% CI 2,964 10,555 9,989 14,832
Northern pike 4,012 15,042 12,475 31,530
80% CI 1,539 3,997 3,754 5,695
Yellow perch 1,496 4,653 5,190 11,339
80% CI 61 2,314 1,768 2,913
Chinook salmon 0 0 0 0
80% CI -- -- -- --
Other* 4,958 20,790 18,181 43,926
Total 51,067 223,943 212,888 487,897
80% CI 20,854 50,772 59,942 81,275
* Other includes bigmouth buffalo, black crappie, common carp, freshwater drum,
goldeye, sauger, shortnose gar, white crappie, and white sucker.

36
Table 22. Estimated number of walleye caught, harvested or released during the May-
July daylight period by year from 2006-2015 on Lake Oahe, South Dakota.
Year Caught Harvested Released Percent
harvested
2006 299,535 195,869 103,665 65%
2007 370,611 177,671 192,938 48%
2008 517,362 290,089 227,275 56%
2009 399,179 259,668 139,512 65%
2010 289,346 197,039 92,308 68%
2011 1,398,454 438,322 960,133 31%
2012 1,973,850 537,862 1,435,988 27%
2013 1,645,921 729,501 916,420 44%
2014 932,381 369,929 562,451 40%
2015 571,664 308,513 263,151 54%
Length (cm)
30 40 50 60
Perc
en
t o
f an
gle
r catc
h
0
2
4
6
8
10
12
30 40 50 60
Per
cen
t of
an
gle
r ca
tch
0
2
4
6
8
10
12
0
2
4
6
8
10
12
14May
N = 576mean = 407
JuneN = 640
mean = 399
JulyN = 470
mean = 405
TotalN = 1,686
mean = 402
Figure 9. Length-frequency distribution of walleye harvested by anglers during the May-
July 2015 daylight period on Lake Oahe, South Dakota. Vertical lines represent
15 and 20 in. and N is sample size.

37
Length (cm)
30 40 50 6030 40 50 60
Per
cen
t o
f a
ng
ler
catc
h
0
2
4
6
8
10
12
14
0
2
4
6
8
10
12
14
16May
N = 56mean = 398
JuneN = 108
mean = 407
JulyN = 146
mean = 408
TotalN = 310
mean = 408
Figure 10. Length-frequency distribution of walleye harvested by anglers fishing lower
Lake Oahe, South Dakota during the May-July 2015 daylight period. Vertical
lines represent 15 and 20 in. and N is sample size.
Length (cm)
30 40 50 60
Pe
rcen
t o
f a
ng
ler
ca
tch
0
2
4
6
8
10
12
14
30 40 50 60
Per
cen
t o
f a
ngle
r ca
tch
0
2
4
6
8
10
12
0
2
4
6
8
10
12
14May
N = 92mean = 400
JuneN = 311
mean = 390
JulyN = 192
mean = 404
TotalN = 595
mean = 396
Figure 11. Length-frequency distribution of walleye harvested by anglers fishing middle
Lake Oahe, South Dakota during the May-July 2015 daylight period. Vertical
lines represent 15 and 20 in. and N is sample size.

38
30 40 50 60
Per
cen
t o
f a
ng
ler
catc
h
0
2
4
6
8
10
12
Length (cm)
30 40 50 60
0
2
4
6
8
10
12
14May
N = 428mean = 410
JuneN = 221
mean = 403
JulyN = 132
mean = 401
TotalN = 781
mean = 404
Figure 12. Length-frequency distribution of walleye harvested by anglers fishing upper
Lake Oahe, South Dakota during the May-July 2015 daylight period. Vertical
lines represent 15 and 20 in. and N is sample size.
Table 23. Estimated hourly catch rates (fish/angler-h) for walleye, smallmouth bass,
white bass, channel catfish and all fish combined, by year, for all anglers during
the May-July daylight period on Lake Oahe, South Dakota from 2006-2015.
Year
Catch rate (fish/angler-h)
Walleye Smallmouth
bass White bass
Channel
catfish All fish
2006 0.55 0.03 0.03 0.08 0.77
2007 0.69 0.08 0.06 0.05 0.95
2008 0.72 0.08 0.03 0.02 0.88
2009 0.46 0.07 0.03 0.04 0.66
2010 0.36 0.13 0.02 0.05 0.85
2011 1.35 0.12 0.02 0.05 1.77
2012 2.07 0.20 0.02 0.03 2.53
2013 1.77 0.11 0.04 0.09 2.16
2014 1.21 0.10 0.02 0.09 1.49
2015 0.77 0.12 0.02 0.09 1.15

39
Table 24. Estimated hourly catch, harvest and release rates (fish/angler-h), by species for
species-specific anglers during the May-July 2015 daylight period on Lake Oahe,
South Dakota.
Species Catch rate
(fish/angler-h)
Harvest rate
(fish/angler-h)
Release rate
(fish/angler-h)
Walleye 1.86 1.10 0.76
Smallmouth bass 1.97 0.08 1.89
Channel catfish 13.30 11.75 1.56
Chinook salmon 0.00 0.00 0.00
Northern pike 0.19 0.03 0.16
Table 25. Estimated hourly catch, harvest and release rates (fish/angler-h) for walleye and
all species combined, by month during the May-July 2015 daylight period on
Lake Oahe, South Dakota.
Month
Walleye All fish combined
Catch
rate
Harvest
rate
Release
rate
Catch
Rate
Harvest
rate
Release
rate
May 0.51 0.33 0.18 0.78 0.44 0.34
June 0.87 0.48 0.39 1.19 0.54 0.65
July 0.81 0.39 0.42 1.32 0.44 0.88
Total 0.77 0.42 0.35 1.15 0.49 0.66

40
Table 26. Percentage of angling parties that caught (top panel) or harvested (bottom
panel) a specified number of walleye and sauger per angler in each zone during
the May-July 2014 and 2015 daylight period on Lake Oahe, South Dakota.
Number/
Person
Catch per trip
2014 2015
Lower Middle Upper Total Lower Middle Upper Total
0 19 13 9 13 22 13 11 14
0.1 81 87 91 87 78 87 89 86
1 73 80 85 80 69 79 82 78
2 57 72 75 70 57 68 70 67
3 49 66 68 63 48 55 60 55
4 43 57 62 56 37 48 52 47
5 38 51 53 49 28 31 39 34
6 29 44 43 40 18 23 28 24
7 22 35 35 32 13 16 19 17
8 18 29 29 26 10 13 14 13
9 13 23 25 21 9 10 11 10
10 11 19 21 18 7 8 9 8
Number/
Person
Harvest per trip
2014 2015
Lower Middle Upper Total Lower Middle Upper Total
0 35 23 18 24 34 20 20 23
0.1 65 77 82 76 66 80 80 77
1 54 69 76 68 55 71 74 69
2 40 55 63 55 41 56 58 54
3 28 43 52 43 29 38 43 38
4 (limit) 18 29 39 30 20 24 31 26

41
Table 27. Percent of total angler contacts for resident and non-resident anglers fishing
Lake Oahe, South Dakota during the May-July daylight period from 2011-2015.
N is the number of parties interviewed.
Zone
Year
2011 2012 2013 2014 2015
Lower N 615 580 504 277 327
Residents (%) 77 75 66 73 80
Non-residents (%) 23 25 34 27 20
Middle N 581 652 448 463 613
Residents (%) 74 75 74 78 74
Non-residents (%) 26 25 26 22 26
Upper N 729 823 457 457 610
Residents (%) 70 72 67 78 75
Non-residents (%) 30 28 33 22 25
Total N 1,925 2,055 1,409 1,197 1,550
Residents (%) 74 74 69 77 76
Non-residents (%) 26 26 31 23 24
Table 28. Percent of anglers that drove a specific distance, one way, to fish Lake Oahe,
South Dakota during the May-July daylight period from 2011-2015.
Distance
(miles)
Percent by year
2011 2012 2013 2014 2015
<25 18 19 18 21 18
25-49 11 6 9 8 13
50-99 10 8 12 9 17
100-199 17 24 21 22 19
200 44 43 40 40 33
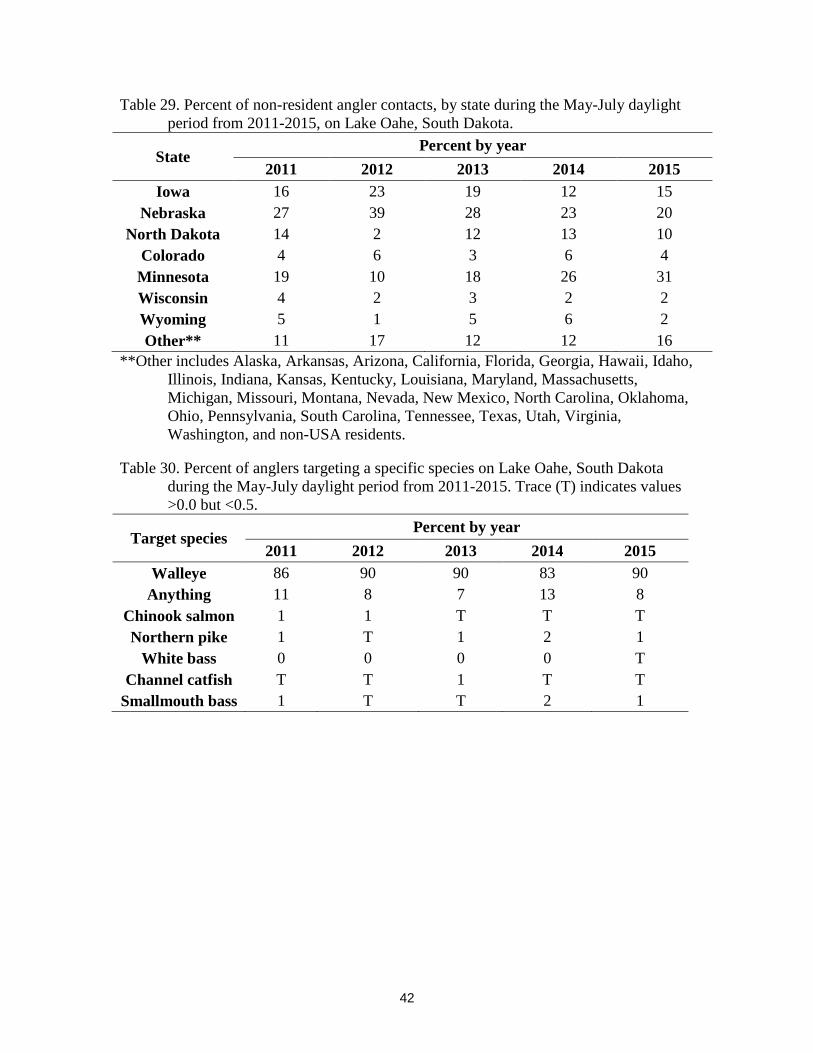
42
Table 29. Percent of non-resident angler contacts, by state during the May-July daylight
period from 2011-2015, on Lake Oahe, South Dakota.
State Percent by year
2011 2012 2013 2014 2015
Iowa 16 23 19 12 15
Nebraska 27 39 28 23 20
North Dakota 14 2 12 13 10
Colorado 4 6 3 6 4
Minnesota 19 10 18 26 31
Wisconsin 4 2 3 2 2
Wyoming 5 1 5 6 2
Other** 11 17 12 12 16
**Other includes Alaska, Arkansas, Arizona, California, Florida, Georgia, Hawaii, Idaho,
Illinois, Indiana, Kansas, Kentucky, Louisiana, Maryland, Massachusetts,
Michigan, Missouri, Montana, Nevada, New Mexico, North Carolina, Oklahoma,
Ohio, Pennsylvania, South Carolina, Tennessee, Texas, Utah, Virginia,
Washington, and non-USA residents.
Table 30. Percent of anglers targeting a specific species on Lake Oahe, South Dakota
during the May-July daylight period from 2011-2015. Trace (T) indicates values
>0.0 but <0.5.
Target species Percent by year
2011 2012 2013 2014 2015
Walleye 86 90 90 83 90
Anything 11 8 7 13 8
Chinook salmon 1 1 T T T
Northern pike 1 T 1 2 1
White bass 0 0 0 0 T
Channel catfish T T 1 T T
Smallmouth bass 1 T T 2 1
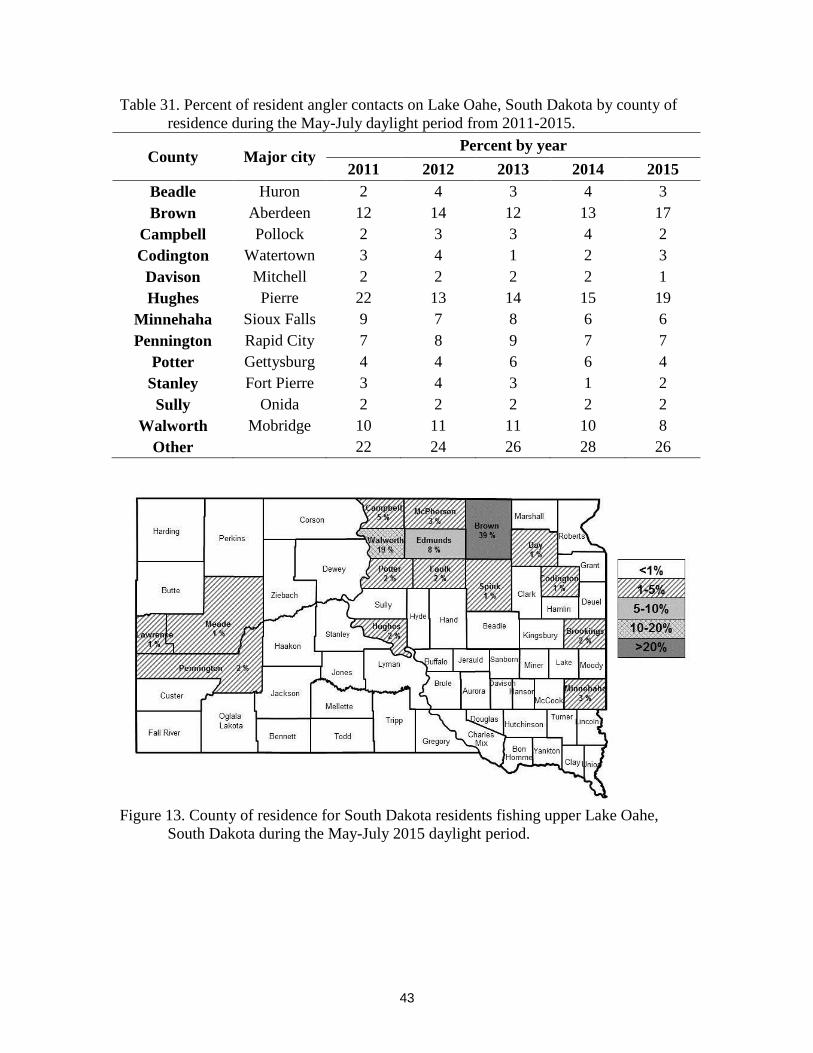
43
Table 31. Percent of resident angler contacts on Lake Oahe, South Dakota by county of
residence during the May-July daylight period from 2011-2015.
County Major city Percent by year
2011 2012 2013 2014 2015
Beadle Huron 2 4 3 4 3
Brown Aberdeen 12 14 12 13 17
Campbell Pollock 2 3 3 4 2
Codington Watertown 3 4 1 2 3
Davison Mitchell 2 2 2 2 1
Hughes Pierre 22 13 14 15 19
Minnehaha Sioux Falls 9 7 8 6 6
Pennington Rapid City 7 8 9 7 7
Potter Gettysburg 4 4 6 6 4
Stanley Fort Pierre 3 4 3 1 2
Sully Onida 2 2 2 2 2
Walworth Mobridge 10 11 11 10 8
Other 22 24 26 28 26
Figure 13. County of residence for South Dakota residents fishing upper Lake Oahe,
South Dakota during the May-July 2015 daylight period.

44
Figure 14. County of residence for South Dakota residents fishing middle Lake Oahe,
South Dakota during the May-July 2015 daylight period.
Figure 15. County of residence for South Dakota residents fishing lower Lake Oahe,
South Dakota during the May-July 2015 daylight period.

45
Table 32. Responses of anglers fishing Lake Oahe, South Dakota who were asked the
following question during the May-July 2015 daylight period: “Considering all
factors, how satisfied are you with your fishing trip today?” 1 = very satisfied, 2 =
moderately satisfied, 3 = slightly satisfied, 4 = neutral/no opinion (N.O.), 5 =
slightly dissatisfied, 6 = moderately dissatisfied, and 7 = very dissatisfied. N is
sample size and includes “neutral/no opinion” responses.
Month
Satisfaction rating
Satisfied Neutral/N.O. Dissatisfied N Median
1 2 3 4 5 6 7
May 77 62 24 18 12 18 9 220 2
June 218 83 26 7 11 6 10 361 1
July 107 64 41 16 10 16 10 264 2
Total 402 209 91 41 33 40 29 845 2
Percent 83% 5% 12%
Table 33. Responses of anglers fishing Lake Oahe, South Dakota who were asked the
following question during the May-July 2015 daylight period: “Considering all
factors, how satisfied are you with your fishing trip today?” compared to the
number of walleye harvested per person per trip. 1 = very satisfied, 2 =
moderately satisfied, 3 = slightly satisfied, 4 = neutral/no opinion (N.O.), 5 =
slightly dissatisfied, 6 = moderately dissatisfied and 7 = very dissatisfied. N is
sample size.
Walleye/
angler
Satisfaction rating
Satisfied Neutral/N.O. Dissatisfied N Median
1 2 3 4 5 6 7
0 57 41 28 18 13 18 18 193 2
0.1-0.9 22 18 8 6 4 9 10 77 2
1.0-1.9 32 38 19 8 12 9 1 119 2
2.0-2.9 61 35 17 6 3 3 0 125 2
3.0-3.9 57 30 9 3 1 1 0 101 1
4 (limit) 168 45 10 0 0 0 0 223 1
Percent 83% 5% 12%
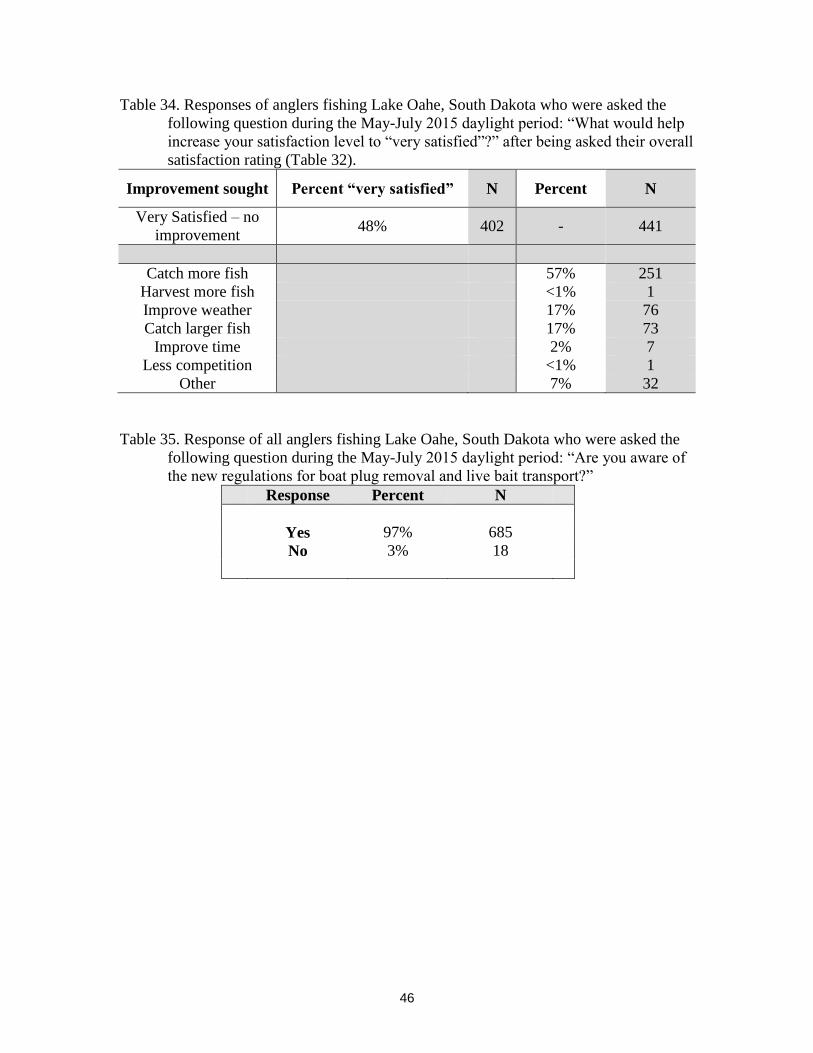
46
Table 34. Responses of anglers fishing Lake Oahe, South Dakota who were asked the
following question during the May-July 2015 daylight period: “What would help
increase your satisfaction level to “very satisfied”?” after being asked their overall
satisfaction rating (Table 32).
Improvement sought Percent “very satisfied” N Percent N
Very Satisfied – no
improvement 48% 402 - 441
Catch more fish 57% 251
Harvest more fish <1% 1
Improve weather 17% 76
Catch larger fish 17% 73
Improve time 2% 7
Less competition <1% 1
Other 7% 32
Table 35. Response of all anglers fishing Lake Oahe, South Dakota who were asked the
following question during the May-July 2015 daylight period: “Are you aware of
the new regulations for boat plug removal and live bait transport?”
Response Percent N
Yes 97% 685
No 3% 18

47
ONGOING AND COOPERATIVE RESEARCH PROJECTS
The Missouri River Fisheries staff have been collaborating on a number of
projects. During the 2015 sampling season, trap nets and boat electrofishing were
employed to capture walleye for a collaborative tagging project between South Dakota
State University (SDSU), SDGFP and North Dakota Game and Fish. A PhD student from
SDSU (E. Felts) is collecting information on natural and fishing mortality, movement and
effects of the 2011 flood on walleyes in Lake Oahe. The anticipated completion date of
this project is June 2017. Additional projects include a PhD student from SDSU (N.
Kludt) using hydro-acoustics to assess rainbow smelt and lake herring population
dynamics in Lake Oahe. We are also examining returns of Chinook salmon stocked at
various locations throughout Lake Oahe. Chinook salmon were stocked at four different
locations throughout Lake Oahe during the spring and fall of 2013 and 2014 and spring
of 2015, and tagged fish will be collected through 2019. Biologists will examine tag
returns from different stocking locations to determine the highest rate of return to anglers
and Whitlock spawning station.
FISHERY STATUS AND 2016 OUTLOOK
The Missouri River flood of 2011 resulted in steep declines in rainbow smelt
abundance as a result of entrainment through Oahe Dam. Although not novel, this
occurrence is particularly problematic as rainbow smelt are the primary food source for
walleye. Hence, Lake Oahe experienced a decline in walleye condition immediately
following the high rainbow smelt entrainment of 2011.
Walleye Wr has improved from a low in 2012, but declined from 2014 to 2015.
The abundance of age-1 lake herring appears to have improved the condition of larger
walleye that are present in the population. Lake herring may have led to increased
weights of Chinook salmon with a new state record caught in 2015. Walleye growth rates
have improved since 2012, and current growth rates are greater than the five-year
average. Walleye abundance has continued to decline since 2011, which may allow for
future increases in rainbow smelt abundance. The large 2009 (age-6) year-class of
walleye has shown a decline in abundance, but is now at? a size attractive to anglers (~
17-in) with improved growth. The 2014 year-class of walleye appears to be abundant and
should provide recreational opportunities in the future.
No age-0 gizzard shad were collected in 2014 and 2015. The last major stocking
effort was conducted in spring of 2013. Lake Oahe was ice-covered for a majority of the
winter of 2013-2014, which likely caused substantial over-winter mortality in the gizzard
shad population. In the mid-2000’s, gizzard shad became an important prey fish for many
Lake Oahe sport fish. However, Lake Oahe is located near the northern boundary of the
gizzard shad range, so permanence of this prey fish in Lake Oahe is doubtful.
Angler catches in 2016 will be dominated by small (<15-inches) walleye owing to
a substantial proportion (80%) of the walleye population currently in that size range.

48
MANAGEMENT RECOMMENDATIONS
1. Develop a new Lake Oahe Strategic Plan which includes:
Review adequacy of current management plan and objectives
Examine methods to buffer prey fish crashes
2. Expand efforts to understand / improve prey fish dynamics in Lake Oahe
Implement and evaluate deep water gillnets targeting cold water prey fish
Continue to refine hydro-acoustics estimates of rainbow smelt and lake
herring
3. Expand efforts to understand the coldwater fishery in Lake Oahe
Work to develop age structure and growth estimates for the rainbow smelt and
lake herring populations
Continue to stock Chinook salmon and evaluate the relative contribution of
various stocking locations / stocking sizes to the fishery
Evaluate effects of predation on angler returns of Chinook salmon
Evaluate interest in and efficacy of stocking other salmonid species in Lake
Oahe to utilize coolwater habitat and provide an additional fishery
Continue to monitor Lake Oahe sport fish and prey fish

49
LITERATURE CITED
Adams, G., K. Edwards, R. Hanten and K. Potter. 2008. Annual fish population and
angler use, harvest and preference surveys on Lake Oahe, South Dakota 2007.
South Dakota Department of Game, Fish and Parks, Wildlife Division, Annual
report 08-07, Pierre.
Adams, G., K. Edwards, R. Hanten and K. Potter. 2009. Annual fish population and
angler use, harvest and preference surveys on Lake Oahe, South Dakota 2008.
South Dakota Department of Game, Fish and Parks, Wildlife Division, Annual
report 09-06, Pierre.
Anderson, R.O. and A.S. Weithman. 1978. The concept of balance for coolwater fish
populations. Pages 371-378 in R.L. Kendall, editor. Selected coolwater fishes of
North America. American Fisheries Society, Bethesda, Maryland.
Anderson, R.O. 1980. Proportional stock density (PSD) and relative weight (Wr):
interpretive indices for fish populations and communities. Pages 27-33 in S. Gloss
and B. Shupp, editors. Practical fisheries management: more with less in the
1980's. New York Chapter American Fisheries Society, Ithaca.
Balk, H. and Lindem, T. 2015. Sonar4 and Sonar5-Pro post processing systems,
Operator manual version 6.0.3, 464p. Lindem Data Acquisition A/S, Oslo,
Norway.
Brown, M.L., F. Jaramillo, Jr., D.M.Gatlim III and B.R. Murphy. 1995. A revised
standard weights (Ws) equation for Channel Catfish. Journal of Freshwater
Ecology 10:295-302.
Colby, P.J., R.E. McNicol and R.A. Ryder. 1979. Synopsis of biological data on the
Walleye. Food and Agriculture Organization, Fisheries Synopsis Number 119.
Fincel, M.J., K. Edwards, R. Hanten, M. Smith and K. Potter. 2012. Annual fish
population and angler use, harvest and preference surveys on Lake Oahe, South
Dakota 2011. South Dakota Department of Game, Fish and Parks, Wildlife
Division, Annual report 12-05, Pierre.
Fincel, M.J., K. Potter, R. Hanten, H. Meyer and M. Smith. 2013. Annual fish population
and angler use, harvest and preference surveys on Lake Oahe, South Dakota 2012.
South Dakota Department of Game, Fish and Parks, Wildlife Division, Annual
report 13-07, Pierre.
Fincel, M.J., R. Hanten, H. Meyer, K. Potter and M. Smith. 2014. Annual fish population
and angler use, harvest and preference surveys on Lake Oahe, South Dakota 2013.
South Dakota Department of Game, Fish and Parks, Wildlife Division, Annual
report 14-02, Pierre.
Francis, J. 2000. WinFin Analysis Version 2.95. Nebraska Game and Parks Commission.
Lincoln Nebraska.
Gabelhouse, D.W., Jr. 1984. A length-categorization system to assess fish stocks. North
American Journal of Fisheries Management 4:273-285.
Hubert, W.A. 1996. Passive capture techniques. Pages 157192 in B.R. Murphy and D.W.
Willis, editors. Fisheries Techniques, 2nd Edition. American Fisheries Society,
Bethesda, Maryland.
Longhenry, C., K. Edwards, R. Hanten and K. Potter. 2010. Annual fish population and
angler use, harvest and preference surveys on Lake Oahe, South Dakota 2010.

50
South Dakota Department of Game, Fish and Parks, Wildlife Division, Annual
report 11-08, Pierre
Longhenry, C., K. Edwards, R. Hanten and K. Potter. 2011. Annual fish population and
angler use, harvest and preference surveys on Lake Oahe, South Dakota 2010.
South Dakota Department of Game, Fish and Parks, Wildlife Division, Annual
report 11-06, Pierre
Lott, J, B. Johnson and W. Nelson-Stastny. 2002. Annual fish population and angler use,
harvest and preference surveys on Lake Oahe, South Dakota 2001. South Dakota
Department of Game, Fish and Parks, Wildlife Division, Annual report 02-19,
Pierre.
Lott, J, B. Johnson, W. Nelson-Stastny and K. Potter. 2004. Annual fish population and
angler use, harvest and preference surveys on Lake Oahe, South Dakota 2003.
South Dakota Department of Game, Fish and Parks, Wildlife Division, Annual
report 04-22, Pierre.
Lott, J., J. Erickson, R. Hanten and K. Potter. 2007. Annual fish population and angler
use, harvest and preference surveys on Lake Oahe, South Dakota, 2006. South
Dakota Department of Game, Fish and Parks, Wildlife Division, Annual report
07-27 Pierre.
Love, R.H. 1977. Target strength of an individual fish at any aspect. Journal of the
Acoustical Society of America 62:1397-1403.
Martin, D.B., L.J. Mengel, J.F. Novotny and C.H. Walburg. 1981. Spring and summer
water levels in a Missouri River reservoir: effects of age-0 fish and zooplankton.
Transactions of the American Fisheries Society, 110: 70-381.
Meyer, H., R. Hanten, K. Potter, M. Fincel, and M. Smith. 2015. Annual fish population
and angler use, harvest and preference surveys on Lake Oahe, South Dakota 2014.
South Dakota Department of Game, Fish and Parks, Wildlife Division, Annual
report 15-04, Pierre.
Michaletz, P., B. Johnson, J. Riis, C. Stone, D. Unkenholz and D. Warnick. 1986. Annual
fisheries surveys on the Missouri River reservoirs, 1981-1985. South Dakota
Department of Game, Fish and Parks, Wildlife Division Progress Report 86-11,
Pierre.
Murphy, B.R., M.L. Brown and T.A. Springer. 1990. Evaluation of the relative weight
(Wr) index, with new applications to walleye. North American Journal of
Fisheries Management 10:85-97.
Nelson-Statsny, W. 2001. Estimates of abundance, biomass, and distribution of Rainbow
Smelt and other pelagic fish in Lake Oahe using hydro-acoustic techniques, 1996-
1999. South Dakota Department of Game, Fish and Parks, Wildlife Division,
Special Report No. 01-06, Pierre
Schmidt, B.R. 1975. Results and evaluation of an aerial creel survey technique on Lake
Sharpe, South Dakota. Master’s Thesis, South Dakota State University,
Brookings.
Soupir, C. and M. Brown. 2002. Comprehensive evaluation and modification of the
South Dakota angler creel program. South Dakota Department of Game, Fish and
Parks, Wildlife Division Completion report, Pierre.
Stone, C., J. Riis and B. Johnson. 1994. Angler use and sport fishing harvest survey on
Lake's Francis Case, Sharpe, and Oahe, South Dakota, 1992 and 1993. South

51
Dakota Department of Game, Fish and Parks, Wildlife Division Report No. 94-9,
Pierre.
U.S. Department of the Interior, U.S. Fish and Wildlife Service and U.S. Department of
Commerce, Census bureau. 2011. 2011 National Survey of Fishing, Hunting, and
Wildlife-associated Recreation. United States Government Printing Office,
Washington, D.C.
Warnick, D. 1987. The introduction of selected fish species into the Missouri River
system, 1984-85. South Dakota Department of Game, Fish and Parks, Wildlife
Division Report No. 87-10, Pierre.

52
APPENDICES
Appendix 1. Common and scientific names of common fishes of South Dakota.
Common name Scientific name
Bigmouth buffalo Ictiobus cyprinellus
Black bullhead Ameiurus melas
Black crappie Pomoxis nigromaculatus
Bluntnose minnow
Brassy minnow
Pimephales notatus
Hybognathus hankinsoni
Burbot
Channel catfish
Lota lota
Ictalurus punctatus
Chinook salmon Oncorhynchus tshawytscha
Common carp Cyprinus carpio
Emerald shiner Notropis atherinoides
Fathead minnow Pimephales promelas
Flathead chub Platygobio gracilis
Freshwater drum Aplodinotus grunniens
Gizzard shad Dorosoma cepedianum
Goldeye Hiodon alosoides
Golden shiner
Johnny darter
Notemigonus crysoleucas
Etheostoma nigrum
Lake herring Coregonus artedi
Largemouth bass Micropterus salmoides
Northern pike Esox lucius
Paddlefish
Rainbow smelt
Polyodon spathula
Osmerus mordax
Rainbow trout Oncorhynchus mykiss
River carpsucker Carpiodes carpio
Red shiner Cyprinella lutrensis
Sauger Sander canadensis
Shorthead redhorse Moxostoma macrolepidotum
Shortnose gar Lepisosteus platostomus
Shovelnose sturgeon Scaphirhynchus platorynchus
Silvery minnow
Smallmouth bass
Hybognathus nuchalis
Micropterus dolomieu
Smallmouth buffalo Ictiobus bubalus
Spottail shiner Notropis hudsonius
Suckermouth minnow
Walleye
Phenacobius mirabilis
Sander vitreus
White bass Morone chrysops
White crappie Pomoxis annularis
White sucker Catostomus commersonii
Yellow perch Perca flavescens

53
Appendix 2. Minimum lengths (mm) of length-class designations used when calculating
proportional size distribution values for fish population survey samples (Gabelhouse
1984).
Species Length class
Stock Quality Preferred Memorable Trophy
Channel catfish 280 410 610 710 910
Walleye 250 380 510 630 760

54
Appendix 3. Angler satisfaction, preference and attitude questions asked as part of the
May-July 2015 angler use and harvest survey on Lake Oahe, South Dakota. Question
series A and B were asked in an alternating order as part of the survey.
Question Series A:
Trip Satisfaction:
1. Considering all factors, how satisfied are you with your fishing trip today?
1 = Very satisfied
2 = Moderately satisfied
3 = Slightly satisfied
4 = Neutral/ No opinion (neither satisfied or dissatisfied)
5 = Slightly dissatisfied
6 = Moderately dissatisfied
7 = Very dissatisfied
2. What would help increase your satisfaction level to “very satisfied”?
a. More fish caught
b. Larger fish caught
c. Improve time
d. More fish harvested
e. Improve weather
f. Less competition
g. Other:________
Question Series B:
Angler caught tagged walleye questions:
#1. How many tagged walleye have you caught in 2015?
#2. Of these, how many were reported to SD GFP to date for 2015?
Aquatic nuisance species regulation awareness:
Are you aware of the new regulations for boat plug removal and live bait
transport?
YES or NO