south florida commercial real estate review 2012 south florida market... · ... crystal...
TRANSCRIPT
Q4 2012
Accelerating success.
SOUTH FLORIDA COMMERCIAL REAL ESTATE REVIEW
Market Report Criteria
Office: Properties classified class A, B, and C that are both existing and under construction measuring greater than 10,000 square feet of rentable area for single and multi-tenant, non-government and non-medical tenant users. Criteria is also pulled for properties classified class A, B, and C that are both existing and under construction measuring greater than 25,000 square feet of rentable area for single and multi-tenant, non-government, non-medical tenant and non-owner occupied users.
Industrial: Properties that are both existing and under construction measuring greater than 20,000 square feet of rentable area for single and multi-tenant users.
Retail: Properties measuring greater than 10,000 square feet of rentable area located in a shopping center.
Cover photo courtesy of the Greater Miami Convention & Visitors Bureau
Contact: Crystal Proenza—[email protected] | Research: Alex Morcate—[email protected]
Letter from Leadership 3Executive Summary 4
TABLE OF CONTENTS
Office Market 5Industrial Market 8Retail Market 10
MIAMI-DADE COUNTY
SOUTH FLORIDA REAL ESTATE REVIEW
SOUTH FLORIDA COMMERCIAL REAL ESTATE REVIEW | Q4 2012
Office Market 12Industrial Market 15Retail Market 17
BROWARD COUNTY
Office Market 19Industrial Market 21Retail Market 23
PALM BEACH COUNTY
Colliers International South Florida Team 25
COMPANY INFORMATION
Dear Valued Client,
Throughout 2012 we looked ahead with caution, understanding that the market was changing and direction was positive but uncertain. Looking back at 2012 we see that we’ve come a long way from this time last year. Transaction activity is up. Interest and inquiries are up. Confidence and outlook are up too. Overall, the South Florida market made improvements virtually across the board, both at the macro and micro level.
This consistent increase in activity is fueled by several factors, many of which we expect to see continue into the first half of 2013. CMBS is coming back into the picture which will provide a solid foundation of growth from which to springboard. Each of our primary lines of business benefits from the resolution of distress across the local and national market. While the market is improving, we estimate that roughly one third of the market is still distressed. We are also seeing a pick up in the private sector with 1031 exchanges getting active.
Net absorption has been positive across almost every major property type in every major market, an obvious indication of leasing strength and a narrower gap between bid and ask for commercial space. Some of this has to do with negligible construction activity, at least when compared to the first part of the 2000’s.
These observations are more than just commentary though. We’ve seen a continued evolution in our book of business to include a greater proportion of institutional and headline-worthy deals. We closed nearly $400 million in investment sales transaction value and leased approximately 1.5 million square feet of space across South Florida in 2012.
As we mark an end to the year we acknowledge that the recovery is still well under way. This means the local market will still be subject to short-term volatility as talk about the fiscal cliff and national level budget concerns pump the brakes on what looks like a smoother road through 2013. The residential market is still roaring back fueled by foreign demand and we expect this demand will begin to taper off gradually.
In short, the local market saw widespread improvement when compared to 2011 and we expect to see more of the same during 2013. However, we remain cautiously optimistic.
Sincerely,
DONNA ABOOD MICHAEL T. FAY STEPHEN NOSTRANDChairman - Founding Partner Chairman - Founding Partner Chief Executive [email protected] [email protected] [email protected]
The Colliers Interna-tional South Florida Commercial Real Estate Review pro-vides market data for the Tri-County area, highlighting the office, industrial and retail markets.
SOUTH FLORIDA COMMERCIAL REAL ESTATE REVIEW | Q4 2012
COLLIERS INTERNATIONAL | P. 3 Contact: Crystal Proenza—[email protected] | Research: Alex Morcate—[email protected]
Last quarter we brought up the issue of confidence and how hesitation was leading to mixed results across the local market. Several months later moderate confidence has given way to positive momentum. As we closed the books on 2012 we made history on a number of different fronts.
While Q3 saw sluggish transaction activity, Q4 recorded a 200% increase over three months and a 15% increase year-over-year across all property types. Here’s the really interesting part: annual transaction volume hasn’t been this high since the go-go days of 2007. Average deal-level cap rates have fallen to a multi-year low near 7.00% and for the first half of 2013 this trend is expected to continue.
One of the most obvious examples of this momentum are the numerous large sales and leases closed throughout the year. Deals like Miami Center ($260M – class A office), 10201 Collins Avenue ($220M – oceanfront development site) and Lincoln Center ($139M – Lincoln Road retail) continued to up the ante on investment deals of the year.
As you’d expect, industrial deals took the top spot in terms of largest deal by total square footage with the likes of Schenker (150,000 SF – Miami Airport) and Perez Trading (140,000 SF – Hialeah). But retail and office leases aren’t to be outdone in terms of overall value with leases like Lord and Taylor (80,000 SF - Mizner Park) or Sapient (42,000 SF – Coconut Grove).
Even though 2012 holiday sales didn’t deliver (sorry Santa, no pun intended) and unemployment figures for the Tri-County area rose higher than expected to 8.1% after six months of gradual declines, the market appears to have more confidence and positive momentum than it did this time last year.
Looking ahead, we expect to see this trend continue through the first half of 2013 as CMBS continues to play a larger role in the market, institutional investors continue to leverage cheap capital, landlords and tenants become more open minded and foreign buyers continue to do what they do best in Miami – buy.
South Florida Market Overall Executive Summary
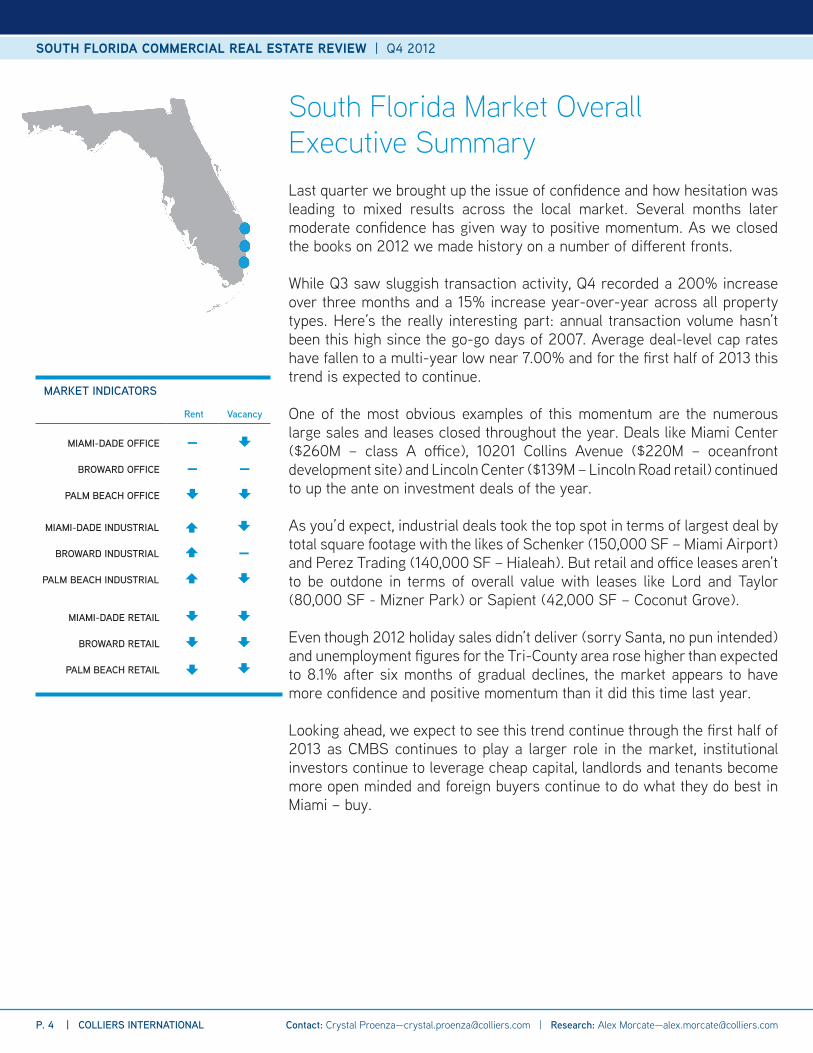
MARKET INDICATORS
Rent Vacancy
MIAMI-DADE OFFICE —
BROWARD OFFICE — —
PALM BEACH OFFICE
MIAMI-DADE INDUSTRIAL
BROWARD INDUSTRIAL —
PALM BEACH INDUSTRIAL
MIAMI-DADE RETAIL
BROWARD RETAIL
PALM BEACH RETAIL
P. 4 | COLLIERS INTERNATIONAL
SOUTH FLORIDA COMMERCIAL REAL ESTATE REVIEW | Q4 2012
Contact: Crystal Proenza—[email protected] | Research: Alex Morcate—[email protected]
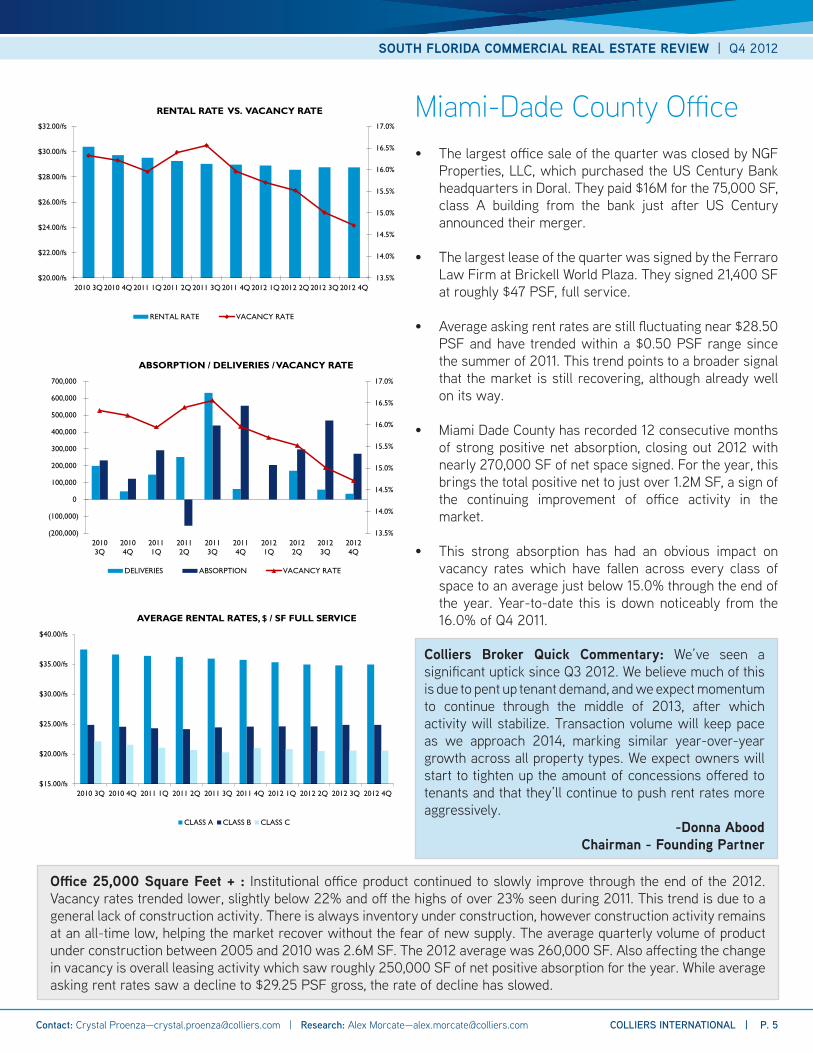
• The largest office sale of the quarter was closed by NGF Properties, LLC, which purchased the US Century Bank headquarters in Doral. They paid $16M for the 75,000 SF, class A building from the bank just after US Century announced their merger.
• The largest lease of the quarter was signed by the Ferraro Law Firm at Brickell World Plaza. They signed 21,400 SF at roughly $47 PSF, full service.
• Average asking rent rates are still fluctuating near $28.50 PSF and have trended within a $0.50 PSF range since the summer of 2011. This trend points to a broader signal that the market is still recovering, although already well on its way.
• Miami Dade County has recorded 12 consecutive months of strong positive net absorption, closing out 2012 with nearly 270,000 SF of net space signed. For the year, this brings the total positive net to just over 1.2M SF, a sign of the continuing improvement of office activity in the market.
• This strong absorption has had an obvious impact on vacancy rates which have fallen across every class of space to an average just below 15.0% through the end of the year. Year-to-date this is down noticeably from the 16.0% of Q4 2011.
Miami-Dade County Office
Office 25,000 Square Feet + : Institutional office product continued to slowly improve through the end of the 2012. Vacancy rates trended lower, slightly below 22% and off the highs of over 23% seen during 2011. This trend is due to a general lack of construction activity. There is always inventory under construction, however construction activity remains at an all-time low, helping the market recover without the fear of new supply. The average quarterly volume of product under construction between 2005 and 2010 was 2.6M SF. The 2012 average was 260,000 SF. Also affecting the change in vacancy is overall leasing activity which saw roughly 250,000 SF of net positive absorption for the year. While average asking rent rates saw a decline to $29.25 PSF gross, the rate of decline has slowed.
13.5%
14.0%
14.5%
15.0%
15.5%
16.0%
16.5%
17.0%
$20.00/fs
$22.00/fs
$24.00/fs
$26.00/fs
$28.00/fs
$30.00/fs
$32.00/fs
2010 3Q 2010 4Q 2011 1Q 2011 2Q 2011 3Q 2011 4Q 2012 1Q 2012 2Q 2012 3Q 2012 4Q
RENTAL RATE VS. VACANCY RATE
RENTAL RATE VACANCY RATE
13.5%
14.0%
14.5%
15.0%
15.5%
16.0%
16.5%
17.0%
(200,000)
(100,000)
0
100,000
200,000
300,000
400,000
500,000
600,000
700,000
20103Q
20104Q
20111Q
20112Q
20113Q
20114Q
20121Q
20122Q
20123Q
20124Q
ABSORPTION / DELIVERIES / VACANCY RATE
DELIVERIES ABSORPTION VACANCY RATE
$15.00/fs
$20.00/fs
$25.00/fs
$30.00/fs
$35.00/fs
$40.00/fs
2010 3Q 2010 4Q 2011 1Q 2011 2Q 2011 3Q 2011 4Q 2012 1Q 2012 2Q 2012 3Q 2012 4Q
AVERAGE RENTAL RATES, $ / SF FULL SERVICE
CLASS A CLASS B CLASS C
Colliers Broker Quick Commentary: We’ve seen a significant uptick since Q3 2012. We believe much of this is due to pent up tenant demand, and we expect momentum to continue through the middle of 2013, after which activity will stabilize. Transaction volume will keep pace as we approach 2014, marking similar year-over-year growth across all property types. We expect owners will start to tighten up the amount of concessions offered to tenants and that they’ll continue to push rent rates more aggressively. -Donna Abood
Chairman - Founding Partner
SOUTH FLORIDA COMMERCIAL REAL ESTATE REVIEW | Q4 2012
COLLIERS INTERNATIONAL | P. 5 Contact: Crystal Proenza—[email protected] | Research: Alex Morcate—[email protected]
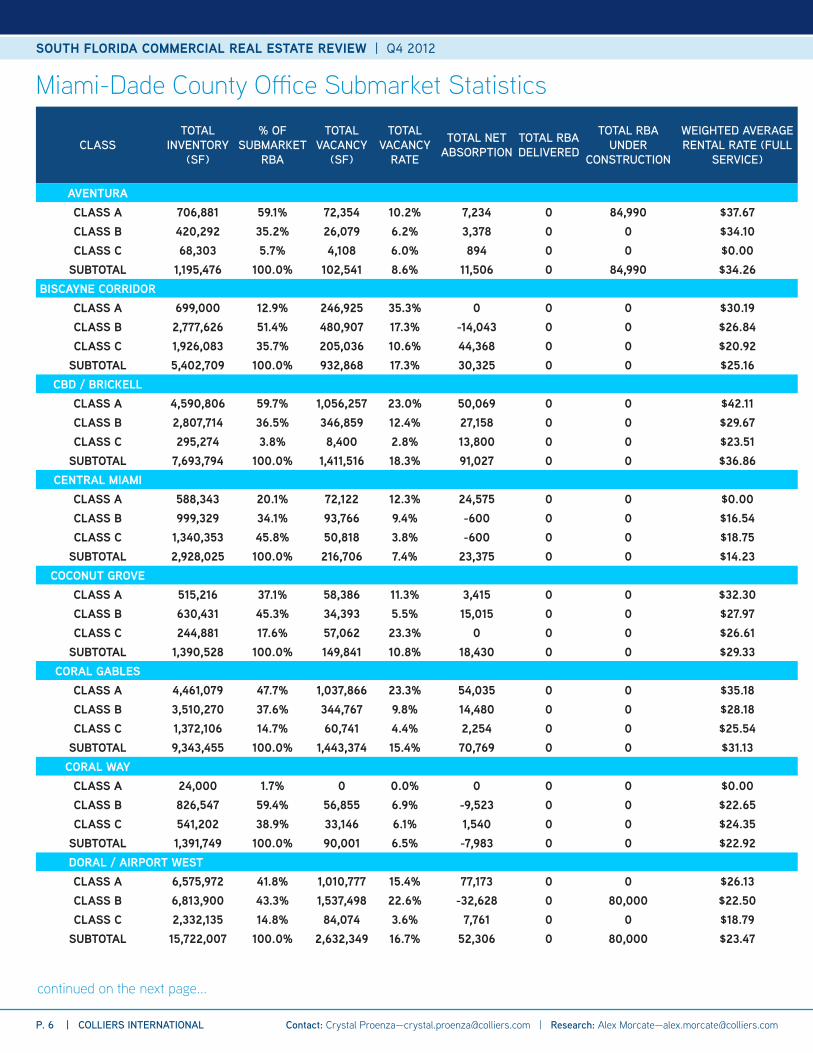
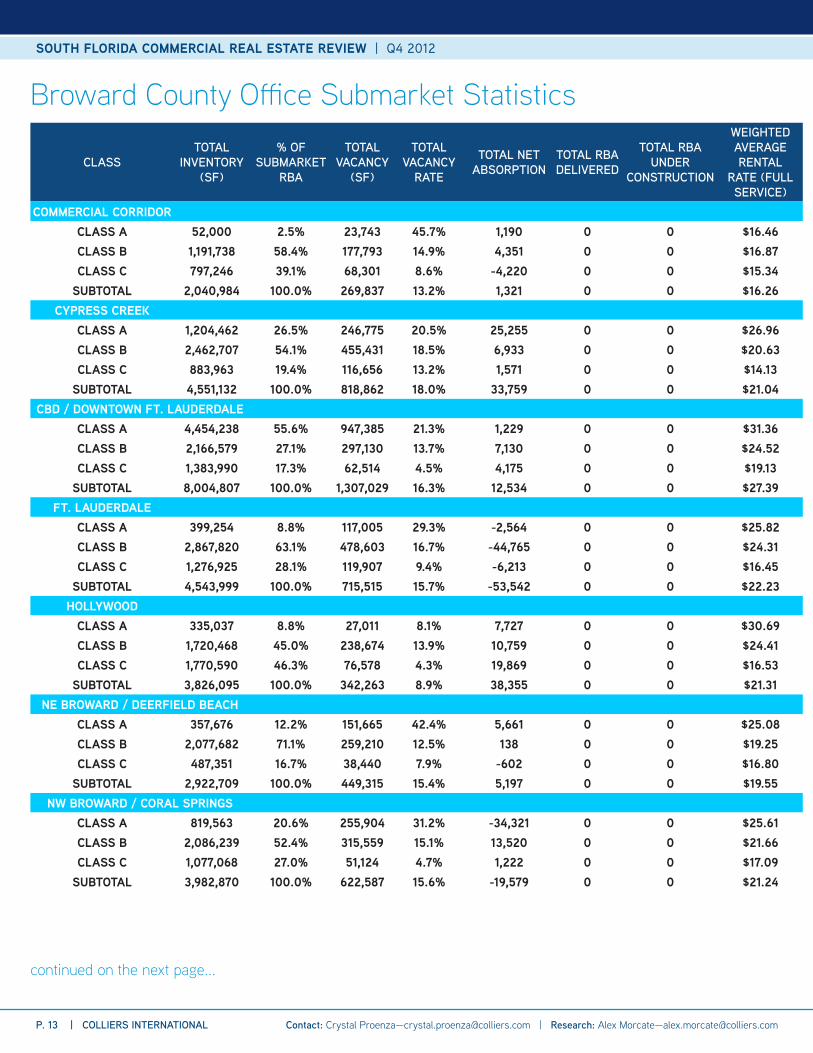
Miami-Dade County Office Submarket Statistics
continued on the next page...
CLASSTOTAL
INVENTORY (SF)
% OF SUBMARKET
RBA
TOTAL VACANCY
(SF)
TOTAL VACANCY
RATE
TOTAL NET ABSORPTION
TOTAL RBA DELIVERED
TOTAL RBA UNDER
CONSTRUCTION
WEIGHTED AVERAGE RENTAL RATE (FULL
SERVICE)
AVENTURACLASS A 706,881 59.1% 72,354 10.2% 7,234 0 84,990 $37.67CLASS B 420,292 35.2% 26,079 6.2% 3,378 0 0 $34.10CLASS C 68,303 5.7% 4,108 6.0% 894 0 0 $0.00
SUBTOTAL 1,195,476 100.0% 102,541 8.6% 11,506 0 84,990 $34.26BISCAYNE CORRIDOR
CLASS A 699,000 12.9% 246,925 35.3% 0 0 0 $30.19CLASS B 2,777,626 51.4% 480,907 17.3% -14,043 0 0 $26.84CLASS C 1,926,083 35.7% 205,036 10.6% 44,368 0 0 $20.92
SUBTOTAL 5,402,709 100.0% 932,868 17.3% 30,325 0 0 $25.16CBD / BRICKELL
CLASS A 4,590,806 59.7% 1,056,257 23.0% 50,069 0 0 $42.11CLASS B 2,807,714 36.5% 346,859 12.4% 27,158 0 0 $29.67CLASS C 295,274 3.8% 8,400 2.8% 13,800 0 0 $23.51
SUBTOTAL 7,693,794 100.0% 1,411,516 18.3% 91,027 0 0 $36.86CENTRAL MIAMI
CLASS A 588,343 20.1% 72,122 12.3% 24,575 0 0 $0.00CLASS B 999,329 34.1% 93,766 9.4% -600 0 0 $16.54CLASS C 1,340,353 45.8% 50,818 3.8% -600 0 0 $18.75
SUBTOTAL 2,928,025 100.0% 216,706 7.4% 23,375 0 0 $14.23COCONUT GROVE
CLASS A 515,216 37.1% 58,386 11.3% 3,415 0 0 $32.30CLASS B 630,431 45.3% 34,393 5.5% 15,015 0 0 $27.97CLASS C 244,881 17.6% 57,062 23.3% 0 0 0 $26.61
SUBTOTAL 1,390,528 100.0% 149,841 10.8% 18,430 0 0 $29.33CORAL GABLES
CLASS A 4,461,079 47.7% 1,037,866 23.3% 54,035 0 0 $35.18CLASS B 3,510,270 37.6% 344,767 9.8% 14,480 0 0 $28.18CLASS C 1,372,106 14.7% 60,741 4.4% 2,254 0 0 $25.54
SUBTOTAL 9,343,455 100.0% 1,443,374 15.4% 70,769 0 0 $31.13CORAL WAY
CLASS A 24,000 1.7% 0 0.0% 0 0 0 $0.00CLASS B 826,547 59.4% 56,855 6.9% -9,523 0 0 $22.65CLASS C 541,202 38.9% 33,146 6.1% 1,540 0 0 $24.35
SUBTOTAL 1,391,749 100.0% 90,001 6.5% -7,983 0 0 $22.92DORAL / AIRPORT WESTCLASS A 6,575,972 41.8% 1,010,777 15.4% 77,173 0 0 $26.13CLASS B 6,813,900 43.3% 1,537,498 22.6% -32,628 0 80,000 $22.50CLASS C 2,332,135 14.8% 84,074 3.6% 7,761 0 0 $18.79
SUBTOTAL 15,722,007 100.0% 2,632,349 16.7% 52,306 0 80,000 $23.47
P. 6 | COLLIERS INTERNATIONAL
SOUTH FLORIDA COMMERCIAL REAL ESTATE REVIEW | Q4 2012
Contact: Crystal Proenza—[email protected] | Research: Alex Morcate—[email protected]
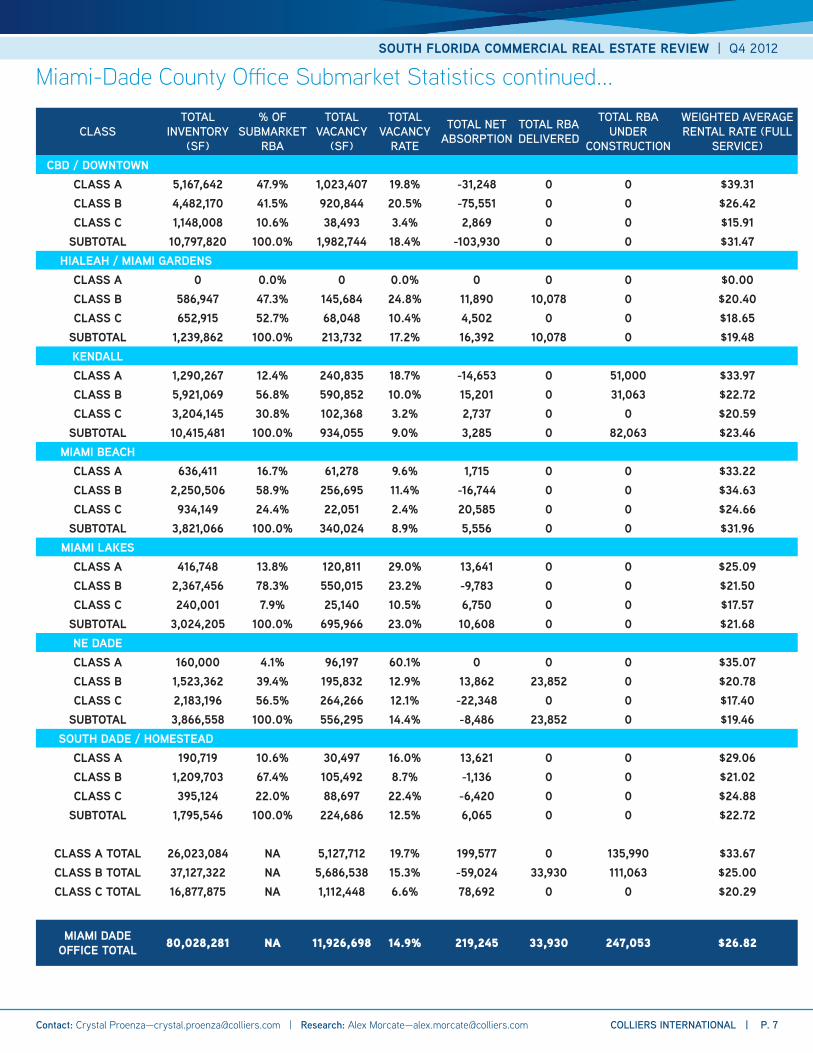
Miami-Dade County Office Submarket Statistics continued...
CLASSTOTAL
INVENTORY (SF)
% OF SUBMARKET
RBA
TOTAL VACANCY
(SF)
TOTAL VACANCY
RATE
TOTAL NET ABSORPTION
TOTAL RBA DELIVERED
TOTAL RBA UNDER
CONSTRUCTION
WEIGHTED AVERAGE RENTAL RATE (FULL
SERVICE)CBD / DOWNTOWN
CLASS A 5,167,642 47.9% 1,023,407 19.8% -31,248 0 0 $39.31CLASS B 4,482,170 41.5% 920,844 20.5% -75,551 0 0 $26.42CLASS C 1,148,008 10.6% 38,493 3.4% 2,869 0 0 $15.91
SUBTOTAL 10,797,820 100.0% 1,982,744 18.4% -103,930 0 0 $31.47HIALEAH / MIAMI GARDENS
CLASS A 0 0.0% 0 0.0% 0 0 0 $0.00CLASS B 586,947 47.3% 145,684 24.8% 11,890 10,078 0 $20.40CLASS C 652,915 52.7% 68,048 10.4% 4,502 0 0 $18.65
SUBTOTAL 1,239,862 100.0% 213,732 17.2% 16,392 10,078 0 $19.48KENDALLCLASS A 1,290,267 12.4% 240,835 18.7% -14,653 0 51,000 $33.97CLASS B 5,921,069 56.8% 590,852 10.0% 15,201 0 31,063 $22.72CLASS C 3,204,145 30.8% 102,368 3.2% 2,737 0 0 $20.59
SUBTOTAL 10,415,481 100.0% 934,055 9.0% 3,285 0 82,063 $23.46MIAMI BEACH
CLASS A 636,411 16.7% 61,278 9.6% 1,715 0 0 $33.22CLASS B 2,250,506 58.9% 256,695 11.4% -16,744 0 0 $34.63CLASS C 934,149 24.4% 22,051 2.4% 20,585 0 0 $24.66
SUBTOTAL 3,821,066 100.0% 340,024 8.9% 5,556 0 0 $31.96MIAMI LAKES
CLASS A 416,748 13.8% 120,811 29.0% 13,641 0 0 $25.09CLASS B 2,367,456 78.3% 550,015 23.2% -9,783 0 0 $21.50CLASS C 240,001 7.9% 25,140 10.5% 6,750 0 0 $17.57
SUBTOTAL 3,024,205 100.0% 695,966 23.0% 10,608 0 0 $21.68NE DADECLASS A 160,000 4.1% 96,197 60.1% 0 0 0 $35.07CLASS B 1,523,362 39.4% 195,832 12.9% 13,862 23,852 0 $20.78CLASS C 2,183,196 56.5% 264,266 12.1% -22,348 0 0 $17.40
SUBTOTAL 3,866,558 100.0% 556,295 14.4% -8,486 23,852 0 $19.46SOUTH DADE / HOMESTEAD
CLASS A 190,719 10.6% 30,497 16.0% 13,621 0 0 $29.06CLASS B 1,209,703 67.4% 105,492 8.7% -1,136 0 0 $21.02CLASS C 395,124 22.0% 88,697 22.4% -6,420 0 0 $24.88
SUBTOTAL 1,795,546 100.0% 224,686 12.5% 6,065 0 0 $22.72
CLASS A TOTAL 26,023,084 NA 5,127,712 19.7% 199,577 0 135,990 $33.67CLASS B TOTAL 37,127,322 NA 5,686,538 15.3% -59,024 33,930 111,063 $25.00CLASS C TOTAL 16,877,875 NA 1,112,448 6.6% 78,692 0 0 $20.29
MIAMI DADE OFFICE TOTAL 80,028,281 NA 11,926,698 14.9% 219,245 33,930 247,053 $26.82
SOUTH FLORIDA COMMERCIAL REAL ESTATE REVIEW | Q4 2012
COLLIERS INTERNATIONAL | P. 7 Contact: Crystal Proenza—[email protected] | Research: Alex Morcate—[email protected]
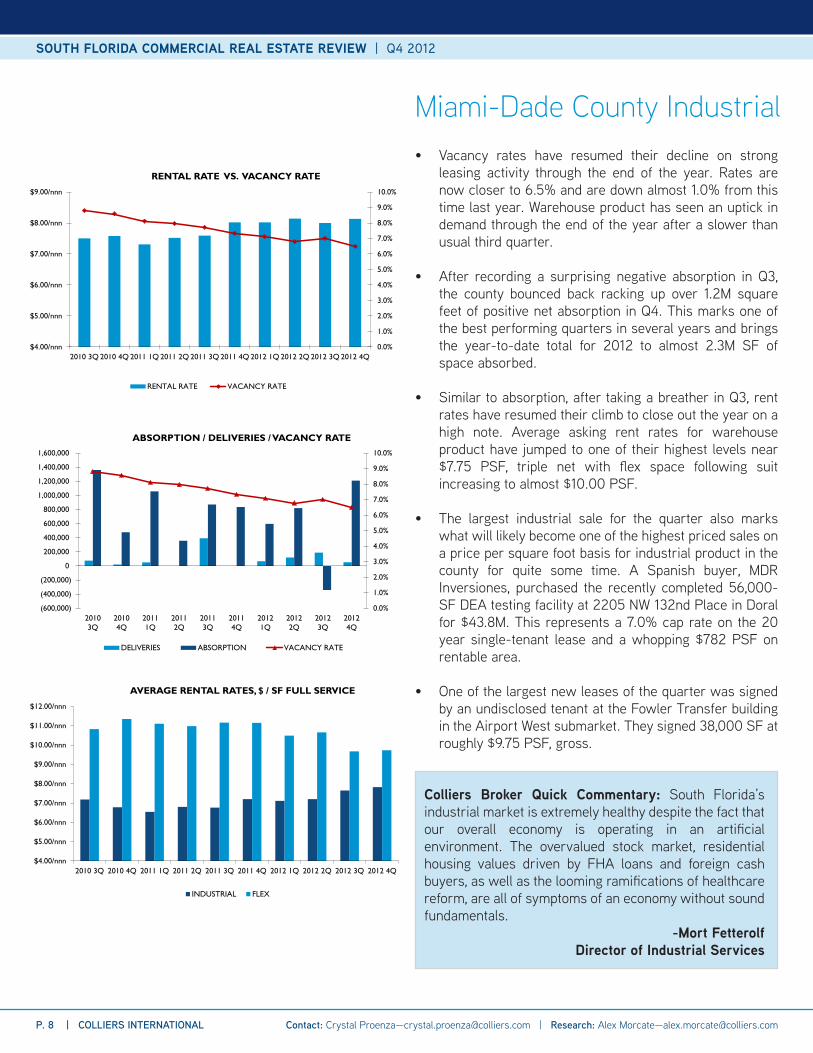
• Vacancy rates have resumed their decline on strong leasing activity through the end of the year. Rates are now closer to 6.5% and are down almost 1.0% from this time last year. Warehouse product has seen an uptick in demand through the end of the year after a slower than usual third quarter.
• After recording a surprising negative absorption in Q3, the county bounced back racking up over 1.2M square feet of positive net absorption in Q4. This marks one of the best performing quarters in several years and brings the year-to-date total for 2012 to almost 2.3M SF of space absorbed.
• Similar to absorption, after taking a breather in Q3, rent rates have resumed their climb to close out the year on a high note. Average asking rent rates for warehouse product have jumped to one of their highest levels near $7.75 PSF, triple net with flex space following suit increasing to almost $10.00 PSF.
• The largest industrial sale for the quarter also marks what will likely become one of the highest priced sales on a price per square foot basis for industrial product in the county for quite some time. A Spanish buyer, MDR Inversiones, purchased the recently completed 56,000-SF DEA testing facility at 2205 NW 132nd Place in Doral for $43.8M. This represents a 7.0% cap rate on the 20 year single-tenant lease and a whopping $782 PSF on rentable area.
• One of the largest new leases of the quarter was signed by an undisclosed tenant at the Fowler Transfer building in the Airport West submarket. They signed 38,000 SF at roughly $9.75 PSF, gross.
Miami-Dade County Industrial
0.0%
1.0%
2.0%
3.0%
4.0%
5.0%
6.0%
7.0%
8.0%
9.0%
10.0%
$4.00/nnn
$5.00/nnn
$6.00/nnn
$7.00/nnn
$8.00/nnn
$9.00/nnn
2010 3Q 2010 4Q 2011 1Q 2011 2Q 2011 3Q 2011 4Q 2012 1Q 2012 2Q 2012 3Q 2012 4Q
RENTAL RATE VS. VACANCY RATE
RENTAL RATE VACANCY RATE
0.0%
1.0%
2.0%
3.0%
4.0%
5.0%
6.0%
7.0%
8.0%
9.0%
10.0%
(600,000)
(400,000)
(200,000)
0
200,000
400,000
600,000
800,000
1,000,000
1,200,000
1,400,000
1,600,000
20103Q
20104Q
20111Q
20112Q
20113Q
20114Q
20121Q
20122Q
20123Q
20124Q
ABSORPTION / DELIVERIES / VACANCY RATE
DELIVERIES ABSORPTION VACANCY RATE
$4.00/nnn
$5.00/nnn
$6.00/nnn
$7.00/nnn
$8.00/nnn
$9.00/nnn
$10.00/nnn
$11.00/nnn
$12.00/nnn
2010 3Q 2010 4Q 2011 1Q 2011 2Q 2011 3Q 2011 4Q 2012 1Q 2012 2Q 2012 3Q 2012 4Q
AVERAGE RENTAL RATES, $ / SF FULL SERVICE
INDUSTRIAL FLEX
Colliers Broker Quick Commentary: South Florida’s industrial market is extremely healthy despite the fact that our overall economy is operating in an artificial environment. The overvalued stock market, residential housing values driven by FHA loans and foreign cash buyers, as well as the looming ramifications of healthcare reform, are all of symptoms of an economy without sound fundamentals.
-Mort FetterolfDirector of Industrial Services
P. 8 | COLLIERS INTERNATIONAL
SOUTH FLORIDA COMMERCIAL REAL ESTATE REVIEW | Q4 2012
Contact: Crystal Proenza—[email protected] | Research: Alex Morcate—[email protected]
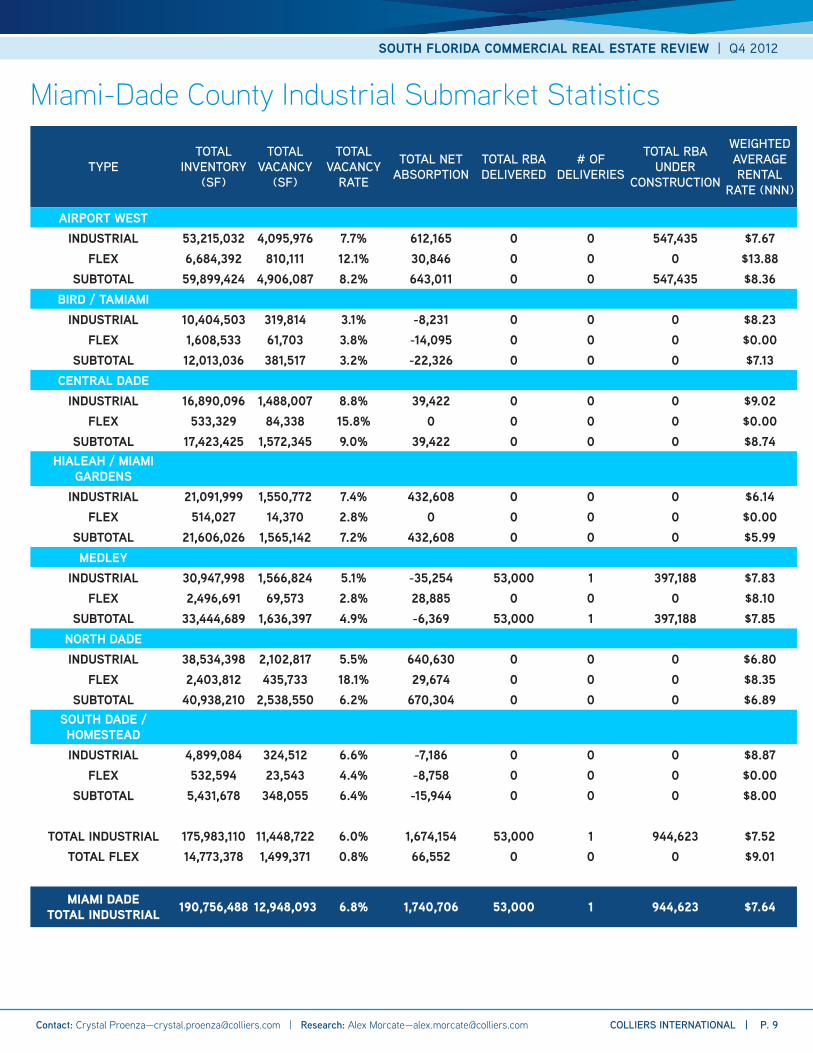
Miami-Dade County Industrial Submarket Statistics
TYPETOTAL
INVENTORY (SF)
TOTAL VACANCY
(SF)
TOTAL VACANCY
RATE
TOTAL NET ABSORPTION
TOTAL RBA DELIVERED
# OF DELIVERIES
TOTAL RBA UNDER
CONSTRUCTION
WEIGHTED AVERAGE RENTAL
RATE (NNN)
AIRPORT WESTINDUSTRIAL 53,215,032 4,095,976 7.7% 612,165 0 0 547,435 $7.67
FLEX 6,684,392 810,111 12.1% 30,846 0 0 0 $13.88SUBTOTAL 59,899,424 4,906,087 8.2% 643,011 0 0 547,435 $8.36
BIRD / TAMIAMIINDUSTRIAL 10,404,503 319,814 3.1% -8,231 0 0 0 $8.23
FLEX 1,608,533 61,703 3.8% -14,095 0 0 0 $0.00SUBTOTAL 12,013,036 381,517 3.2% -22,326 0 0 0 $7.13
CENTRAL DADEINDUSTRIAL 16,890,096 1,488,007 8.8% 39,422 0 0 0 $9.02
FLEX 533,329 84,338 15.8% 0 0 0 0 $0.00SUBTOTAL 17,423,425 1,572,345 9.0% 39,422 0 0 0 $8.74
HIALEAH / MIAMI GARDENS
INDUSTRIAL 21,091,999 1,550,772 7.4% 432,608 0 0 0 $6.14FLEX 514,027 14,370 2.8% 0 0 0 0 $0.00
SUBTOTAL 21,606,026 1,565,142 7.2% 432,608 0 0 0 $5.99MEDLEY
INDUSTRIAL 30,947,998 1,566,824 5.1% -35,254 53,000 1 397,188 $7.83FLEX 2,496,691 69,573 2.8% 28,885 0 0 0 $8.10
SUBTOTAL 33,444,689 1,636,397 4.9% -6,369 53,000 1 397,188 $7.85NORTH DADEINDUSTRIAL 38,534,398 2,102,817 5.5% 640,630 0 0 0 $6.80
FLEX 2,403,812 435,733 18.1% 29,674 0 0 0 $8.35SUBTOTAL 40,938,210 2,538,550 6.2% 670,304 0 0 0 $6.89
SOUTH DADE / HOMESTEADINDUSTRIAL 4,899,084 324,512 6.6% -7,186 0 0 0 $8.87
FLEX 532,594 23,543 4.4% -8,758 0 0 0 $0.00SUBTOTAL 5,431,678 348,055 6.4% -15,944 0 0 0 $8.00
TOTAL INDUSTRIAL 175,983,110 11,448,722 6.0% 1,674,154 53,000 1 944,623 $7.52TOTAL FLEX 14,773,378 1,499,371 0.8% 66,552 0 0 0 $9.01
MIAMI DADE TOTAL INDUSTRIAL 190,756,488 12,948,093 6.8% 1,740,706 53,000 1 944,623 $7.64
SOUTH FLORIDA COMMERCIAL REAL ESTATE REVIEW | Q4 2012
COLLIERS INTERNATIONAL | P. 9 Contact: Crystal Proenza—[email protected] | Research: Alex Morcate—[email protected]
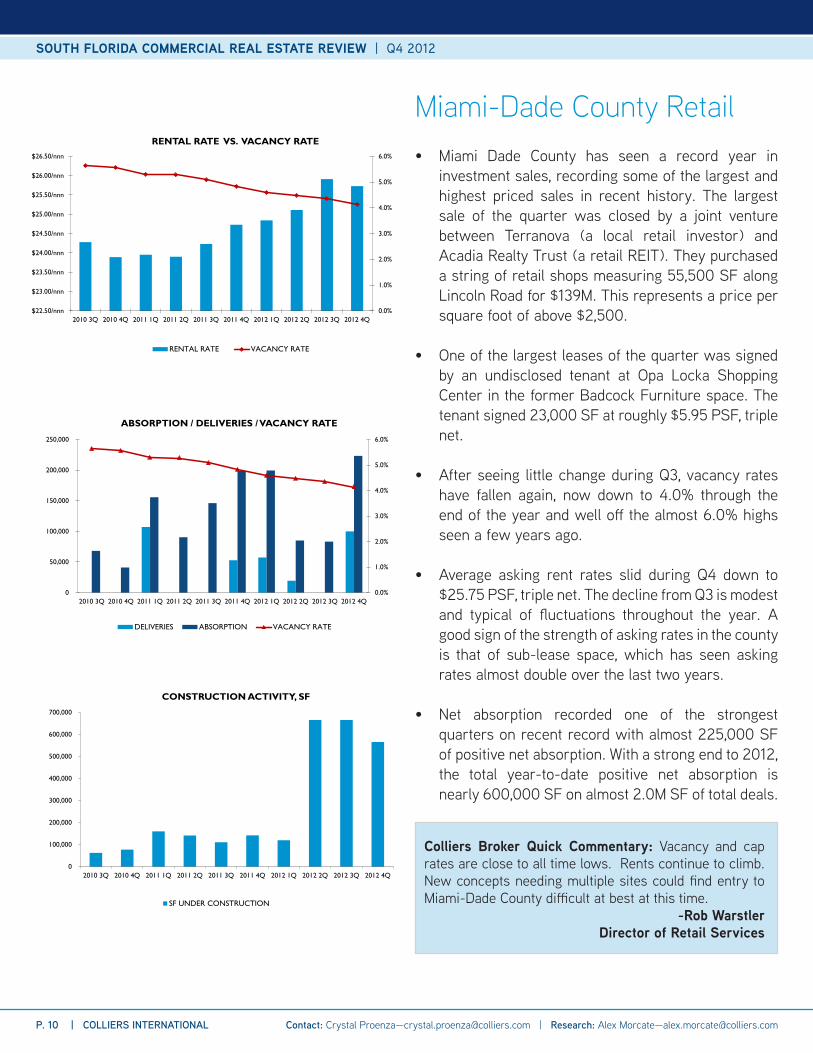
• Miami Dade County has seen a record year in investment sales, recording some of the largest and highest priced sales in recent history. The largest sale of the quarter was closed by a joint venture between Terranova (a local retail investor) and Acadia Realty Trust (a retail REIT). They purchased a string of retail shops measuring 55,500 SF along Lincoln Road for $139M. This represents a price per square foot of above $2,500.
• One of the largest leases of the quarter was signed by an undisclosed tenant at Opa Locka Shopping Center in the former Badcock Furniture space. The tenant signed 23,000 SF at roughly $5.95 PSF, triple net.
• After seeing little change during Q3, vacancy rates have fallen again, now down to 4.0% through the end of the year and well off the almost 6.0% highs seen a few years ago.
• Average asking rent rates slid during Q4 down to $25.75 PSF, triple net. The decline from Q3 is modest and typical of fluctuations throughout the year. A good sign of the strength of asking rates in the county is that of sub-lease space, which has seen asking rates almost double over the last two years.
• Net absorption recorded one of the strongest quarters on recent record with almost 225,000 SF of positive net absorption. With a strong end to 2012, the total year-to-date positive net absorption is nearly 600,000 SF on almost 2.0M SF of total deals.
Miami-Dade County Retail
0.0%
1.0%
2.0%
3.0%
4.0%
5.0%
6.0%
$22.50/nnn
$23.00/nnn
$23.50/nnn
$24.00/nnn
$24.50/nnn
$25.00/nnn
$25.50/nnn
$26.00/nnn
$26.50/nnn
2010 3Q 2010 4Q 2011 1Q 2011 2Q 2011 3Q 2011 4Q 2012 1Q 2012 2Q 2012 3Q 2012 4Q
RENTAL RATE VS. VACANCY RATE
RENTAL RATE VACANCY RATE
0.0%
1.0%
2.0%
3.0%
4.0%
5.0%
6.0%
0
50,000
100,000
150,000
200,000
250,000
2010 3Q 2010 4Q 2011 1Q 2011 2Q 2011 3Q 2011 4Q 2012 1Q 2012 2Q 2012 3Q 2012 4Q
ABSORPTION / DELIVERIES / VACANCY RATE
DELIVERIES ABSORPTION VACANCY RATE
0
100,000
200,000
300,000
400,000
500,000
600,000
700,000
2010 3Q 2010 4Q 2011 1Q 2011 2Q 2011 3Q 2011 4Q 2012 1Q 2012 2Q 2012 3Q 2012 4Q
CONSTRUCTION ACTIVITY, SF
SF UNDER CONSTRUCTION
Colliers Broker Quick Commentary: Vacancy and cap rates are close to all time lows. Rents continue to climb. New concepts needing multiple sites could find entry to Miami-Dade County difficult at best at this time.
-Rob WarstlerDirector of Retail Services
P. 10 | COLLIERS INTERNATIONAL
SOUTH FLORIDA COMMERCIAL REAL ESTATE REVIEW | Q4 2012
Contact: Crystal Proenza—[email protected] | Research: Alex Morcate—[email protected]
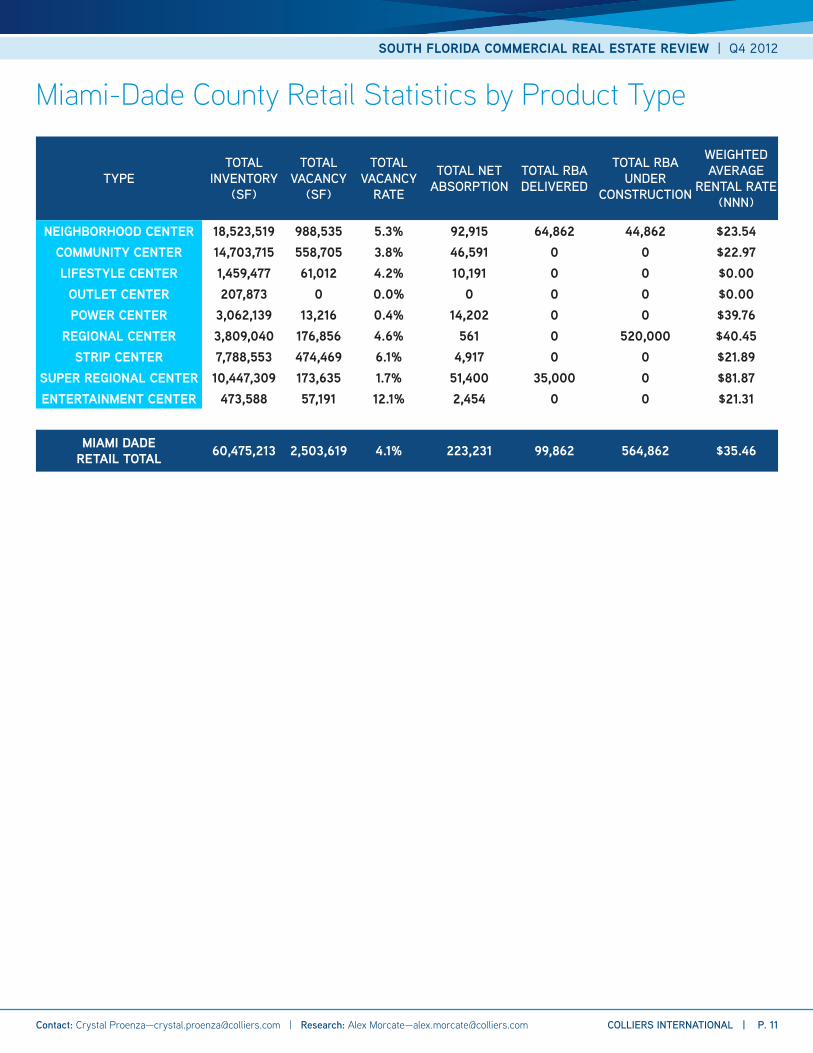
Miami-Dade County Retail Statistics by Product Type
TYPETOTAL
INVENTORY (SF)
TOTAL VACANCY
(SF)
TOTAL VACANCY
RATE
TOTAL NET ABSORPTION
TOTAL RBA DELIVERED
TOTAL RBA UNDER
CONSTRUCTION
WEIGHTED AVERAGE
RENTAL RATE (NNN)
NEIGHBORHOOD CENTER 18,523,519 988,535 5.3% 92,915 64,862 44,862 $23.54COMMUNITY CENTER 14,703,715 558,705 3.8% 46,591 0 0 $22.97LIFESTYLE CENTER 1,459,477 61,012 4.2% 10,191 0 0 $0.00
OUTLET CENTER 207,873 0 0.0% 0 0 0 $0.00POWER CENTER 3,062,139 13,216 0.4% 14,202 0 0 $39.76
REGIONAL CENTER 3,809,040 176,856 4.6% 561 0 520,000 $40.45STRIP CENTER 7,788,553 474,469 6.1% 4,917 0 0 $21.89
SUPER REGIONAL CENTER 10,447,309 173,635 1.7% 51,400 35,000 0 $81.87ENTERTAINMENT CENTER 473,588 57,191 12.1% 2,454 0 0 $21.31
MIAMI DADE RETAIL TOTAL 60,475,213 2,503,619 4.1% 223,231 99,862 564,862 $35.46
SOUTH FLORIDA COMMERCIAL REAL ESTATE REVIEW | Q4 2012
COLLIERS INTERNATIONAL | P. 11 Contact: Crystal Proenza—[email protected] | Research: Alex Morcate—[email protected]
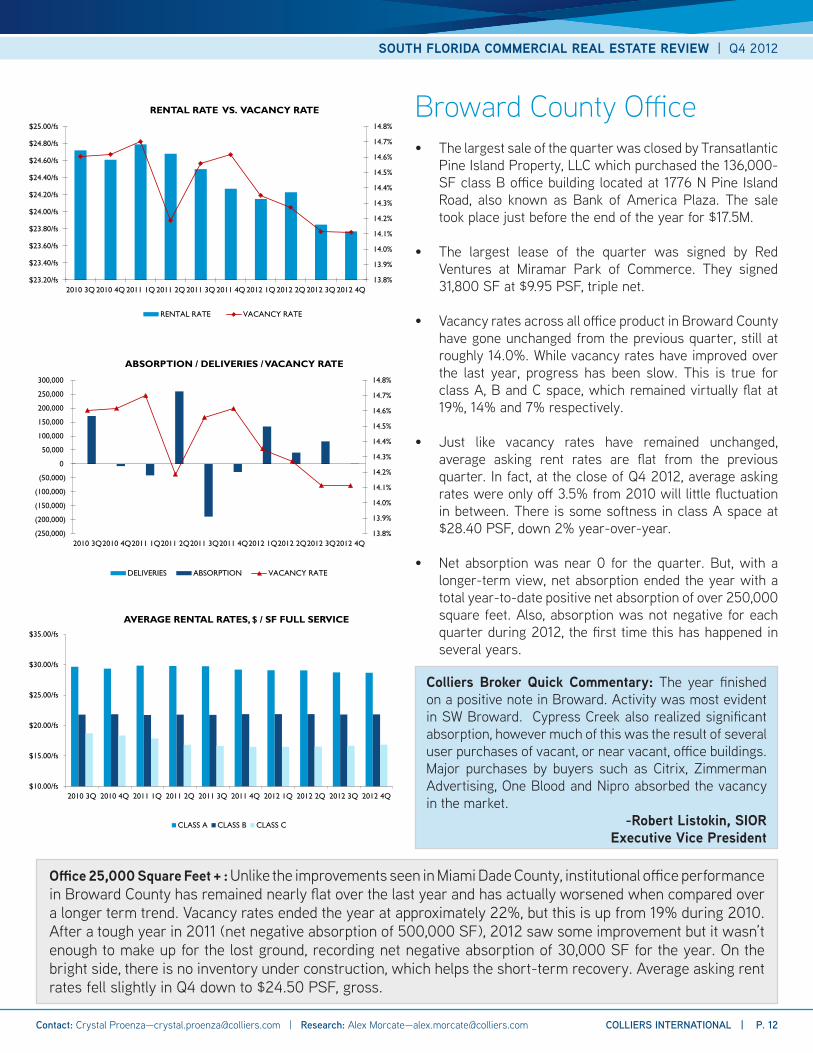
• The largest sale of the quarter was closed by Transatlantic Pine Island Property, LLC which purchased the 136,000- SF class B office building located at 1776 N Pine Island Road, also known as Bank of America Plaza. The sale took place just before the end of the year for $17.5M.
• The largest lease of the quarter was signed by Red Ventures at Miramar Park of Commerce. They signed 31,800 SF at $9.95 PSF, triple net.
• Vacancy rates across all office product in Broward County have gone unchanged from the previous quarter, still at roughly 14.0%. While vacancy rates have improved over the last year, progress has been slow. This is true for class A, B and C space, which remained virtually flat at 19%, 14% and 7% respectively.
• Just like vacancy rates have remained unchanged, average asking rent rates are flat from the previous quarter. In fact, at the close of Q4 2012, average asking rates were only off 3.5% from 2010 will little fluctuation in between. There is some softness in class A space at $28.40 PSF, down 2% year-over-year.
• Net absorption was near 0 for the quarter. But, with a longer-term view, net absorption ended the year with a total year-to-date positive net absorption of over 250,000 square feet. Also, absorption was not negative for each quarter during 2012, the first time this has happened in several years.
Broward County Office
Office 25,000 Square Feet + : Unlike the improvements seen in Miami Dade County, institutional office performance in Broward County has remained nearly flat over the last year and has actually worsened when compared over a longer term trend. Vacancy rates ended the year at approximately 22%, but this is up from 19% during 2010. After a tough year in 2011 (net negative absorption of 500,000 SF), 2012 saw some improvement but it wasn’t enough to make up for the lost ground, recording net negative absorption of 30,000 SF for the year. On the bright side, there is no inventory under construction, which helps the short-term recovery. Average asking rent rates fell slightly in Q4 down to $24.50 PSF, gross.
13.8%
13.9%
14.0%
14.1%
14.2%
14.3%
14.4%
14.5%
14.6%
14.7%
14.8%
$23.20/fs
$23.40/fs
$23.60/fs
$23.80/fs
$24.00/fs
$24.20/fs
$24.40/fs
$24.60/fs
$24.80/fs
$25.00/fs
2010 3Q 2010 4Q 2011 1Q 2011 2Q 2011 3Q 2011 4Q 2012 1Q 2012 2Q 2012 3Q 2012 4Q
RENTAL RATE VS. VACANCY RATE
RENTAL RATE VACANCY RATE
13.8%
13.9%
14.0%
14.1%
14.2%
14.3%
14.4%
14.5%
14.6%
14.7%
14.8%
(250,000)
(200,000)
(150,000)
(100,000)
(50,000)
0
50,000
100,000
150,000
200,000
250,000
300,000
2010 3Q2010 4Q2011 1Q2011 2Q2011 3Q2011 4Q2012 1Q2012 2Q2012 3Q2012 4Q
ABSORPTION / DELIVERIES / VACANCY RATE
DELIVERIES ABSORPTION VACANCY RATE
$10.00/fs
$15.00/fs
$20.00/fs
$25.00/fs
$30.00/fs
$35.00/fs
2010 3Q 2010 4Q 2011 1Q 2011 2Q 2011 3Q 2011 4Q 2012 1Q 2012 2Q 2012 3Q 2012 4Q
AVERAGE RENTAL RATES, $ / SF FULL SERVICE
CLASS A CLASS B CLASS C
Colliers Broker Quick Commentary: The year finished on a positive note in Broward. Activity was most evident in SW Broward. Cypress Creek also realized significant absorption, however much of this was the result of several user purchases of vacant, or near vacant, office buildings. Major purchases by buyers such as Citrix, Zimmerman Advertising, One Blood and Nipro absorbed the vacancy in the market.
-Robert Listokin, SIORExecutive Vice President
SOUTH FLORIDA COMMERCIAL REAL ESTATE REVIEW | Q4 2012
COLLIERS INTERNATIONAL | P. 12 Contact: Crystal Proenza—[email protected] | Research: Alex Morcate—[email protected]
Broward County Office Submarket Statistics
continued on the next page...
CLASSTOTAL
INVENTORY (SF)
% OF SUBMARKET
RBA
TOTAL VACANCY
(SF)
TOTAL VACANCY
RATE
TOTAL NET ABSORPTION
TOTAL RBA DELIVERED
TOTAL RBA UNDER
CONSTRUCTION
WEIGHTED AVERAGE RENTAL
RATE (FULL SERVICE)
COMMERCIAL CORRIDORCLASS A 52,000 2.5% 23,743 45.7% 1,190 0 0 $16.46CLASS B 1,191,738 58.4% 177,793 14.9% 4,351 0 0 $16.87CLASS C 797,246 39.1% 68,301 8.6% -4,220 0 0 $15.34
SUBTOTAL 2,040,984 100.0% 269,837 13.2% 1,321 0 0 $16.26CYPRESS CREEK
CLASS A 1,204,462 26.5% 246,775 20.5% 25,255 0 0 $26.96CLASS B 2,462,707 54.1% 455,431 18.5% 6,933 0 0 $20.63CLASS C 883,963 19.4% 116,656 13.2% 1,571 0 0 $14.13
SUBTOTAL 4,551,132 100.0% 818,862 18.0% 33,759 0 0 $21.04CBD / DOWNTOWN FT. LAUDERDALE
CLASS A 4,454,238 55.6% 947,385 21.3% 1,229 0 0 $31.36CLASS B 2,166,579 27.1% 297,130 13.7% 7,130 0 0 $24.52CLASS C 1,383,990 17.3% 62,514 4.5% 4,175 0 0 $19.13
SUBTOTAL 8,004,807 100.0% 1,307,029 16.3% 12,534 0 0 $27.39FT. LAUDERDALE
CLASS A 399,254 8.8% 117,005 29.3% -2,564 0 0 $25.82CLASS B 2,867,820 63.1% 478,603 16.7% -44,765 0 0 $24.31CLASS C 1,276,925 28.1% 119,907 9.4% -6,213 0 0 $16.45
SUBTOTAL 4,543,999 100.0% 715,515 15.7% -53,542 0 0 $22.23HOLLYWOOD
CLASS A 335,037 8.8% 27,011 8.1% 7,727 0 0 $30.69CLASS B 1,720,468 45.0% 238,674 13.9% 10,759 0 0 $24.41CLASS C 1,770,590 46.3% 76,578 4.3% 19,869 0 0 $16.53
SUBTOTAL 3,826,095 100.0% 342,263 8.9% 38,355 0 0 $21.31NE BROWARD / DEERFIELD BEACH
CLASS A 357,676 12.2% 151,665 42.4% 5,661 0 0 $25.08CLASS B 2,077,682 71.1% 259,210 12.5% 138 0 0 $19.25CLASS C 487,351 16.7% 38,440 7.9% -602 0 0 $16.80
SUBTOTAL 2,922,709 100.0% 449,315 15.4% 5,197 0 0 $19.55NW BROWARD / CORAL SPRINGS
CLASS A 819,563 20.6% 255,904 31.2% -34,321 0 0 $25.61CLASS B 2,086,239 52.4% 315,559 15.1% 13,520 0 0 $21.66CLASS C 1,077,068 27.0% 51,124 4.7% 1,222 0 0 $17.09
SUBTOTAL 3,982,870 100.0% 622,587 15.6% -19,579 0 0 $21.24
P. 13 | COLLIERS INTERNATIONAL
SOUTH FLORIDA COMMERCIAL REAL ESTATE REVIEW | Q4 2012
Contact: Crystal Proenza—[email protected] | Research: Alex Morcate—[email protected]
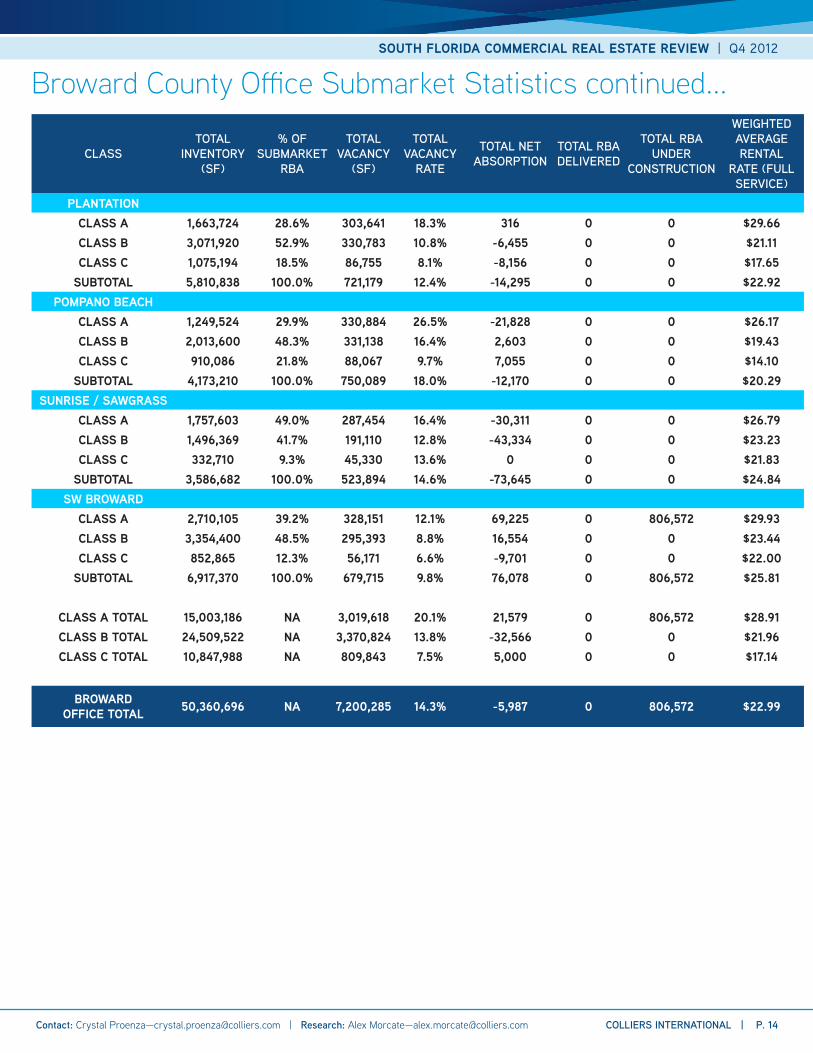
Broward County Office Submarket Statistics continued...
CLASSTOTAL
INVENTORY (SF)
% OF SUBMARKET
RBA
TOTAL VACANCY
(SF)
TOTAL VACANCY
RATE
TOTAL NET ABSORPTION
TOTAL RBA DELIVERED
TOTAL RBA UNDER
CONSTRUCTION
WEIGHTED AVERAGE RENTAL
RATE (FULL SERVICE)
PLANTATIONCLASS A 1,663,724 28.6% 303,641 18.3% 316 0 0 $29.66CLASS B 3,071,920 52.9% 330,783 10.8% -6,455 0 0 $21.11CLASS C 1,075,194 18.5% 86,755 8.1% -8,156 0 0 $17.65
SUBTOTAL 5,810,838 100.0% 721,179 12.4% -14,295 0 0 $22.92POMPANO BEACH
CLASS A 1,249,524 29.9% 330,884 26.5% -21,828 0 0 $26.17CLASS B 2,013,600 48.3% 331,138 16.4% 2,603 0 0 $19.43CLASS C 910,086 21.8% 88,067 9.7% 7,055 0 0 $14.10
SUBTOTAL 4,173,210 100.0% 750,089 18.0% -12,170 0 0 $20.29SUNRISE / SAWGRASS
CLASS A 1,757,603 49.0% 287,454 16.4% -30,311 0 0 $26.79CLASS B 1,496,369 41.7% 191,110 12.8% -43,334 0 0 $23.23CLASS C 332,710 9.3% 45,330 13.6% 0 0 0 $21.83
SUBTOTAL 3,586,682 100.0% 523,894 14.6% -73,645 0 0 $24.84SW BROWARD
CLASS A 2,710,105 39.2% 328,151 12.1% 69,225 0 806,572 $29.93CLASS B 3,354,400 48.5% 295,393 8.8% 16,554 0 0 $23.44CLASS C 852,865 12.3% 56,171 6.6% -9,701 0 0 $22.00
SUBTOTAL 6,917,370 100.0% 679,715 9.8% 76,078 0 806,572 $25.81
CLASS A TOTAL 15,003,186 NA 3,019,618 20.1% 21,579 0 806,572 $28.91CLASS B TOTAL 24,509,522 NA 3,370,824 13.8% -32,566 0 0 $21.96CLASS C TOTAL 10,847,988 NA 809,843 7.5% 5,000 0 0 $17.14
BROWARD OFFICE TOTAL 50,360,696 NA 7,200,285 14.3% -5,987 0 806,572 $22.99
SOUTH FLORIDA COMMERCIAL REAL ESTATE REVIEW | Q4 2012
COLLIERS INTERNATIONAL | P. 14 Contact: Crystal Proenza—[email protected] | Research: Alex Morcate—[email protected]
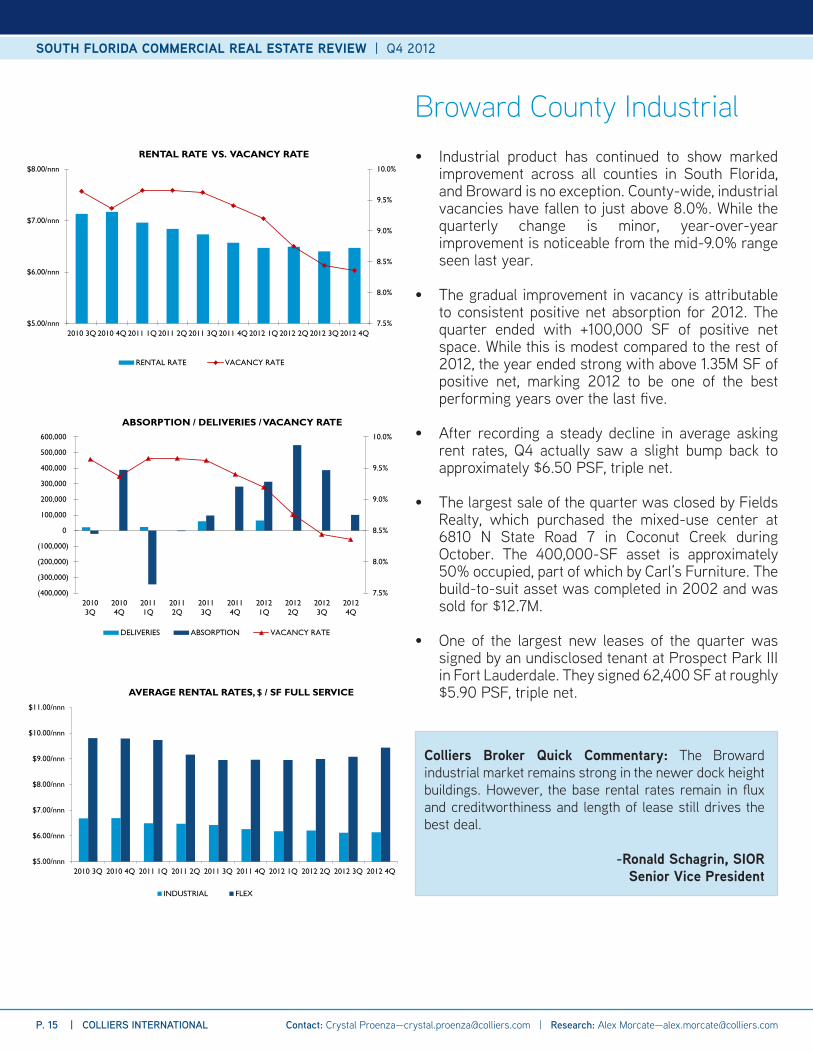
• Industrial product has continued to show marked improvement across all counties in South Florida, and Broward is no exception. County-wide, industrial vacancies have fallen to just above 8.0%. While the quarterly change is minor, year-over-year improvement is noticeable from the mid-9.0% range seen last year.
• The gradual improvement in vacancy is attributable to consistent positive net absorption for 2012. The quarter ended with +100,000 SF of positive net space. While this is modest compared to the rest of 2012, the year ended strong with above 1.35M SF of positive net, marking 2012 to be one of the best performing years over the last five.
• After recording a steady decline in average asking rent rates, Q4 actually saw a slight bump back to approximately $6.50 PSF, triple net.
• The largest sale of the quarter was closed by Fields Realty, which purchased the mixed-use center at 6810 N State Road 7 in Coconut Creek during October. The 400,000-SF asset is approximately 50% occupied, part of which by Carl’s Furniture. The build-to-suit asset was completed in 2002 and was sold for $12.7M.
• One of the largest new leases of the quarter was signed by an undisclosed tenant at Prospect Park III in Fort Lauderdale. They signed 62,400 SF at roughly $5.90 PSF, triple net.
Broward County Industrial
7.5%
8.0%
8.5%
9.0%
9.5%
10.0%
$5.00/nnn
$6.00/nnn
$7.00/nnn
$8.00/nnn
2010 3Q 2010 4Q 2011 1Q 2011 2Q 2011 3Q 2011 4Q 2012 1Q 2012 2Q 2012 3Q 2012 4Q
RENTAL RATE VS. VACANCY RATE
RENTAL RATE VACANCY RATE
7.5%
8.0%
8.5%
9.0%
9.5%
10.0%
(400,000)
(300,000)
(200,000)
(100,000)
0
100,000
200,000
300,000
400,000
500,000
600,000
20103Q
20104Q
20111Q
20112Q
20113Q
20114Q
20121Q
20122Q
20123Q
20124Q
ABSORPTION / DELIVERIES / VACANCY RATE
DELIVERIES ABSORPTION VACANCY RATE
$5.00/nnn
$6.00/nnn
$7.00/nnn
$8.00/nnn
$9.00/nnn
$10.00/nnn
$11.00/nnn
2010 3Q 2010 4Q 2011 1Q 2011 2Q 2011 3Q 2011 4Q 2012 1Q 2012 2Q 2012 3Q 2012 4Q
AVERAGE RENTAL RATES, $ / SF FULL SERVICE
INDUSTRIAL FLEX
Colliers Broker Quick Commentary: The Broward industrial market remains strong in the newer dock height buildings. However, the base rental rates remain in flux and creditworthiness and length of lease still drives the best deal.
-Ronald Schagrin, SIORSenior Vice President
P. 15 | COLLIERS INTERNATIONAL
SOUTH FLORIDA COMMERCIAL REAL ESTATE REVIEW | Q4 2012
Contact: Crystal Proenza—[email protected] | Research: Alex Morcate—[email protected]

Broward County Industrial Submarket Statistics
TYPETOTAL
INVENTORY (SF)
TOTAL VACANCY
(SF)
TOTAL VACANCY
RATE
TOTAL NET ABSORPTION
TOTAL RBA DELIVERED
TOTAL RBA UNDER
CONSTRUCTION
WEIGHTED AVERAGE
RENTAL RATE (NNN)
CENTRAL BROWARDINDUSTRIAL 12,388,555 1,007,941 8.1% 64,856 0 0 $5.26
FLEX 1,401,310 128,262 9.2% -25,852 0 0 $8.73SUBTOTAL 13,789,865 1,136,203 8.2% 39,004 0 0 $5.61
NORTH BROWARDINDUSTRIAL 36,091,167 3,744,096 10.4% 55,084 0 0 $5.93
FLEX 4,491,343 697,596 15.5% -10,804 0 0 $8.71SUBTOTAL 40,582,510 4,441,692 10.9% 44,280 0 0 $6.24
SE BROWARDINDUSTRIAL 19,960,498 1,068,497 5.4% 22,430 0 0 $5.90
FLEX 2,434,268 124,992 5.1% 16,197 0 0 $10.39SUBTOTAL 22,394,766 1,193,489 5.3% 38,627 0 0 $6.39
SW BROWARDINDUSTRIAL 14,725,903 1,191,797 8.1% 15,370 0 351,614 $6.83
FLEX 2,890,184 258,398 8.9% 6,590 0 0 $9.31SUBTOTAL 17,616,087 1,450,195 8.2% 21,960 0 351,614 $7.24
WEST BROWARDINDUSTRIAL 13,815,487 1,093,187 7.9% 8,410 0 0 $6.13
FLEX 3,052,900 478,413 15.7% -16,006 0 0 $9.35SUBTOTAL 16,868,387 1,571,600 9.3% -7,596 0 0 $6.71
TOTAL INDUSTRIAL 96,981,610 8,105,518 7.3% 166,150 0 351,614 $6.00TOTAL FLEX 14,270,005 1,687,661 1.5% -29,875 0 0 $9.26
BROWARD INDUSTRIAL TOTAL 111,251,615 9,793,179 8.8% 136,275 0 351,614 $6.42
SOUTH FLORIDA COMMERCIAL REAL ESTATE REVIEW | Q4 2012
COLLIERS INTERNATIONAL | P. 16 Contact: Crystal Proenza—[email protected] | Research: Alex Morcate—[email protected]
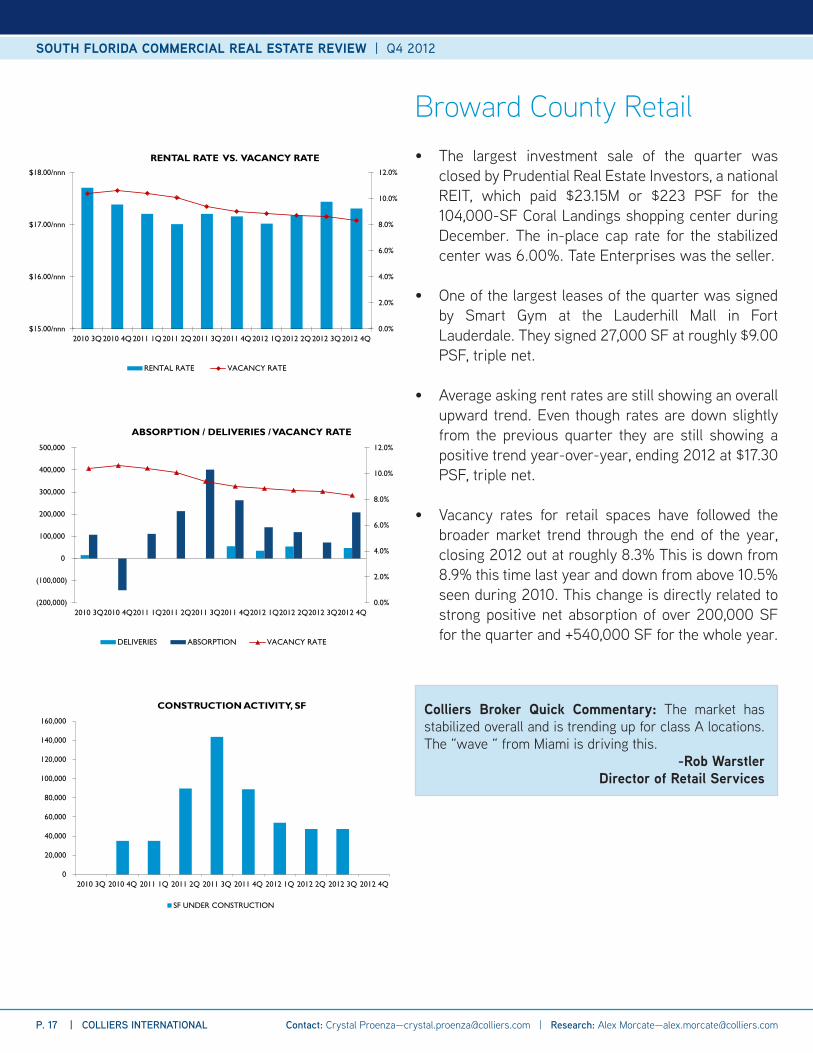
• The largest investment sale of the quarter was closed by Prudential Real Estate Investors, a national REIT, which paid $23.15M or $223 PSF for the 104,000-SF Coral Landings shopping center during December. The in-place cap rate for the stabilized center was 6.00%. Tate Enterprises was the seller.
• One of the largest leases of the quarter was signed by Smart Gym at the Lauderhill Mall in Fort Lauderdale. They signed 27,000 SF at roughly $9.00 PSF, triple net.
• Average asking rent rates are still showing an overall upward trend. Even though rates are down slightly from the previous quarter they are still showing a positive trend year-over-year, ending 2012 at $17.30 PSF, triple net.
• Vacancy rates for retail spaces have followed the broader market trend through the end of the year, closing 2012 out at roughly 8.3% This is down from 8.9% this time last year and down from above 10.5% seen during 2010. This change is directly related to strong positive net absorption of over 200,000 SF for the quarter and +540,000 SF for the whole year.
Broward County Retail
0.0%
2.0%
4.0%
6.0%
8.0%
10.0%
12.0%
$15.00/nnn
$16.00/nnn
$17.00/nnn
$18.00/nnn
2010 3Q 2010 4Q 2011 1Q 2011 2Q 2011 3Q 2011 4Q 2012 1Q 2012 2Q 2012 3Q 2012 4Q
RENTAL RATE VS. VACANCY RATE
RENTAL RATE VACANCY RATE
0.0%
2.0%
4.0%
6.0%
8.0%
10.0%
12.0%
(200,000)
(100,000)
0
100,000
200,000
300,000
400,000
500,000
2010 3Q2010 4Q2011 1Q2011 2Q2011 3Q2011 4Q2012 1Q2012 2Q2012 3Q2012 4Q
ABSORPTION / DELIVERIES / VACANCY RATE
DELIVERIES ABSORPTION VACANCY RATE
0
20,000
40,000
60,000
80,000
100,000
120,000
140,000
160,000
2010 3Q 2010 4Q 2011 1Q 2011 2Q 2011 3Q 2011 4Q 2012 1Q 2012 2Q 2012 3Q 2012 4Q
CONSTRUCTION ACTIVITY, SF
SF UNDER CONSTRUCTION
Colliers Broker Quick Commentary: The market has stabilized overall and is trending up for class A locations. The “wave “ from Miami is driving this.
-Rob WarstlerDirector of Retail Services
P. 17 | COLLIERS INTERNATIONAL
SOUTH FLORIDA COMMERCIAL REAL ESTATE REVIEW | Q4 2012
Contact: Crystal Proenza—[email protected] | Research: Alex Morcate—[email protected]
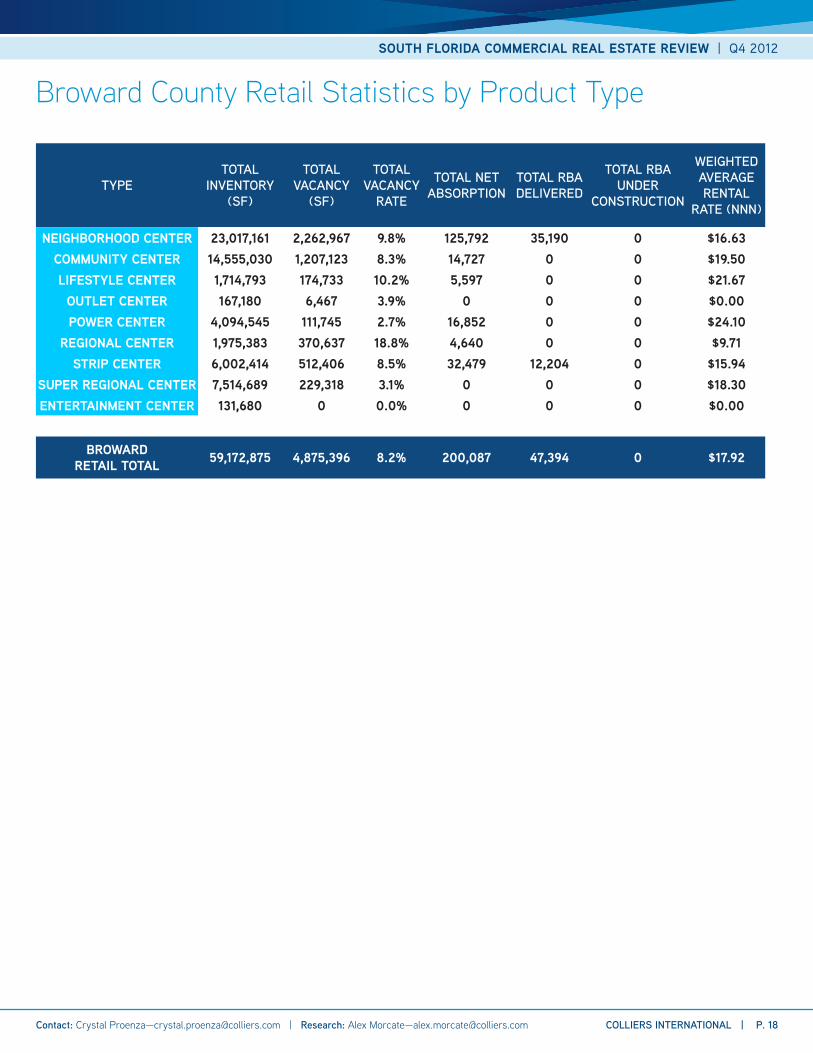
Broward County Retail Statistics by Product Type
TYPETOTAL
INVENTORY (SF)
TOTAL VACANCY
(SF)
TOTAL VACANCY
RATE
TOTAL NET ABSORPTION
TOTAL RBA DELIVERED
TOTAL RBA UNDER
CONSTRUCTION
WEIGHTED AVERAGE RENTAL
RATE (NNN)
NEIGHBORHOOD CENTER 23,017,161 2,262,967 9.8% 125,792 35,190 0 $16.63COMMUNITY CENTER 14,555,030 1,207,123 8.3% 14,727 0 0 $19.50LIFESTYLE CENTER 1,714,793 174,733 10.2% 5,597 0 0 $21.67
OUTLET CENTER 167,180 6,467 3.9% 0 0 0 $0.00POWER CENTER 4,094,545 111,745 2.7% 16,852 0 0 $24.10
REGIONAL CENTER 1,975,383 370,637 18.8% 4,640 0 0 $9.71STRIP CENTER 6,002,414 512,406 8.5% 32,479 12,204 0 $15.94
SUPER REGIONAL CENTER 7,514,689 229,318 3.1% 0 0 0 $18.30ENTERTAINMENT CENTER 131,680 0 0.0% 0 0 0 $0.00
BROWARD RETAIL TOTAL 59,172,875 4,875,396 8.2% 200,087 47,394 0 $17.92
SOUTH FLORIDA COMMERCIAL REAL ESTATE REVIEW | Q4 2012
COLLIERS INTERNATIONAL | P. 18 Contact: Crystal Proenza—[email protected] | Research: Alex Morcate—[email protected]
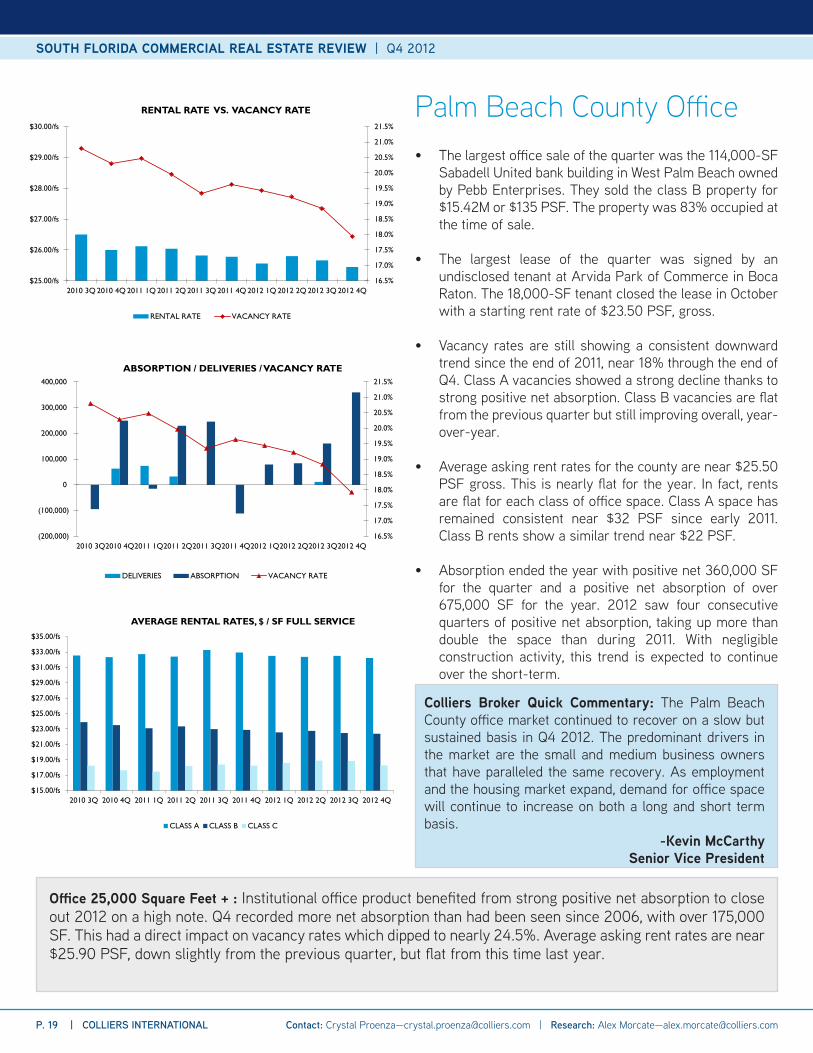
• The largest office sale of the quarter was the 114,000-SF Sabadell United bank building in West Palm Beach owned by Pebb Enterprises. They sold the class B property for $15.42M or $135 PSF. The property was 83% occupied at the time of sale.
• The largest lease of the quarter was signed by an undisclosed tenant at Arvida Park of Commerce in Boca Raton. The 18,000-SF tenant closed the lease in October with a starting rent rate of $23.50 PSF, gross.
• Vacancy rates are still showing a consistent downward trend since the end of 2011, near 18% through the end of Q4. Class A vacancies showed a strong decline thanks to strong positive net absorption. Class B vacancies are flat from the previous quarter but still improving overall, year- over-year.
• Average asking rent rates for the county are near $25.50 PSF gross. This is nearly flat for the year. In fact, rents are flat for each class of office space. Class A space has remained consistent near $32 PSF since early 2011. Class B rents show a similar trend near $22 PSF.
• Absorption ended the year with positive net 360,000 SF for the quarter and a positive net absorption of over 675,000 SF for the year. 2012 saw four consecutive quarters of positive net absorption, taking up more than double the space than during 2011. With negligible construction activity, this trend is expected to continue over the short-term.
Palm Beach County Office
Office 25,000 Square Feet + : Institutional office product benefited from strong positive net absorption to close out 2012 on a high note. Q4 recorded more net absorption than had been seen since 2006, with over 175,000 SF. This had a direct impact on vacancy rates which dipped to nearly 24.5%. Average asking rent rates are near $25.90 PSF, down slightly from the previous quarter, but flat from this time last year.
16.5%
17.0%
17.5%
18.0%
18.5%
19.0%
19.5%
20.0%
20.5%
21.0%
21.5%
$25.00/fs
$26.00/fs
$27.00/fs
$28.00/fs
$29.00/fs
$30.00/fs
2010 3Q 2010 4Q 2011 1Q 2011 2Q 2011 3Q 2011 4Q 2012 1Q 2012 2Q 2012 3Q 2012 4Q
RENTAL RATE VS. VACANCY RATE
RENTAL RATE VACANCY RATE
16.5%
17.0%
17.5%
18.0%
18.5%
19.0%
19.5%
20.0%
20.5%
21.0%
21.5%
(200,000)
(100,000)
0
100,000
200,000
300,000
400,000
2010 3Q2010 4Q2011 1Q2011 2Q2011 3Q2011 4Q2012 1Q2012 2Q2012 3Q2012 4Q
ABSORPTION / DELIVERIES / VACANCY RATE
DELIVERIES ABSORPTION VACANCY RATE
$15.00/fs
$17.00/fs
$19.00/fs
$21.00/fs
$23.00/fs
$25.00/fs
$27.00/fs
$29.00/fs
$31.00/fs
$33.00/fs
$35.00/fs
2010 3Q 2010 4Q 2011 1Q 2011 2Q 2011 3Q 2011 4Q 2012 1Q 2012 2Q 2012 3Q 2012 4Q
AVERAGE RENTAL RATES, $ / SF FULL SERVICE
CLASS A CLASS B CLASS C
Colliers Broker Quick Commentary: The Palm Beach County office market continued to recover on a slow but sustained basis in Q4 2012. The predominant drivers in the market are the small and medium business owners that have paralleled the same recovery. As employment and the housing market expand, demand for office space will continue to increase on both a long and short term basis.
-Kevin McCarthySenior Vice President
P. 19 | COLLIERS INTERNATIONAL
SOUTH FLORIDA COMMERCIAL REAL ESTATE REVIEW | Q4 2012
Contact: Crystal Proenza—[email protected] | Research: Alex Morcate—[email protected]
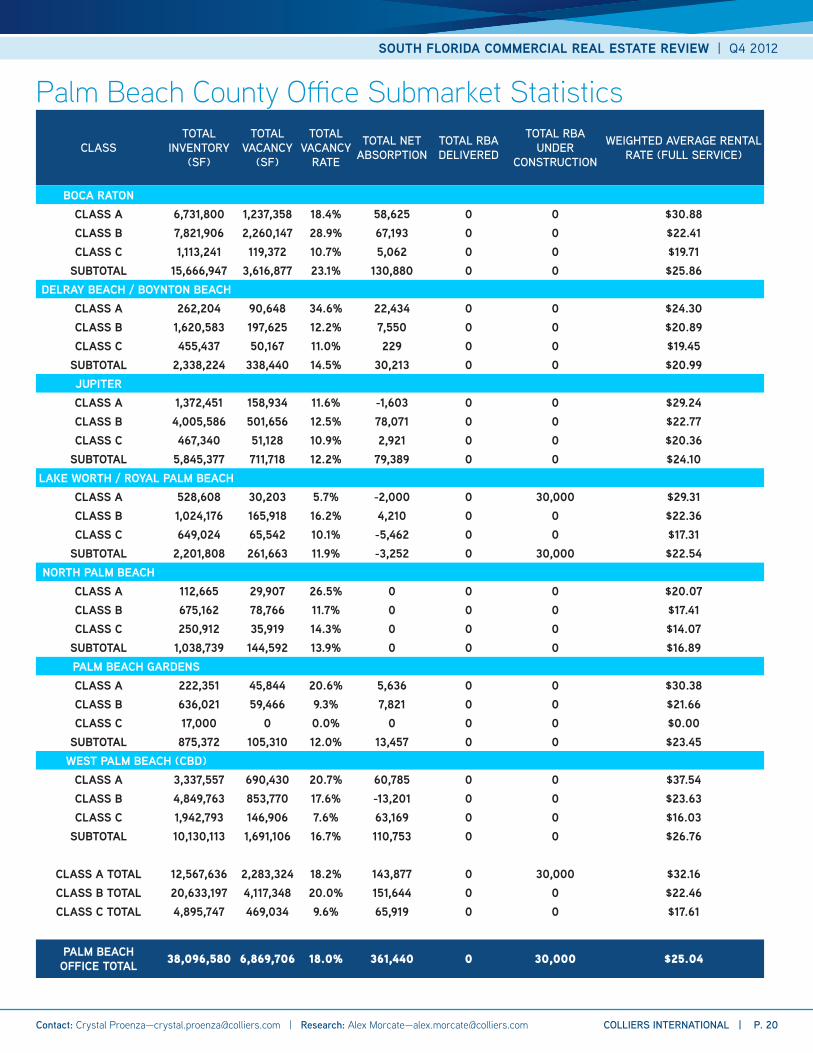
Palm Beach County Office Submarket Statistics
CLASSTOTAL
INVENTORY (SF)
TOTAL VACANCY
(SF)
TOTAL VACANCY
RATE
TOTAL NET ABSORPTION
TOTAL RBA DELIVERED
TOTAL RBA UNDER
CONSTRUCTION
WEIGHTED AVERAGE RENTAL RATE (FULL SERVICE)
BOCA RATONCLASS A 6,731,800 1,237,358 18.4% 58,625 0 0 $30.88CLASS B 7,821,906 2,260,147 28.9% 67,193 0 0 $22.41CLASS C 1,113,241 119,372 10.7% 5,062 0 0 $19.71
SUBTOTAL 15,666,947 3,616,877 23.1% 130,880 0 0 $25.86DELRAY BEACH / BOYNTON BEACH
CLASS A 262,204 90,648 34.6% 22,434 0 0 $24.30CLASS B 1,620,583 197,625 12.2% 7,550 0 0 $20.89CLASS C 455,437 50,167 11.0% 229 0 0 $19.45
SUBTOTAL 2,338,224 338,440 14.5% 30,213 0 0 $20.99JUPITERCLASS A 1,372,451 158,934 11.6% -1,603 0 0 $29.24CLASS B 4,005,586 501,656 12.5% 78,071 0 0 $22.77CLASS C 467,340 51,128 10.9% 2,921 0 0 $20.36
SUBTOTAL 5,845,377 711,718 12.2% 79,389 0 0 $24.10LAKE WORTH / ROYAL PALM BEACH
CLASS A 528,608 30,203 5.7% -2,000 0 30,000 $29.31CLASS B 1,024,176 165,918 16.2% 4,210 0 0 $22.36CLASS C 649,024 65,542 10.1% -5,462 0 0 $17.31
SUBTOTAL 2,201,808 261,663 11.9% -3,252 0 30,000 $22.54NORTH PALM BEACH
CLASS A 112,665 29,907 26.5% 0 0 0 $20.07CLASS B 675,162 78,766 11.7% 0 0 0 $17.41CLASS C 250,912 35,919 14.3% 0 0 0 $14.07
SUBTOTAL 1,038,739 144,592 13.9% 0 0 0 $16.89PALM BEACH GARDENSCLASS A 222,351 45,844 20.6% 5,636 0 0 $30.38CLASS B 636,021 59,466 9.3% 7,821 0 0 $21.66CLASS C 17,000 0 0.0% 0 0 0 $0.00
SUBTOTAL 875,372 105,310 12.0% 13,457 0 0 $23.45WEST PALM BEACH (CBD)
CLASS A 3,337,557 690,430 20.7% 60,785 0 0 $37.54CLASS B 4,849,763 853,770 17.6% -13,201 0 0 $23.63CLASS C 1,942,793 146,906 7.6% 63,169 0 0 $16.03
SUBTOTAL 10,130,113 1,691,106 16.7% 110,753 0 0 $26.76
CLASS A TOTAL 12,567,636 2,283,324 18.2% 143,877 0 30,000 $32.16CLASS B TOTAL 20,633,197 4,117,348 20.0% 151,644 0 0 $22.46CLASS C TOTAL 4,895,747 469,034 9.6% 65,919 0 0 $17.61
PALM BEACH OFFICE TOTAL 38,096,580 6,869,706 18.0% 361,440 0 30,000 $25.04
SOUTH FLORIDA COMMERCIAL REAL ESTATE REVIEW | Q4 2012
COLLIERS INTERNATIONAL | P. 20 Contact: Crystal Proenza—[email protected] | Research: Alex Morcate—[email protected]
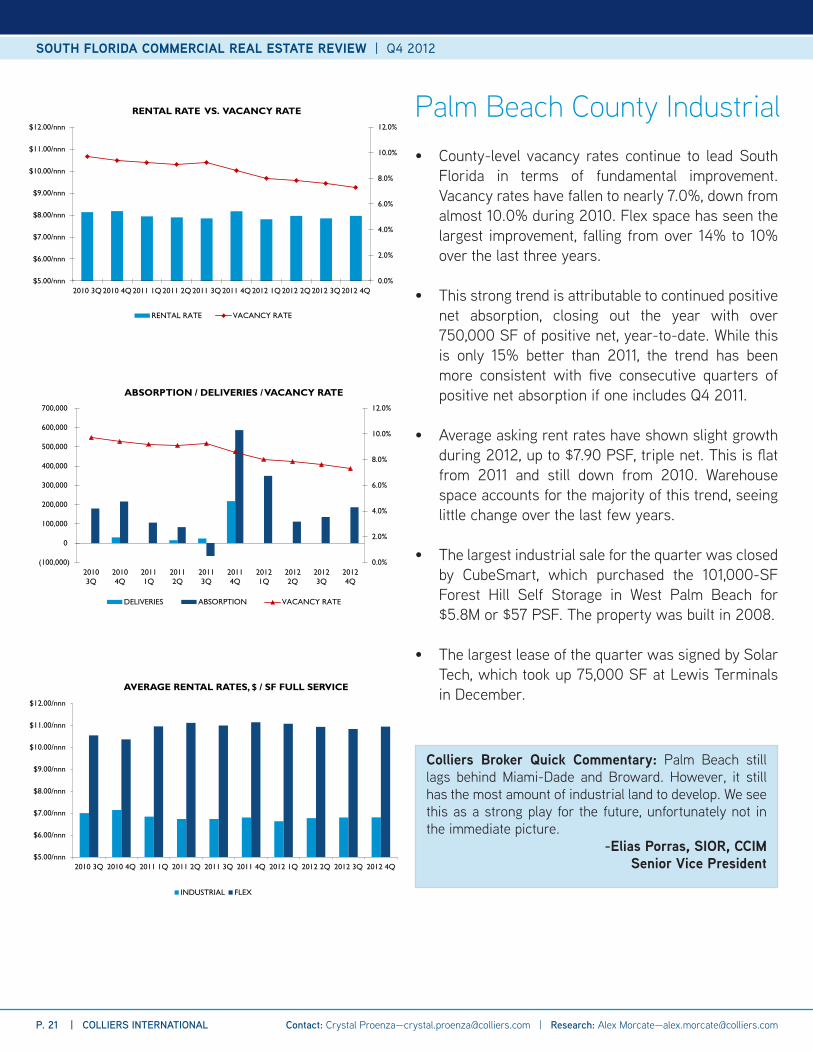
• County-level vacancy rates continue to lead South Florida in terms of fundamental improvement. Vacancy rates have fallen to nearly 7.0%, down from almost 10.0% during 2010. Flex space has seen the largest improvement, falling from over 14% to 10% over the last three years.
• This strong trend is attributable to continued positive net absorption, closing out the year with over 750,000 SF of positive net, year-to-date. While this is only 15% better than 2011, the trend has been more consistent with five consecutive quarters of positive net absorption if one includes Q4 2011.
• Average asking rent rates have shown slight growth during 2012, up to $7.90 PSF, triple net. This is flat from 2011 and still down from 2010. Warehouse space accounts for the majority of this trend, seeing little change over the last few years.
• The largest industrial sale for the quarter was closed by CubeSmart, which purchased the 101,000-SF Forest Hill Self Storage in West Palm Beach for $5.8M or $57 PSF. The property was built in 2008.
• The largest lease of the quarter was signed by Solar Tech, which took up 75,000 SF at Lewis Terminals in December.
Palm Beach County Industrial
0.0%
2.0%
4.0%
6.0%
8.0%
10.0%
12.0%
$5.00/nnn
$6.00/nnn
$7.00/nnn
$8.00/nnn
$9.00/nnn
$10.00/nnn
$11.00/nnn
$12.00/nnn
2010 3Q2010 4Q2011 1Q2011 2Q2011 3Q2011 4Q2012 1Q2012 2Q2012 3Q2012 4Q
RENTAL RATE VS. VACANCY RATE
RENTAL RATE VACANCY RATE
0.0%
2.0%
4.0%
6.0%
8.0%
10.0%
12.0%
(100,000)
0
100,000
200,000
300,000
400,000
500,000
600,000
700,000
20103Q
20104Q
20111Q
20112Q
20113Q
20114Q
20121Q
20122Q
20123Q
20124Q
ABSORPTION / DELIVERIES / VACANCY RATE
DELIVERIES ABSORPTION VACANCY RATE
$5.00/nnn
$6.00/nnn
$7.00/nnn
$8.00/nnn
$9.00/nnn
$10.00/nnn
$11.00/nnn
$12.00/nnn
2010 3Q 2010 4Q 2011 1Q 2011 2Q 2011 3Q 2011 4Q 2012 1Q 2012 2Q 2012 3Q 2012 4Q
AVERAGE RENTAL RATES, $ / SF FULL SERVICE
INDUSTRIAL FLEX
Colliers Broker Quick Commentary: Palm Beach still lags behind Miami-Dade and Broward. However, it still has the most amount of industrial land to develop. We see this as a strong play for the future, unfortunately not in the immediate picture.
-Elias Porras, SIOR, CCIMSenior Vice President
P. 21 | COLLIERS INTERNATIONAL
SOUTH FLORIDA COMMERCIAL REAL ESTATE REVIEW | Q4 2012
Contact: Crystal Proenza—[email protected] | Research: Alex Morcate—[email protected]
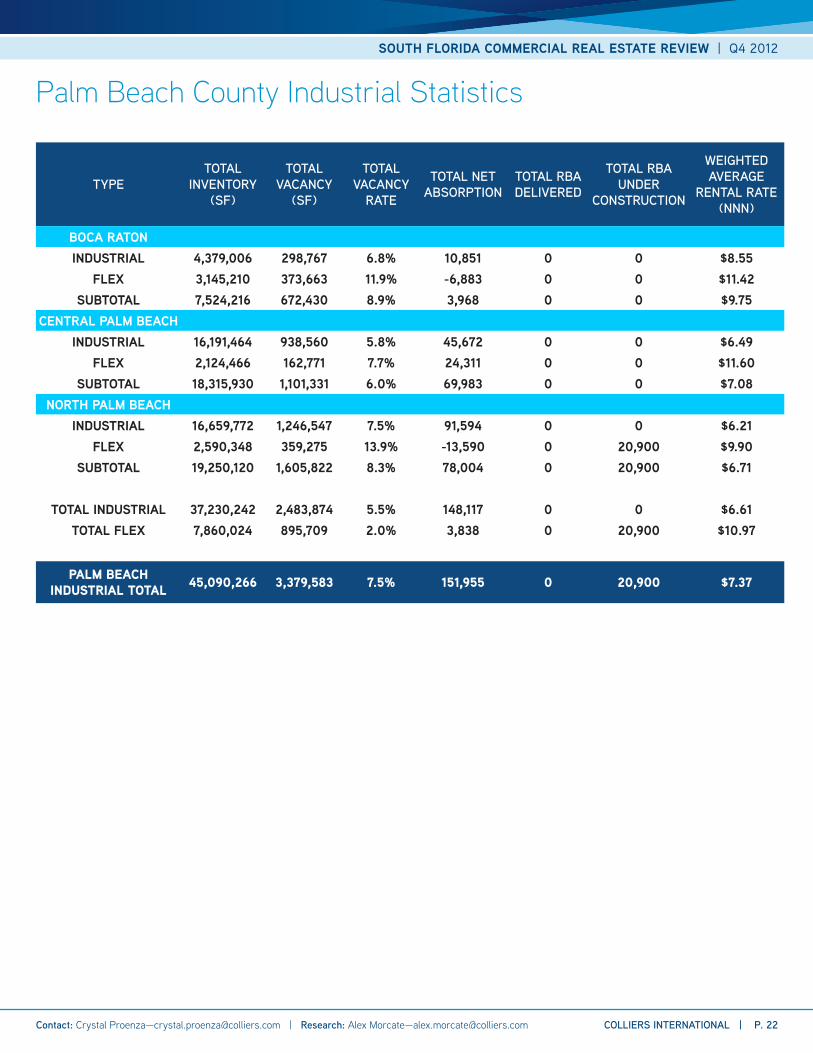
Palm Beach County Industrial Statistics
TYPETOTAL
INVENTORY (SF)
TOTAL VACANCY
(SF)
TOTAL VACANCY
RATE
TOTAL NET ABSORPTION
TOTAL RBA DELIVERED
TOTAL RBA UNDER
CONSTRUCTION
WEIGHTED AVERAGE
RENTAL RATE (NNN)
BOCA RATONINDUSTRIAL 4,379,006 298,767 6.8% 10,851 0 0 $8.55
FLEX 3,145,210 373,663 11.9% -6,883 0 0 $11.42SUBTOTAL 7,524,216 672,430 8.9% 3,968 0 0 $9.75
CENTRAL PALM BEACHINDUSTRIAL 16,191,464 938,560 5.8% 45,672 0 0 $6.49
FLEX 2,124,466 162,771 7.7% 24,311 0 0 $11.60SUBTOTAL 18,315,930 1,101,331 6.0% 69,983 0 0 $7.08
NORTH PALM BEACHINDUSTRIAL 16,659,772 1,246,547 7.5% 91,594 0 0 $6.21
FLEX 2,590,348 359,275 13.9% -13,590 0 20,900 $9.90SUBTOTAL 19,250,120 1,605,822 8.3% 78,004 0 20,900 $6.71
TOTAL INDUSTRIAL 37,230,242 2,483,874 5.5% 148,117 0 0 $6.61TOTAL FLEX 7,860,024 895,709 2.0% 3,838 0 20,900 $10.97
PALM BEACH INDUSTRIAL TOTAL 45,090,266 3,379,583 7.5% 151,955 0 20,900 $7.37
SOUTH FLORIDA COMMERCIAL REAL ESTATE REVIEW | Q4 2012
COLLIERS INTERNATIONAL | P. 22 Contact: Crystal Proenza—[email protected] | Research: Alex Morcate—[email protected]
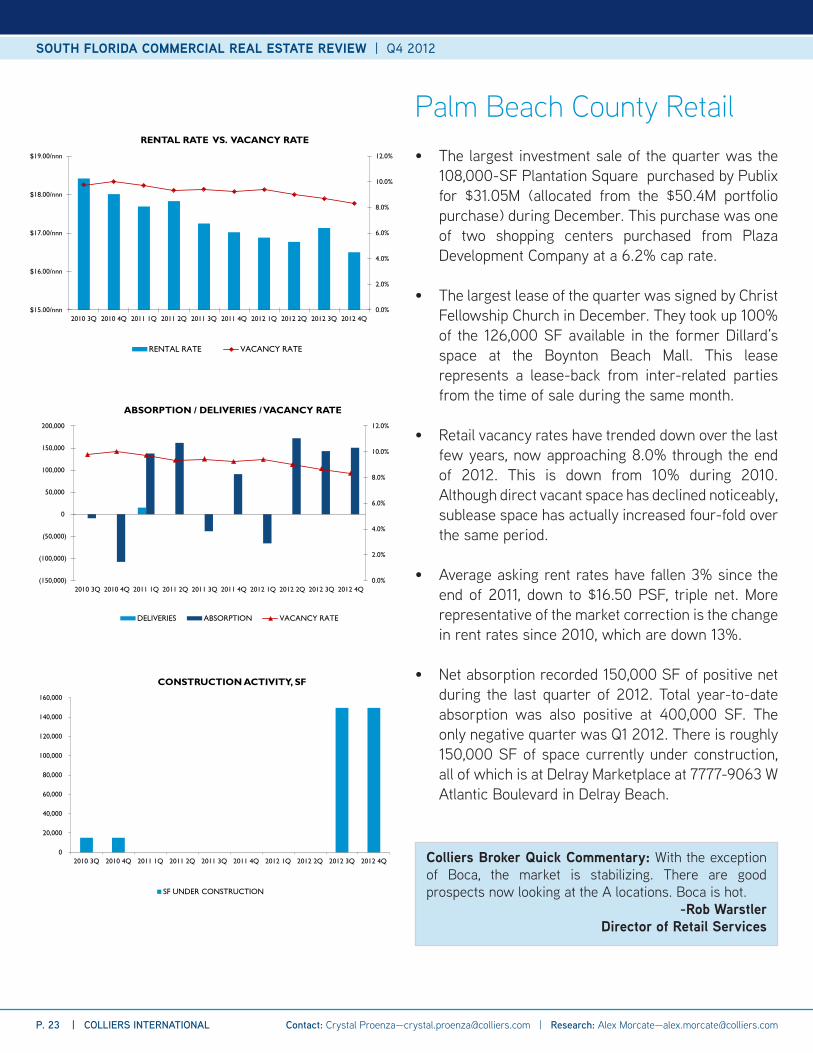
• The largest investment sale of the quarter was the 108,000-SF Plantation Square purchased by Publix for $31.05M (allocated from the $50.4M portfolio purchase) during December. This purchase was one of two shopping centers purchased from Plaza Development Company at a 6.2% cap rate.
• The largest lease of the quarter was signed by Christ Fellowship Church in December. They took up 100% of the 126,000 SF available in the former Dillard’s space at the Boynton Beach Mall. This lease represents a lease-back from inter-related parties from the time of sale during the same month.
• Retail vacancy rates have trended down over the last few years, now approaching 8.0% through the end of 2012. This is down from 10% during 2010. Although direct vacant space has declined noticeably, sublease space has actually increased four-fold over the same period.
• Average asking rent rates have fallen 3% since the end of 2011, down to $16.50 PSF, triple net. More representative of the market correction is the change in rent rates since 2010, which are down 13%.
• Net absorption recorded 150,000 SF of positive net during the last quarter of 2012. Total year-to-date absorption was also positive at 400,000 SF. The only negative quarter was Q1 2012. There is roughly 150,000 SF of space currently under construction, all of which is at Delray Marketplace at 7777-9063 W Atlantic Boulevard in Delray Beach.
Palm Beach County Retail
0.0%
2.0%
4.0%
6.0%
8.0%
10.0%
12.0%
$15.00/nnn
$16.00/nnn
$17.00/nnn
$18.00/nnn
$19.00/nnn
2010 3Q 2010 4Q 2011 1Q 2011 2Q 2011 3Q 2011 4Q 2012 1Q 2012 2Q 2012 3Q 2012 4Q
RENTAL RATE VS. VACANCY RATE
RENTAL RATE VACANCY RATE
0.0%
2.0%
4.0%
6.0%
8.0%
10.0%
12.0%
(150,000)
(100,000)
(50,000)
0
50,000
100,000
150,000
200,000
2010 3Q 2010 4Q 2011 1Q 2011 2Q 2011 3Q 2011 4Q 2012 1Q 2012 2Q 2012 3Q 2012 4Q
ABSORPTION / DELIVERIES / VACANCY RATE
DELIVERIES ABSORPTION VACANCY RATE
0
20,000
40,000
60,000
80,000
100,000
120,000
140,000
160,000
2010 3Q 2010 4Q 2011 1Q 2011 2Q 2011 3Q 2011 4Q 2012 1Q 2012 2Q 2012 3Q 2012 4Q
CONSTRUCTION ACTIVITY, SF
SF UNDER CONSTRUCTION
Colliers Broker Quick Commentary: With the exception of Boca, the market is stabilizing. There are good prospects now looking at the A locations. Boca is hot.
-Rob WarstlerDirector of Retail Services
P. 23 | COLLIERS INTERNATIONAL
SOUTH FLORIDA COMMERCIAL REAL ESTATE REVIEW | Q4 2012
Contact: Crystal Proenza—[email protected] | Research: Alex Morcate—[email protected]
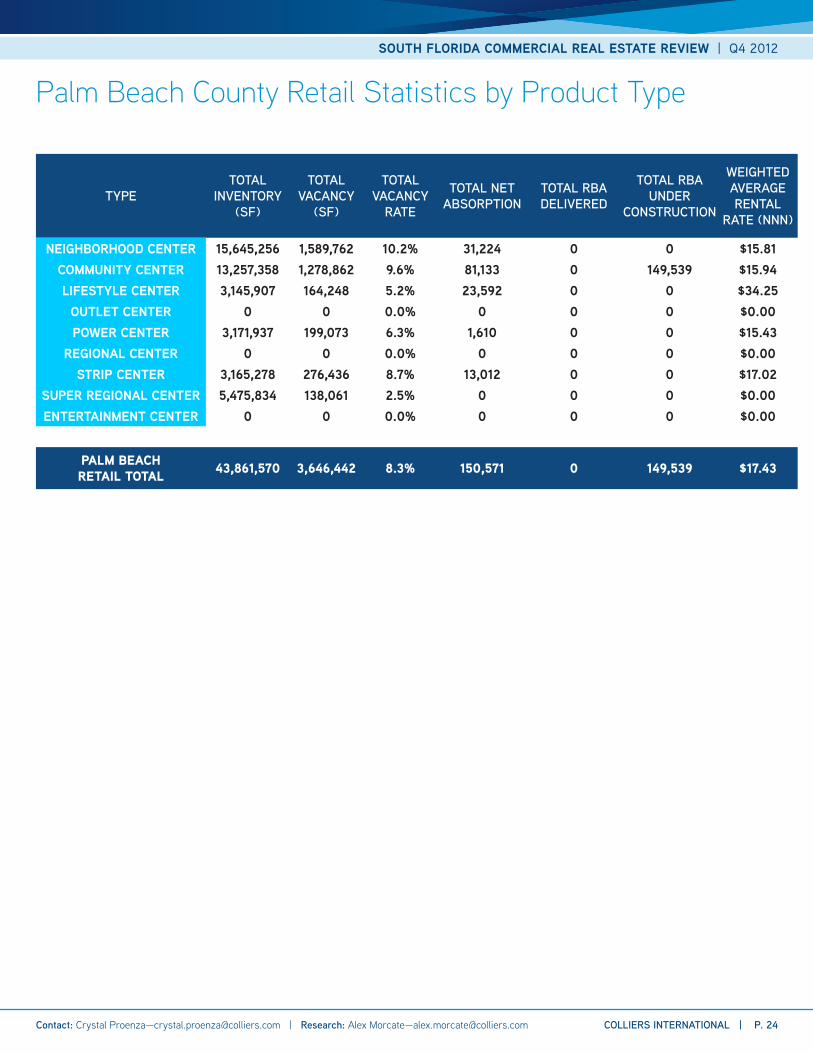
Palm Beach County Retail Statistics by Product Type
TYPETOTAL
INVENTORY (SF)
TOTAL VACANCY
(SF)
TOTAL VACANCY
RATE
TOTAL NET ABSORPTION
TOTAL RBA DELIVERED
TOTAL RBA UNDER
CONSTRUCTION
WEIGHTED AVERAGE RENTAL
RATE (NNN)
NEIGHBORHOOD CENTER 15,645,256 1,589,762 10.2% 31,224 0 0 $15.81COMMUNITY CENTER 13,257,358 1,278,862 9.6% 81,133 0 149,539 $15.94LIFESTYLE CENTER 3,145,907 164,248 5.2% 23,592 0 0 $34.25
OUTLET CENTER 0 0 0.0% 0 0 0 $0.00POWER CENTER 3,171,937 199,073 6.3% 1,610 0 0 $15.43
REGIONAL CENTER 0 0 0.0% 0 0 0 $0.00STRIP CENTER 3,165,278 276,436 8.7% 13,012 0 0 $17.02
SUPER REGIONAL CENTER 5,475,834 138,061 2.5% 0 0 0 $0.00ENTERTAINMENT CENTER 0 0 0.0% 0 0 0 $0.00
PALM BEACH RETAIL TOTAL 43,861,570 3,646,442 8.3% 150,571 0 149,539 $17.43
SOUTH FLORIDA COMMERCIAL REAL ESTATE REVIEW | Q4 2012
COLLIERS INTERNATIONAL | P. 24 Contact: Crystal Proenza—[email protected] | Research: Alex Morcate—[email protected]
Colliers International South Florida Team
Carol Ellis-CutlerSenior Vice President - [email protected]
David C. Metalonis, CCIMSenior Vice President [email protected]
Jay A. Ziv, CCIMSenior Vice President – [email protected]
John K. Crotty, CCIMExecutive Vice President – [email protected]
Michael T. FayChairman - Founding [email protected]
BROKERAGEAchikam YogevSenior Vice [email protected]
Alan SperlingCommercial [email protected]
Claire HolashSenior Commercial [email protected]
Clinton M. CaseySenior Commercial [email protected]
Elias Porras, CCIM, SIORSenior Vice [email protected]
Erin DeeCommercial [email protected]
Ivo TsinevCommercial [email protected]
Jeff ResnickCommercial [email protected]
Joe AboodOffice Leasing [email protected]
Kent SchwarzExecutive Vice President, [email protected]
Kevin McCarthySenior Vice [email protected]
Lawrence H. StocktonSenior Vice [email protected]
Matthew AndersonOffice Leasing [email protected]
Mort FetterolfDirector Industrial [email protected]
Peyton Moore, MBASenior Commercial [email protected]
Randy OlenExecutive Vice [email protected]
Rich LillisExecutive Vice President, [email protected]
Rob WarstlerDirector of Retail [email protected]
Robert R. Listokin, SIORExecutive Vice [email protected]
Ronald A. Schagrin, SIORSenior Vice [email protected]
Ronald W. OsborneVice [email protected]
Sal Bonsignore, CCIMVice [email protected]
Xavier CossardSenior Investment Sales [email protected]
PROPERTY MANAGEMENTKevin RudeDirector, Real Estate [email protected]
RECEIVERSHIPBruce KassmanReceiver / Executive Vice [email protected]
PROJECT MANAGEMENTJohn SmotryskiDirector of Project [email protected]
PRINCIPALS
PARTNERS
TEAM MEMBERS
Donna AboodChairman - Founding [email protected]
Stephen NostrandChief Executive [email protected]
This document has been prepared by Colliers International for advertising and general information only. Colliers International makes no guarantees, representations or warranties of any kind, expressed or implied, regarding the information including, but not limited to, warranties of content, accuracy and reliability. Any interested party should undertake their own inquiries as to the accuracy of the information. Colliers International excludes unequivocally all inferred or implied terms, conditions and warranties arising out of this document and excludes all liability for loss and damages arising there from. This publication is the copyrighted property of Colliers International and/or its licensor(s). ©2013. All rights reserved.
Colliers InternationalSouth FloridaCommercial Real Estate Services95 Merrick Way, Suite 380Miami, FL 33129TEL +1 305 446 0011FAX +1 305 446 1907
522 offices in 62 countries
• $1.8 billion in annual revenue• 1.25 billion square feet under management• Over 12,300 professionals
Accelerating success.