south holland fleet fen turkey farm da draft final...
TRANSCRIPT

Bureau Veritas UK Limited
Telephone: +44 (0)
Fax:: +44 (0)
Registered in England 1758622
www.bureauveritas.co.uk
Registered Office
2nd Floor, Tower Bridge Court
224-226 Tower Bridge Road
London SE1 2TX
SOUTH HOLLAND DISTRI CT COUNCIL
LOCAL AIR QUALITY MANAGEMENT REVIEW AND ASSESSMENT
PM10 DETAILED ASSESSMENT: FLEET FEN FARM
BV/AQ/AGGX4116987/Report No. 2708 Final
MAY 2011

THIS PAGE IS LEFT BLANK INTENTIONALLY

Bureau Veritas UK Limited
Great Guildford House
30 Great Guildford Street
London SE1 0ES
Telephone: +44 (0) 207 902 6100
Fax: +44 (0) 207 902 6149
Registered in England 1758622
www.bureauveritas.co.uk
Registered Office
Great Guildford House
30 Great Guildford Street
London SE1 0ES
Document Control Sheet
Issue/Revision Issue 1 Revision 1
Remarks Draft for Comment Final Version
Date 25th May 2011 27th May 2011
Submitted to Richard Boole Richard Boole
Prepared by Dr David Harrison
Dr Yasmin Vawda
Dr David Harrison
Dr Yasmin Vawda
Signature
Approved by Yvonne Brown Yvonne Brown
Signature
Project number 4116987 4116987
File reference 2708 2708
Disclaimer
This Report was completed by Bureau Veritas on the basis of a defined programme of work and terms and conditions agreed with the Client. Bureau Veritas’ confirms that in preparing this Report it has exercised all reasonable skill and care taking into account the project objectives, the agreed scope of works, prevailing site conditions and the degree of manpower and resources allocated to the project. Bureau Veritas accepts no responsibility to any parties whatsoever, following the issue of the Report, for any matters arising outside the agreed scope of the works. This Report is issued in confidence to the Client and Bureau Veritas has no responsibility to any third parties to whom this Report may be circulated, in part or in full, and any such parties rely on the contents of the report solely at their own risk. Unless specifically assigned or transferred within the terms of the agreement, the consultant asserts and retains all Copyright, and other Intellectual Property Rights, in and over the Report and its contents. Any questions or matters arising from this Report should be addressed in the first instance to the Project Manager.

Bureau Veritas UK Limited
Telephone: +44 (0) 2079026100
Fax:: +44 (0) 2079026149
Registered in England 1758622
www.bureauveritas.co.uk
Registered Office
Great Guildford House
30 Great Guildford Street
London SE1 0ES
THIS PAGE IS LEFT BLANK INTENTIONALLY
South Holland District Council PM10 Detailed Assessment: Fleet Fen Farm
Bureau Veritas Air Quality BV/AQ/AGGX4116987/Report No. 2708 Final 2
Table of Contents
Table of Contents .................................. .................................................................................... 2
Executive Summary.................................. ................................................................................. 4
1 Introduction ....................................... ................................................................................ 6
1.1 Project Background .................................................................................................... 6 1.2 Legislative Background .............................................................................................. 6 1.3 Local Air Quality Management (LAQM) ..................................................................... 7 1.4 Summary of SHDC’s Review and Assessment for PM10 ........................................... 8 1.5 Scope of the Detailed Assessment ............................................................................ 8 1.6 PM10 Emissions from Turkey Farms .......................................................................... 9
2 Methodology........................................ ............................................................................ 10
2.1 Operations at Fleet Fen Farm .................................................................................. 10 2.1.1 General Overview .............................................................................................. 10 2.1.2 Number of Turkeys ............................................................................................ 11 2.1.3 Temperature Control.......................................................................................... 11
2.2 PM10 and meteorological monitoring at Fleet Fen Farm .......................................... 13 2.3 Shed temperature monitoring at Fleet Fen Farm..................................................... 16 2.4 Background Monitoring Sites ................................................................................... 16 2.5 Summary of Methodology to Assess Impacts.......................................................... 18
3 Results and Analysis............................... ....................................................................... 19
3.1 Analysis of Shed Temperature................................................................................. 19 3.2 Analysis of PM10 concentrations and site activities.................................................. 21
3.2.1 24 Hour Averages .............................................................................................. 21 3.2.2 Exceedences of the 50 µg m-3 Daily Mean PM10 Objective............................... 27 3.2.3 Hourly Averages ................................................................................................ 27
3.3 Analysis of statistical variation of measured and calculated parameters................. 29 3.4 Analysis of PM10 with wind speed and wind direction .............................................. 29
4 Applicability of Results ........................... ....................................................................... 34
5 Conclusions........................................ ............................................................................. 37
GLOSSARY........................................... .................................................................................... 39
Appendix: Additional Figures ....................... ......................................................................... 40
List of Tables
Table 1.1 Air Quality Objectives for PM10 included in the Air Quality Regulations for the Purpose of Local Air Quality Management ................................................................................ 7
Table 2.1 Stocking levels within Fleet Fen Farm: 2009 - 2011. .............................................. 11
Table 2.2 PM10 Monitoring Results 2006 -2010: Annual Mean PM10 and number of exceedences of 50 µg m-3. ...................................................................................................... 18
Table 3.1 Daily Site Activity, PM10 concentration of the Turkey Farm BAM, the VCM corrected TEOMs, and the increment PM10 for the monitoring campaign............................................... 25
Table 3.2 Site Activity, PM10 concentration of the turkey Farm BAM, the VCM corrected TEOMs, Wind Speed, Wind Direction and the increment PM10 for the monitoring campaign for those hours where the increment PM10 was greater than 25 µg m-3. ...................................... 28
Table 4.1 Number of potential days of exceedence for the 20 highest measured daily incremental PM10 concentrations and the 90.4th percentile for four different stocking levels for 2010. ........................................................................................................................................ 36

South Holland District Council PM10 Detailed Assessment: Fleet Fen Farm
Bureau Veritas Air Quality BV/AQ/AGGX4116987/Report No. 2708 Final 3
List of Figures
Figure 2.1 Aerial view of Fleet Fen Farm without annotation, and annotated to include the shed numbering system used by the farm; and a red dot to show the location of the receptor dwelling. ................................................................................................................................... 10
Figure 2.2 Ventilation ducts located on the outside of Shed 7B.............................................. 12
Figure 2.3 Heater located inside of Shed 7B........................................................................... 12
Figure 2.4 Aerial view of the Turkey Farm at increased magnification with a red dot to show the location of the monitoring station placed next to the house. ............................................. 13
Figure 2.5 Photo from the BAM pointing west towards the turkey-rearing sheds ................... 14
Figure 2.6 Photo from the BAM pointing north towards the access road................................ 14
Figure 2.7 Photo of the BAM to the east. ................................................................................ 15
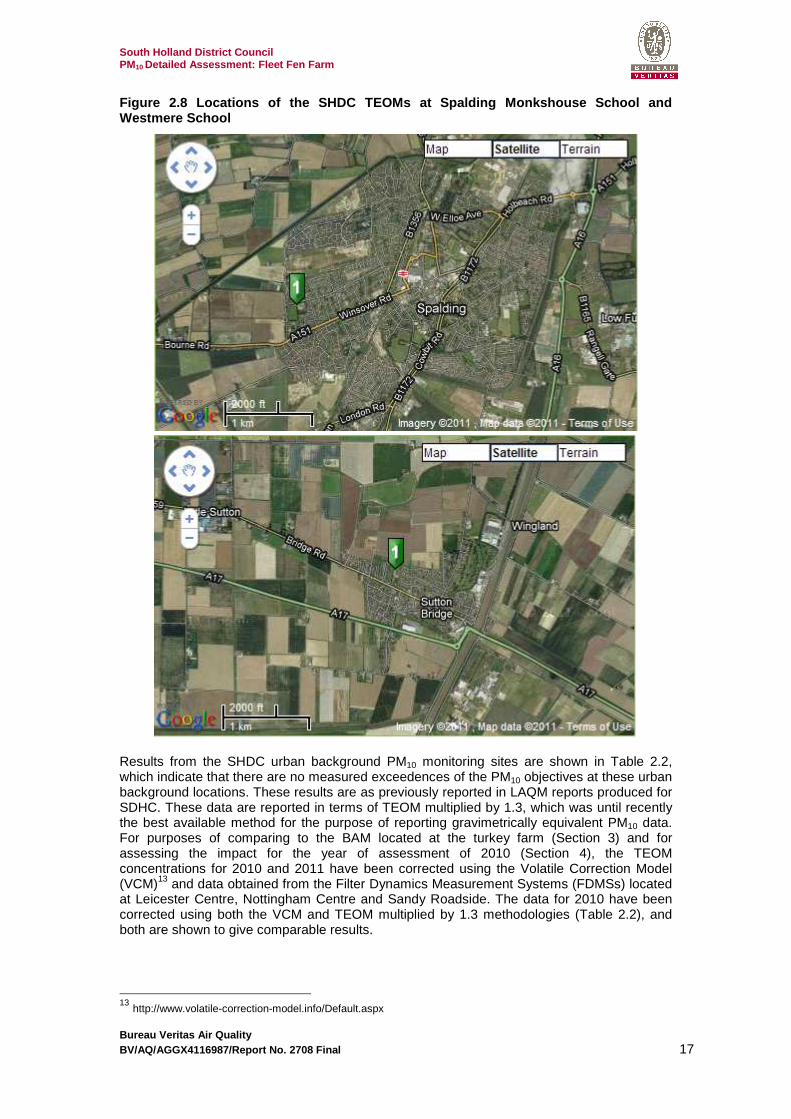
Figure 2.8 Locations of the SHDC TEOMs at Spalding Monkshouse School and Westmere School ...................................................................................................................................... 17
Figure 3.1 Time series of the minimum, maximum and measured shed temperature of Shed 7B. Ambient external temperature is also shown. The turkeys were stocked in the shed on the 1st October 2010 and removed on the 31st January 2011. ...................................................... 20
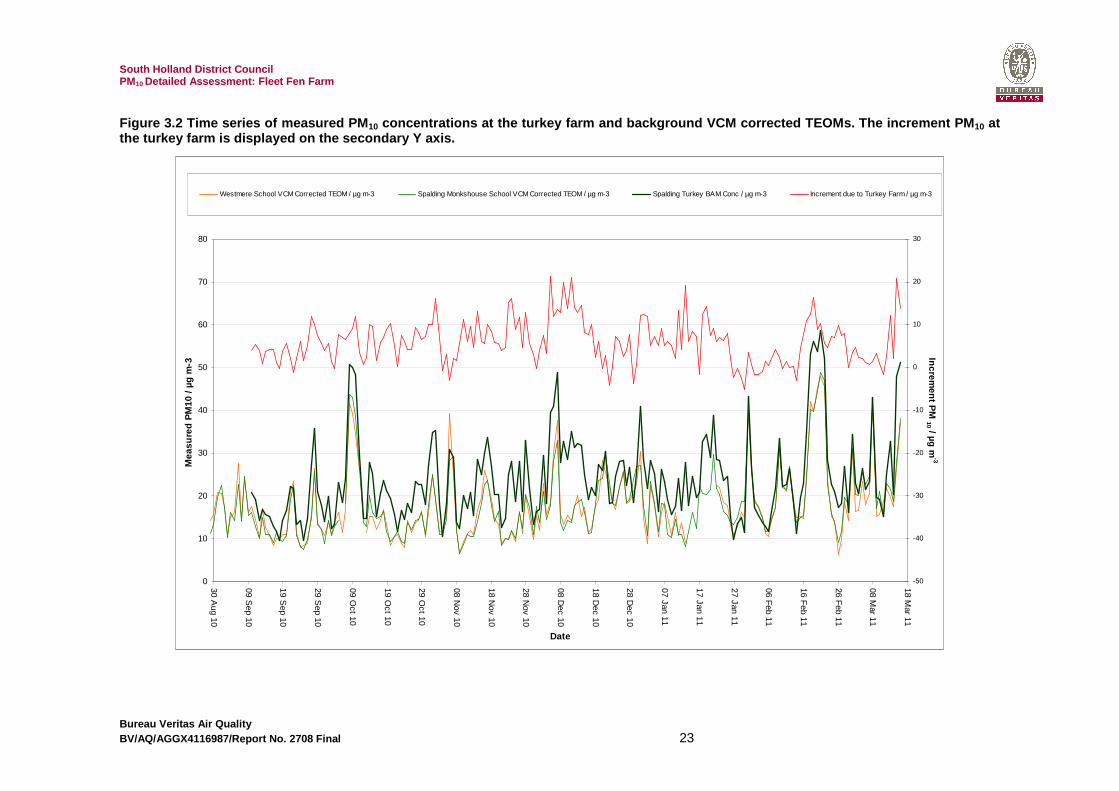
Figure 3.2 Time series of measured PM10 concentrations at the turkey farm and background VCM corrected TEOMs. The increment PM10 at the turkey farm is displayed on the secondary Y axis. ...................................................................................................................................... 23
Figure 3.3 Time series of measured increment PM10 concentrations at the turkey farm and the total number of turkeys being farmed. ..................................................................................... 24
Figure 3.4 Polar Frequency Plots of Increment PM10. Shading is in relation to the frequency of each bin, maximum PM10 and mean PM10. ............................................................................. 31
Figure 3.5 Polar Annulus Plots of PM10, Background PM10, and Increment PM10 for the monitoring campaign. .............................................................................................................. 32
Figure 3.6 Polar Plot of Increment PM10 for the monitoring campaign both with and without overlaying upon an aerial image of Fleet Fen Farm. The increment PM10 is not forced to be positive..................................................................................................................................... 33
Figure A.1 Annual wind frequency distributions for East Anglia (Years 1990 – 1999)............ 41
Figure A.2 Annual Wind Rose for Coltishall for the Year 2001 ............................................... 41
Figure A.3 Summary Plot of Background PM10, and Incremental PM10, PM10, Wind Direction and Wind Speed ...................................................................................................................... 42
Figure A.4 Polar Frequency Plots of Mean Incremental PM10 by month................................. 43
Figure A.5 Polar Plots with uncertainty analysis of PM10, Background PM10, and Incremental PM10 for the monitoring campaign. (The increment PM10 is not forced to be positive). .......... 44
Figure A.6 Polar Plots with uncertainty analysis of PM10, Background PM10, and Incremental PM10 for the monitoring campaign. (The increment PM10 is not forced to be positive. The minimum number of data points in any sector has been restricted to 2)................................. 45

South Holland District Council PM10 Detailed Assessment: Fleet Fen Farm
Bureau Veritas Air Quality BV/AQ/AGGX4116987/Report No. 2708 Final 4
Executive Summary Part IV of the Environment Act 1995 places a statutory duty on local authorities to review and assess the air quality within their area, and to take account of Government guidance when undertaking such work. Defra Technical Guidance relating to poultry farms advices that any farm housing more than 100,000 turkeys, and which gives rise to relevant exposure within 100 m from the turkey-rearing shed/s, requires a Detailed Assessment (DA) for PM10 at those sensitive receptor location/s. South Holland District Council’s (SHDC) fourth round Local Air Quality Management (LAQM) Updating and Screening Assessment (USA) Report 2009 concluded that there was the potential for significant releases of PM10 from two turkey farms: Fleet Fen Farm and Chapel Rd (at Sutton St Edmund), which both have a capacity of 145,000 birds. It was therefore recommended in the USA that a Detailed Assessment (DA) of the impact of these PM10 emissions on local air quality be undertaken. Bureau Veritas (BV) has been commissioned by SHDC to provide a DA for PM10 at Fleet Fen Farm. The DA has been undertaken in accordance with Defra LAQM.TG (09)1 Guidance methodologies. The Technical Guidance states that where emissions arise from an unquantifiable fugitive source, the DA will need to rely predominantly on monitoring data, due to the uncertainties inherent in the published emission factors. This DA aims to determine whether the prescribed air quality objectives are being met (at relevant locations for exposure), by means of real-time continuous monitoring, with due regard to background levels of PM10 and the incremental contribution of emission from the turkey-rearing sheds. The scope of the assessment includes:
• Real-time continuous monitoring of PM10 over a period of 6 months (9th September 2010 - 17th March 2011), encompassing the most intense turkey-rearing period at the farm, and including the cleaning-out periods for the sheds. The monitoring was undertaken as close as possible to the location of relevant exposure i.e. the residential dwelling 43 m from one of the turkey-rearing sheds.
• Real-time continuous monitoring of wind speed and direction at the site, using an
anemometer co-located with the PM10 monitor;
• Comparison of the measured PM10 concentrations at the dwelling against the available data on background PM10 concentrations;
• Correlations of the measured PM10 concentration with site-specific wind speed and
direction data;
• Estimation of the source-contribution i.e. the PM10 increments attributable to emissions from the turkey-rearing sheds;
• Assessment of the measured PM10 concentrations against the statutory air quality
objectives for PM10. It is noteworthy that at the commencement of this study, it was intended that the monitoring period would incorporate the summer-rearing cycle for 2010; however, for commercial reasons, the Site Operating Company (SOC) did not stock any turkey farms within the South Holland district during 2010. Moreover, during the 6 month monitoring period of this study, a
1 Defra (2009), Local Air Quality Management Technical Guidance LAQM.TG(09)
South Holland District Council PM10 Detailed Assessment: Fleet Fen Farm
Bureau Veritas Air Quality BV/AQ/AGGX4116987/Report No. 2708 Final 5
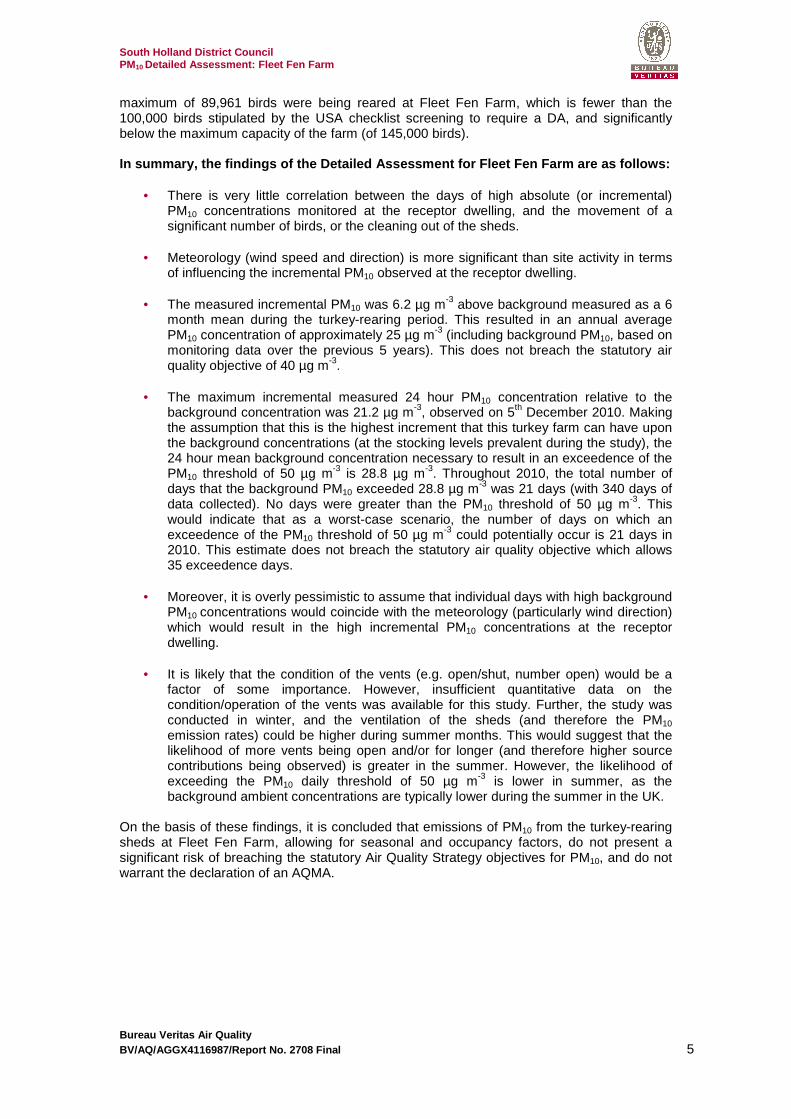
maximum of 89,961 birds were being reared at Fleet Fen Farm, which is fewer than the 100,000 birds stipulated by the USA checklist screening to require a DA, and significantly below the maximum capacity of the farm (of 145,000 birds). In summary, the findings of the Detailed Assessment for Fleet Fen Farm are as follows:
• There is very little correlation between the days of high absolute (or incremental) PM10 concentrations monitored at the receptor dwelling, and the movement of a significant number of birds, or the cleaning out of the sheds.
• Meteorology (wind speed and direction) is more significant than site activity in terms
of influencing the incremental PM10 observed at the receptor dwelling. • The measured incremental PM10 was 6.2 µg m-3 above background measured as a 6
month mean during the turkey-rearing period. This resulted in an annual average PM10 concentration of approximately 25 µg m-3 (including background PM10, based on monitoring data over the previous 5 years). This does not breach the statutory air quality objective of 40 µg m-3.
• The maximum incremental measured 24 hour PM10 concentration relative to the
background concentration was 21.2 µg m-3, observed on 5th December 2010. Making the assumption that this is the highest increment that this turkey farm can have upon the background concentrations (at the stocking levels prevalent during the study), the 24 hour mean background concentration necessary to result in an exceedence of the PM10 threshold of 50 µg m-3 is 28.8 µg m-3. Throughout 2010, the total number of days that the background PM10 exceeded 28.8 µg m-3 was 21 days (with 340 days of data collected). No days were greater than the PM10 threshold of 50 µg m-3. This would indicate that as a worst-case scenario, the number of days on which an exceedence of the PM10 threshold of 50 µg m-3 could potentially occur is 21 days in 2010. This estimate does not breach the statutory air quality objective which allows 35 exceedence days.
• Moreover, it is overly pessimistic to assume that individual days with high background
PM10 concentrations would coincide with the meteorology (particularly wind direction) which would result in the high incremental PM10 concentrations at the receptor dwelling.
• It is likely that the condition of the vents (e.g. open/shut, number open) would be a
factor of some importance. However, insufficient quantitative data on the condition/operation of the vents was available for this study. Further, the study was conducted in winter, and the ventilation of the sheds (and therefore the PM10 emission rates) could be higher during summer months. This would suggest that the likelihood of more vents being open and/or for longer (and therefore higher source contributions being observed) is greater in the summer. However, the likelihood of exceeding the PM10 daily threshold of 50 µg m-3 is lower in summer, as the background ambient concentrations are typically lower during the summer in the UK.
On the basis of these findings, it is concluded that emissions of PM10 from the turkey-rearing sheds at Fleet Fen Farm, allowing for seasonal and occupancy factors, do not present a significant risk of breaching the statutory Air Quality Strategy objectives for PM10, and do not warrant the declaration of an AQMA.

South Holland District Council PM10 Detailed Assessment: Fleet Fen Farm
Bureau Veritas Air Quality BV/AQ/AGGX4116987/Report No. 2708 Final 6
1 Introduction
1.1 Project Background Bureau Veritas (BV) have been appointed by South Holland District Council (SHDC) to carry out the Detailed Assessment (DA) of PM10 in the vicinity of Fleet Fen Farm, on Neal’s Gate, 3 miles south of Holbeach (population less than 10,000), and 7 miles east of Spalding (population less than 50,000). The DA is required to be undertaken as part of the local authority’s statutory duties under the Local Air Quality Management (LAQM) regime as defined within Part IV of the Environment Act 1995. Poultry farming is an important industry in the area. Fleet Fen Farm is regulated by the Environment Agency (EA) under the Environmental Permitting (EP) Regulations. At the conclusion of the fourth round of local authority review and assessment, in total eleven local authorities across the UK identified poultry farms within their districts which required a DA for PM10, following the USA screening criteria in LAQM.TG(09). This Detailed Assessment is one of four studies of PM10 in the vicinity of poultry farms2 co-funded by Defra. It is understood that the results and findings of this DA will contribute to the evidence-base for future Technical Guidance on poultry farms to assist Local Authorities.
1.2 Legislative Background The significance of existing and future pollutant levels are assessed in relation to the national air quality standards and objectives, established by Government. The revised Air Quality Strategy (AQS)3 for the UK (released in July 2007) provides the over-arching strategic framework for air quality in the UK and contains national air quality standards and objectives established by the UK Government and devolved administrations to protect human health. The air quality objectives incorporated in the AQS and UK legislation are derived from the Limit Values prescribed in the European Union (EU) Directives transposed into national legislation by member states. The objectives for ten pollutants (benzene, 1,3-butadiene, carbon monoxide, lead, nitrogen dioxide (NO2), sulphur dioxide particulates (PM10 and PM2.5), ozone and PAHs - Polycyclic Aromatic Hydrocarbons) have been prescribed within the Air Quality Strategy3.
The air quality objectives applicable to Local Air Quality Management (LAQM) in England are set out in the Air Quality (England) Regulations 2000 (SI 928), and the Air Quality (England) (Amendment) Regulations 2002 (SI 3043).
The CAFE (Clean Air for Europe) programme was initiated in the late 1990s to draw together previous directives into a single EU Directive on air quality. The Directive 2008/50/EC4 introduces new obligatory standards for PM2.5 for the EU states but places no statutory duty on local Government to work towards achievement. The UK Government and the Devolved Administrations have also set new national air quality objectives for PM2.5. These objectives have not been incorporated into LAQM Regulations, and local authorities have no statutory obligation to review and assess air quality against them.
2 The other DAs for poultry farms which have received capital grants are being carried out for installations which fall within the New Forest District Council, North Dorset District Council and Aylesbury Vale District Council areas 3 The Air Quality Strategy for England, Scotland, Wales and Northern Ireland (2007), Published by Defra in partnership with the Scottish Government, Welsh Assembly Government and Department of the Environment Northern Ireland 4 Directive 2008/50/EC of the European Parliament and of the Council of 21 May 2008 on ambient air quality and cleaner air for Europe
South Holland District Council PM10 Detailed Assessment: Fleet Fen Farm
Bureau Veritas Air Quality BV/AQ/AGGX4116987/Report No. 2708 Final 7
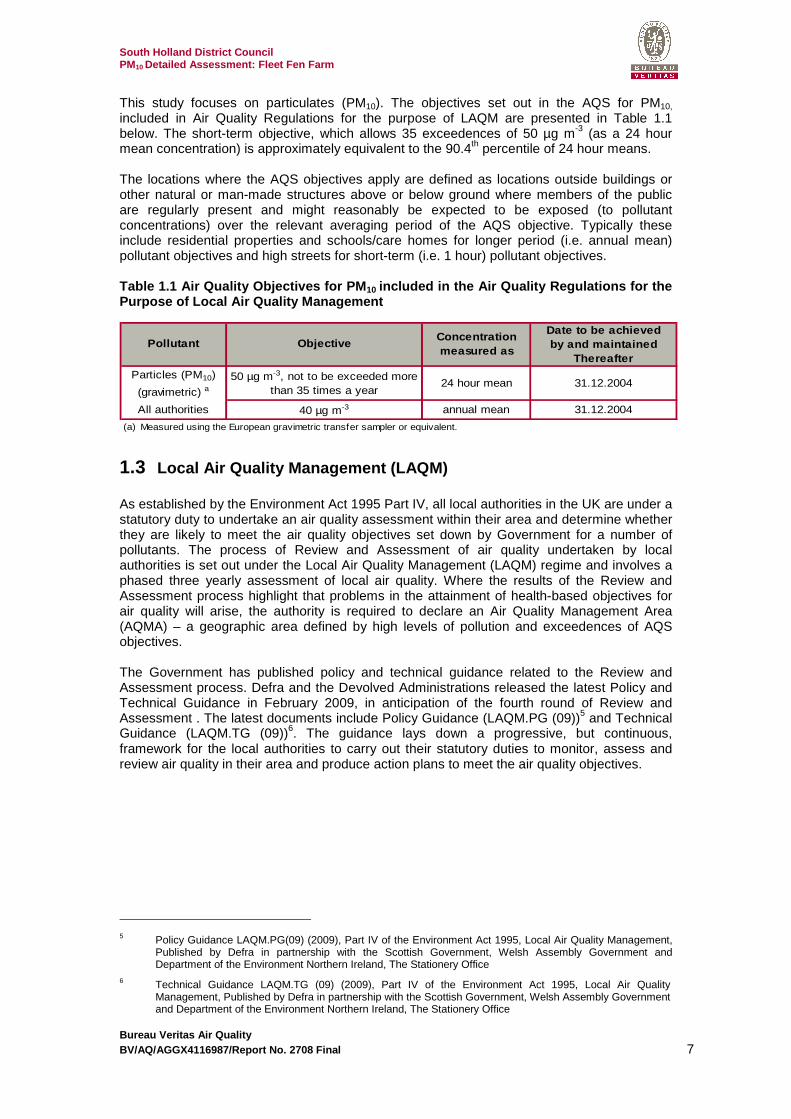
This study focuses on particulates (PM10). The objectives set out in the AQS for PM10,
included in Air Quality Regulations for the purpose of LAQM are presented in Table 1.1 below. The short-term objective, which allows 35 exceedences of 50 µg m-3 (as a 24 hour mean concentration) is approximately equivalent to the 90.4th percentile of 24 hour means. The locations where the AQS objectives apply are defined as locations outside buildings or other natural or man-made structures above or below ground where members of the public are regularly present and might reasonably be expected to be exposed (to pollutant concentrations) over the relevant averaging period of the AQS objective. Typically these include residential properties and schools/care homes for longer period (i.e. annual mean) pollutant objectives and high streets for short-term (i.e. 1 hour) pollutant objectives. Table 1.1 Air Quality Objectives for PM 10 included in the Air Quality Regulations for the Purpose of Local Air Quality Management
Date to be achievedby and maintained
Thereafter
Particles (PM10)
(gravimetric) a50 µg m-3, not to be exceeded more
than 35 times a year24 hour mean 31.12.2004
All authorities 40 µg m-3 annual mean 31.12.2004
Pollutant ObjectiveConcentration measured as
(a) Measured using the European gravimetric transfer sampler or equivalent.
1.3 Local Air Quality Management (LAQM) As established by the Environment Act 1995 Part IV, all local authorities in the UK are under a statutory duty to undertake an air quality assessment within their area and determine whether they are likely to meet the air quality objectives set down by Government for a number of pollutants. The process of Review and Assessment of air quality undertaken by local authorities is set out under the Local Air Quality Management (LAQM) regime and involves a phased three yearly assessment of local air quality. Where the results of the Review and Assessment process highlight that problems in the attainment of health-based objectives for air quality will arise, the authority is required to declare an Air Quality Management Area (AQMA) – a geographic area defined by high levels of pollution and exceedences of AQS objectives. The Government has published policy and technical guidance related to the Review and Assessment process. Defra and the Devolved Administrations released the latest Policy and Technical Guidance in February 2009, in anticipation of the fourth round of Review and Assessment . The latest documents include Policy Guidance (LAQM.PG (09))5 and Technical Guidance (LAQM.TG (09))6. The guidance lays down a progressive, but continuous, framework for the local authorities to carry out their statutory duties to monitor, assess and review air quality in their area and produce action plans to meet the air quality objectives.
5 Policy Guidance LAQM.PG(09) (2009), Part IV of the Environment Act 1995, Local Air Quality Management,
Published by Defra in partnership with the Scottish Government, Welsh Assembly Government and Department of the Environment Northern Ireland, The Stationery Office
6 Technical Guidance LAQM.TG (09) (2009), Part IV of the Environment Act 1995, Local Air Quality Management, Published by Defra in partnership with the Scottish Government, Welsh Assembly Government and Department of the Environment Northern Ireland, The Stationery Office

South Holland District Council PM10 Detailed Assessment: Fleet Fen Farm
Bureau Veritas Air Quality BV/AQ/AGGX4116987/Report No. 2708 Final 8
1.4 Summary of SHDC’s Review and Assessment for PM 10 Between 1998 and 2001, SHDC undertook its first round of review and assessment of air quality (Stages 1, 2 and 3), which concluded that it was not necessary to declare any AQMAs for any pollutant. The first phase of the second round, the USA was completed in August 2003 and this provided an update with respect to air quality issues within SHDC area. The USA concluded that no Detailed Assessment was required within the District with respect to air quality. The Annual Progress Reports (APR) for 2004 and 2005 considered monitoring data for 2003 and 2004, and the conclusions of the APRs were that there were no exceedences which warranted a detailed assessment. The first phase of the third round of review and assessment was completed in June 2006. The USA 2006 concluded that all objectives were met and no DA was required. In 2007 and 2008 SHDC submitted APRs for air quality, which concluded that no significant changes in pollutant concentration had occurred and there were no predicted exceedences of air quality objectives. The USA (2009) included consideration of new emission sources, as required by the checklists contained in LAQM.TG(09). The checklist required that any turkey farm with a capacity for more than 100,000 birds be inspected for relevant exposure. The guidance in LAQM.TG(09) states that a DA of PM10 is required if there are properties with relevant exposure within 100 m of the poultry unit. The USA (2009) concluded that there were 2 poultry farms in the SHDC area with relevant exposure for annual mean PM10. There is relevant exposure near the poultry sheds at Fleet Fen Farm at a distance of 43 m, and at a distance of 16 m at Chapel Rd (at Sutton St Edmund). Both these turkey farms are operated by the SOC, and have a capacity of 145,000 birds. On this basis, the USA (2009) proposed that SHDC progress to a DA (for annual mean PM10) at the two poultry farm locations: Fleet Fen Farm and Chapel Rd (at Sutton St Edmund).
1.5 Scope of the Detailed Assessment This report fulfils the requirements of the Local Air Quality Management (LAQM) process as set out in part IV of the Environment Act (1995); the Air Quality Strategy for England, Scotland, Wales and Northern Ireland 2007, and the relevant Policy and Technical Guidance documents. BV has been commissioned by SHDC to undertake the DA for Fleet Fen Farm as part of the 4th round of LAQM Review and Assessment. Insufficient funding was available to carry out an additional DA at Sutton St. Edmund. The project included monitoring of PM10 and provision of a detailed assessment report providing conclusions with respect to the AQS objectives and analysis of the affect of wind direction on pollutant concentrations. As such the focus of the report is on monitoring undertaken in 2010 as part of this study, although where useful historical monitoring has been used. A preliminary site visit of both farms was conducted on 12th August 2010 by Dr. David Harrison (BV) with Jeanette Reith and Richard Boole (SHDC), as well as representatives from the SOC who run both the Fleet Fen and Chapel End (Sutton St. Edmund) farms. Both farms have farm operatives and their families living within the site boundaries.
South Holland District Council PM10 Detailed Assessment: Fleet Fen Farm
Bureau Veritas Air Quality BV/AQ/AGGX4116987/Report No. 2708 Final 9
An historical annual wind direction distribution diagram is shown in Figure A.1 in the Appendix 7. A more detailed wind rose is shown for Coltishall (56 miles east of Fleet Fen farm) is shown in Figure A.2 in the Appendix7. At Fleet Fen Farm, the sensitive residential property is east of the rearing sheds, which is predominately downwind. At Sutton St. Edmund however, the nearest residential property is south-west of the rearing sheds, which is predominately upwind. As such, Fleet Fen Farm was chosen to site the PM10 monitoring equipment and conduct the DA.
1.6 PM10 Emissions from Turkey Farms EU guidance on best available techniques (BAT) for Integrated Pollution Prevention and Control (IPPC) installations8 provides advice on reducing particulate and dust emissions from the intensive rearing of poultry and pigs. It states that as of 2006, the UK had 20 turkey farms which came under the IPPC Directive (as reported by the member state). However, only laying chicken hens and broilers are considered in detail in the EU BREF guidance because of the lack of information on turkeys. The amount of litter used depends on the housing system and the farmers’ preference. The EU BREF notes states that turkeys reared in deep-litter systems (using wood shavings or chopped straw) require 14 to 22 kg/animal/yr bedding material. However, no data on dust emissions to air at turkey farms are available in the BREF note. The impact of PM10 from poultry-rearing shed is also dependent upon the ventilation rate and type of ventilation for the sheds. The necessary ventilation is determined by the temperature inside the sheds, and the need for animal welfare/comfort at different stages of bird growth. Therefore, information on the temperature and ventilation of the sheds is given consideration in this study. The EA Pollution Inventory9 reporting form gives a dust emission factor of 0.9 kg dust/animal place/year for a male turkey, and 0.5 kg dust/animal place/year for a female turkey. The form states that PM10 emissions may be assumed to be a third of the dust emission. The EA uses a threshold of total 1000 kg PM10/annum/installation as meriting an entry on the Pollution Inventory reporting form for the purposes of an Environmental Permit (EP). If the total PM10
emission at the farm are less than 1000 kg PM10/annum, they are deemed by the EA to be ‘brt’ – below reporting threshold’. On this basis, the estimated PM10 emissions at Fleet Fen Farm are in the range of 24,166 – 43,500 kg PM10/annum assuming full capacity of 145,000 animal places, and therefore require disclosure within its EP.
7 SNIFFER UKPIR15 Atmospheric Deposition Model for Screening Combustion Sources Against Habitat Impacts, Final Report for SCAIL Combustion, May 2010.
8 BREF Note 07.2003 Integrated Pollution Prevention and Control (IPPC) Reference Document on Best Available Techniques for Intensive Rearing of Poultry and Pigs, adopted 2003 9 EA Pollution Inventory Reporting. Environmental Permitting (England and Wales) Regulations 2007, Regulation 60(2): Intensive Framing Guidance Note

South Holland District Council PM10 Detailed Assessment: Fleet Fen Farm
Bureau Veritas Air Quality BV/AQ/AGGX4116987/Report No. 2708 Final 10
2 Methodology
2.1 Operations at Fleet Fen Farm
2.1.1 General Overview Figure 2.1 shows aerial views of Fleet Fen Farm and the receptor dwelling in which the farm operative resides. The back garden of the property is completely enclosed by high trees, but the front driveway is only partially enclosed. The site is located off Neal’s Gate, a road with only occasional traffic movements. The receptor is 26 m west of the road, but is shielded from it by high hedges. The B1165 road is 511 metres to the north of the receptor, and is also characterised by low volumes of traffic, and at a distance which is unlikely to be a significant source of PM10 at Fleet Fen Farm. Holbeach is the nearest centre of population and is located 3 miles to the north, and Spalding is located 7 miles to the west. The four nearest poultry farms are located 2, 2.5, 4 and 4.5 miles south of the site. The surrounding area is characterised by flat land used for arable farming. The next nearest property is located 86 m east of the turkey sheds, and is not owned by the SOC. Figure 2.1 Aerial view of Fleet Fen Farm without an notation, and annotated to include the shed numbering system used by the farm; and a r ed dot to show the location of the receptor dwelling.

South Holland District Council PM10 Detailed Assessment: Fleet Fen Farm
Bureau Veritas Air Quality BV/AQ/AGGX4116987/Report No. 2708 Final 11
2.1.2 Number of Turkeys Table 2.1 lists the historic stocking levels at Fleet Fen Farm as provided by the SOC and incorporates the stocking/rearing figures for the winter 2010-11 cycle which coincided with the monitoring campaign. It is noted that in 2009, in addition to the pre-Christmas stocking/rearing cycle, there was a cycle during the summer. At the commencement of this study, it was intended that the monitoring period would incorporate a summer-rearing cycle for 2010; however, for commercial reasons, the SOC did not stock any turkey farms within South Holland district during 2010. Table 2.1 Stocking levels within Fleet Fen Farm: 20 09 - 2011.
From To Birds From To BirdsSummer 2009 15 June 2009 26 June 2009 117925 28 August 2009 16 September 2009 112419Winter 2009-10 01 October 2009 19 October 2009 130806 02 December 2009 11 January 2010 123237Summer 2010 N/A N/A 0 N/A N/A 0
23 November 2010 22 December 2010 7680231 January 2011 02 February 2011 8378
29 December 2010 11 February 2011 32361
RemovedPlaced
Winter 2010-11Still being farmed at end of monitoring period
Period
23 September 2010 01 October 2010 89961
A total of 89,961 birds were brought to the farm as newly-hatched chicks between 23rd September and 1st October 2010. 76,802 adult birds were removed from site between 23rd November 2010 and the 20th December 2010. The 10 sheds in which these birds were housed were systematically cleaned (i.e. the mucking out of sheds; washing out and disinfecting; washing and sanitising feed-bins; fumigation; the sanitation of water tanks and electrical equipment; and building maintenance) between 6th January 2011 and 4th February 2011. Between 29th December 2010 and 11th February 2011, a total of 32,001 partly-grown birds were brought to site from other farms in the area. Between 25th January 2011 and 2nd February 2011, 9,143 birds were removed for slaughter. Approximately 32,000 birds of varying ages were still being reared at the point when PM10 monitoring ceased on the 17th March 2011. Therefore, the maximum number of birds being reared on site during the study was 89,961, which is less than the required 100,000 birds for a DA to be instigated. The stocking dates, rearing numbers and cleaning schedules were determined by the SOC and were outside the control of BV or SHDC. Neither BV nor SHDC were aware of the stocking levels until this information was received from the SOC on the 25th March and 16th April; after the monitoring had concluded. A typical rearing cycle at Fleet Fen Farm is 120 days (approximately 4 months). The temperature at which turkeys should be maintained drops from 28º to 15.5º over a typical rearing cycle. All the SOC farm operatives are provided with a projected schedule of internal shed temperature versus bird age, though there is a significant element of skilled animal husbandry undertaken to ensure that the turkeys are comfortable.
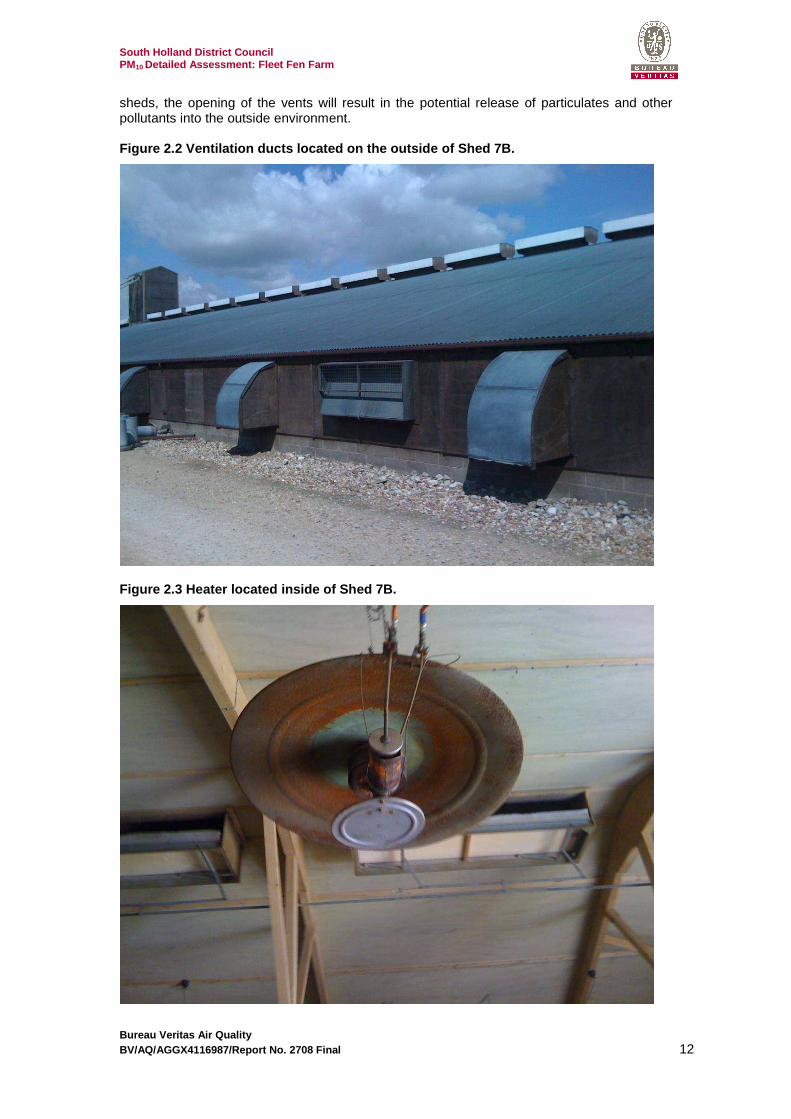
2.1.3 Temperature Control The temperature within the sheds is controlled by a simple, yet effective system. A thermostat monitors the temperature and compares this to a threshold temperature. If the measured temperature is too cold, then heaters are turned on. The heaters are suspended from the ceiling, and their height above the ground is raised as the turkeys grow larger. If the measured temperature exceeds the threshold temperature by at least 2ºC, then vents are opened to the outside air. There are 4 ventilation settings with an increased number of vents being opened if the measured temperature exceeds the threshold temperature by greater than 2, 4, 6 or 8 ºC. Each day, the farm operative notes the maximum and minimum temperatures observed in each shed within the previous 24 hours. Figure 2.2 and Figure 2.3 show the ventilation and heating systems employed in Shed 7B. In addition to cooling the
South Holland District Council PM10 Detailed Assessment: Fleet Fen Farm
Bureau Veritas Air Quality BV/AQ/AGGX4116987/Report No. 2708 Final 12
sheds, the opening of the vents will result in the potential release of particulates and other pollutants into the outside environment. Figure 2.2 Ventilation ducts located on the outside of Shed 7B.
Figure 2.3 Heater located inside of Shed 7B.
South Holland District Council PM10 Detailed Assessment: Fleet Fen Farm
Bureau Veritas Air Quality BV/AQ/AGGX4116987/Report No. 2708 Final 13
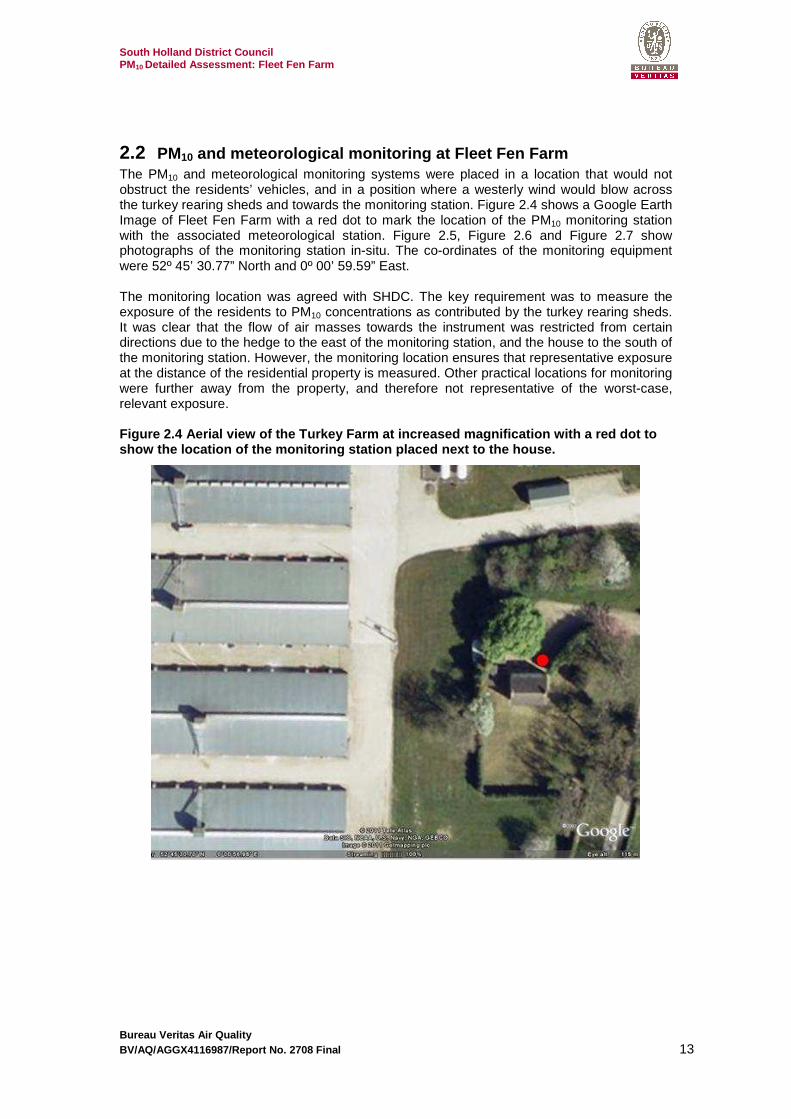
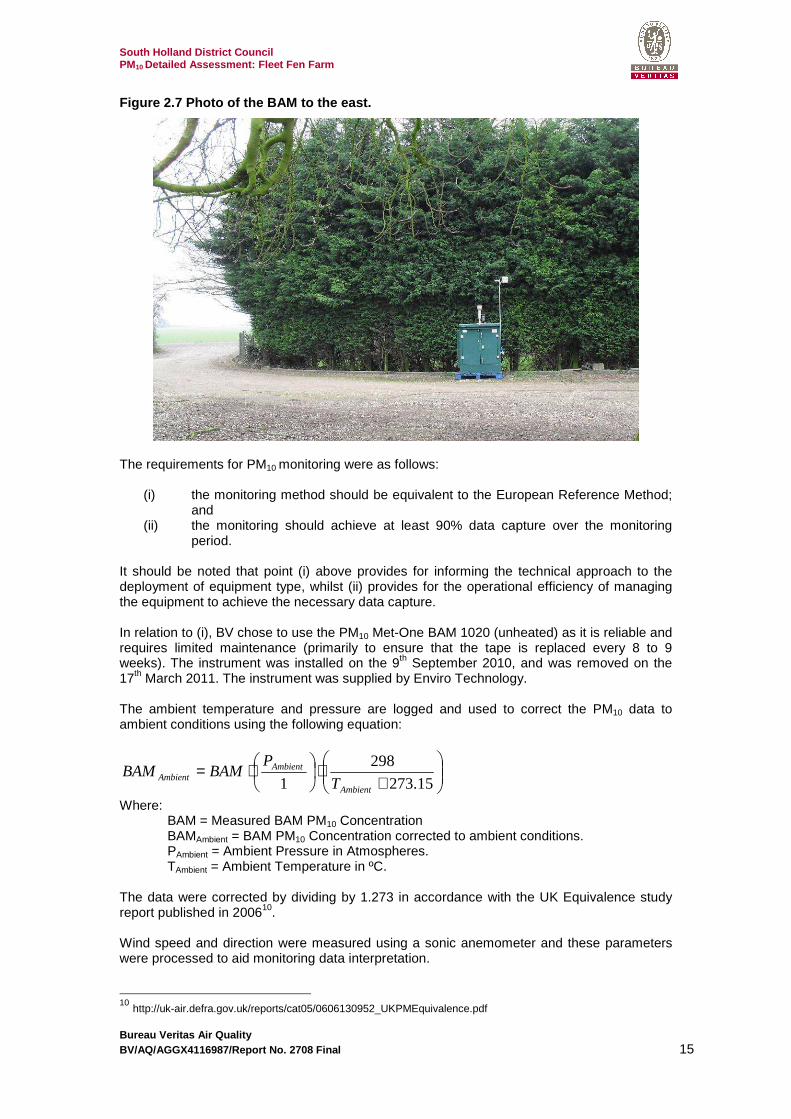
2.2 PM10 and meteorological monitoring at Fleet Fen Farm The PM10 and meteorological monitoring systems were placed in a location that would not obstruct the residents’ vehicles, and in a position where a westerly wind would blow across the turkey rearing sheds and towards the monitoring station. Figure 2.4 shows a Google Earth Image of Fleet Fen Farm with a red dot to mark the location of the PM10 monitoring station with the associated meteorological station. Figure 2.5, Figure 2.6 and Figure 2.7 show photographs of the monitoring station in-situ. The co-ordinates of the monitoring equipment were 52º 45’ 30.77” North and 0º 00’ 59.59” East. The monitoring location was agreed with SHDC. The key requirement was to measure the exposure of the residents to PM10 concentrations as contributed by the turkey rearing sheds. It was clear that the flow of air masses towards the instrument was restricted from certain directions due to the hedge to the east of the monitoring station, and the house to the south of the monitoring station. However, the monitoring location ensures that representative exposure at the distance of the residential property is measured. Other practical locations for monitoring were further away from the property, and therefore not representative of the worst-case, relevant exposure. Figure 2.4 Aerial view of the Turkey Farm at increa sed magnification with a red dot to show the location of the monitoring station placed next to the house.

South Holland District Council PM10 Detailed Assessment: Fleet Fen Farm
Bureau Veritas Air Quality BV/AQ/AGGX4116987/Report No. 2708 Final 14
Figure 2.5 Photo from the BAM pointing west towards the turkey-rearing sheds
Figure 2.6 Photo from the BAM pointing north toward s the access road.
South Holland District Council PM10 Detailed Assessment: Fleet Fen Farm
Bureau Veritas Air Quality BV/AQ/AGGX4116987/Report No. 2708 Final 15
Figure 2.7 Photo of the BAM to the east.
The requirements for PM10 monitoring were as follows:
(i) the monitoring method should be equivalent to the European Reference Method; and
(ii) the monitoring should achieve at least 90% data capture over the monitoring period.
It should be noted that point (i) above provides for informing the technical approach to the deployment of equipment type, whilst (ii) provides for the operational efficiency of managing the equipment to achieve the necessary data capture. In relation to (i), BV chose to use the PM10 Met-One BAM 1020 (unheated) as it is reliable and requires limited maintenance (primarily to ensure that the tape is replaced every 8 to 9 weeks). The instrument was installed on the 9th September 2010, and was removed on the 17th March 2011. The instrument was supplied by Enviro Technology. The ambient temperature and pressure are logged and used to correct the PM10 data to ambient conditions using the following equation:
+⋅
⋅=15.273
298
1 Ambient
AmbientAmbient T
PBAMBAM
Where: BAM = Measured BAM PM10 Concentration BAMAmbient = BAM PM10 Concentration corrected to ambient conditions. PAmbient = Ambient Pressure in Atmospheres. TAmbient = Ambient Temperature in ºC.
The data were corrected by dividing by 1.273 in accordance with the UK Equivalence study report published in 200610. Wind speed and direction were measured using a sonic anemometer and these parameters were processed to aid monitoring data interpretation. 10 http://uk-air.defra.gov.uk/reports/cat05/0606130952_UKPMEquivalence.pdf
South Holland District Council PM10 Detailed Assessment: Fleet Fen Farm
Bureau Veritas Air Quality BV/AQ/AGGX4116987/Report No. 2708 Final 16
The instrument was set up as per Section 5.71 of the UK Equivalence report, and subsequent improvements based on the recent equivalence testing of the PM2.5 Smart Heated Met-One BAM (which received an MCERTS certificate in January 201111), namely:
� A PM10 inlet was used with ridges to prevent rain getting through to the impaction surface (Met-One Part No. BX8-802)
� The instrument had a flow rate of 16.67 l min-1 both controlled by a mass flow controller and reported to 25 °C and 1013 Pa.
� The filter material is provided directly by Met-One who source from several different manufacturers to the following specifications: Borosilicate micro fibre glass, acrylic resin binder nominal 0.2 µm glass fibre construction. Collection efficiency 99.9 % for 0.3 µm particles.
� As in the original equivalence tests, the sample time is 50 minutes therefore ensuring that the instrument is operated as originally tested, and meets the 75 % data capture requirement. Beta measurements occur for 4 minutes at the beginning and end of every sample with a total of 2 minutes shuttling and span foil testing time.
� C14 Beta source. Max beta energy 156 kV; 50 to 60 kV mean. Travel distance in air: 20 to 30 cm.
� The baselines were tested by the instrument supplier at their facility at the beginning of the 6 month monitoring period, and were retested at the end. This showed that the instrument had not drifted over the course of the study. The offset was calculated and programmed in to the instrument to automatically correct the data for zero.
The instrument was leak-checked and flow-checked periodically by Enviro Technology. The filter tape was changed approximately every 9 weeks.
2.3 Shed temperature monitoring at Fleet Fen Farm As the temperature is regulated in real-time without a need for data logging and subsequent control, it was not possible to obtain digital readings of shed temperatures and/or the number of vents open at any one time. A temperature monitoring system was placed in Shed 7B, which was one of the 16 sheds closest to the receptor dwelling, in a position close to the thermostat, but out of reach of the turkeys. The system was built by Air Monitors UK Ltd. and the data were recorded at a 15 minute intervals using a Web-Logger logging system and associated AQWeb software.
2.4 Background Monitoring Sites SHDC operate two Tapered Element Oscillating Microbalances (TEOMs) located at schools within the local authority: Spalding Monkshouse School and Westmere School12 . The quality assurance/quality control (QA/QC) procedures are equivalent to the UK Automatic Urban and Rural Network (AURN) procedures. Figure 2.8 shows the location of these instruments. The sites are classed as urban background.
11 http://www.siraenvironmental.com/UserDocs/MCERTS/MC10018500.pdf
12 http://shollandair.aeat.com/index.php.
South Holland District Council PM10 Detailed Assessment: Fleet Fen Farm
Bureau Veritas Air Quality BV/AQ/AGGX4116987/Report No. 2708 Final 17
Figure 2.8 Locations of the SHDC TEOMs at Spalding Monkshouse School and Westmere School
Results from the SHDC urban background PM10 monitoring sites are shown in Table 2.2, which indicate that there are no measured exceedences of the PM10 objectives at these urban background locations. These results are as previously reported in LAQM reports produced for SDHC. These data are reported in terms of TEOM multiplied by 1.3, which was until recently the best available method for the purpose of reporting gravimetrically equivalent PM10 data. For purposes of comparing to the BAM located at the turkey farm (Section 3) and for assessing the impact for the year of assessment of 2010 (Section 4), the TEOM concentrations for 2010 and 2011 have been corrected using the Volatile Correction Model (VCM)13 and data obtained from the Filter Dynamics Measurement Systems (FDMSs) located at Leicester Centre, Nottingham Centre and Sandy Roadside. The data for 2010 have been corrected using both the VCM and TEOM multiplied by 1.3 methodologies (Table 2.2), and both are shown to give comparable results.
13 http://www.volatile-correction-model.info/Default.aspx
South Holland District Council PM10 Detailed Assessment: Fleet Fen Farm
Bureau Veritas Air Quality BV/AQ/AGGX4116987/Report No. 2708 Final 18
Table 2.2 PM 10 Monitoring Results 2006 -2010: Annual Mean PM 10 and number of exceedences of 50 µg m -3.
2006 2007 2008 2009 2010 2010TEOM x1.3
TEOM x1.3
TEOM x1.3
TEOM x1.3
TEOM x1.3
VCM
Mean 14.8 18.8 16.8 16.5 16.9 16.9
Exceedences 0 3 1 0 0 0
Mean 16.4 20.4 19 16 17.4 17.3
Exceedences 0 7 1 0 0 0
Westmere CP School, Sutton Bridge
547264 321709
Monkhouse School, Spalding
523168 322454
Location X Y Criteria
2.5 Summary of Methodology to Assess Impacts The methodology for the DA, as described in Sections 2.1 to 2.5 comprised:
• Real-time continuous monitoring of PM10 over a period of 6 months using a Met-One BAM 1020 (9th September 2010 - 17th March 2011), encompassing the most intense turkey-rearing period at the farm, and including the cleaning-out periods for the sheds.
• The monitoring was undertaken as close as possible to the location of relevant
exposure i.e. residential dwelling 43 m from one of the turkey rearing sheds.
• Real-time continuous monitoring of wind speed and direction at the site, using an anemometer co-located with the PM10 monitor;
• Comparison of the measured PM10 concentrations at the dwelling against the
available data on background PM10 concentrations.
• Correlations of the measured PM10 concentration with local wind speed and direction data.
• Calculation of the source-contribution i.e. PM10 increments attributable to emissions
from the turkey-rearing sheds.
• Assessment of the measured PM10 concentration against the statutory air quality objectives for PM10, with due allowance for background PM10.

South Holland District Council PM10 Detailed Assessment: Fleet Fen Farm
Bureau Veritas Air Quality BV/AQ/AGGX4116987/Report No. 2708 Final 19
3 Results and Analysis
3.1 Analysis of Shed Temperature In addition to cooling the sheds, the operation of the ventilation system is significant for air quality because the opening of the vents releases particulates and other pollutants into the ambient environment. The 16 sheds were stocked with newly-hatched turkeys between the 23rd September and 1st October 2010. Shed 7B in which the temperature logger was installed was one of the last to be stocked on the 1st October 2010. Figure 3.1 shows the minimum and maximum temperatures noted in Shed 7B by the farm operative as well as the independently measured shed temperature measured by the automated system installed for the purposes of this DA. Ambient temperature (as measured by a temperature probe on the BAM located next to the residence) is also shown. Analysis indicates that the temperature within the shed prior to the turkeys being brought in, was slightly warmer than ambient during the night-time, but was similar to ambient during the day time. This relationship is to be expected as the building acts to slow the loss of warmer air during the night. This comparison would indicate that the temperature probe was correctly calibrated; however, the measured temperature within the shed for the period in which the turkeys were in residence was significantly greater than the range of temperatures that the farm operative noted daily. This could be indicative that the temperature monitoring device used by the site operative was poorly maintained, or that it was in a different location to the independent temperature logger installed for the DA. After the turkeys had been removed on the 31st January 2011, the temperature regulation system by the farm operative within Shed 7B was switched off, though switched on again a few days later, before being switched off again. Observations as to the number of open vents were requested by BV, but not provided. As such, it was not possible to estimate at which points in time the vents were open during the study period. Furthermore, as the 16 sheds were stocked and emptied at different times, and the range of observed temperatures noted by the farm operatives was different for each of the 16 sheds, it is not possible to infer whether the vents were open on any of the other 15 sheds, even if some limited information is available for Shed 7B.

South Holland District Council LAQM PM 10 Detailed Assessment: Fleet Fen Farm
Bureau Veritas Air Quality BV/AQ/AGGX4116987/Report No. 2708 Final 20
Figure 3.1 Time series of the minimum, maximum and measured shed temperature of Shed 7B. Ambient exter nal temperature is also shown. The turkeys were stocked in the shed on the 1st October 2010 and removed on the 31 st January 2011.
-5
0
5
10
15
20
25
30
35
40
30 Aug 10
09 Sep 10
19 Sep 10
29 Sep 10
09 Oct 10
19 Oct 10
29 Oct 10
08 Nov 10
18 Nov 10
28 Nov 10
08 Dec 10
18 Dec 10
28 Dec 10
07 Jan 11
17 Jan 11
27 Jan 11
06 Feb 11
16 Feb 11
26 Feb 11
08 Mar 11
18 Mar 11
Date
Tem
pera
ture
/ o C
Minimum Reported Shed Temperature
Maximum Reported Shed Temperature
Measured Shed Temperature
Ambient Temperature
South Holland District Council LAQM PM 10 Detailed Assessment: Fleet Fen Farm
Bureau Veritas Air Quality BV/AQ/AGGX4116987/Report No. 2708 Final 21
3.2 Analysis of PM 10 concentrations and site activities
3.2.1 24 Hour Averages Figure 3.2 shows a time series of measured daily average PM10 concentrations at the turkey farm and background VCM corrected TEOMs. The incremental PM10 at the turkey farm is displayed on the secondary Y axis. The increment was calculated as the measured PM10 concentration at the turkey farm (corrected for temperature and pressure then divided by 1.273) minus the average of the two local VCM corrected background TEOMs. While there is evidence of an increased PM10 concentration at Spalding Monkshouse School relative to Westmere School in 2006, 2007 and 2008; during 2009 the reverse was true (Table 2.2). During both 2010 and the six month monitoring period, Spalding Monkshouse School VCM corrected TEOM read approximately 0.3 µg m-3 on average higher than the Westmere School VCM corrected TEOM. While this would suggest that it would be more reasonable to use Westmere School TEOM data as a background station; between the 14th and the 21st January this instrument was not operational, and as this period coincides with the cleaning out of the sheds, it is more appropriate to use the average of the two TEOMs. As the difference between the instruments was on average 0.3 µg m-3, this will only have a potential significance of 0.15 µg m-3 for 2010 - the year of assessment used herein. It is noted that occurrences of high measured PM10 concentration monitored at Fleet Fen Farm are typically coincident with high ambient background concentrations. The incremental PM10 concentration was on average 2.9 µg m-3 for the period of 10th September to 22nd September (i.e. prior to the birds being brought to site). This could be related to:
• proprietary works being undertaken by the farm operatives; • inherent differences between the monitoring methods used (BAM versus TEOMs); • local sources of PM10 such as farming and agricultural in general.
For the period between when turkeys were first brought to site on 23rd September 2010, and the monitor was removed on the 17th March 2011, the average incremental PM10 concentration (6 month mean) due to the turkey farm was 6.2 µg m-3. The range of the daily mean increment PM10 over this period was -5.3 µg m-3 to 21.2 µg m-3. Table 3.1 shows the PM10 concentration of the turkey farm BAM as well the PM10 concentration measured by the VCM corrected TEOMs; and the increment PM10 calculated as the Turkey Farm BAM minus the average of the VCM corrected TEOMs. Days on which the absolute PM10 concentration was greater than 50 µg m-3, or the increment PM10 concentration was greater than 10 µg m-3 are shaded red, in order to highlight those days where PM10 concentrations could be considered to be most significant. Significant site activity (such as the movement of a large number of birds, or the cleaning out of sheds) are also noted on the days on which they occurred. In the terminology used by the farm operatives, there are 16 sheds numbered 1A through 8B (Figure 2.1). The operator would check the feed hoppers and water supplies, as well as check and if necessary alter the temperature within the sheds, or remove birds. These activities were conducted on all days and were not considered significant in terms of identifying specific pollution episodes. However, days of high incremental PM10 due to the turkey farm were observed from the 5th to the 14th December 2010, coinciding with the period shortly after the removal of a large number of birds, and this may be indicative of initial clean-up operations which have not been reported to BV or SHDC. The dominant wind direction is listed and is calculated as being the 90 sector from which the wind was blowing for greater than 12 hours during the day. This is shaded red if the air mass was predominately from the west i.e. from the direction of the turkey rearing sheds. There is some correlation evident between increment PM10 and dominant wind direction, and this is particularly evident in the period 22nd November to 17th December.

South Holland District Council LAQM PM 10 Detailed Assessment: Fleet Fen Farm
Bureau Veritas Air Quality BV/AQ/AGGX4116987/Report No. 2708 Final 22
Figure 3.3 shows a time series of the measured incremental PM10 concentration due to the turkey farm, and the number of birds being farmed. There was very little correlation observed between these parameters. This finding suggests that the use of emission factors for PM10 release rates based on the number of birds present within the sheds would require caution at Fleet Fen Farm.
South Holland District Council PM10 Detailed Assessment: Fleet Fen Farm
Bureau Veritas Air Quality BV/AQ/AGGX4116987/Report No. 2708 Final 23
Figure 3.2 Time series of measured PM 10 concentrations at the turkey farm and background V CM corrected TEOMs. The increment PM 10 at the turkey farm is displayed on the secondary Y axi s.
0
10
20
30
40
50
60
70
80
30 Aug 10
09 Sep 10
19 Sep 10
29 Sep 10
09 Oct 10
19 Oct 10
29 Oct 10
08 Nov 10
18 Nov 10
28 Nov 10
08 Dec 10
18 Dec 10
28 Dec 10
07 Jan 11
17 Jan 11
27 Jan 11
06 Feb 11
16 Feb 11
26 Feb 11
08 Mar 11
18 Mar 11
Date
Mea
sure
d P
M10
/ µg
m-3
-50
-40
-30
-20
-10
0
10
20
30
Increment P
M10 / µg m
-3
Westmere School VCM Corrected TEOM / µg m-3 Spalding Monkshouse School VCM Corrected TEOM / µg m-3 Spalding Turkey BAM Conc / µg m-3 Increment due to Turkey Farm / µg m-3

South Holland District Council PM10 Detailed Assessment: Fleet Fen Farm
Bureau Veritas Air Quality BV/AQ/AGGX4116987/Report No. 2708 Final 24
Figure 3.3 Time series of measured increment PM 10 concentrations at the turkey farm and the total nu mber of turkeys being farmed.
0
10000
20000
30000
40000
50000
60000
70000
80000
90000
100000
110000
120000
09 Sep 2010
19 Sep 2010
29 Sep 2010
09 Oct 2010
19 Oct 2010
29 Oct 2010
08 Nov 2010
18 Nov 2010
28 Nov 2010
08 Dec 2010
18 Dec 2010
28 Dec 2010
07 Jan 2011
17 Jan 2011
27 Jan 2011
06 Feb 2011
16 Feb 2011
26 Feb 2011
08 Mar 2011
18 Mar 2011
Date
Num
ber o
f Bird
s
-2
0
2
4
6
8
10
12
14
16
18
20
22Increm
ent PM
10 / µg m-3
Number of Turkeys
Increment due to Turkey Farm / µg m-3

South Holland District Council LAQM PM 10 Detailed Assessment: Fleet Fen Farm
Bureau Veritas Air Quality BV/AQ/AGGX4116987/Report No. 2708 Final 25
Table 3.1 Daily Site Activity, PM 10 concentration of the Turkey Farm BAM, the VCM corrected TEOMs, and the increment PM 10 for the monitoring campaign.
DateTurkey Farm
BAM / µg m-3
Westmere School VCM Corrected TEOM / µg m-3
Spalding Monkhouse School VCM Corrected
TEOM / µg m-3
Average Background VCM Corrected TEOM
/ µg m-3
Increment due to Turkey Farm
/ µg m-3
Dominant Direction
Site Activity
10 September 2010 20.8 17.5 16.1 16.8 4.0 E11 September 2010 19.0 14.4 12.9 13.7 5.412 September 2010 14.2 10.4 10.0 10.2 4.1 S13 September 2010 16.8 17.0 14.9 15.9 0.9 S14 September 2010 15.6 12.6 11.0 11.8 3.9 S15 September 2010 15.2 10.8 11.0 10.9 4.3 S16 September 2010 13.0 8.3 9.3 8.8 4.2 S17 September 2010 11.7 9.9 11.4 10.6 1.1 S18 September 2010 9.5 9.8 9.6 9.7 -0.2 S19 September 2010 14.1 11.1 9.4 10.2 3.920 September 2010 16.6 11.0 10.8 10.9 5.7 S21 September 2010 22.2 21.0 19.2 20.1 2.1 E22 September 2010 21.8 23.2 22.5 22.9 -1.1 E23 September 2010 13.4 11.6 10.8 11.2 2.2 E 7498 Infant Turkeys moved in24 September 2010 14.2 8.0 8.2 8.1 6.1 S 45947 Infant Turkeys moved in25 September 2010 9.5 8.2 7.4 7.8 1.7 S26 September 2010 14.6 9.0 9.9 9.4 5.1 S27 September 2010 27.2 15.9 14.6 15.3 12.0 E28 September 2010 35.9 26.3 25.6 26.0 9.9 E 5331 Infant Turkeys moved in29 September 2010 21.0 13.8 13.2 13.5 7.5 E30 September 2010 17.7 12.2 12.2 12.2 5.6 S 7983 Infant Turkeys moved in
01 October 2010 14.0 10.8 9.0 9.9 4.1 E 23202 Infant Turkeys moved in02 October 2010 19.8 14.0 14.2 14.1 5.7 E03 October 2010 12.4 11.1 10.8 11.0 1.4 E04 October 2010 13.3 14.0 12.9 13.4 -0.1 E05 October 2010 23.1 16.1 14.2 15.2 7.9 E06 October 2010 18.4 11.3 11.3 7.1 E07 October 2010 24.1 16.8 18.4 17.6 6.5 E08 October 2010 50.7 41.7 43.7 42.7 8.0 E09 October 2010 50.0 39.2 42.9 41.0 9.0 E10 October 2010 48.4 34.5 38.4 36.5 12.0 E11 October 2010 29.6 25.8 26.3 26.0 3.6 E12 October 2010 14.7 13.9 13.9 0.813 October 2010 14.6 11.6 12.8 12.2 2.414 October 2010 27.7 15.3 19.9 17.6 10.1 W15 October 2010 25.2 15.1 16.0 15.6 9.6 W16 October 2010 15.0 12.2 14.6 13.4 1.6 W17 October 2010 20.5 14.1 15.2 14.6 5.8 W18 October 2010 23.7 16.8 16.5 16.7 7.0 W19 October 2010 21.3 13.2 11.6 12.4 8.9 W20 October 2010 19.4 8.5 9.5 9.0 10.4 W21 October 2010 15.6 10.4 10.5 10.4 5.2 W22 October 2010 11.7 10.9 11.7 11.3 0.323 October 2010 16.5 8.9 9.4 9.2 7.4 W24 October 2010 14.4 7.8 8.8 8.3 6.1 W25 October 2010 18.2 14.3 13.7 14.0 4.2 W26 October 2010 16.1 11.4 12.2 11.8 4.3 E27 October 2010 23.4 13.8 14.2 14.0 9.4 E28 October 2010 22.6 14.4 14.5 14.4 8.2 E29 October 2010 22.6 16.4 15.9 16.2 6.4 E30 October 2010 18.0 10.6 11.0 10.8 7.2 E31 October 2010 27.0 16.0 17.7 16.8 10.2 E
01 November 2010 34.9 24.6 25.1 24.9 10.0 W02 November 2010 35.3 19.4 19.1 19.2 16.1 E03 November 2010 18.2 11.7 10.9 11.3 6.904 November 2010 10.6 11.3 10.9 11.1 -0.6 W05 November 2010 18.2 16.2 14.4 15.3 2.9 W06 November 2010 30.8 39.3 28.2 33.7 -2.9 W07 November 2010 29.1 24.5 29.2 26.9 2.208 November 2010 13.8 12.0 12.2 12.1 1.8 E09 November 2010 12.4 6.7 6.6 6.6 5.7 E10 November 2010 20.2 9.3 8.7 9.0 11.2 W11 November 2010 17.1 11.2 10.9 11.0 6.112 November 2010 20.7 12.0 10.5 11.2 9.5 W13 November 2010 15.5 10.9 10.5 10.7 4.8 E14 November 2010 28.4 16.6 14.1 15.3 13.115 November 2010 25.0 19.6 18.1 18.8 6.2 E16 November 2010 30.0 26.0 22.7 24.4 5.6 E17 November 2010 33.6 23.7 23.6 23.6 10.0 E18 November 2010 26.8 19.0 17.9 18.5 8.4 E19 November 2010 20.2 14.8 14.0 14.4 5.9 E20 November 2010 20.4 13.4 16.3 14.9 5.5 W21 November 2010 12.6 8.9 8.4 8.6 4.0 W22 November 2010 14.6 10.1 9.9 10.0 4.623 November 2010 25.0 9.8 9.8 9.8 15.2 W 2173 Adult Turkeys removed24 November 2010 28.0 11.7 11.8 11.8 16.2 W 3564 Adult Turkeys removed25 November 2010 18.7 9.4 10.2 9.8 8.9 W26 November 2010 28.0 16.4 16.2 16.3 11.7 W27 November 2010 16.3 11.3 12.3 11.8 4.6 W28 November 2010 33.0 20.2 20.3 20.2 12.8 W29 November 2010 21.7 15.1 17.2 16.1 5.5 W30 November 2010 13.3 9.7 10.9 10.3 2.9 E 2600 Adult Turkeys removed01 December 2010 16.3 15.5 17.6 16.5 -0.2 E 2970 Adult Turkeys removed02 December 2010 16.8 11.8 13.9 12.8 4.0 E 2600 Adult Turkeys removed03 December 2010 29.4 23.0 21.0 22.0 7.4 E 3168 Adult Turkeys removed04 December 2010 18.2 15.6 14.5 15.1 3.2 E05 December 2010 39.4 18.5 17.8 18.2 21.2 W06 December 2010 41.0 29.9 28.1 29.0 12.0 W07 December 2010 48.9 37.7 32.9 35.3 13.6 W08 December 2010 27.7 15.9 13.7 14.8 12.9 W 11089 Adult Turkeys removed09 December 2010 32.6 13.2 12.1 12.6 19.9 W10 December 2010 28.6 15.4 14.2 14.8 13.8 W11 December 2010 35.1 14.2 13.7 13.9 21.1 W12 December 2010 31.4 17.2 17.8 17.5 14.0 W
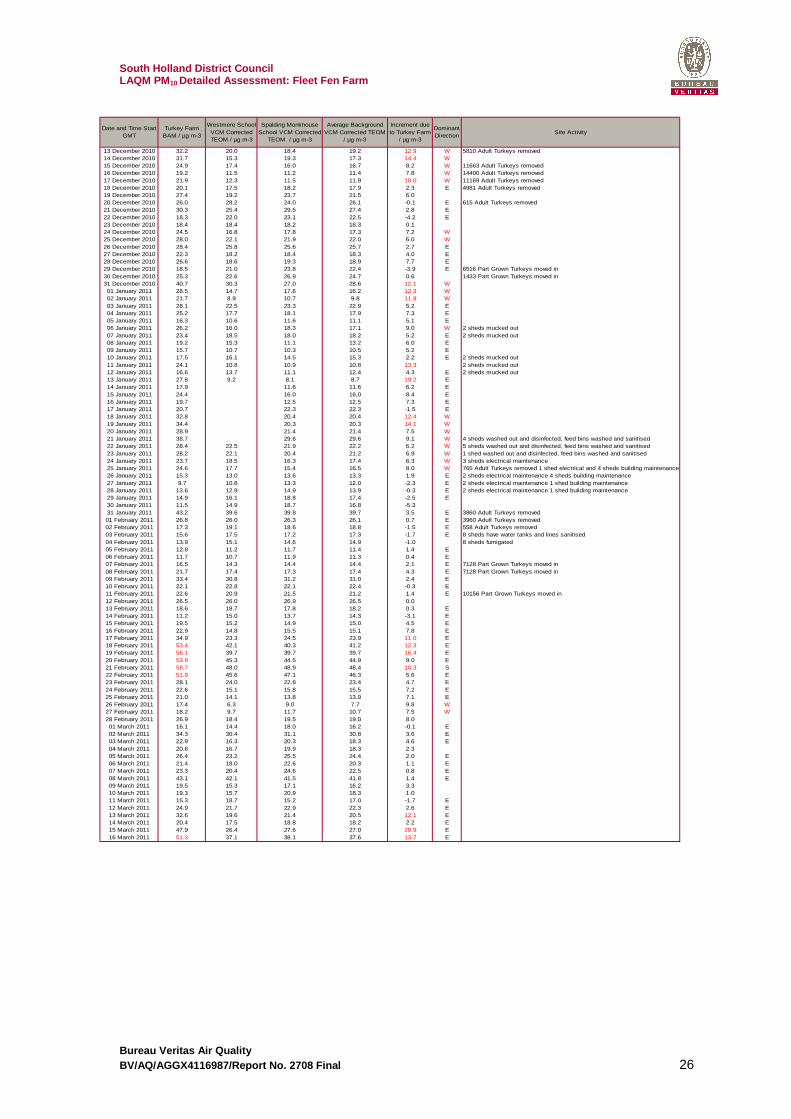
South Holland District Council LAQM PM 10 Detailed Assessment: Fleet Fen Farm
Bureau Veritas Air Quality BV/AQ/AGGX4116987/Report No. 2708 Final 26
Date and Time Start GMT
Turkey Farm BAM / µg m-3
Westmere School VCM Corrected TEOM / µg m-3
Spalding Monkhouse School VCM Corrected
TEOM / µg m-3
Average Background VCM Corrected TEOM
/ µg m-3
Increment due to Turkey Farm
/ µg m-3
Dominant Direction
Site Activity
13 December 2010 32.2 20.0 18.4 19.2 12.9 W 5810 Adult Turkeys removed14 December 2010 31.7 15.3 19.3 17.3 14.4 W15 December 2010 24.9 17.4 16.0 16.7 8.2 W 11663 Adult Turkeys removed16 December 2010 19.2 11.5 11.2 11.4 7.8 W 14400 Adult Turkeys removed17 December 2010 21.9 12.3 11.5 11.9 10.0 W 11169 Adult Turkeys removed18 December 2010 20.1 17.5 18.2 17.9 2.3 E 4981 Adult Turkeys removed19 December 2010 27.4 19.2 23.7 21.5 6.020 December 2010 26.0 28.2 24.0 26.1 -0.1 E 615 Adult Turkeys removed21 December 2010 30.3 25.4 29.5 27.4 2.8 E22 December 2010 18.3 22.0 23.1 22.5 -4.2 E23 December 2010 18.4 18.4 18.2 18.3 0.124 December 2010 24.5 16.8 17.8 17.3 7.2 W25 December 2010 28.0 22.1 21.9 22.0 6.0 W26 December 2010 28.4 25.8 25.6 25.7 2.7 E27 December 2010 22.3 18.2 18.4 18.3 4.0 E28 December 2010 26.6 18.6 19.3 18.9 7.7 E29 December 2010 18.5 21.0 23.8 22.4 -3.9 E 6516 Part Grown Turkeys moved in30 December 2010 25.3 22.6 26.9 24.7 0.6 1433 Part Grown Turkeys moved in31 December 2010 40.7 30.3 27.0 28.6 12.1 W01 January 2011 28.5 14.7 17.6 16.2 12.3 W02 January 2011 21.7 8.9 10.7 9.8 11.9 W03 January 2011 28.1 22.5 23.3 22.9 5.2 E04 January 2011 25.2 17.7 18.1 17.9 7.3 E05 January 2011 16.3 10.6 11.6 11.1 5.1 E06 January 2011 26.2 16.0 18.3 17.1 9.0 W 2 sheds mucked out07 January 2011 23.4 18.5 18.0 18.2 5.2 E 2 sheds mucked out08 January 2011 19.2 15.3 11.1 13.2 6.0 E09 January 2011 15.7 10.7 10.3 10.5 5.2 E10 January 2011 17.5 16.1 14.5 15.3 2.2 E 2 sheds mucked out11 January 2011 24.1 10.8 10.9 10.8 13.3 2 sheds mucked out12 January 2011 16.6 13.7 11.1 12.4 4.3 E 2 sheds mucked out13 January 2011 27.8 9.2 8.1 8.7 19.2 E14 January 2011 17.9 11.6 11.6 6.2 E15 January 2011 24.4 16.0 16.0 8.4 E16 January 2011 19.7 12.5 12.5 7.3 E17 January 2011 20.7 22.3 22.3 -1.5 E18 January 2011 32.8 20.4 20.4 12.4 W19 January 2011 34.4 20.3 20.3 14.1 W20 January 2011 28.9 21.4 21.4 7.5 W21 January 2011 38.7 29.6 29.6 9.1 W 4 sheds washed out and disinfected, feed bins washed and sanitised22 January 2011 28.4 22.5 21.9 22.2 6.2 W 5 sheds washed out and disinfected, feed bins washed and sanitised23 January 2011 28.2 22.1 20.4 21.2 6.9 W 1 shed washed out and disinfected, feed bins washed and sanitised24 January 2011 23.7 18.5 16.3 17.4 6.3 W 3 sheds electrical maintenance25 January 2011 24.6 17.7 15.4 16.5 8.0 W 765 Adult Turkeys removed 1 shed electrical and 4 sheds building maintenance26 January 2011 15.3 13.0 13.6 13.3 1.9 E 2 sheds electrical maintenance 4 sheds building maintenance27 January 2011 9.7 10.8 13.3 12.0 -2.3 E 2 sheds electrical maintenance 1 shed building maintenance28 January 2011 13.6 12.9 14.9 13.9 -0.3 E 2 sheds electrical maintenance 1 shed building maintenance29 January 2011 14.9 16.1 18.8 17.4 -2.5 E30 January 2011 11.5 14.9 18.7 16.8 -5.331 January 2011 43.2 39.6 39.8 39.7 3.5 E 3860 Adult Turkeys removed01 February 2011 26.8 26.0 26.3 26.1 0.7 E 3960 Adult Turkeys removed02 February 2011 17.3 19.1 18.6 18.8 -1.5 E 558 Adult Turkeys removed03 February 2011 15.6 17.5 17.2 17.3 -1.7 E 8 sheds have water tanks and lines sanitised04 February 2011 13.9 15.1 14.6 14.9 -1.0 8 sheds fumigated05 February 2011 12.8 11.2 11.7 11.4 1.4 E06 February 2011 11.7 10.7 11.9 11.3 0.4 E07 February 2011 16.5 14.3 14.4 14.4 2.1 E 7128 Part Grown Turkeys moved in08 February 2011 21.7 17.4 17.3 17.4 4.3 E 7128 Part Grown Turkeys moved in09 February 2011 33.4 30.8 31.2 31.0 2.4 E10 February 2011 22.1 22.8 22.1 22.4 -0.3 E11 February 2011 22.6 20.9 21.5 21.2 1.4 E 10156 Part Grown Turkeys moved in12 February 2011 26.5 26.0 26.9 26.5 0.013 February 2011 18.6 18.7 17.8 18.2 0.3 E14 February 2011 11.2 15.0 13.7 14.3 -3.1 E15 February 2011 19.5 15.2 14.9 15.0 4.5 E16 February 2011 22.9 14.8 15.5 15.1 7.8 E17 February 2011 34.9 23.3 24.5 23.9 11.0 E18 February 2011 53.4 42.1 40.3 41.2 12.3 E19 February 2011 56.1 39.7 39.7 39.7 16.4 E20 February 2011 53.9 45.3 44.5 44.9 9.0 E21 February 2011 58.7 48.0 48.9 48.4 10.3 S22 February 2011 51.9 45.6 47.1 46.3 5.6 E23 February 2011 28.1 24.0 22.8 23.4 4.7 E24 February 2011 22.6 15.1 15.8 15.5 7.2 E25 February 2011 21.0 14.1 13.8 13.9 7.1 E26 February 2011 17.4 6.3 9.0 7.7 9.8 W27 February 2011 18.2 9.7 11.7 10.7 7.5 W28 February 2011 26.9 18.4 19.5 19.0 8.001 March 2011 16.1 14.4 18.0 16.2 -0.1 E02 March 2011 34.3 30.4 31.1 30.8 3.6 E03 March 2011 22.9 16.3 20.3 18.3 4.6 E04 March 2011 20.6 16.7 19.9 18.3 2.305 March 2011 26.4 23.2 25.5 24.4 2.0 E06 March 2011 21.4 18.0 22.6 20.3 1.1 E07 March 2011 23.3 20.4 24.6 22.5 0.8 E08 March 2011 43.1 42.1 41.5 41.8 1.4 E09 March 2011 19.5 15.3 17.1 16.2 3.310 March 2011 19.3 15.7 20.9 18.3 1.011 March 2011 15.3 18.7 15.2 17.0 -1.7 E12 March 2011 24.9 21.7 22.9 22.3 2.6 E13 March 2011 32.6 19.6 21.4 20.5 12.1 E14 March 2011 20.4 17.5 18.8 18.2 2.2 E15 March 2011 47.9 26.4 27.6 27.0 20.9 E16 March 2011 51.3 37.1 38.1 37.6 13.7 E
South Holland District Council LAQM PM 10 Detailed Assessment: Fleet Fen Farm
Bureau Veritas Air Quality BV/AQ/AGGX4116987/Report No. 2708 Final 27
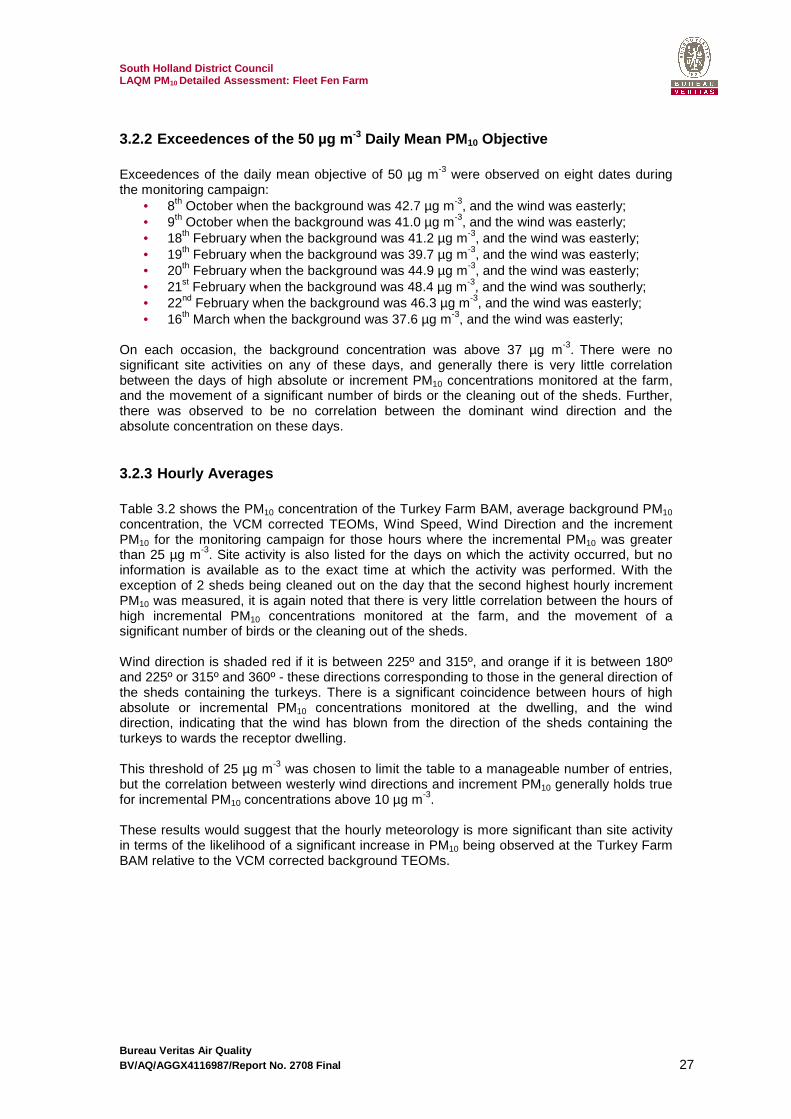
3.2.2 Exceedences of the 50 µg m -3 Daily Mean PM 10 Objective Exceedences of the daily mean objective of 50 µg m-3 were observed on eight dates during the monitoring campaign:
• 8th October when the background was 42.7 µg m-3, and the wind was easterly; • 9th October when the background was 41.0 µg m-3, and the wind was easterly; • 18th February when the background was 41.2 µg m-3, and the wind was easterly; • 19th February when the background was 39.7 µg m-3, and the wind was easterly; • 20th February when the background was 44.9 µg m-3, and the wind was easterly; • 21st February when the background was 48.4 µg m-3, and the wind was southerly; • 22nd February when the background was 46.3 µg m-3, and the wind was easterly; • 16th March when the background was 37.6 µg m-3, and the wind was easterly;
On each occasion, the background concentration was above 37 µg m-3. There were no significant site activities on any of these days, and generally there is very little correlation between the days of high absolute or increment PM10 concentrations monitored at the farm, and the movement of a significant number of birds or the cleaning out of the sheds. Further, there was observed to be no correlation between the dominant wind direction and the absolute concentration on these days.
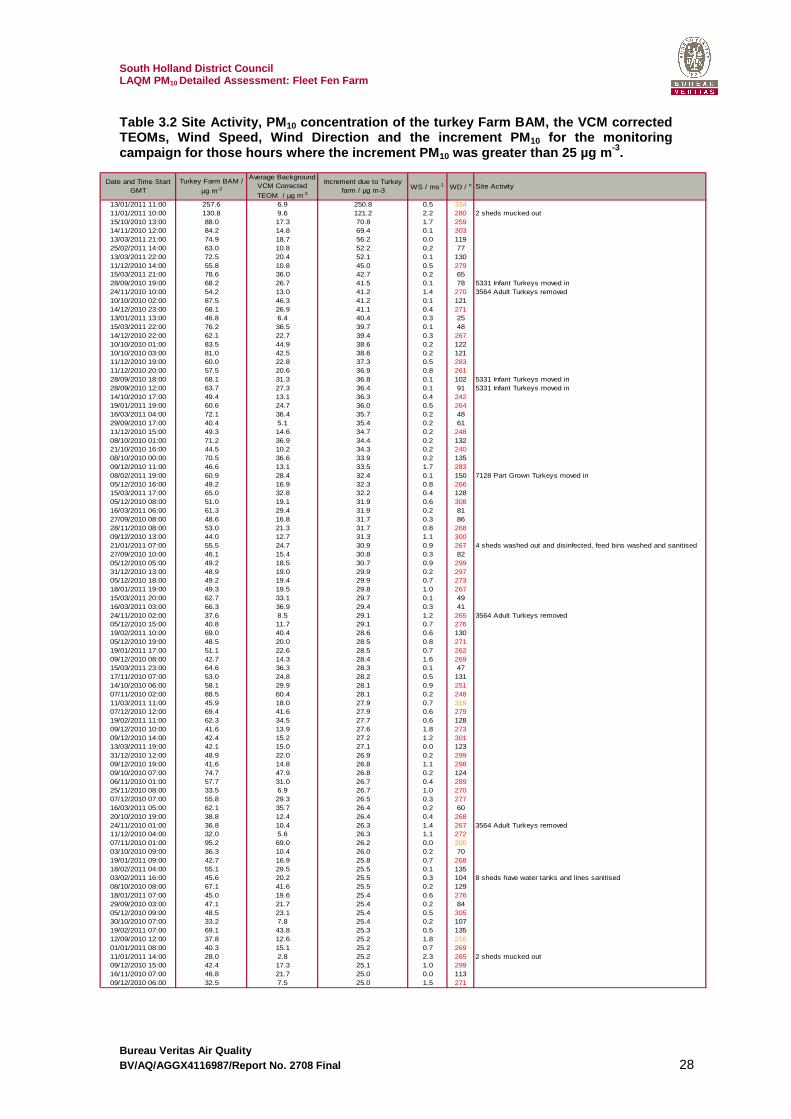
3.2.3 Hourly Averages Table 3.2 shows the PM10 concentration of the Turkey Farm BAM, average background PM10 concentration, the VCM corrected TEOMs, Wind Speed, Wind Direction and the increment PM10 for the monitoring campaign for those hours where the incremental PM10 was greater than 25 µg m-3. Site activity is also listed for the days on which the activity occurred, but no information is available as to the exact time at which the activity was performed. With the exception of 2 sheds being cleaned out on the day that the second highest hourly increment PM10 was measured, it is again noted that there is very little correlation between the hours of high incremental PM10 concentrations monitored at the farm, and the movement of a significant number of birds or the cleaning out of the sheds. Wind direction is shaded red if it is between 225º and 315º, and orange if it is between 180º and 225º or 315º and 360º - these directions corresponding to those in the general direction of the sheds containing the turkeys. There is a significant coincidence between hours of high absolute or incremental PM10 concentrations monitored at the dwelling, and the wind direction, indicating that the wind has blown from the direction of the sheds containing the turkeys to wards the receptor dwelling. This threshold of 25 µg m-3 was chosen to limit the table to a manageable number of entries, but the correlation between westerly wind directions and increment PM10 generally holds true for incremental PM10 concentrations above 10 µg m-3. These results would suggest that the hourly meteorology is more significant than site activity in terms of the likelihood of a significant increase in PM10 being observed at the Turkey Farm BAM relative to the VCM corrected background TEOMs.
South Holland District Council LAQM PM 10 Detailed Assessment: Fleet Fen Farm
Bureau Veritas Air Quality BV/AQ/AGGX4116987/Report No. 2708 Final 28
Table 3.2 Site Activity, PM 10 concentration of the turkey Farm BAM, the VCM corr ected TEOMs, Wind Speed, Wind Direction and the increment PM10 for the monitoring campaign for those hours where the increment PM 10 was greater than 25 µg m -3.
Date and Time Start GMT
Turkey Farm BAM /
µg m-3
Average Background VCM Corrected
TEOM / µg m-3
Increment due to Turkey farm / µg m-3 WS / ms-1 WD / o Site Activity
13/01/2011 11:00 257.6 6.9 250.8 0.5 33411/01/2011 10:00 130.8 9.6 121.2 2.2 280 2 sheds mucked out15/10/2010 13:00 88.0 17.3 70.8 1.7 25914/11/2010 12:00 84.2 14.8 69.4 0.1 30313/03/2011 21:00 74.9 18.7 56.2 0.0 11925/02/2011 14:00 63.0 10.8 52.2 0.2 7713/03/2011 22:00 72.5 20.4 52.1 0.1 13011/12/2010 14:00 55.8 10.8 45.0 0.5 27915/03/2011 21:00 78.6 36.0 42.7 0.2 6528/09/2010 19:00 68.2 26.7 41.5 0.1 78 5331 Infant Turkeys moved in24/11/2010 10:00 54.2 13.0 41.2 1.4 270 3564 Adult Turkeys removed10/10/2010 02:00 87.5 46.3 41.2 0.1 12114/12/2010 23:00 68.1 26.9 41.1 0.4 27113/01/2011 13:00 46.8 6.4 40.4 0.3 2515/03/2011 22:00 76.2 36.5 39.7 0.1 4814/12/2010 22:00 62.1 22.7 39.4 0.3 26710/10/2010 01:00 83.5 44.9 38.6 0.2 12210/10/2010 03:00 81.0 42.5 38.6 0.2 12111/12/2010 19:00 60.0 22.8 37.3 0.5 28311/12/2010 20:00 57.5 20.6 36.9 0.8 26128/09/2010 18:00 68.1 31.3 36.8 0.1 102 5331 Infant Turkeys moved in28/09/2010 12:00 63.7 27.3 36.4 0.1 91 5331 Infant Turkeys moved in14/10/2010 17:00 49.4 13.1 36.3 0.4 24219/01/2011 19:00 60.6 24.7 36.0 0.5 26416/03/2011 04:00 72.1 36.4 35.7 0.2 4829/09/2010 17:00 40.4 5.1 35.4 0.2 6111/12/2010 15:00 49.3 14.6 34.7 0.2 24808/10/2010 01:00 71.2 36.9 34.4 0.2 13221/10/2010 16:00 44.5 10.2 34.3 0.2 24008/10/2010 00:00 70.5 36.6 33.9 0.2 13509/12/2010 11:00 46.6 13.1 33.5 1.7 28308/02/2011 19:00 60.9 28.4 32.4 0.1 150 7128 Part Grown Turkeys moved in05/12/2010 16:00 49.2 16.9 32.3 0.8 26615/03/2011 17:00 65.0 32.8 32.2 0.4 12805/12/2010 08:00 51.0 19.1 31.9 0.6 30816/03/2011 06:00 61.3 29.4 31.9 0.2 8127/09/2010 08:00 48.6 16.8 31.7 0.3 8628/11/2010 08:00 53.0 21.3 31.7 0.8 26809/12/2010 13:00 44.0 12.7 31.3 1.1 30021/01/2011 07:00 55.5 24.7 30.9 0.9 267 4 sheds washed out and disinfected, feed bins washed and sanitised27/09/2010 10:00 46.1 15.4 30.8 0.3 8205/12/2010 05:00 49.2 18.5 30.7 0.9 29931/12/2010 13:00 48.9 19.0 29.9 0.2 29705/12/2010 18:00 49.2 19.4 29.9 0.7 27318/01/2011 19:00 49.3 19.5 29.8 1.0 26715/03/2011 20:00 62.7 33.1 29.7 0.1 4916/03/2011 03:00 66.3 36.9 29.4 0.3 4124/11/2010 02:00 37.6 8.5 29.1 1.2 265 3564 Adult Turkeys removed05/12/2010 15:00 40.8 11.7 29.1 0.7 27619/02/2011 10:00 69.0 40.4 28.6 0.6 13005/12/2010 19:00 48.5 20.0 28.5 0.8 27119/01/2011 17:00 51.1 22.6 28.5 0.7 26209/12/2010 08:00 42.7 14.3 28.4 1.6 26915/03/2011 23:00 64.6 36.3 28.3 0.1 4717/11/2010 07:00 53.0 24.8 28.2 0.5 13114/10/2010 06:00 58.1 29.9 28.1 0.9 25107/11/2010 02:00 88.5 60.4 28.1 0.2 24811/03/2011 11:00 45.9 18.0 27.9 0.7 31907/12/2010 12:00 69.4 41.6 27.9 0.6 27919/02/2011 11:00 62.3 34.5 27.7 0.6 12809/12/2010 10:00 41.6 13.9 27.6 1.8 27309/12/2010 14:00 42.4 15.2 27.2 1.2 30113/03/2011 19:00 42.1 15.0 27.1 0.0 12331/12/2010 12:00 48.9 22.0 26.9 0.2 29909/12/2010 19:00 41.6 14.8 26.8 1.1 29809/10/2010 07:00 74.7 47.9 26.8 0.2 12406/11/2010 01:00 57.7 31.0 26.7 0.4 28925/11/2010 08:00 33.5 6.9 26.7 1.0 27007/12/2010 07:00 55.8 29.3 26.5 0.3 27716/03/2011 05:00 62.1 35.7 26.4 0.2 6020/10/2010 19:00 38.8 12.4 26.4 0.4 26824/11/2010 01:00 36.8 10.4 26.3 1.4 267 3564 Adult Turkeys removed11/12/2010 04:00 32.0 5.6 26.3 1.1 27207/11/2010 01:00 95.2 69.0 26.2 0.0 20003/10/2010 09:00 36.3 10.4 26.0 0.2 7019/01/2011 09:00 42.7 16.9 25.8 0.7 26818/02/2011 04:00 55.1 29.5 25.5 0.1 13503/02/2011 16:00 45.6 20.2 25.5 0.3 104 8 sheds have water tanks and lines sanitised08/10/2010 08:00 67.1 41.6 25.5 0.2 12918/01/2011 07:00 45.0 19.6 25.4 0.6 27629/09/2010 03:00 47.1 21.7 25.4 0.2 8405/12/2010 09:00 48.5 23.1 25.4 0.5 30530/10/2010 07:00 33.2 7.8 25.4 0.2 10719/02/2011 07:00 69.1 43.8 25.3 0.5 13512/09/2010 12:00 37.8 12.6 25.2 1.8 21601/01/2011 08:00 40.3 15.1 25.2 0.7 26911/01/2011 14:00 28.0 2.8 25.2 2.3 265 2 sheds mucked out09/12/2010 15:00 42.4 17.3 25.1 1.0 29916/11/2010 07:00 46.8 21.7 25.0 0.0 11309/12/2010 06:00 32.5 7.5 25.0 1.5 271
South Holland District Council LAQM PM 10 Detailed Assessment: Fleet Fen Farm
Bureau Veritas Air Quality BV/AQ/AGGX4116987/Report No. 2708 Final 29
3.3 Analysis of statistical variation of measured and c alculated parameters
Openair14 was used to provide detailed analysis of the monitoring data as it provides powerful tools specifically of use when considering the influence of wind speed and wind direction upon measured concentrations. Figure A.3 in the Appendix shows a Summary Plot of Background PM10, Increment PM10, Measured PM10, Wind Direction and Wind Speed for the monitoring campaign. It is noted that there are 2 wind directions from which a significant percentage of the air masses were observed to originate, namely 130º and 280º. These results suggest that the restriction of airflow close to the house caused by the hedge and the house were not significant, as 130º was from the direction of the hedge. Periodic checks were done on directional data by cross-referencing the measured wind direction against that reported on the internet1516. However, the distribution of wind directions is different to that typically observed elsewhere in eastern England in previous years (Figure A.1 and Figure A.2). Local eddy effects are likely to prevail; however, as the wind directions observed at the monitoring station were representative of that at the dwelling, then it is correct to use the measured local wind direction in the analyses.
3.4 Analysis of PM 10 with wind speed and wind direction Figure 3.4 shows Polar Frequency Plots of Incremental PM10. Shading indicates the frequency of each bin, maximum PM10 and mean PM10 in each of the 3 diagrams in order. Degrees around the circle relate to the wind direction, and distance away from the centre of the circle corresponds to wind speed. The frequency distribution graph shows that a significant number of data points originated from a direction of approximately 130º at low wind speeds. At wind speeds greater than 1 ms-1, all data points originated from the west in the direction of the sheds containing the turkeys. The distribution of the mean and maximum increment PM10 concentrations are dominated by the few occurrences of high increment PM10 as detailed in Table 3.2. This observation can be partly explained as the largest single hourly incremental PM10 (250.8 µg m-3 observed on the 13th January 2011 at 11:00 with a wind direction of 334 degrees and a wind speed of 0.5 ms-1) has a second data point in the same wind speed and wind direction bin (-14.4 µg m-3 observed on the 1st February 2011 at 13:00 with a wind direction of 328 degrees and a wind speed of 0.5 ms-1). As such, this particular sector is still significant when the minimum number of data points is set to 2. Figure A.4 in the Appendix shows Polar Frequency Plots of mean Increment PM10 for each month of the monitoring campaign.
14 Openair: Open-source tools for the analysis of air pollution data, David Carslaw and Karl Ropkins (2011), R package version 0.4-18. 15 http://www.xcweather.co.uk/forecast/spalding 16 http://www.metcheck.com/V40/UK/FREE/today.asp?zipcode=spalding
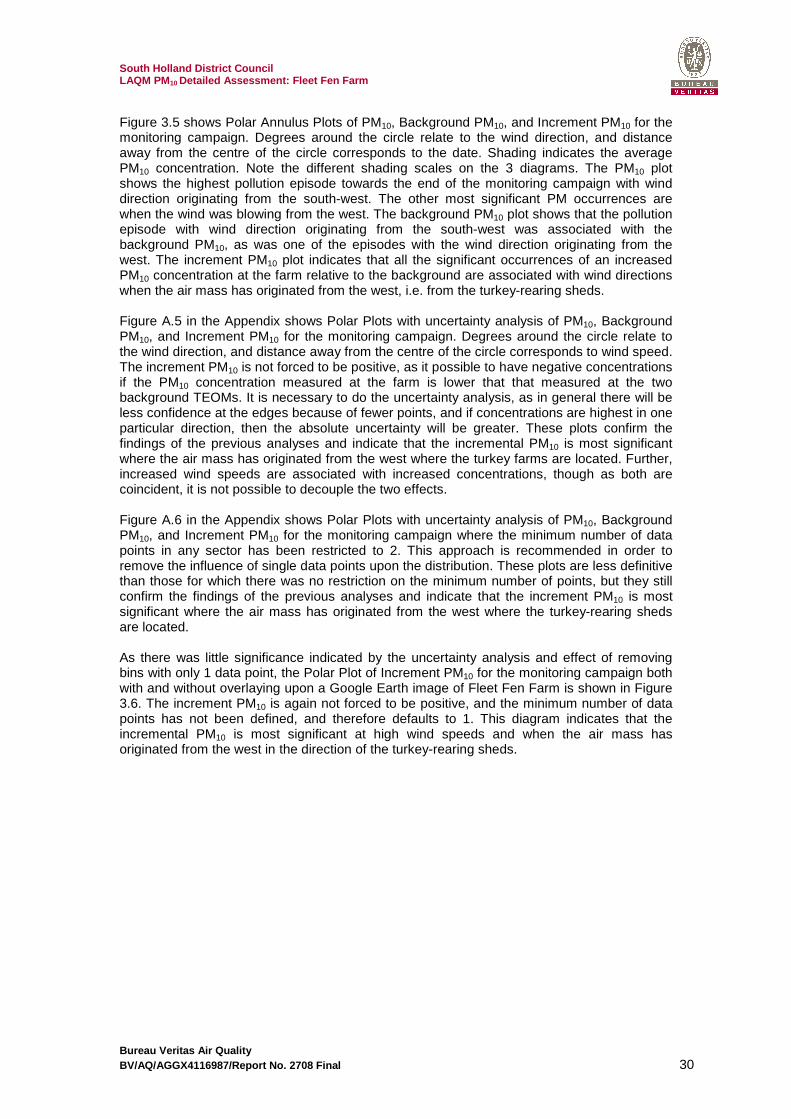
South Holland District Council LAQM PM 10 Detailed Assessment: Fleet Fen Farm
Bureau Veritas Air Quality BV/AQ/AGGX4116987/Report No. 2708 Final 30
Figure 3.5 shows Polar Annulus Plots of PM10, Background PM10, and Increment PM10 for the monitoring campaign. Degrees around the circle relate to the wind direction, and distance away from the centre of the circle corresponds to the date. Shading indicates the average PM10 concentration. Note the different shading scales on the 3 diagrams. The PM10 plot shows the highest pollution episode towards the end of the monitoring campaign with wind direction originating from the south-west. The other most significant PM occurrences are when the wind was blowing from the west. The background PM10 plot shows that the pollution episode with wind direction originating from the south-west was associated with the background PM10, as was one of the episodes with the wind direction originating from the west. The increment PM10 plot indicates that all the significant occurrences of an increased PM10 concentration at the farm relative to the background are associated with wind directions when the air mass has originated from the west, i.e. from the turkey-rearing sheds. Figure A.5 in the Appendix shows Polar Plots with uncertainty analysis of PM10, Background PM10, and Increment PM10 for the monitoring campaign. Degrees around the circle relate to the wind direction, and distance away from the centre of the circle corresponds to wind speed. The increment PM10 is not forced to be positive, as it possible to have negative concentrations if the PM10 concentration measured at the farm is lower that that measured at the two background TEOMs. It is necessary to do the uncertainty analysis, as in general there will be less confidence at the edges because of fewer points, and if concentrations are highest in one particular direction, then the absolute uncertainty will be greater. These plots confirm the findings of the previous analyses and indicate that the incremental PM10 is most significant where the air mass has originated from the west where the turkey farms are located. Further, increased wind speeds are associated with increased concentrations, though as both are coincident, it is not possible to decouple the two effects. Figure A.6 in the Appendix shows Polar Plots with uncertainty analysis of PM10, Background PM10, and Increment PM10 for the monitoring campaign where the minimum number of data points in any sector has been restricted to 2. This approach is recommended in order to remove the influence of single data points upon the distribution. These plots are less definitive than those for which there was no restriction on the minimum number of points, but they still confirm the findings of the previous analyses and indicate that the increment PM10 is most significant where the air mass has originated from the west where the turkey-rearing sheds are located. As there was little significance indicated by the uncertainty analysis and effect of removing bins with only 1 data point, the Polar Plot of Increment PM10 for the monitoring campaign both with and without overlaying upon a Google Earth image of Fleet Fen Farm is shown in Figure 3.6. The increment PM10 is again not forced to be positive, and the minimum number of data points has not been defined, and therefore defaults to 1. This diagram indicates that the incremental PM10 is most significant at high wind speeds and when the air mass has originated from the west in the direction of the turkey-rearing sheds.
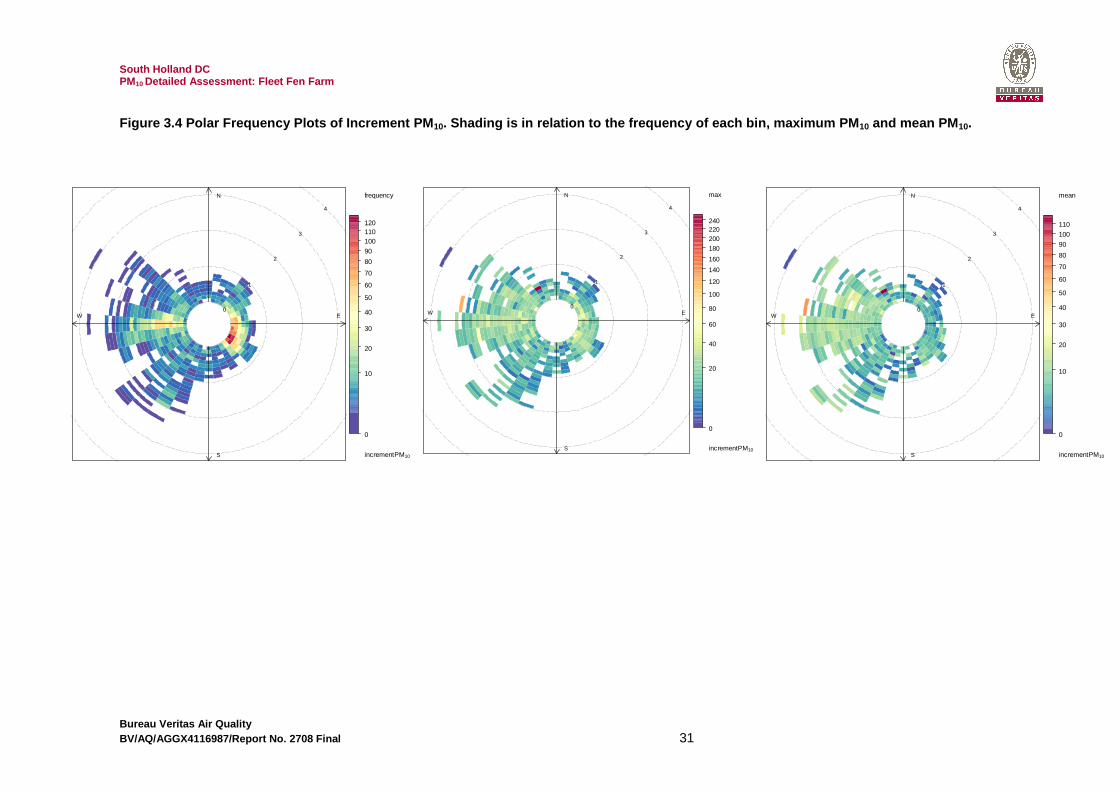
South Holland DC PM10 Detailed Assessment: Fleet Fen Farm
Bureau Veritas Air Quality BV/AQ/AGGX4116987/Report No. 2708 Final 31
Figure 3.4 Polar Frequency Plots of Increment PM 10. Shading is in relation to the frequency of each b in, maximum PM 10 and mean PM 10.
0
1
2
3
4
W
S
N
E
mean
incrementPM10
0
10
20
30
40
50
60
70
80
90
100
110
0
1
2
3
4
W
S
N
E
max
incrementPM10
0
20
40
60
80
100
120
140
160
180
200220240
0
1
2
3
4
W
S
N
E
frequency
incrementPM10
0
10
20
30
40
50
60
70
80
90
100110120
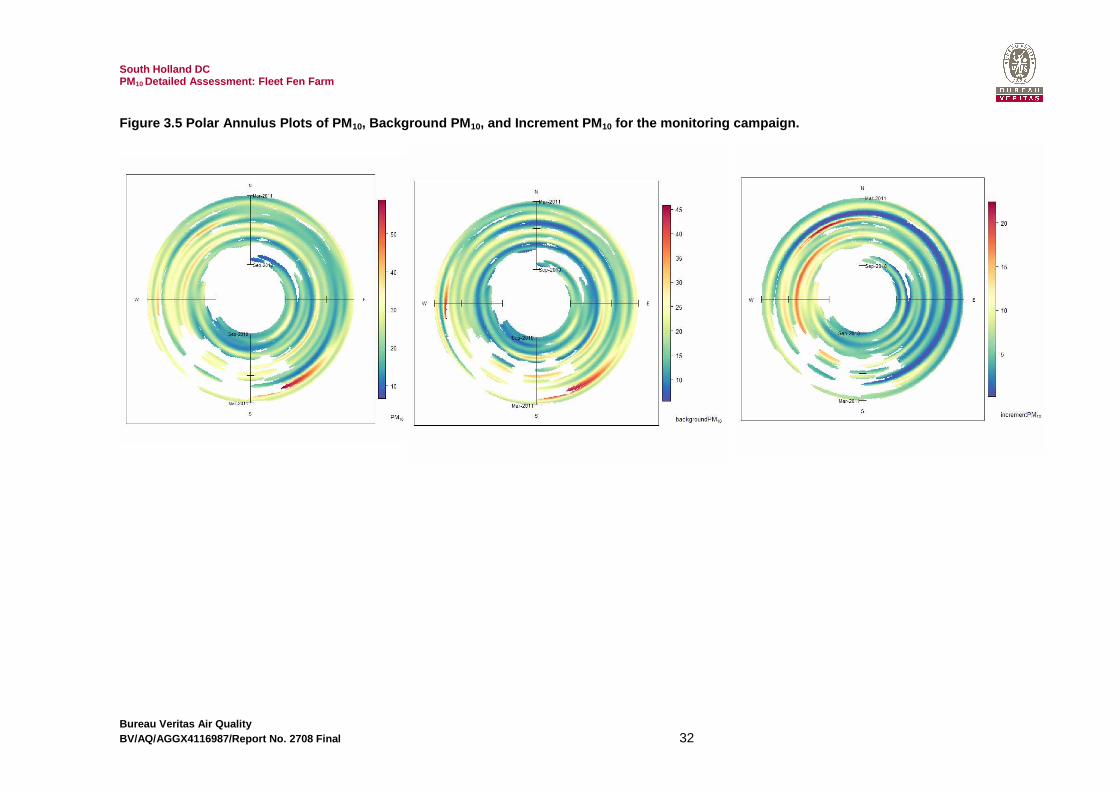
South Holland DC PM10 Detailed Assessment: Fleet Fen Farm
Bureau Veritas Air Quality BV/AQ/AGGX4116987/Report No. 2708 Final 32
Figure 3.5 Polar Annulus Plots of PM 10, Background PM 10, and Increment PM 10 for the monitoring campaign.
South Holland DC PM10 Detailed Assessment: Fleet Fen Farm
Bureau Veritas Air Quality BV/AQ/AGGX4116987/Report No. 2708 Final 33
Figure 3.6 Polar Plot of Increment PM 10 for the monitoring campaign both with and without overlaying upon an aerial image of Fleet Fe n Farm. The increment PM 10 is not forced to be positive.
1
2
3 (m/s)
4
5
W
S
N
E
incrementPM10
-5
0
5
10
15
South Holland DC PM10 Detailed Assessment: Fleet Fen Farm
Bureau Veritas Air Quality BV/AQ/AGGX4116987/Report No. 2708 Final 34
4 Applicability of Results The 6 month mean incremental PM10 concentration due to the turkey farm was 6.2 µg m-3 for the period when turkeys were first brought to site on 23rd September 2010, and the monitor was removed on 17th March 2011. For 2010, the annual average of the two VCM corrected background TEOMs was 17.0 µg m-3. If turkey rearing had been conducted for an entire year, the theoretical annual average (including background) would be 23.2 µg m-3; this is comfortably below the 40 µg m-3 air quality objective. Based on the previous five years of urban background monitoring data (Table 2.2), it is unlikely that the background PM10 plus the increment due to the turkey farm would approach the annual mean air quality objective. The maximum increment on the 24 hour mean PM10 relative to the background VCM corrected TEOMs was 21.2 µg m-3 observed on the 5th December 2010. Making the assumption that this is the highest daily mean increment that the turkey farm can have upon the ambient concentrations, the background concentration required in order to result in an exceedence of the PM10 threshold of 50 µg m-3 would be 28.8 µg m-3. Throughout 2010, the total number of days that the average of the two VCM corrected background TEOMs exceeded 28.8 µg m-3 was 21 days (with 340 days of data collected). No days were greater than the PM10 threshold of 50 µg m-3. This would indicate that as a worst-case scenario, the maximum number of exceedences of the PM10 threshold of 50 µg m-3 is 21 for 2010. This would comply with the daily mean air quality objective which allows for 35 exceedences. However, there are a number of important factors to consider when applying the results for the 6 month monitoring period to other timeframes and locations:
1. The monitoring as part of this study measured PM 10 concentrations only during winter months (September – March):
It is important to consider how the PM10 concentrations could vary with season and stocking levels. Table 2.1 lists the historic stocking levels at Fleet Fen Farm as provided by the SOC. It is noted that in 2009, in addition to the pre-Christmas stocking cycle, there was an additional cycle during the summer. As the increased ambient temperatures could lead to an increase in the internal temperature of the sheds, it is more likely that a greater number of vents would be open, which would increase the emissions of particulates to the outside environment. Typically within the UK, and as also observed in the 2010 SHDC urban background TEOM data, the highest background concentrations are observed in autumn, winter and spring. This would suggest that whilst source contribution is likely to be greater in the summer; the likelihood of exceeding the PM10 threshold of 50 µg m-3 is lower in summer, because the background PM10 concentrations are typically lower during the summer in the UK.
2. During the monitoring campaign, only 10 of the 1 6 sheds were cleaned out
As partly-grown birds were moved in to the remaining 6 sheds after the initial birds had been removed for slaughter, all major site works (i.e. the removal of birds; the mucking out of sheds; the washing out and disinfecting; washing and sanitising feed bins; fumigation; the sanitation of water tanks and electrical; and building maintenance) were conducted at a rate of 2 to 8 sheds per day. As such, it could be considered that while the clean up of 16 sheds (as opposed to 10) would increase PM10 emissions, this source would be spread out over a greater number of days.
3. The monitoring station was located in a partiall y restricted area which would limit the flow of air Whilst the monitoring station was located in an area with a large hedge to the east, and a house to the south, there was unimpeded air flow originating from the west i.e. from the direction of the turkey rearing sheds. The air masses reaching the
South Holland DC PM10 Detailed Assessment: Fleet Fen Farm
Bureau Veritas Air Quality BV/AQ/AGGX4116987/Report No. 2708 Final 35
monitoring station were representative of those at the receptor dwelling, and as such it is correct to use the meteorological data collected on the BAM for analyses of the effect of wind direction upon pollutant concentrations at the dwelling.
4. Chapel End turkey farm (at Sutton St. Edmund) al so has a capacity of
145,000 birds. While the residential property at Sutton St. Edmund is closer to the turkey rearing sheds (16 m) than that at Fleet Fen Farm (43 m), it was noted that the dominant wind direction (Figure A.1 and Figure A.2 in the Appendix) at Sutton St. Edmund does not place the dwelling downwind of the source. The results of this study have shown that wind direction is the dominant factor in determining the impact of PM10 from the turkey-rearing sheds at the sensitive receptor. Therefore, this DA pertaining to Fleet Fen Farm presents a worst-case assessment for impacts across these two locations.
5. During the monitoring period, a maximum of 89,96 1 birds were being reared,
which is fewer than the requisite 100,000 birds for a DA, and far fewer than the 145,000 capacity. Due to factors outside of the control of BV and SHDC, fewer than the requisite 100,000 birds were being reared during the study period. The actual number of birds was only 10% lower than 100,000, but was 30% lower than the 2009-10 stocking level of 130,000 (Table 2.1), and 38% lower than the maximum capacity of 145,000 birds. It was noted that in Figure 3.3 there was no direct relationship between the number of turkeys being farmed and the measured incremental PM10 concentration due to the farm. However, it is useful to discuss semi-quantitatively the likely impact of a greater number of turkeys being reared. Assuming that there may in fact be a linear relationship between emissions and number of birds (as indicated by generic EA guidance on intensive livestock rearing, though not evident in the data collected herein (Figure 3.3)), the emissions may be scaled and the theoretical maximum number of days of exceedence of the daily mean PM10 air quality objective can be estimated as 29 days, 91 days and 163 days for 100,000, 130,000 and 145,000 birds respectively. While these figures represent the number of days on which it may be possible to have an exceedence of 50 µg m-3, it is not possible to have an exceedence on all of these days as the magnitude of the incremental PM10 was only potentially significant for a few days during the monitoring period, not during every day that the background PM10 reached the necessary threshold. Table 4.1 shows the calculations for the number of days on which the measured or scaled incremental PM10 would lead to a potential exceedence of the 50 µg m-3 threshold for the 20 highest measured or scaled PM10 increments. In addition, the 90.4th percentile is shown, which represents the 35th highest measured or scaled PM10 increment assuming 365 days data capture. This analysis shows that even allowing for scaled PM10 increments (representing higher stocking levels), the risk of breaching the daily mean PM10 air quality objective (which allows 35 exceedences of 50 µg m-3) is low. The potential impact of the turkey farm upon the number of exceedences of the 50 µg m-3 threshold may be more significant in years with a higher PM10 background concentration than 2010 - the year of assessment used herein. In terms of the annual average, scaling from 89,961 to 145,000 birds would result in a theoretical increment PM10 of 10.0 µg m-3, which when added to the highest annual average in recent years of 19.6 µg m-3 for 2007, would result in an annual
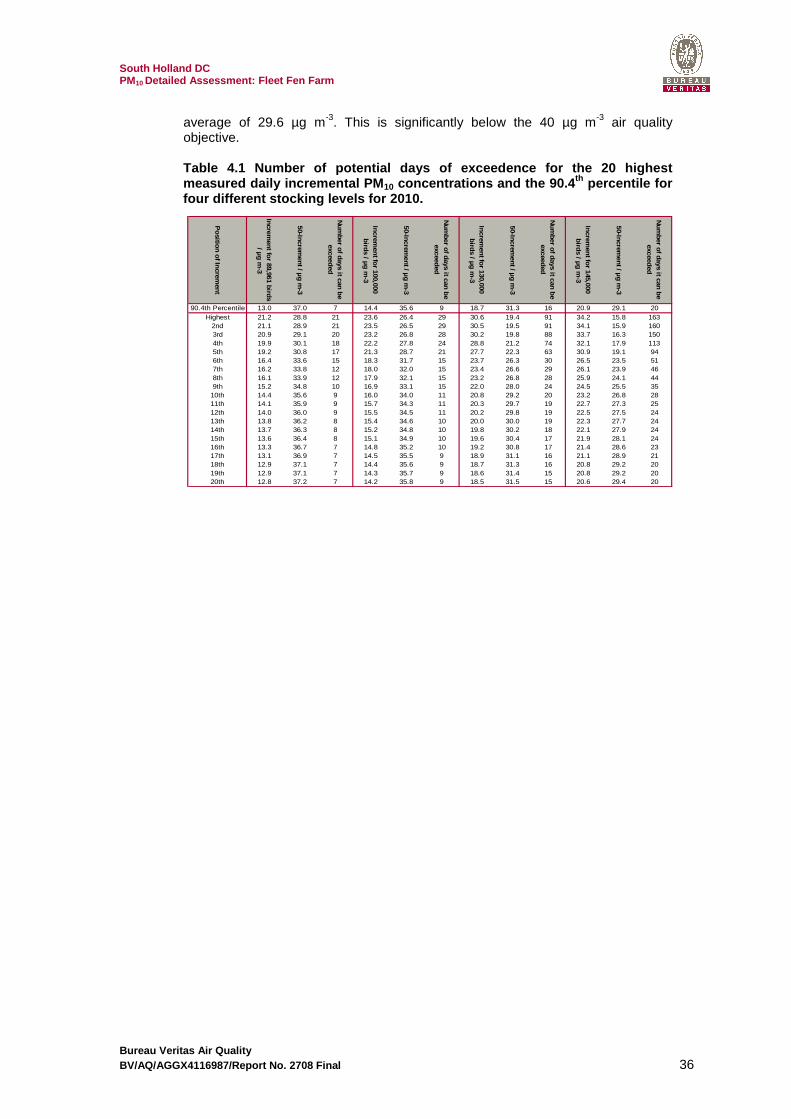
South Holland DC PM10 Detailed Assessment: Fleet Fen Farm
Bureau Veritas Air Quality BV/AQ/AGGX4116987/Report No. 2708 Final 36
average of 29.6 µg m-3. This is significantly below the 40 µg m-3 air quality objective. Table 4.1 Number of potential days of exceedence fo r the 20 highest measured daily incremental PM 10 concentrations and the 90.4 th percentile for four different stocking levels for 2010.
Position of Increm
ent
Increment for 89,961 birds
/ µg m-3
50-Increment / µg m
-3
Num
ber of days it can be exceeded
Increment for 100,000
birds / µg m-3
50-Increment / µg m
-3
Num
ber of days it can be exceeded
Increment for 130,000
birds / µg m-3
50-Increment / µg m
-3
Num
ber of days it can be exceeded
Increment for 145,000
birds / µg m-3
50-Increment / µg m
-3
Num
ber of days it can be exceeded
90.4th Percentile 13.0 37.0 7 14.4 35.6 9 18.7 31.3 16 20.9 29.1 20Highest 21.2 28.8 21 23.6 26.4 29 30.6 19.4 91 34.2 15.8 163
2nd 21.1 28.9 21 23.5 26.5 29 30.5 19.5 91 34.1 15.9 1603rd 20.9 29.1 20 23.2 26.8 28 30.2 19.8 88 33.7 16.3 1504th 19.9 30.1 18 22.2 27.8 24 28.8 21.2 74 32.1 17.9 1135th 19.2 30.8 17 21.3 28.7 21 27.7 22.3 63 30.9 19.1 946th 16.4 33.6 15 18.3 31.7 15 23.7 26.3 30 26.5 23.5 517th 16.2 33.8 12 18.0 32.0 15 23.4 26.6 29 26.1 23.9 468th 16.1 33.9 12 17.9 32.1 15 23.2 26.8 28 25.9 24.1 449th 15.2 34.8 10 16.9 33.1 15 22.0 28.0 24 24.5 25.5 35
10th 14.4 35.6 9 16.0 34.0 11 20.8 29.2 20 23.2 26.8 2811th 14.1 35.9 9 15.7 34.3 11 20.3 29.7 19 22.7 27.3 2512th 14.0 36.0 9 15.5 34.5 11 20.2 29.8 19 22.5 27.5 2413th 13.8 36.2 8 15.4 34.6 10 20.0 30.0 19 22.3 27.7 2414th 13.7 36.3 8 15.2 34.8 10 19.8 30.2 18 22.1 27.9 2415th 13.6 36.4 8 15.1 34.9 10 19.6 30.4 17 21.9 28.1 2416th 13.3 36.7 7 14.8 35.2 10 19.2 30.8 17 21.4 28.6 2317th 13.1 36.9 7 14.5 35.5 9 18.9 31.1 16 21.1 28.9 2118th 12.9 37.1 7 14.4 35.6 9 18.7 31.3 16 20.8 29.2 2019th 12.9 37.1 7 14.3 35.7 9 18.6 31.4 15 20.8 29.2 2020th 12.8 37.2 7 14.2 35.8 9 18.5 31.5 15 20.6 29.4 20

South Holland DC PM10 Detailed Assessment: Fleet Fen Farm
Bureau Veritas Air Quality BV/AQ/AGGX4116987/Report No. 2708 Final 37
5 Conclusions As part of the Local Air Quality Management (LAQM) regime a Detailed Assessment for PM10 has been carried out for Fleet Fen Farm, near Holbeach in South Holland district. The DA was required following the findings and recommendations within the Council’s Updating and Screening Assessment (USA) 2009, which identified the maximum number of turkeys reared at Fleet Fen Farm in 2009 as exceeding the screening criteria in LAQM.TG(09). The turkey farm studied in this report was chosen as being one of two recommended for a DA in the USA with a capacity of 145,000, and where the operator of the site lived within the site boundary predominately down-wind of the turkey-rearing sheds. As such, this site could be considered to be a worst-case scenario within SHDC. However, it is not possible to extrapolate the results herein to the operation of other types of poultry farms, as their operating procedures, proximity of sensitive properties and PM10 emission rates can be significantly different. The findings of this Detailed Assessment are as follows:
• Based on the 6 month monitoring study, and assuming that the turkey-rearing activities over the 6 month winter monitoring period are representative of summer months also, the measured total ambient concentrations of PM10 comply with both the annual mean and 24 hour mean AQS objectives at the closest relevant location for exposure, namely the dwelling 43 m from the turkey-rearing sheds.
• The measured average incremental PM10 was 6.2 µg m-3 above background, and
results in an annual average of approximately 25 µg m-3, including background annual mean PM10 based on monitoring data over the previous 5 years.
• The maximum increment on the 24 hour PM10 measured relative to the background
VCM corrected TEOMs was 21.2 µg m-3 observed on the 5th December 2010. Making the assumption that this is the highest increment that the turkey farm can have upon the ambient concentrations, the background concentration required in order to result in an exceedence of the PM10 threshold of 50 µg m-3 is 28.8 µg m-3. Throughout 2010, the total number of days that the average of the two VCM corrected background TEOMs exceeded 28.8 µg m-3 was 21 days (with 340 days of data collected). No days were greater than the PM10 threshold of 50 µg m-3. This would indicate that as a worst-case scenario, the maximum number of exceedences of the PM10 threshold of 50 µg m-3 is 21 for 2010.
• A semi-quantitative extrapolation of these monitoring dates to project PM10 annual
mean and daily mean concentrations for higher bird stocking levels has been attempted. These extrapolations include an assumption of a linear relationship between stocking level and PM10 emission (consistent with the normal use emission factors for intensive livestock farming) which however is not supported by the findings of the monitoring at Fleet Fen Farm. Even allowing for the worst-case approach for estimating the PM10 impact of the sheds at Fleet Fen Farm with a greater number of turkeys reared over a year, breaches of the statutory air quality objectives for PM10 are unlikely. This arises mainly from the low probability of high background PM10 concentrations coinciding with a high source (i.e. shed) contribution at the receptor dwelling (determined mainly by the wind direction) on an hourly and daily basis.
On the basis of this study, it is concluded that emissions of PM10 from the turkey-rearing units at Fleet Fen Farm, allowing for seasonal and occupancy factors, do not present a significant risk of breaching the statutory Air Quality Strategy objectives for PM10. While the residential property at Sutton St. Edmund is closer to the turkey rearing sheds than that at Fleet Fen Farm, it was noted that the dominant wind at Sutton St. Edmund does not place the dwelling downwind of the source. The results of this study have shown that wind direction is the
South Holland DC PM10 Detailed Assessment: Fleet Fen Farm
Bureau Veritas Air Quality BV/AQ/AGGX4116987/Report No. 2708 Final 38
dominant factor in determining the impact of PM10 form the turkey-rearing sheds at the sensitive receptor. Based on the results presented herein, Bureau Veritas recommend that there is no need to declare an AQMA based on these findings.
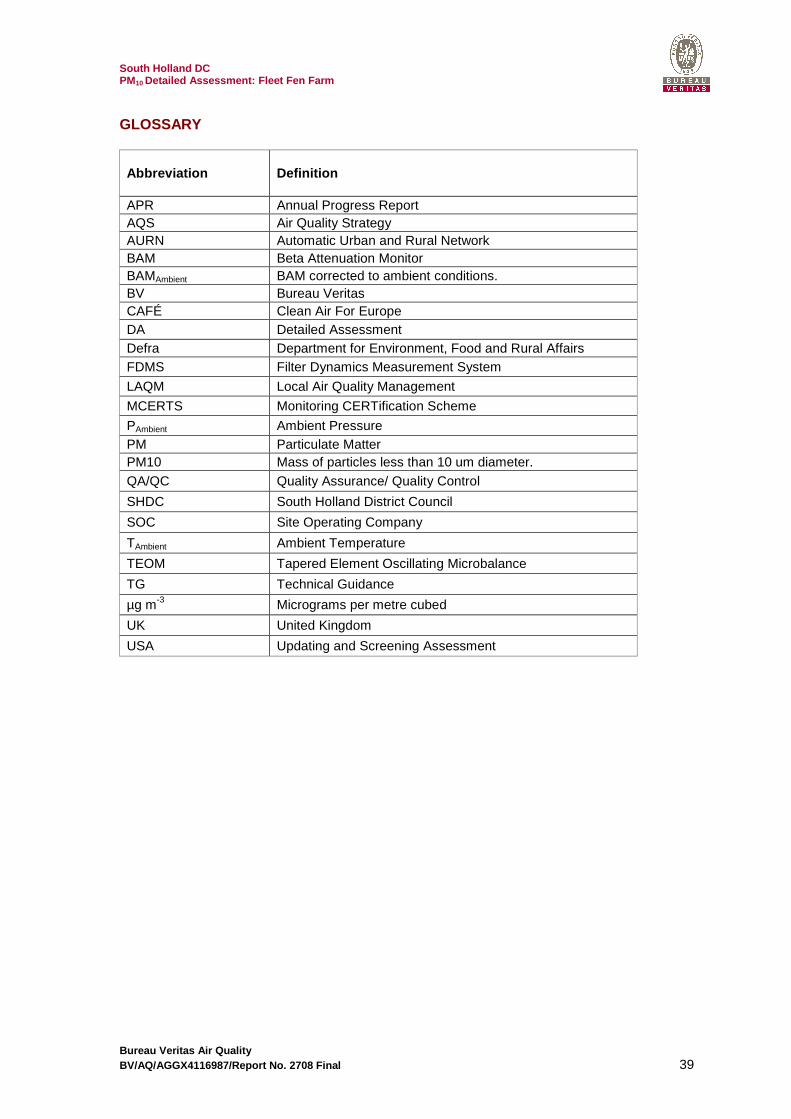
South Holland DC PM10 Detailed Assessment: Fleet Fen Farm
Bureau Veritas Air Quality BV/AQ/AGGX4116987/Report No. 2708 Final 39
GLOSSARY
Abbreviation Definition
APR Annual Progress Report AQS Air Quality Strategy AURN Automatic Urban and Rural Network BAM Beta Attenuation Monitor BAMAmbient BAM corrected to ambient conditions. BV Bureau Veritas CAFÉ Clean Air For Europe DA Detailed Assessment Defra Department for Environment, Food and Rural Affairs FDMS Filter Dynamics Measurement System
LAQM Local Air Quality Management
MCERTS Monitoring CERTification Scheme
PAmbient Ambient Pressure PM Particulate Matter PM10 Mass of particles less than 10 um diameter. QA/QC Quality Assurance/ Quality Control
SHDC South Holland District Council
SOC Site Operating Company
TAmbient Ambient Temperature
TEOM Tapered Element Oscillating Microbalance
TG Technical Guidance
µg m-3 Micrograms per metre cubed
UK United Kingdom
USA Updating and Screening Assessment

South Holland DC PM10 Detailed Assessment: Fleet Fen Farm
Bureau Veritas Air Quality BV/AQ/AGGX4116987/Report No. 2708 Final 40
Appendix: Additional Figures
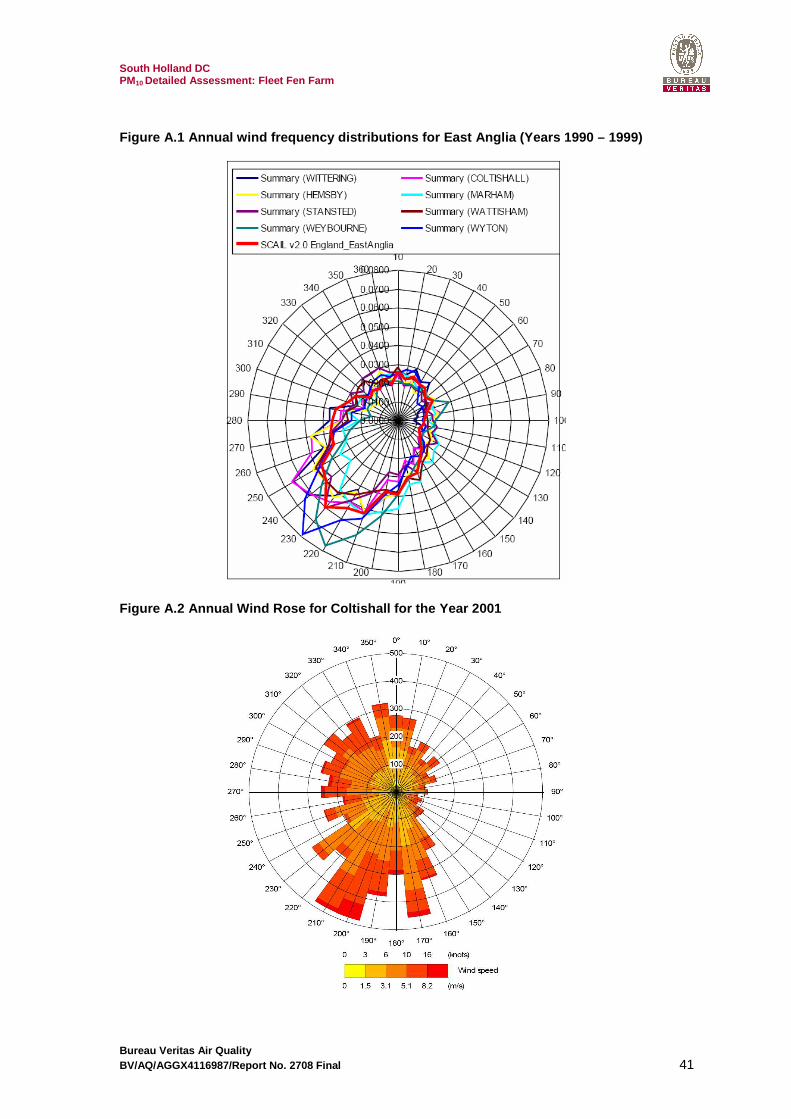
South Holland DC PM10 Detailed Assessment: Fleet Fen Farm
Bureau Veritas Air Quality BV/AQ/AGGX4116987/Report No. 2708 Final 41
Figure A.1 Annual wind frequency distributions for East Anglia (Years 1990 – 1999)
Figure A.2 Annual Wind Rose for Coltishall for the Year 2001
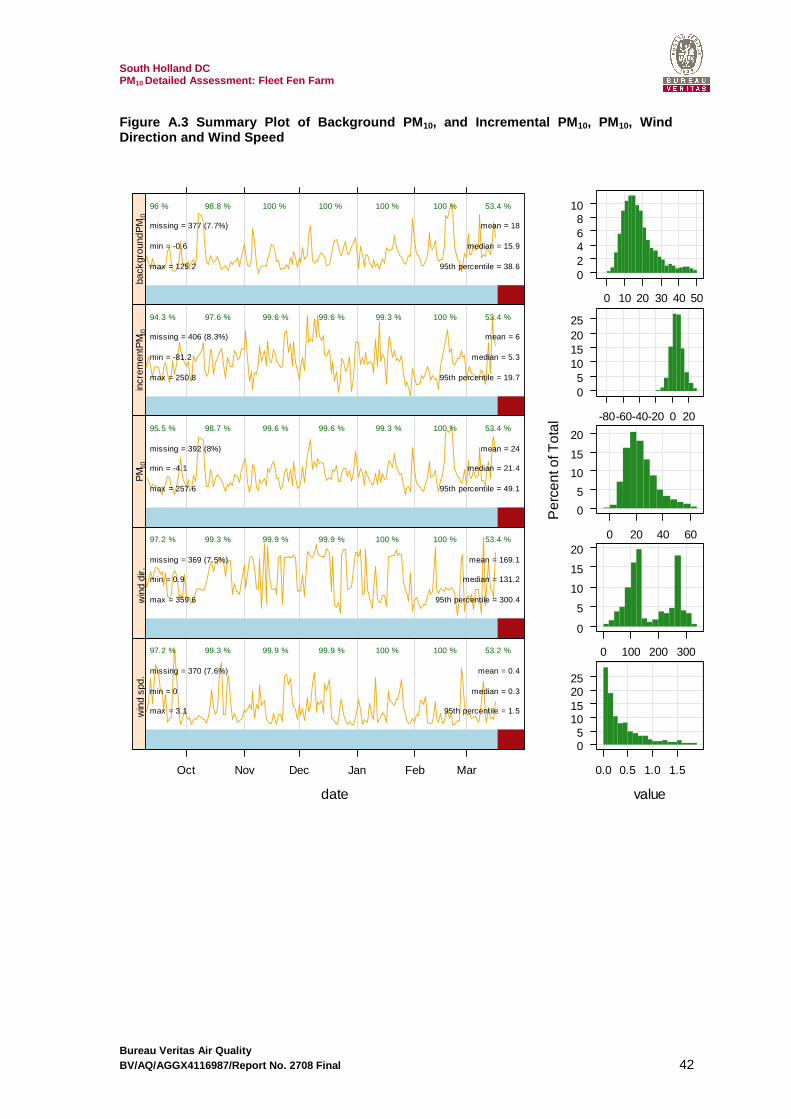
South Holland DC PM10 Detailed Assessment: Fleet Fen Farm
Bureau Veritas Air Quality BV/AQ/AGGX4116987/Report No. 2708 Final 42
Figure A.3 Summary Plot of Background PM 10, and Incremental PM 10, PM10, Wind Direction and Wind Speed
date
Oct Nov Dec Jan Feb Mar
missing = 370 (7.6%)
min = 0
max = 3.1
mean = 0.4
median = 0.3
95th percentile = 1.5
97.2 % 99.3 % 99.9 % 99.9 % 100 % 100 % 53.2 %
win
d sp
d.
missing = 369 (7.5%)
min = 0.9
max = 359.6
mean = 169.1
median = 131.2
95th percentile = 300.4
97.2 % 99.3 % 99.9 % 99.9 % 100 % 100 % 53.4 %
win
d di
r.
missing = 392 (8%)
min = -4.1
max = 257.6
mean = 24
median = 21.4
95th percentile = 49.1
95.5 % 98.7 % 99.6 % 99.6 % 99.3 % 100 % 53.4 %
PM
10
missing = 406 (8.3%)
min = -81.2
max = 250.8
mean = 6
median = 5.3
95th percentile = 19.7
94.3 % 97.6 % 99.6 % 99.6 % 99.3 % 100 % 53.4 %
incr
emen
tPM 1
0
missing = 377 (7.7%)
min = -0.6
max = 125.2
mean = 18
median = 15.9
95th percentile = 38.6
96 % 98.8 % 100 % 100 % 100 % 100 % 53.4 %
back
grou
ndP
M 10
value
Per
cent
of T
otal
05
10152025
0.0 0.5 1.0 1.5
0
5
10
15
20
0 100 200 300
0
5
10
15
20
0 20 40 60
05
10152025
-80-60-40-20 0 20
02468
10
0 10 20 30 40 50

South Holland DC PM10 Detailed Assessment: Fleet Fen Farm
Bureau Veritas Air Quality BV/AQ/AGGX4116987/Report No. 2708 Final 43
Figure A.4 Polar Frequency Plots of Mean Incrementa l PM10 by month
0
1
2
3
4
W
S
N
E
September 2010
0
1
2
3
4
5
W
S
N
E
October 2010
0
1
2
3
4
W
S
N
E
November 2010
0
1
2
3
4
5
W
S
N
E
December 2010
0
1
2
3
4
W
S
N
E
January 2011
0
1
2
3
4
5
W
S
N
E
February 2011
0
1
2
3
4
W
S
N
E
March 2011
mean
PM10
0
20
40
60
80
100
120
140
160
180
200
220
240
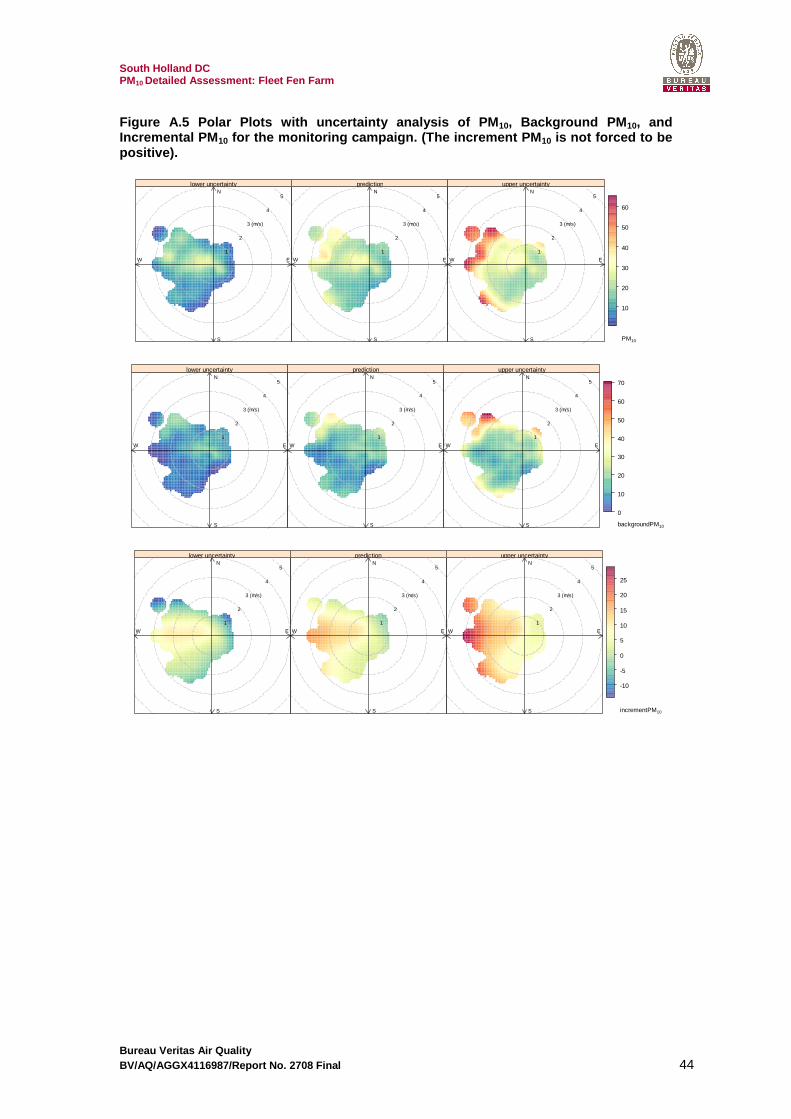
South Holland DC PM10 Detailed Assessment: Fleet Fen Farm
Bureau Veritas Air Quality BV/AQ/AGGX4116987/Report No. 2708 Final 44
Figure A.5 Polar Plots with uncertainty analysis of PM10, Background PM 10, and Incremental PM 10 for the monitoring campaign. (The increment PM 10 is not forced to be positive).
1
2
3 (m/s)
4
5
W
S
N
E
lower uncertainty
1
2
3 (m/s)
4
5
W
S
N
E
prediction
1
2
3 (m/s)
4
5
W
S
N
E
upper uncertainty
PM10
10
20
30
40
50
60
1
2
3 (m/s)
4
5
W
S
N
E
lower uncertainty
1
2
3 (m/s)
4
5
W
S
N
E
prediction
1
2
3 (m/s)
4
5
W
S
N
E
upper uncertainty
backgroundPM10
0
10
20
30
40
50
60
70
1
2
3 (m/s)
4
5
W
S
N
E
lower uncertainty
1
2
3 (m/s)
4
5
W
S
N
E
prediction
1
2
3 (m/s)
4
5
W
S
N
E
upper uncertainty
incrementPM10
-10
-5
0
5
10
15
20
25
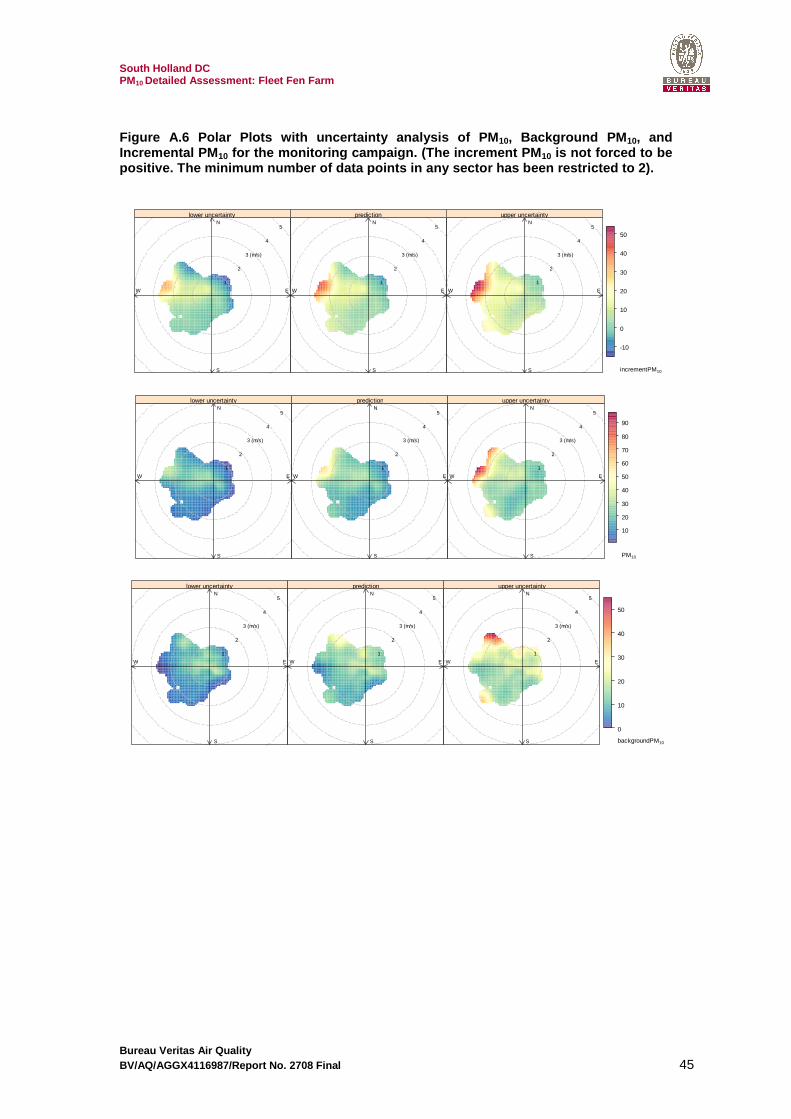
South Holland DC PM10 Detailed Assessment: Fleet Fen Farm
Bureau Veritas Air Quality BV/AQ/AGGX4116987/Report No. 2708 Final 45
Figure A.6 Polar Plots with uncertainty analysis of PM10, Background PM 10, and Incremental PM 10 for the monitoring campaign. (The increment PM 10 is not forced to be positive. The minimum number of data points in any sector has been restricted to 2).
1
2
3 (m/s)
4
5
W
S
N
E
lower uncertainty
1
2
3 (m/s)
4
5
W
S
N
E
prediction
1
2
3 (m/s)
4
5
W
S
N
E
upper uncertainty
incrementPM10
-10
0
10
20
30
40
50
1
2
3 (m/s)
4
5
W
S
N
E
lower uncertainty
1
2
3 (m/s)
4
5
W
S
N
E
prediction
1
2
3 (m/s)
4
5
W
S
N
E
upper uncertainty
PM10
10
20
30
40
50
60
70
80
90
1
2
3 (m/s)
4
5
W
S
N
E
lower uncertainty
1
2
3 (m/s)
4
5
W
S
N
E
prediction
1
2
3 (m/s)
4
5
W
S
N
E
upper uncertainty
backgroundPM10
0
10
20
30
40
50