southern california gas company - calmac
TRANSCRIPT

Southern California Gas Company Final Summary Report: Process Evaluation of the 2006–2008 Local Government and Institutional Partnership Programs
January 2, 2009

Final Summary Report: Process Evaluation of the 2006–2008 Local Government and Institutional Partnership Programs. 1/2/09
Southern California Gas Company Final Summary Report: Process Evaluation of the 2006–2008 Local Government and Institutional Partnership Programs
January 2, 2009
© PA Knowledge Limited 2008
PA Consulting Group 6410 Enterprise Lane
Suite 300 Madison, WI 53719
Tel: +1 608 443 2700 Fax: +1 608 661 5181
www.paconsulting.com
Prepared for: Prepared by:
Southern California Gas Company PA Consulting Group
Version: 1.0

i
Final Summary Report: Process Evaluation of the 2006–2008 Local Government and Institutional Partnership Programs. 1/2/09
EXECUTIVE SUMMARY
This report presents the Process Evaluation of Southern California Gas’ (SCG) 2006–2008 Local Government and Institutional Partnership Programs. The partnership programs for 2006–2008 received funding from the California Public Utilities Commission under the Public Goods Charge (PGC). SCG’s portfolio of programs consists of nine partnerships with the following entities:
• University of California/California State University Partnership Program (UC/CSU)
• California Community Colleges Partnership Program (CCC)
• California Department of Corrections and Rehabilitation Partnership Program (CDCR)
• Bakersfield-Kern Partnership Program
• Energy Coalition Partnership Program
• LA County Partnership Program
• California Urban Water Conservation Council Partnership Program
• South Bay Partnership Program
• Ventura County Partnership Program
The California Energy Action Plan of 2005 establishes energy efficiency as the state’s top priority procurement resource and calls for the utilities to invest in energy efficiency whenever it is more cost effective than power plants. The Energy Action Plan permits utilities to fund partnership programs between a regulated utility and a designated “partner,” where the partner will work directly with the utility to provide energy-efficiency services.
These partnerships consist of activities managed by government agencies or non-profit community organizations to encourage increased energy-efficiency behaviors among targeted groups. Activities include, but are not limited to, education and training opportunities, outreach to target customer groups, direct installation or delivery of energy-efficiency equipment, and referrals into utility programs.
Partners’ roles vary depending upon the specific activities undertaken and the skill sets and resources of each. The presumption in each partnership is that the utility and the partner (whether local or state government agency or a community-based non-profit) bring their unique skills and resources to the partnership.
This process evaluation identifies issues associated with the performance of the programs during the 2006–2008 program cycle and provides recommendations for improvements for the design of new programs in 2009–2011 cycle. The process evaluation also documents program theories, goals, and strategies and progress toward those goals.

Executive Summary…
ii
Final Summary Report: Process Evaluation of the 2006–2008 Local Government and Institutional Partnership Programs. 1/2/09
This evaluation was conducted between August 2007 and June 2008. The evaluation results are based on a review of secondary data, in-depth interviews with program partners and stakeholders, and a survey of SCG customers that participated in one of the above-mentioned programs.
1.1 PROGRESS TOWARD GOALS
The process evaluation concludes that SCG Partnership Programs included in this process evaluation have not made significant progress towards their gas-savings goals. By June 2008, 22 percent of the partnerships’ cumulative therms savings goals had been reached. However, this is difficult to say with certainty as a number of partnerships (e.g., CDCR) say they have committed projects that will bring them up to their targets that are not accounted for in EEGA.
CUWCC and LA County are the only two programs that have made significant progress towards their therms savings goals. As of June 2008, LA County achieved 60 percent of its established goal. CUWCC, with its very ambitious goal of 2.5 million therms, has had the overall greatest savings of 643,290; however, it is only a quarter of the way towards its goal for the cycle. CDCR and the Energy Coalition have not had any gas savings reported1.
Utility and partner program staff provided varying reasons why these programs are not reaching their goals. In some instances, the program claims the projects are significant and slow-moving but that the savings will be realized by the end of the program cycle (e.g., UC/CSU). Others claim the program is behind in documenting the installation or processing the invoices, thereby the data is not reflective of the actual savings (e.g., Energy Coalition). Still others discussed the difficulty in finding gas-related applications in their target markets (Bakersfield-Kern).
Non-resource programs claim to have not only met, but exceeded their targets. Their activities include conducting trainings and workshops, attending community events, and promoting energy efficiency through literature, publications, and the media.
1.2 PORTFOLIO-LEVEL FINDINGS
Below summarizes the key portfolio-level findings. These portfolio-level findings are synthesized based on analysis of the programs discussed in this report. Program-specific findings can be found in their individual chapters.
Long-term capacity building. The potential for longer-term savings varies by program type. The level of long-term capacity building efforts, driven to a large extent by training and education, varies by partnership.
Local government programs. The most successful partnerships are those in which all partners buy-in to the partnership concept and are committed to the relationships.
1 Per the Energy Efficiency Groupware Application (EEGA), June 2008 report.

Executive Summary…
iii
Final Summary Report: Process Evaluation of the 2006–2008 Local Government and Institutional Partnership Programs. 1/2/09
Programs where Partners expressed the greatest level of satisfaction were those programs that collaborated well together and built upon each others’ strengths.
Statewide programs. The statewide partnerships work well in terms of policy development and collaboration between partners and utilities, although they exhibit unique differences.
Unrealized value. Excepting the statewide partnerships, most parties interviewed are concerned that the partnerships will not be given adequate credit for the role they play in stimulating energy saving behaviors and installation of measures beyond those that are easily counted, such as education and training. The concern is that, in the absence of a way to measure indirect program impacts, partnership value to the overall efficiency portfolio will be underrepresented.
Staffing resources. Staffing is an issue raised in most partnership programs. Local program staffs tend to have limited time to dedicate to partnership work, yet it is important that the partnership has adequate staff resources—at whatever level—to ensure the necessary work is accomplished to support the partnership’s initiatives. For SCG’s successful local government partnership programs, this means having at least one dedicated local government staff person—or champion—as well as others throughout the local government who participate on some level.
Clarity of focus. The partnership program model has two main dimensions: it is a resource acquisition vehicle and it is a community outreach and engagement tool. PA’s evaluation effort examined the extent to which SCG’s external partners (1) fully understand and accept this obligation, (2) have the capacity (resources) and capability (skills) to fulfill this role, and (3) feel a direct obligation to fulfill the energy-savings commitments. Not surprisingly, the partners that are most fully engaged are those that meet all three of the above criteria. Every partnership that is not performing as well fails to meet at least one of these criteria.
Balancing resource and non-resource objectives. There is a tension that has existed in the partnership programs portfolio between delivering the energy-savings commitments related to the PGC incentive mechanism (achieving the metrics), building local government capacity to deliver services over the long run, and providing the non-resource elements detailed in the program design. In order to obtain critically needed resources for the State, the focus on obtaining energy savings is appropriate. However, with that kind of focus, much of the capacity and capability building for which the partnership program concept is so well suited could be marginalized. To balance the two objectives, partnership goals need to ensure that progress toward reaching both goals is measurable.
Recording non-resource activities. Although regulatory documents point to the need for the IOUs to maintain information to allow for their evaluation, few of the IOUs, including SCG, maintain such data. The CPUC’s decision to place more emphasis on indirect impacts and non-resource program elements than originally intended for the 2006–2008 program cycle has placed significant additional pressure on SCG program managers to document these activities and create databases for evaluation purposes.

Executive Summary…
iv
Final Summary Report: Process Evaluation of the 2006–2008 Local Government and Institutional Partnership Programs. 1/2/09
Length of programs and program maturity. Research indicates that programs that started under the earlier program cycle reached a level of maturity under the 2006–2008 cycle that allowed for more progress to be made. It is clear that both the IOUs and the Commission underestimated the amount of time it takes to set up partnerships with their complex relationships, multi-party contractual documents, and range of services.
There was discussion that a three-year program cycle is insufficient time in which to achieve the results these programs can ultimately produce. The need for a longer program cycle becomes obvious when comparing those programs that began during the 2004–2005 cycle with those that started in 2006. More mature programs like the UC/CSU Partnership are functioning more effectively and delivering greater savings.
Program tracking. Program databases are critical tools for reviewing and documenting program progress. Databases are also critical for identifying and tracking energy impacts associated with programs. Evaluation activities found that the tracking capabilities are in many cases lacking, particularly when it comes to tracking non-resource activities. Additionally, for some programs the lack of a centralized tracking system is detailed as an administrative barrier. Devoting time early in the program process to develop an effective tracking system and one that is used consistently by program partners is a worthwhile exercise.
Communication channels. While the communication between SCG and partners were, for the most part, deemed positive, there were instances when interviews revealed some sort of breakdown in communication between the partner and utility. Communication topics include changes in SCG offerings, SCG activities related to the program (such as blitzes), and any projects and savings resulting from referrals into other SCG’s core programs. Continuing to incorporate and practice strong communication practices, incorporating a feedback loop to address areas where the program is working well and results from referred projects, will continue to improve and streamline program performance and partner satisfaction.
Customer segments targeted. In general, the partnerships have been more successful in building awareness and serving commercial customers. However, the commercial market has distinct submarkets that are more or less approachable through the local government and institutional partnerships program mechanism. The programs tend to be less able to influence large regional and national building owners, manufacturers, retail chains, and housing developers with far away decision-makers. Residential customers are even harder to reach and to gain their participation in energy-efficiency programs as evidenced in the customer survey results. However, there are some SCG partnerships that are doing strong residential program support campaigns that include aggressive outreach.
Incentives and technical assistance. SCG’s partnership portfolio has raised the visibility of energy efficiency. Many of the projects would not have happened without the incentives or technical assistance provided by the partnerships. The visibility provided by the incentives from the partnership may be as important as the actual money.

Executive Summary…
v
Final Summary Report: Process Evaluation of the 2006–2008 Local Government and Institutional Partnership Programs. 1/2/09
1.3 RECOMMENDATIONS
Recognizing the success of the partnership programs on many levels, we offer the following eight recommendations for SCG to consider for the 2009–2011 program cycle to take advantage of lessons learned and best practices from the 2006–2008 program cycle.
1. Consider reacting to the variance in sophistication and population among partnership programs by revising funding cycles structure.
2. Ensure funding streams do not lapse.
3. Streamline the contracting process and begin developing contracts early to attempt to avoid contract-related delays.
4. Review the need for resources by program, taking into consideration the individual needs of the programs.
5. Provide ongoing support and technical assistance.
6. Communicate regularly and provide consistent and timely feedback.
7. Follow procedures set by LA County Partnership as an example of best practices for increasing energy efficiency in public buildings.
8. Develop a tracking system that is usable and accessible between utilities for multi-utility programs and between partners and utilities.

vi
Final Summary Report: Process Evaluation of the 2006–2008 Local Government and Institutional Partnership Programs. 1/2/09
TABLE OF CONTENTS
Executive Summary i 1.1 Progress Toward Goals ii 1.2 Portfolio-level Findings ii 1.3 Recommendations v
List of Acronyms ix
1. Introduction 2-1 1.1 Program Overviews 2-1 1.2 Report Structure 2-4
2. Portfolio-level Program Theory and Logic Model 2-1 2.1 Portfolio-level Program Theory 2-1 2.2 Logic Model 2-3
3. Methodology 3-1 3.1 Evaluation Strategy 3-1 3.2 Primary Data Collection Activities 3-2 3.3 Secondary Data Analysis Activities 3-4
4. Portfolio Level Data 4-1 4.1 Gas Savings for SCG Partnership Program Portfolio 4-1 4.2 SCG Local Government and Institutional Partnership
Programs Expenditures during 2006–2008 Cycle 4-2 4.3 Survey Findings 4-3
5. University of California/California State University Partnership Program 5-1 5.1 Introduction 5-1 5.2 Program Background and Structure 5-1 5.3 Key Findings 5-4 5.4 Conclusions and Opportunities for Improvement 5-7
6. California Community Colleges Partnership Program 6-1 6.1 Introduction 6-1 6.2 Program Background and Structure 6-1 6.3 Key Findings 6-4 6.4 Conclusions and Opportunities for Improvement 6-8
7. California Department of Corrections and Rehabilitation Partnership Program 7-1 7.1 Introduction 7-1

TABLE OF CONTENTS…
vii
Final Summary Report: Process Evaluation of the 2006–2008 Local Government and Institutional Partnership Programs. 1/2/09
7.2 Program Background and Structure 7-1 7.3 Key Findings 7-4 7.4 Conclusions and Opportunities for Improvements 7-8
8. Bakersfield-Kern Partnership Program 8-1 8.1 Introduction 8-1 8.2 Program Background and Structure 8-1 8.3 Key Findings 8-3 8.4 Conclusions and Opportunities for Improvement 8-9
9. Energy Coalition Partnership Program 9-1 9.1 Introduction 9-1 9.2 Program Background and Structure 9-1 9.3 Key Findings 9-3 9.4 Survey Findings—Experiences of Residential
Participants 9-9 9.5 Survey Findings—Experiences of Small Businesses
Participants 9-13 9.6 Conclusions and Opportunities for Improvements 9-14
10. LA County Partnership Program 10-1 10.1 Introduction and Summary 10-1 10.2 Program Background and Structure 10-1 10.3 Key Findings 10-4 10.4 Conclusions and Opportunities for Improvement 10-7
11. California Urban Water Conservation Council Partnership Program 11-1 11.1 Introduction 11-1 11.2 Program Background and Structure 11-1 11.3 Key Findings 11-3 11.4 Conclusions and Opportunities for Improvement 11-5
12. South Bay Partnership Program 12-1 12.1 Introduction 12-1 12.2 Program Background and Structure 12-1 12.3 Key Findings 12-3 12.4 Participant Telephone Survey Findings 12-8 Conclusions and Opportunities for Improvement 12-12
13. Ventura County Partnership Program 13-1 13.1 Introduction 13-1 13.2 Program Background and Structure 13-1

TABLE OF CONTENTS…
viii
Final Summary Report: Process Evaluation of the 2006–2008 Local Government and Institutional Partnership Programs. 1/2/09
13.3 Key Findings 13-3 13.4 Findings from Telephone Surveys 13-9 13.5 Conclusions and Opportunities for Improvement 13-12
14. Portfolio-level Conclusions and Recommendations 14-1 14.1 Conclusions 14-1 14.2 Recommendations 14-5
Appendices
APPENDIX A: In-Depth Interview Protocols A-1
APPENDIX B: Survey Instruments B-1
APPENDIX C: Program-Specific Response Rates C-1

ix
Final Summary Report: Process Evaluation of the 2006–2008 Local Government and Institutional Partnership Programs. 11/11/08
LIST OF ACRONYMS
ACEEE American Council for an Energy-Efficient Economy AIA American Institute for Architecture ASHRAE American Society of Heating, Refrigeration, and Air Conditioning
Engineers CCC California Community Colleges CCSE California Center for Sustainable Energy CDCR California Department of Corrections and Rehabilitation CEP Energy Coalition CFL Compact Fluorescent Lamp CPUC California Public Utilities Commission CSU California State University CSUOC California State University Office of the Chancellor CUWCC California Urban Water Conservation Council DSM Demand Side Management EEGA Energy Efficient Groupware Application EMS Energy Management Services ESCO Energy Services Company GHG Greenhouse Gas GIPP Government and Institutional Partnership Program HEW High-Efficiency Washer ICLEI International Council for Local Environmental Initiatives IOU Investor Owned Utility LED Light Emitting Diode (high-efficiency lighting) LEED Leadership in Energy and Environmental Design LGP Local Government Partnership MBCx Monitoring-based Commissioning M&V Monitoring and Verification MWD Metropolitan Water District of Southern California NAM Newcomb Anderson McCormick PAM Program Administrative Manager PGC Public Goods Charge PG&E Pacific Gas & Electric SBERC South Bay Energy Resource Center SCE Southern California Edison SCG Southern California Gas SDG&E San Diego Gas and Electric Company UC University of California UCOP University of California Office of the President VCERC Ventura County Energy Resource Center VCREA Ventura County Regional Energy Association

2-1
Final Summary Report: Process Evaluation of the 2006–2008 Local Government and Institutional Partnership Programs. 1/2/09
1. INTRODUCTION
This report presents the results of the process evaluation of Southern California Gas Company’s (SCG’s) 2006–2008 Local Government and Institutional Partnership Programs Portfolio. This evaluation was conducted between August 2007 and June 2008 by PA Consulting Group and a team of national energy-efficiency program experts that included subcontractor Dethman and Associates. The purpose of this report is to provide feedback regarding the Local Government and Institutional Partnership programs, where they stand in relation to the achievement of targets and goals for the 2006–2008 cycle, and to provide findings and comments for consideration in planning the next cycle of partnership programs for 2009–2011.
The California Energy Action Plan of 2005 establishes energy efficiency as the state’s top priority procurement resource and calls for the utilities to invest in energy efficiency whenever it is more cost effective than power plants. The Energy Action Plan permits utilities to fund partnership programs between a regulated utility and a designated “partner,” where the partner will work directly with the utility to provide energy-efficiency services.
These partnerships consist of activities managed by government agencies or non-profit community organizations to encourage increased energy-efficiency behaviors among targeted groups. Partners’ roles vary in each case, depending upon the specific activities undertaken and the skill sets and resources of each. The presumption in each partnership, however, is that the utility and the partner (whether local or state government agency or a community-based non-profit) each bring something to the table to make it work.
1.1 PROGRAM OVERVIEWS
SCG’s 2006–2008 Local Government and Institutional Partnership Programs Portfolio evaluated for this process evaluation consists of three statewide programs and six local partnerships. The statewide programs are summarized in Table 1-1, and the local partnership programs are summarized in Table 1-2.

1. Introduction. . .
2-2
Final Summary Report: Process Evaluation of the 2006–2008 Local Government and Institutional Partnership Programs. 1/2/09
Table 1-1 SCG Statewide Institutional Partnership Programs
Program Overview
SCG3520
University of California/California State University Program (UC/CSU)
The UC/CSU Partnership is a statewide program designed to achieve immediate and long-term energy savings and peak-demand reduction within California’s higher education system. The program establishes a permanent framework for sustainable, comprehensive energy management at campuses served by California's four IOUs. The program employs four key strategies to meet its goals—energy-efficiency retrofits, monitoring-based commissioning (MBCx), emerging technology demonstrations, and training and education. All the campuses coordinate closely with the University of California Office of the President (UCOP) and Chancellor’s offices.
SCG3518
California Community Colleges Program (CCC)
The CCC Partnership program offers incentives for retrofit and new construction projects, continuous commissioning, and educational training for the community colleges. The CCC system includes 1092 campuses, which are served by California’s four IOUs. These facilities consume vast quantities of energy and make up a significant portion of both the electric and natural gas loads in the state of California. California’s community colleges have full autonomy over their campuses and facilities, with little to no central coordination.
SCG3519
California Department of Corrections and Rehabilitation Program (CDCR)
The CDCR program is a statewide program with Partnership participation by all four California IOUs. It focuses on increasing the energy efficiency of the facilities on prison campuses. The program strives to promote and achieve energy efficiency through energy-efficient retrofit projects; near term therms through customized assessments; calculated rebates and building commissioning; and training of facilities and energy managers in improved operation & management techniques and identification of additional energy-efficiency opportunities. The program finances energy improvement through a combination of incentives and state financing and uses an energy service company (ESCO) model to implement the measures.
2 The number of campuses reported varies by source and tends to range from 109–110 campuses (e.g., program logic paper, Quarterly Report Narrative, California Community College Partnership Program Sustainable Collaborative Presentation from 2006).

1. Introduction. . .
2-3
Final Summary Report: Process Evaluation of the 2006–2008 Local Government and Institutional Partnership Programs. 1/2/09
Table 1-2 SCG Local Government and Institutional Partnership Programs
Program Overview
SCG3523 Bakersfield-Kern
The Bakersfield-Kern Partnership emphasizes immediate and long term energy savings through the development of sustainable energy management programs. The partnership is reducing energy by providing energy-efficiency information and direct installation of energy-efficient equipment to homeowners and small businesses. This program is a continuation of a successful 2004–2005 program. PG&E is the partnership’s lead utility.
SCG3524 and SCG3525
Energy Coalition Resource and Non-Resource Programs
The Energy Coalition is a hybrid, multidimensional partnership for the delivery of sustainable energy efficiency in Southern California. Its resource initiatives include community efficiency tune-ups and direct install services for residential and business customers. Non-resource initiatives include demonstration projects and community outreach events. Its main non-resource initiative is an educational program called PEAK Student Energy Actions, which targets 4th to 6th grade students, teaching them about energy management for the future.
SCG3527 LA County
The LA County program is a three-way Partnership between the County, Southern California Edison (SCE), and SCG. The partnership’s primary purpose is to support retro-commissioning in the County operated facilities.
SCG3526
California Urban Water Conservation Council (CUWCC)
The CUWCC Partnership promotes the installation of pre-rinse spray valves at food service facilities. The program accelerates the replacement of pre-rinse spray valves with higher efficiency valves at no cost to the customer. The 2006–2008 program cycle represents the third phase of the direct-install incentive-based program.
SCG3522 South Bay
The South Bay Partnership provides a local clearinghouse for energy efficiency and water conservation information and training, the South Bay Energy Savings Center (SBESC), and supports sixteen local governments of the South Bay, communities, and businesses. Two utilities participate in the partnership: Southern California Edison (SCE) and Southern California Gas (SCG). The program places a strong emphasis on funneling businesses to the partner utilities account representatives through the education, training, and information activities.
SCG3521 Ventura The Ventura County Partnership is a collaboration between the Ventura County Regional Energy Alliance (VCREA), SCE, and SCG. The VCREA is a Joint Powers Agency (JPA) representing the County of Ventura, Ventura Community College District, Casitas Municipal Water District, Ventura Regional Sanitation District, and the Cities of Ventura, Oxnard, Thousand Oaks, and Santa Paula. Membership is open to all public agencies in the region and additional members are expected to join. The primary objectives of Ventura Partnership are to provide specialized energy-efficiency service offerings to nonresidential market in the region; identify opportunities for municipal building retrofits, new construction, commissioning, and retro commissioning; funnel customers into existing IOU energy programs; and leverage local government communication infrastructure to inform their local communities about energy efficiency and demand reduction and related program offerings in the area.

1. Introduction. . .
2-4
Final Summary Report: Process Evaluation of the 2006–2008 Local Government and Institutional Partnership Programs. 1/2/09
1.2 REPORT STRUCTURE
This report consists of the following sections:
• Chapter 2: Portfolio-level Program Theory and Logic Model
• Chapter 3: Methodology
• Chapter 4: Portfolio Level Data
• Chapters 5–13: Individual Partnership Findings
• Chapter 14: Portfolio-level Conclusions and Recommendations
• Appendix A: In-depth Interview Protocols
• Appendix B: Survey Instruments
• Appendix C: Program-specific Response Rates

2-1
Final Summary Report: Process Evaluation of the 2006–2008 Local Government and Institutional Partnership Programs. 1/2/09
2. PORTFOLIO-LEVEL PROGRAM THEORY AND LOGIC MODEL
This chapter presents the portfolio-level program theory and logic model. The logic model revisits the original intent of the Local Government and Institutional Partnership Programs on the part of the CPUC.3 Individual program theories and logic models are included in each program chapter.
2.1 PORTFOLIO-LEVEL PROGRAM THEORY
The Local Government and Institutional Partnership Programs are intended to address a perceived gap in the delivery of energy-efficiency services that local governments are in a unique position to fill. While IOUs and third party providers in California have accomplished significant gains in energy efficiency, there are still large segments of society that are underserved or, for various reasons, have not fully participated in these programs. By leveraging existing services and communications vehicles in their communities, local governments are seen as ideal conduits for delivering energy savings. Because of their similar capabilities, some state agencies and non-profit organizations have also been included under the Local Government and Institutional Partnership Programs portfolio for the 2006–2008 cycle.
Local governments and institutions can play a key role in promoting energy conservation, energy efficiency, and alternative energy. The CPUC’s 2008 “straw man,” Achieving Aggressive Energy Efficiency Goals in Local Communities and Statewide4 enumerates the following functions of local governments that need to be recognized, strengthened, and reinforced for a statewide approach to energy. Functions include:
• Setting policies and establishing goals for their communities
• Leading by example, with built projects and implementation of policies
• Enforcing state energy efficiency/conservation codes and standards
• Adopting stricter local codes for new and existing buildings
• Incentivizing projects that voluntarily exceed state and local minimum energy standards
• Requiring higher energy standards for projects in redevelopment districts and/or for meeting affordable housing goals
• Requiring municipal contractors and vendors to meet higher energy-efficiency standards for services and products that they provide to the local government
• Developing and implementing programs that are tailored to their communities’ needs
3 This diagram is consistent with the portfolio-level logic model developed by PA as part of the CPUC evaluation of the Partnership Programs.
4 http://www.californiaenergyefficiency.com/local_govt.shtml.

2. Portfolio-level Program Theory and Logic Model. . .
2-2
Final Summary Report: Process Evaluation of the 2006–2008 Local Government and Institutional Partnership Programs. 1/2/09
• Collaborating with other entities, including IOUs, in outreach initiatives and providing education and technical assistance to local residents and businesses if resources are available
• Promoting energy efficient communities through community design, land use, and zoning requirements
• Recognizing local individuals and businesses for exemplary energy management
• Promoting green technology oriented economic development.
Partnership programs are intended to build government and community group capabilities for delivering energy services within communities; raise awareness among the public (households and businesses) about energy saving opportunities; and directly realize opportunities to save energy within local, state government and community facilities, homes, and businesses. The partnership program model builds the capacities (resources) and capabilities (skills) of local governments and embraces the multicultural and multi-dimensional set of responsibilities that are part of local government and community agency realities5.
SCG’s local government partners have multiple functions in their communities. They are expressly obliged to serve all markets, dealing with issues of equity and inclusiveness, particularly for hard-to-reach groups. In service of these obligations, they must deliver public goods, such as education, police protection, and garbage disposal, regardless of cost effectiveness or other considerations.
Utility providers also service a wide market; however, utility programs’ priorities may differ from those of local partners. When it comes to energy services delivery, these local entities do not share the responsibility of actually delivering kWh savings (or therms).
The partnership program model has two main dimensions. First, it is a resource acquisition vehicle, and second it is a community outreach and engagement tool. The challenge is that the partnership program model assumes local governments have significant roles to play in delivering direct and indirect therms savings—roles that are important but necessarily vary with each partnership based on the capacity and capabilities brought to the endeavor. This challenge is addressed in the program design documents, written commitments, and contractual documents that articulate the responsibilities of the external partners that they must fulfill in exchange for the Public Goods Charge (PGC) funding provided.6
5 While the state institutional partners have many of the same qualities as local governments, they are much more focused on one segment of the market—e.g., schools, prisons—and as such do have a considerably greater measure of control and direction that limit their responsibilities to that market.
6 The Public Goods Charge (PGC) originated with Assembly Bill 1890 in 1996, which restructured the state’s electricity markets. As part of AB 1890, energy efficiency programs were funded with proceeds from the PGC. With the passage of Assembly Bill 1105 in 1999, authority over the PGC energy-efficiency programs were shifted from the CPUC to the CEC. In September 2002, AB 117 was passed into law. Section 381.1, which was added to Public Utilities Code, permits community

2. Portfolio-level Program Theory and Logic Model. . .
2-3
Final Summary Report: Process Evaluation of the 2006–2008 Local Government and Institutional Partnership Programs. 1/2/09
2.2 LOGIC MODEL
A program logic model illustrates a set of interrelated program activities that combine to produce a variety of outputs that in turn lead to key short-term, intermediate, and long-term outcomes. The following evaluation activities supported the development of the Local Government and Institutional Partnership Programs portfolio-level logic model:
• Program documentation review
• Interviews with program design and delivery staff.
While the California Energy Efficiency Evaluation Protocols: Technical, Methodological, and Reporting Requirements for Evaluation Professionals (The TecMarket Works Team, 2006), based largely on the California Evaluation Framework, does not require a program theory and logic model for every program, SCG agrees with the CPUC that program theories and logic models are indispensable for the effective and efficient design and delivery of the Local Government and Institutional Partnership Programs and assessing their energy and demand impacts.
The Local Government and Institutional Partnership Programs logic model flows from top to bottom and is organized according to six basic categories:
• Program resources
• Program activities
• Outputs
• Short-term outcomes
• Intermediate outcomes
• Long-term outcomes.
In addition, the logic model notes a variety of external influences that can also influence the program’s outcomes. External influences include political and economic factors such as the housing and credit crisis that will affect local government tax revenues and gasoline prices.
Direct resource activities are highlighted in blue in the partnership program logic model. These include partnership efforts that include direct installs, incentive mechanisms and giveaways, and bulk distributions, such as for CFLs.
Indirect resource activities are highlighted in yellow. Most of the indirect resource activities involve capacity building such as policy-work, education, and demonstration projects. Another major indirect resource activity for SCG partnerships includes efforts to “funnel” customers to participate in SCG’s programs. The theory behind all of these
choice aggregators (CCAs) to apply to administer cost-effective energy efficiency and conservation programs. The CPUC also adopted certain procedures in Decision (D.) 03-07-034 (dated July 10, 2003) to implement portions of AB 117 affecting the allocation of energy-efficiency program funds.

2. Portfolio-level Program Theory and Logic Model. . .
2-4
Final Summary Report: Process Evaluation of the 2006–2008 Local Government and Institutional Partnership Programs. 1/2/09
activities is that in the long-term they will result in sustainable energy, environmental, and other non-energy benefits.
Figure 3-1 represents the SCG Local Government and Institutional Program Portfolio Logic Model. It is not the intent that all these activities, outputs, and outcomes be a part of each partnership program. However, all the elements represented are intended to be a part of at least one program and are therefore represented in this portfolio-level model. Also note that this logic model is static and does not illustrate ongoing program changes.
Figure 3-1 SCG Local Government and Institutional Program Portfolio Logic Model
�����������������������������������������
������
���������
�������
������
�������
������
��������
�
������
�����������
�����������
�����������������
�����
�� ����
��������
���
�������!����
�������
�����������
���������������
�����������
����
��"�
#������������
�������������������
�����������������
�����
���"

3-1
Final Summary Report: Process Evaluation of the 2006–2008 Local Government and Institutional Partnership Programs. 1/2/09
3. METHODOLOGY
Southern California Gas (SCG) contracted PA to conduct a process evaluation of its 2006–2008 Local Government and Institutional Partnership Programs Portfolio. The evaluation’s goals, as identified in SCG’s Request for Proposals7 (RFP) were to:
• Review the programs within the context of the partnership market segment to determine if there are unnecessary overlaps between programs, if significant parts of the market are being missed by the program designs, and/or if the targeted markets should be defined differently
• Document program theories, program goals, and implementation strategies
• Provide real-time feedback to program implementers with specific focus on improving program recruitment and delivery and identifying both implementation and program design problems for review and modification
• Assess the effectiveness of the programs and provide recommendations for improvement
• Evaluate areas of customer and trade ally satisfaction/dissatisfaction and provide recommendations for developing an ongoing system for tracking customer feedback
• Identify barriers and obstacles to meeting program goals.
PA’s overall evaluation strategy was designed to meet these goals.
3.1 EVALUATION STRATEGY
PA’s scope of work with SCG originally encompassed the following eight tasks.
9. Conduct the project initiation meeting
10. Develop the final research plan
11. Review of program documents, materials, and budget
12. Data collection and analysis
13. Review tracking databases
14. Prepare reports and database of results
15. Present results
16. Provide project management and progress reporting
7 Request for Proposals for Partnership Programs Process Evaluation for San Diego Gas & Electric Company and Southern California Gas Company. May 1, 2007.

3. Methodology. . .
3-2
Final Summary Report: Process Evaluation of the 2006–2008 Local Government and Institutional Partnership Programs. 1/2/09
Tasks 3, 4, and 5 were the bulk of the evaluation strategy and are discussed more fully below.
Task 3. Review program documents, materials, and budget. This review allowed PA to lay out the program process flows and develop both an overall portfolio-level logic model and program-specific logic models.
Task 4. Data collection and analysis. This task comprised the bulk of the evaluation. PA conducted internal staff interviews, partner interviews, and a number of structured interviews with program participants and trade allies. Our data-collection activities are described in detail in Section 3.2 below.
Task 5. Review tracking databases. PA initiated work on this task during August but suspended work on this task in October as per SCG direction. Even so, where identified, select program chapters include a brief discussion on program database issues.
3.2 PRIMARY DATA COLLECTION ACTIVITIES
The primary data-collection activities included in-depth interview with partnership staff and a telephone survey of residential and commercial program participants.
• In-depth interviews were conducted with staff on each of the partnership programs. Table 3-1 outlines the number of interviews by group (e.g., utility staff, facility staff) for each program. For each partnership program, staff from both SCG and the partner organization was interviewed. Additionally, two to four SCG staff working with each partnership program were interviewed. In-depth interviews are for the most part qualitative and the responses are subjective in nature. This means that a comment made by a respondent may not necessarily be accurate; rather, it is the viewpoint or opinion of the respondent him or herself. With this said, in-depth interviews are extremely powerful in unveiling programmatic issues as well as identify areas where the programs are successful.
• Telephone surveys. Only four partnership programs were able to provide lists from which sample could support a survey: Bakersfield-Kern, Energy Coalition, South Bay, and Ventura County. As agreed upon with SCG, only program participants were interviewed. The surveys were administered in May 2008 and June 2008. Participant databases served as the sample source for the participant surveys. The program-specific chapters provide more detail about the program data sources. In total, PA collected 217 surveys from residential participants and 289 commercial participants. Residential customers that said they received gas from a utility other than SCG were eliminated from the data. This data also represents SCE customers if it was not possible to identify utility involvement from the sample. Depending on which program they participated in and the equipment they received, these participants may not have been included in all program-specific questions.

3. Methodology. . .
3-3
Final Summary Report: Process Evaluation of the 2006–2008 Local Government and Institutional Partnership Programs. 1/2/09
For example, the Energy Coalition program serves both SCE and SCG customers. The program data does not denote which utility a participant represents and the participant could be a customer for both utilities. If the participant only received electric equipment, then that individual was not retained for the SCG analysis.8 When reviewing the data, note that the sample sizes may be small. Therefore, the data is not weighted and is not necessarily representative of the population. Thus, the results must be understood in light of the limitations of sample.
Table 3-1 Summary Data Collection Activities
Program Name Interviews
SCG3520 UC/CSU program
• 3 utility staff • 2 UC/CSU state staff • 2 implementation contractor staff • 8 campus energy managers
SCG3518 CCC Program
• 3 utility staff • 2 CCC state staff • 1 implementation contractor • 7 community college facilities staff
SCG3519 CDCR
• 2 utility staff • 3 CDCR staff • 6 ESCOs • 5 facility staff
SCG3523 Bakersfield-Kern
• 3 utility staff • 3 Bakersfield-Kern staff • 10 ESCOs • 62 residential participants • 71 commercial participants
SCG3524 and SCG3525
Energy Coalition Resource and Non-Resource
• 3 utility staff • 2 Energy Coalition staff • 10 partner agencies • 71 residential participants • 65 commercial participants
SCG3527 LA County • 3 utility staff • 3 County staff
SCG3526 CUWCC • 1 utility staff • 1implementation contractor
SCG3522 South Bay
• 3 utility staff • 10 facility staff • 10 partner agencies • 2 peer city staff • 78 residential participants • 77 commercial participants
8 For more details about the sample and response rates, see Appendix C.

3. Methodology. . .
3-4
Final Summary Report: Process Evaluation of the 2006–2008 Local Government and Institutional Partnership Programs. 1/2/09
Program Name Interviews
SCG3521 Ventura
• 3 utility staff • 10 partner agencies • 6 residential participants • 76 commercial participants
Because SCE and PG&E have engaged PA to conduct a separate process evaluation of their portions of the program, data-collection efforts took place concurrently. In some cases, the sample lists overlap completely so efficiencies could be realized in the data-collection process. For example, a sample that supports the Energy Coalition residential survey is the same for SCG and SCE.
3.3 SECONDARY DATA ANALYSIS ACTIVITIES
In addition to conducting primary research, PA’s evaluation team reviewed a significant number of background documents and reports, both on each individual program and on the portfolio overall. The materials reviewed included:
• SCG’s filings with the CPUC regarding its 2006–2008 program portfolio
• The relevant program implementation plans (PIPs)
• SCG’s quarterly and monthly reports on the Energy Efficiency Groupware Application (EEGA) website
• All program application materials and tracking systems
• Program marketing materials, where appropriate
• Program forms
• Evaluation reports from the 2004–2005 program cycle, when available.
4-1
Final Summary Report: Process Evaluation of the 2006–2008 Local Government and Institutional Partnership Programs. 1/2/09
4. PORTFOLIO LEVEL DATA
This chapter presents the portfolio-level data for 2006–2008 SCG Local Government and Institutional Partnership Programs. First, the gas savings at the SCG portfolio level and individual level programs are presented, followed by program expenditures in relation to the 2006-2008 cycle budget. Subsequently, survey findings that characterize the partnership population and allow comparison across programs are presented.
4.1 GAS SAVINGS FOR SCG PARTNERSHIP PROGRAM PORTFOLIO
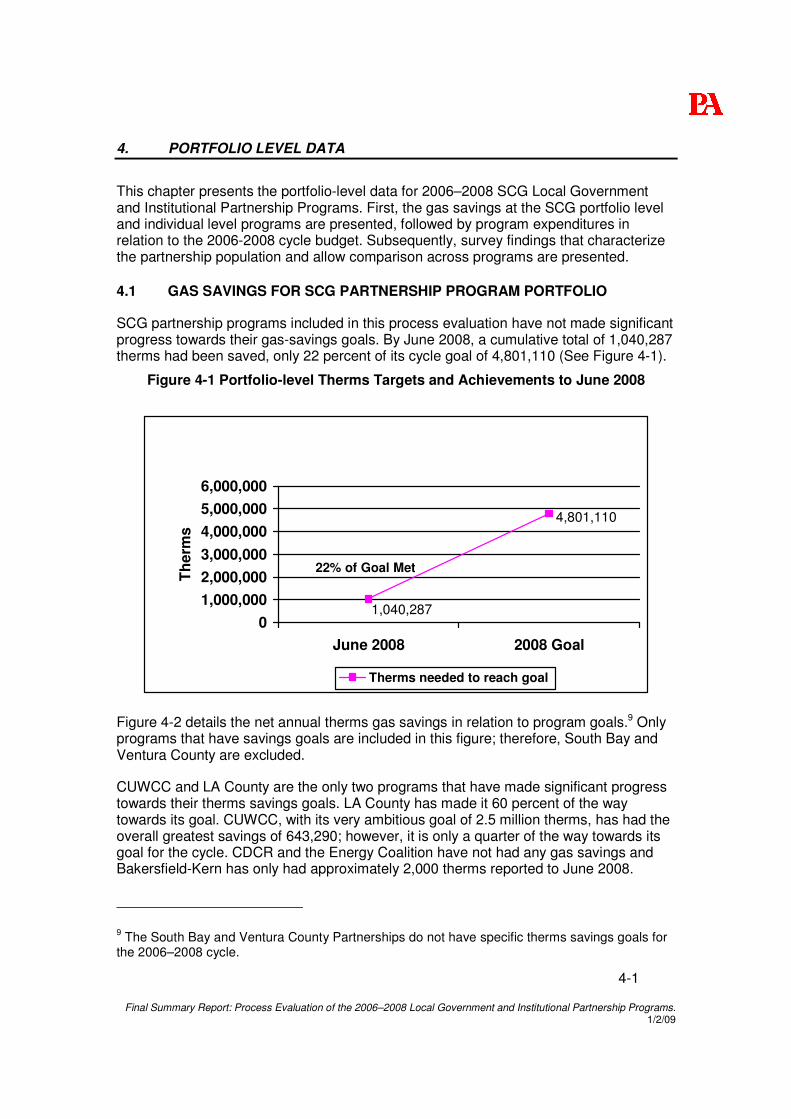
SCG partnership programs included in this process evaluation have not made significant progress towards their gas-savings goals. By June 2008, a cumulative total of 1,040,287 therms had been saved, only 22 percent of its cycle goal of 4,801,110 (See Figure 4-1).
Figure 4-1 Portfolio-level Therms Targets and Achievements to June 2008
4,801,110
1,040,2870
1,000,0002,000,0003,000,0004,000,0005,000,0006,000,000
June 2008 2008 Goal
Ther
ms
Therms needed to reach goal
Figure 4-2 details the net annual therms gas savings in relation to program goals.9 Only programs that have savings goals are included in this figure; therefore, South Bay and Ventura County are excluded.
CUWCC and LA County are the only two programs that have made significant progress towards their therms savings goals. LA County has made it 60 percent of the way towards its goal. CUWCC, with its very ambitious goal of 2.5 million therms, has had the overall greatest savings of 643,290; however, it is only a quarter of the way towards its goal for the cycle. CDCR and the Energy Coalition have not had any gas savings and Bakersfield-Kern has only had approximately 2,000 therms reported to June 2008.
9 The South Bay and Ventura County Partnerships do not have specific therms savings goals for the 2006–2008 cycle.
22% of Goal Met

4. Portfolio Level Data. . .
4-2
Final Summary Report: Process Evaluation of the 2006–2008 Local Government and Institutional Partnership Programs. 1/2/09
Figure 4-2 Program-specific Therms Targets and Achievements to June 2008
-
500,000
1,000,000
1,500,000
2,000,000
2,500,000
UC/CSU CCC CDCR Bakersfield-Kern
EnergyCoalition
LA County CUWCC
Ther
ms
Program Projected (Compliance Filing)
Installed Savings(Inception-To-Date)
Note that Figure 4-2 only provides a first glance at the reported savings and may not be an accurate indicator of which programs will or will not reach their goals at the end of the program cycle. “Reported” is the important distinction in this table—there are various reasons why a program may not have their reported savings up to date, such as having a backlog in paperwork or not expecting the work to be completed until later in the year.
The following program-specific chapters provide more detail related to program progress toward goals and barriers to reaching those goals. In some instances, such as for the UC/CSU Partnership, a discussion ensues about the reported values and why they may not represent what the program will achieve by the end of the cycle. In the case of UC/CSU, the savings reported are considerably short of its targets, and yet the Quarterly Report Narrative provided on EEGA state the partnership is on target to reach its goals. The program responded to this issue saying the funds have been committed, but projects are not expected to be complete until December 2008.
4.2 SCG LOCAL GOVERNMENT AND INSTITUTIONAL PARTNERSHIP PROGRAMS EXPENDITURES DURING 2006–2008 CYCLE
In addition to savings goals, the partnership programs also set funding targets and report on the expenditures on a monthly basis. Figure 4-3 shows expenditures per program relative to their budget for the 2006–2008 cycle. Overall, SCG partnership programs are significantly under budget considering the cycle is over 80 percent completed. Only South Bay and Ventura County appear they will spend their entire budgets, which is not surprising considering their budgets are the smallest of all of the programs, both under $500,000. UC/CSU with the largest budget of just over $3,000,000 has spent approximately two-thirds of its budget. The remainder of the programs have not spent even half of their budgets. This is particularly notable for CCC, which has a total budget of $2,000,000 for which less than $400,000 has been spent.

4. Portfolio Level Data. . .
4-3
Final Summary Report: Process Evaluation of the 2006–2008 Local Government and Institutional Partnership Programs. 1/2/09
Figure 4-3 SCG Partnership Program Expenditures Against Budgets
$-
$500,000
$1,000,000
$1,500,000
$2,000,000
$2,500,000
$3,000,000
$3,500,000
UC/CSU CCC CDCR Bakersfield-Kern
EnergyCoalition
LA County CUWCC South Bay VenturaCounty
Am
ount
($)
Adopted Program Budget (3 - Yr)
Program Expenditures (Inception-To-Date)
What is interesting to note is the percent expended against the funding value comparative to the percent achieved against the savings goals. One would expect there to be significant correlation between the two—the higher the spend, the greater the reported savings. This is not necessarily the case, as shown in Figure 4-4. In fact, there are programs, such as the UC/CSU Partnership that expended a significant percentage of funds (68 percent) yet is reporting minimal savings (six percent). Again, program-specific chapters provide a discussion about the program-related barriers that may influence participation and spend levels.
Figure 4-4 Percent of Therms Savings Expenditures Against Targets
6%0%
68%
18% 17%25%
60%
0%1%12%
31%21%21%21%
0%
20%
40%
60%
80%
100%
UC/CSU CCC CDCR BakersfieldKern
EnergyCoalition
LA County CUWCC
% Savings (Reported / Projected) % Expended (Reported / Projected)
4.3 SURVEY FINDINGS
This section presents findings from a survey conducted with SCG’s residential and small business customers. Both participants and nonparticipants of the various Local

4. Portfolio Level Data. . .
4-4
Final Summary Report: Process Evaluation of the 2006–2008 Local Government and Institutional Partnership Programs. 1/2/09
Government and Institutional Partnership Programs are represented. These survey findings also include SCE customers. As discussed earlier, due to the nature of the sample and partnership program, it was not always possible to disentangle SCE and SCG customers.
4.3.1 Funneling Activities for Partnership Programs
Survey results show that participant in the partnership programs is funneling customers into participating in other utility programs. Approximately thirty percent of program participants say they received forms for other utility programs. Of those who receive the forms, 22 percent of residential customers and 26 percent of commercial customers signed up for other utility programs (Table 4-1). The Bakersfield-Kern Partnership has been the most successful at promoting other utility programs with around a third of residential and commercial customers signing up for other utility programs.
Table 4-1 Funneling Activities for Partnership Programs*
Residential
percent that said yes
Commercial percent that said
yes
Received forms for other utility programs (n=245 res/n=237 com) 30% 33%
Signed up for other utility programs (n=52 res/n=76 com) 22% 26%
Bakersfield-Kern (n=13 res/n= 14 com)) 31% 29%
Energy Coalition (n=16 res/n=10 com ) 13% 20%
South Bay (n=21 res/n=32 com) 24% 31%
Ventura County (n=2 res/n=20 com)** 0% 20% * Represents SCE and SCG customers ** Note that the Ventura Partnership residential sample size is extremely small.
A review of the responses for each program shows there is no significant difference in the percent of residential respondents that say they received forms for other utility programs. Commercial customers that participated in the South Bay Partnership were significantly more likely to note receiving materials than other program participants (52 percent compared with Energy Coalition at 18 percent and Bakersfield-Kern at 22 percent).
Note that this analysis does not indicate which utility the participant signed up through. For example, SCG may not have any record of participants being funneled into their core programs by South Bay because the respondent may have signed up for an SCE program. This is a limitation of the survey data.
4.3.2 Satisfaction with Local Government Partners and Utility Company
The survey asked respondents if, as a result of their participation in the local government partnership program, they were more satisfied, less satisfied, or had the same level of satisfaction with their local government partner. The majority of residential respondents (64 to 65 percent) said they were more satisfied with the local government partner after participating in the program. Few program participants said they were less satisfied.

4. Portfolio Level Data. . .
4-5
Final Summary Report: Process Evaluation of the 2006–2008 Local Government and Institutional Partnership Programs. 1/2/09
Table 4-2 Participant Satisfaction with Local Government Partner after Participating in the Program*
Percent Residential (n=206)
Percent Commercial (n=278)
More satisfied 64% 65%
Less satisfied 1% 1%
Same satisfaction 36% 34%
* Represents SCE and SCG customers
Respondents’ satisfaction with the local utility followed a slightly different trend, with the majority saying their level of satisfaction did not change since participating in the program (52 percent residential and 50 percent commercial); yet, 44 percent of residential and 48 percent of commercial participants said they were more satisfied with the local utility.
Table 4-3 Satisfaction with Local Utility as a Result of Program Participation*
Percent Residential (n=205)
Percent Commercial (n=273)
More satisfied 44% 48%
Less satisfied 4% 3%
Same satisfaction 52% 50%
* Represents SCE and SCG customers
4.3.3 Sources of Energy and Water Efficiency Information
Residential and commercial participants were asked what type of organization they would prefer to receive energy and water efficiency information from. Interestingly, customers typically said they would prefer to receive information on ways to save energy from their local electric or gas utility, followed by a group that felt it did not matter where they received the information from. Fewer than 20 percent of residential customers and 24 percent of commercial customers would prefer to receive the information from a local government organization (Figure 4-5).
There was no statistical difference in responses by program with two exceptions. Residential South Bay respondents noted they would prefer to receive information from a nonprofit organization (22 percent compared with seven percent and ten percent for Bakersfield-Kern and Energy Coalition, respectively). And Bakersfield-Kern participants were significantly less likely to say they would prefer to receive information from their local government or nonprofit organizations than Ventura County.

4. Portfolio Level Data. . .
4-6
Final Summary Report: Process Evaluation of the 2006–2008 Local Government and Institutional Partnership Programs. 1/2/09
Figure 4-5 Customer’s Preferred Source of Energy Information*
24% 23%
36%
22%
4%
38%
5%8%
35%
15% 14% 17%
30%
11%
0%
20%
40%
60%
80%
100%
Local gov't Nonprofit Electric/gasutility
Water utility Other Doesn'tmatter
Don't know
Preferred Organization
Per
cent
Commercial (n=283)
Residential (n=217)
* Represents SCE and SCG customers
Slightly over half of residential and commercial respondents believe organizations differ in their ability to provide services to help save energy or water. The responses varied considerably. Below are a few examples of ways cited by participants in how organizations differ in their ability to provide energy-efficiency information and services:
“The private agencies are more dedicated to providing a service for profit.” (Residential)
“Non-profit would be more objective.” (Residential)
“The government is not as helpful as the utilities.” (Residential)
“The government may have more ability, but they may not be doing anything. The utilities may have more knowledge.” (Residential)
“Utilities might have an agenda, so they might be pushing it for their own profit.” (Commercial)
“Utilities have more information from my experience.” (Commercial)
“Electric and gas companies have more knowledge than government.” (Commercial)
“Nonprofits push the services more, make more of an outreach effort to community.” (Commercial)

4. Portfolio Level Data. . .
4-7
Final Summary Report: Process Evaluation of the 2006–2008 Local Government and Institutional Partnership Programs. 1/2/09
4.3.4 Home Efficiency for Residential Customers
Residential customers generally believe their home is efficient, with only nineteen percent stating their home is not at all energy efficient (Figure 4-6). Not surprisingly, a similar percent believe their home is in fair, terrible, or poor condition (21 percent). There was no statistical difference in opinions regarding to the efficiency level of homes by program.
Many of these respondents report taking low-cost or no-cost actions to save energy in their homes. Over half stated they installed CFLs and water conservation products. Another 40 percent said they purchased an energy efficient appliance.
Figure 4-6 Energy Efficiency of Home (n=216)*
31%
50%
19%
0% 20% 40% 60% 80% 100%
Very energy eff icient
Somew hat energyefficient
Not at all energyeff icient
Hom
e E
nerg
y E
ffici
ency
Percent
* Represents SCE and SCG customers
Table 4-4 below provides a comparison of energy efficiency actions taken by participants in the past two years. Note, again, that Ventura County is included but the sample size is very small so results for that program should be reviewed with caution.
Overall, the installation of CFLs and water conservation products are the most prevalently noted. Interestingly, the results by program were fairly similar across the board except for a few actions taken by Bakersfield-Kern participants. For example, participants in the Bakersfield-Kern were significantly less likely to report installing CFLs than participants from South Bay10. Additionally, participants in Bakersfield-Kern were
10 Significance at the 95 percent confidence level.

4. Portfolio Level Data. . .
4-8
Final Summary Report: Process Evaluation of the 2006–2008 Local Government and Institutional Partnership Programs. 1/2/09
significantly less likely to recall purchasing an ENERGY STAR thermostat than those in the other program.
Table 4-4 Installation and Energy-efficiency Actions by Program*
Bakersfield-Kern (n=61)
Energy Coalition
(n=67)
South Bay
(n=77)
Ventura County (n=6)
Overall (n=211)
Installed CFLs 34% 56% 77% 100% 59%
Installed water conservation product (low-flow showerhead or faucet flow-restrictors) 48% 56% 59% 50% 55%
Purchased ENERGY STAR appliance 18% 46% 43% 33% 37%
Efficiency of heating/cooling equipment checked 33% 41% 30% 33% 34%
Installed high-efficiency heating/cooling 18% 26% 23% 17% 22%
Pipe wrap installed 21% 18% 21% 17% 20%
Energy audit 13% 30% 17% 0% 19%
Installed energy efficient windows 13% 17% 22% 17% 18%
Other energy efficient home improvements 21% 11% 15% 33% 16%
Purchased ENERGY STAR thermostat 3% 21% 21% 0% 13%
Added insulation 5% 6% 17% 17% 10%
Behavior/change based on program participation 23% 33% 49% 33% 37%
* Represents SCE and SCG customers
The fact that participants made changes in their equipment or behaviors does not necessarily mean that the changes were program induced. Respondents were asked whether the improvements they made in the past two years were based on participation in the program. Only about third of program participants said the change was a result of program participation. South Bay participants were significantly more likely to say their changes were program induced when compared with Bakersfield-Kern participants.

5-1
Final Summary Report: Process Evaluation of the 2006–2008 Local Government and Institutional Partnership Programs. 1/2/09
5. UNIVERSITY OF CALIFORNIA/CALIFORNIA STATE UNIVERSITY PARTNERSHIP PROGRAM
5.1 INTRODUCTION
The state of California houses 23 California State University (CSU) and ten University of California (UC) campuses. These systems consume a significant amount of energy and represent a significant portion of the energy use in the state11, which partners recognize as an opportunity for energy-efficiency improvements.
The UC/CSU program began during the 2004–2005 cycle to overcome the barriers universities faced when trying to participate in utility energy-efficiency programs. The partnership’s success during the 2004–2005 program cycle led to its inclusion during the 2006–2008 program cycle. The success of this partnership also led to the creation of the CCC and CDCR Partnership partnerships for the 2006-2008 program cycle (described in Chapters 6 and 7).
The UC/CSU program is a statewide partnership that includes all four of the state’s investor-owned utilities as well as all fourteen of the campuses within the University of California and California State University systems. SCE is the lead utility. The program offers incentives for energy efficient retrofits and monitoring-based commissioning (MBCx), along with training for campus facility staff.
The program is one of the more ambitious partnership programs, with a significant statewide 2006–2008 budget of $40 million—$3 million of which is allocated to SCG. SCG’s goals for the 2006–2008 program are fairly ambitious, since gas is not the major fuel used at many of the 14 campuses in the utility’s service territory. The net goals for SCG are a savings of 856,800 therms.
5.2 PROGRAM BACKGROUND AND STRUCTURE
5.2.1 Program Description
The university systems are run out of central offices—the University of California Office of the President (UCOP) and the California State University Chancellor’s Office (CSUCO). Both central offices are directly involved in developing system-wide budgets and work closely with the respective campuses in each system. SCG has one staff person dedicated to the UC/CSU and CCC Partnership Programs.
The program concept includes three major components—energy-efficiency retrofits, monitoring-based commissioning, and energy-efficiency education and training.
1. Energy-efficiency retrofits. Retrofit efforts include HVAC systems and energy-management controls as well as lighting and controls through SCE, PG&E, and SDG&E involvement. According to interviews, the majority of the savings are realized
11 SCE 2530, UC/CSU/IOU Energy Efficiency Partnership, concept paper per the EEGA website.

5. University of California/California State University Partnership Program. . .
5-2
Final Summary Report: Process Evaluation of the 2006–2008 Local Government and Institutional Partnership Programs. 1/2/09
through the retrofit component of the program. Retrofits need to be deemed cost-effective to be considered for installation.
2. Monitoring-based commissioning (MBCx). The monitoring-based commissioning reviews building operations and installation of the equipment. The service goes beyond this traditional definition in several ways. First, the installations provide a built-in measurement and verification capability. Additionally, it provides education necessary to identify further energy-efficiency investment opportunities and become a “continuous commissioning” program and sustain savings.
3. Energy-efficiency education and training. This non-resource component of the program provides education and information dissemination to UC/CSU campus managers, project managers, and staff. The partnership’s training component has three sub-components:
a. Courses held directly by the partnership, most of which are run internally on the campuses on such issues as MBCx
b. External courses on such topics as LEED and Building Operator Certification (BOC), for which participants are reimbursed
c. Attendance at the annual sustainability conference, at which one campus receives an annual best practices award.
The UC/CSU partnership is supervised by a management committee that consists of representatives from each of the four utilities, the UCOP and the CSUCO. SCE, as lead utility, employs the statewide program administrative manager. The firm of Newcomb, Anderson, McCormick (NAM) was hired as the program administrative manager through a competitive bidding process. NAM coordinates bi-weekly management meetings with the management committee via teleconference and in-person meetings every few months.
Campus facility managers identify potential projects on their campuses, and then work with the UCOP and the CSUCO to obtain funding. The partnership pays up to 80 percent of the cost, depending on the energy savings associated with qualifying measures. The remainder comes from the campus budget.
Once the UCOP/CSUCO has signed off on a potential project, it goes through a due diligence review by SCG. The results of that review then go back to the campus, and any proposed project over $70,000 receives a pre-inspection. The next step is a review by the full management team, which must approve the project before work begins. Once the project has been approved, SCG signs an agreement with the campus, and work proceeds on the project. The agreement includes a schedule. Campuses receive up to 60 percent of the projected rebate when work begins, and 40 percent after the project has been completed and passed inspection.
5.2.2 Program Logic Model and Implementation Theory
According to the logic model (Figure 5-1), the UC/CSU’s main activities include education, training, and energy projects. These activities are to result in six outputs: (1) a best practices manual, (2) training via workshops, (3) outreach programs on all 14 campuses, (4) development of an Energy Services Company (ESCO) infrastructure, (5) project file review, and (6) paperwork and incentive facilitation.

5. University of California/California State University Partnership Program. . .
5-3
Final Summary Report: Process Evaluation of the 2006–2008 Local Government and Institutional Partnership Programs. 1/2/09
Figure 5-1 UC/CSU Logic Model
5.2.3 Data Tracking
NAM is responsible for maintaining the program tracking system and database. The tracking system details the status of projects over the life of the program cycle. The online tracking system also includes a document library with all program records and a system that tracks each project’s progress from design to completion.
All partners have access to the project tracking system, but its use varies by utility. In addition to reviewing the tracking system, SCG’s program manager also maintains her own internal spreadsheets for projects within SCG’s service territory. SCG updates its own information, while other utilities rely on NAM to enter information about projects within their service territories. Partners can use it to run a variety of reports at any time.

5. University of California/California State University Partnership Program. . .
5-4
Final Summary Report: Process Evaluation of the 2006–2008 Local Government and Institutional Partnership Programs. 1/2/09
5.3 KEY FINDINGS
Only six percent of the target net therms savings have been claimed as of June 2008; yet, the program claims it is still on track to meet its goals.
The program’s projected energy savings for the three program years is 856,800 net therms. As of June 2008, the program had only reported 51,855 net therms, or six percent of the target savings, yet has spent around 80 percent of its budget for the cycle12.
Although a low percentage of the target savings have been reported, program managers report that they are on target. The funds have been committed, which is represented in the high amount spent, but projects are not expected to be complete until December 2008. Once the project is complete, the program manager expects the reported savings to be on target and in line with the expenditures.
The UC/CSU Partnership Program, recognized by a national organization as an exemplary program, is well subscribed to in terms of education components of the program.
The UC/CSU Partnership program is running well. It has been written up as an ACEEE Exemplary Energy Efficiency Program13. According to the report, “The program is effectively transforming the California commissioning marketplace as many of these professionals [referring to engineers, consultants, and campus facility staff] have carried their knowledge and experience into other market sectors.” ACEEE lauds the program for providing the nation’s most comprehensive energy-efficiency program serving the higher education sector.
Campus participation in the internal partnership-offered training courses as well as external course offerings marketed and reimbursed by the partnership totaled approximately 2,045 person-days of training through December 2007. Most programs are oversubscribed, which indicates the high level of demand from the campuses for the training. Campus facility managers indicated that the building operator training, in particular, is one of the partnership’s most valuable opportunities, and that they would like to see more opportunities to offer that course to participants.
The program is growing to such a degree that the plan is for funding levels to increase significantly in the next program cycle. Discussions revealed that funding could increase significantly from $30 million across the three-year program to $30 million annually. Both the UC and CSU representatives welcome the potential expansion and believe the strong working relationships that exist today will pave the road for greater savings during the 2009–2011 program cycle.
12 Source: Energy Efficiency Groupware Application (EEGA), data through June 2008, posted 8/1/08
13 York, Dan, Marty Kushler, and Patti White, “Compendium of Champions: Chronicling Exemplary Energy Efficiency Programs from Across the U.S.” Published by American Council for an Energy Efficient Economy, Report Number U081 (February 2008).

5. University of California/California State University Partnership Program. . .
5-5
Final Summary Report: Process Evaluation of the 2006–2008 Local Government and Institutional Partnership Programs. 1/2/09
The UC and CSU representatives expressed high satisfaction for participating utilities, NAM, and the program in general. However, campuses identified several opportunities for improvement.
SCG received high marks from the two university systems for working with them as a full partner. Representatives from two universities said they would not be able to provide the same services without the partnership program and that the utility funding has produced energy savings that would not otherwise have been captured.
SCG’s part in the partnership program has been particularly successful due to the excellent coordination between SCG and UC/CSU, and in spite of a late program start. The late program start was, in part, due to turnover; SCG lost its first program manager early in 2006 and the current program manager was not brought on board until later that year.
One of these universities said they are reliant on the partnership’s technical support and believes this is a “true” partnership. They noted that the funding is important, but that technical support, to them, makes this a true partnership.
The campuses are appreciative of the work that is being done and find SCG easy to deal with. Campuses also commented that SCG’s process has been easy to follow.
Program representatives believe the partnership management team works well with NAM and are pleased with NAM’s work coordinating the partnership. All of those interviewed thought the solid working relationships contribute significantly to the partnership’s overall success.
Both the UCOP and CSU chancellor’s office complimented the utility for its efforts to work with campus schedules. Both systems are pleased with SCG’s program efforts and staff.
One area for improvement emerged through interviews with facility staff. There was discussion from staff that they would like to see greater involvement from SCG earlier in the planning process. Specifically, they stated they would benefit from greater engineering assistance from the utility to do the preliminary assessment.
Another area of improvement relates to the distribution of funds. Currently, the program distributes its funds to individual campuses rather than retaining central control. Interviewees expressed that this is not an optimal way to distribute the funds, as the campuses then have the opportunity to spend the funds on other projects.
Moving into the next planning cycle, the program plans to circumvent this issue by centralizing the funding streams to the UC and CSU systems. The UC and CSU systems will maintain control of the money allocated for efficiency improvements, rather than it being delegated to the individual campuses where it often becomes diverted for other projects. Thus, the central administration will be able to help keep the overall program on track to meet its goals.

5. University of California/California State University Partnership Program. . .
5-6
Final Summary Report: Process Evaluation of the 2006–2008 Local Government and Institutional Partnership Programs. 1/2/09
Barriers to program implementation and/or achieving higher levels of savings were identified through the research process. The barriers include staffing, funding levels, gas opportunities, incentive levels, program cycle, project duration, and new construction needs.
Interviewees identified five additional barriers to program implementation and/or achieving a higher level of savings. The first barrier identified was inadequate internal staffing on campuses. Interviews noted the campus capital staff has many responsibilities, and it is hard to get their attention. Smaller campuses have to hire a third party to do full project design, which takes time and money. Therefore, they would like to see more technical assistance from utilities.
Second, interviewees expressed that it was difficult to get money from the campuses to cover portion of project that the partnership does not cover. The campuses have a fixed amount of money to spend on capital improvements annually, so energy projects compete with other non-energy investments for that funding. An advanced/early notification by the utility about the amount of funding available for the next program cycle will help facility managers to better planning of energy-efficiency projects.
The third barrier is the low incidence of gas opportunities relative to electric opportunities. The universities noted that while SCG is working very hard to achieve savings, the impact cannot be as great because the potential gas savings for the campuses is minor compared to the potential kWh savings. Thus, the campuses tend to focus on the larger electricity savings.
The fourth barrier relates to the incentive levels for gas measures. Overall, the campuses are pleased with the incentives offered. However, a number of the campuses interviewed in SCG’s service territory mentioned that gas measures receive a lower incentive than electricity saving measures. Two campus managers said they would be able to undertake more gas measures if the incentive levels were closer to those offered for electricity saving measures.
The fifth barrier identified, an administrative barrier, is the length of a program cycle. The time restriction of a program cycle, while not noted as a barrier per se, was discussed by universities as a limitation to the program. Universities would like to see an ongoing program that is not bound by the artificial restrictions of the CPUC’s program years. Interviews describe the desire for an “evergreen” program that provides funding on a rolling basis rather than a strict 36-month cycle as currently established. The sentiment is that the program takes a considerable amount of time to ramp up and by the time the program is steadily making progress or worked out any issues it begins to ramp down.
Along the same lines as the program cycle, program partners would like to see a longer project duration period. Projects usually take a long time to develop, at least a year. Therefore, it would be desirable to have a project pre-planning period of one year, submit projects, get them approved, and then roll them into a three- to five-year cycle.
Last, the inability to address new construction needs was cited as a barrier. New construction is provided by a separate program—Savings by Design. According to interviews, there is significant opportunity for the program to address and achieve

5. University of California/California State University Partnership Program. . .
5-7
Final Summary Report: Process Evaluation of the 2006–2008 Local Government and Institutional Partnership Programs. 1/2/09
greater savings from these new construction projects. Interviewees suggested that new construction be an active component of the program. The program is considering incorporating the new construction component for the next program cycle.
5.4 CONCLUSIONS AND OPPORTUNITIES FOR IMPROVEMENT
SCG’s portion of the UC/CSU Partnership by all accounts is very successful. There are several factors that clearly play a role in the program’s success.
• All of the partners are engaged in and committed to making the program work. The partnership was able to work out some issues during its initial cycle, leading to a much stronger program overall during the 2006–2008 program cycle.
• All partners’ roles are defined clearly and are operating as defined. Both SCG and UCOP have had staff changes during the 2006–2008 program cycle, but those changes did not impact the program negatively because each partner’s roles are clear and new staff stepped right into those roles.
• Regular communication has facilitated program success. The partnership management meetings initially were held on a monthly basis, but have become bi-weekly as project activity has increased. In addition to the monthly meetings, SCG has additional teleconferences with the UCOP and CSUOC and the individual campuses as often as is needed. The frequent communication ensures that any issues that arise are handled quickly and efficiently, thus keeping the program on track to meet its goals.
• The program has been able to grow and evolve. The 2006–2008 program incorporated several changes from the 2004–2005 program, based on the experience gained during the initial two program years.
• SCG staff work closely with local facilities. SCG, in working closely with these facilities, has helped to make the participation as smooth as possible for those facilities.
Because of the close working relationship between SCG and its partners, partner concerns already are being addressed in the 2009–2011 program design. One area identified by the universities is improving the effectiveness of the program and increasing the opportunities to realize savings. For example, during the 2006–2008 cycle any new construction on a UC or CSU campus were addressed by a separate program—Savings by Design—rather than the partnership. In the next program cycle, it has been suggested that new construction be included in the partnership program, allowing the universities to address the efficiency of all facilities—both new and existing—through one program.
The partnership also is examining how best to meet the universities’ request for an “evergreen” program that will better match campus planning cycles rather than being tied directly to the CPUC’s defined program periods. The current cycle is only three years, but there is a sentiment that this is not a long enough period to ramp up the program and then achieve the targets established.

5. University of California/California State University Partnership Program. . .
5-8
Final Summary Report: Process Evaluation of the 2006–2008 Local Government and Institutional Partnership Programs. 1/2/09
One positive change moving forward after 2008 is that the UC and CSU systems will maintain control of the money allocated for efficiency improvements, rather than it being delegated to the individual campuses where it often becomes diverted for other projects. Thus, the central administration will be able to help keep the overall program on track to meet its goals
Discussions about the 2009–2011 cycle have focused on expanding program funding significantly from $30 million across the three-year program to $30 million annually. Both the UC and CSU representatives welcome the potential expansion and believe the strong working relationships that exist today will pave the road for greater savings during the 2009–2011 program cycle.
In addition to the points above, interviews identified additional opportunities for improvement.
• Training. BOC (Building Operator Certification) has been very successful and popular among facility staff. They would like to have it promoted more and combined with training at utility facilities. The program should review the option of providing specialized training to individual campuses (e.g., proprietary system of control). Interviews also revealed that additional in-depth training for facility staff would be beneficial. The in-depth training should be customized, and focus on the needs of the individual campus.
• On-Line energy-efficiency forum. In a peer-to-peer networking approach, an online energy-efficiency forum would provide an opportunity for facilities to share and disseminate information with each other. The format of this forum could include a chat room, space for posting success stories and hurdles faced in implementing projects, and reference sources.
• Engineering assistance. Interviews suggested a greater need for utility involvement in the program planning stages. As such, utilities should consider providing engineering assistance to do preliminary energy-efficiency assessments.

6-1
Final Summary Report: Process Evaluation of the 2006–2008 Local Government and Institutional Partnership Programs. 1/2/09
6. CALIFORNIA COMMUNITY COLLEGES PARTNERSHIP PROGRAM
6.1 INTRODUCTION
The California Community Colleges (CCC) program is a nonresidential program, first established in the 2006–2008 program cycle. The CCC program is a statewide partnership program that includes all four of the state’s investor-owned utilities. SDG&E is the lead utility for the CCC Partnership.
The momentum for developing the CCC program came from the success of the 2004–2005 UC/CSU program. CCC was designed to follow the UC/CSU model, with a central management committee that worked with the Community College Chancellor’s Office (CCCO) to promote energy efficiency at the state’s 10914 community colleges. CCCO opted to participate in the partnership program because of its comprehensive approach to energy efficiency.
The CCC system is not organized centrally, thus each community college manages its participation in the program individually. Currently, only 54 of the community colleges are participating in the program.
The SCG CCC Partnership net goal for the 2006–2008 cycle is 559,200 therms. Only one utility, SCE, is on track to meet its CCC Partnership goals. SCG, like SDG&E and PG&E, does not expect to meet its goals. The decentralized structure of the CCC system has posed significant challenges to the program.
6.2 PROGRAM BACKGROUND AND STRUCTURE
6.2.1 Program Description
California’s Community Colleges have $18 billion in public bond funding to spend on improving the facilities of CCCs. The funding will, among other improvements, support retrofits and new constructions over the next ten years.
The CCC Partnership program was developed to incorporate energy-efficiency efforts into these planned retrofits and new constructions. It is set up similar to the UC/CSU Partnership with a management committee that includes the four participating utilities, the CCCO, and the program administrator. NAM was selected to serve as the program administrator through a competitive bidding process similar to the one carried out for the UC/CSU program.
The Program Concept includes three major components—energy-efficiency retrofits; new construction assistance; and energy-efficiency education and training. One
14 The number of campuses reported varies by source and tends to range from 109–110 campuses. (E.g., program logic paper, Quarterly report, “California Community College Partnership Program Sustainable Collaborative Presentation” from 2006).

6. California Community Colleges Partnership Program. . .
6-2
Final Summary Report: Process Evaluation of the 2006–2008 Local Government and Institutional Partnership Programs. 1/2/09
additional component is presented separately in this discussion: monitoring-based commissioning.
1. Energy-efficiency retrofits. The program meets with community college district administrative and facility staff to identify potential energy-efficiency opportunities. The program also provides direction to incentives that will help offset the costs of the investments. Examples of retrofit opportunities include boiler replacement, installation of new water heaters, and tankless water heaters.
2. New construction assistance. As outlined in the program concept, this element of the program will help community colleges in designing their new construction projects to be in compliance with Title-24 minimum standards. This assistance was to include design review, development of design guidelines, and providing incentives toward incremental costs of energy efficiency in these new construction projects. New construction, while included in the Program Concept, is in practice not offered by the program. As discussed in the “Key Findings” section below, Savings by Design addresses the new construction needs.
3. Energy-efficiency education and training. The program offers training opportunities to CCC staff and project managers. The trainings piggyback on training opportunities offered through the UC/CSU program. The subject matter of the trainings is determined by the needs of the campuses participating in the program. Additionally, the program offered educational opportunities to provide a review of energy-efficiency best practices.
4. Monitoring-based commissioning (MBCx). Not detailed as a separate line item in the program concept paper, monitoring-based commissioning ensures that the facilities are operating at an optimal energy-efficiency level. Additionally, it provides opportunities to identify further energy-efficiency investment opportunities. The monitoring-based commissioning component of the program is deemed as a pilot, and has not yet resulted in significant energy savings. The First Quarterly Report Narrative noted the program had several projects approved at campuses, which included two MBCx workshops to provide information related to program requirements and promote program participation.
The partnership focused almost completely on developing retrofit projects during the 2006–2008 rate cycle. Savings for new construction projects are being recognized under the Savings by Design program.
The CCC Partnership program was designed with the assumption that the CCCO would be able to play a role similar to that played by the UCOP and CSUCO with the UC/CSU Partnership where the decision-making and management is centralized. However, the community colleges have a decentralized, district-based structure, in contrast to the UC/CSU centralized decision-making structure.
The lack of centralization has posed a challenge to the partnership overall in terms of reaching the individual community college campuses. Campuses must be contacted through their districts, each of which has its own elected Board of Governors. The Board

6. California Community Colleges Partnership Program. . .
6-3
Final Summary Report: Process Evaluation of the 2006–2008 Local Government and Institutional Partnership Programs. 1/2/09
of Governors is the decision-making entity for program participation. And while the CCCO can advertise the program, it has no direct influence on participation.
6.2.2 Program Logic Model and Implementation Theory
Figure 6-1 shows the program’s overall program theory and logic model. The program theory and logic model is identical to the UC/CSU program. The major activities are education, training, and energy projects. These activities are to result in six outputs: (1) a best practices manual, (2) training via workshops, (3) outreach programs on all 54 campuses, (4) development of an Energy Services Company (ESCO) infrastructure, (5) project file review, and (6) paperwork and incentive facilitation.
Figure 6-1 CCC Logic Model

6. California Community Colleges Partnership Program. . .
6-4
Final Summary Report: Process Evaluation of the 2006–2008 Local Government and Institutional Partnership Programs. 1/2/09
6.3 KEY FINDINGS
The CCC Partnership program reports achieving 12 percent of its gas-savings goals as of June 2008. Initially noting a shortfall in savings for participating utilities, the program began redirecting its marketing and outreach efforts.
For the 2006–2008 cycle, CCC’s gas-savings goals are 559,200 net therms. These goals represent approximately a 12 percent reduction of gas use in the community college campuses served by SCG.
As of June 2008, 69,155 net therms had been saved. This savings represents 12 percent of the entire cycle goal.
An enhanced outreach, marketing, and program development effort has continually attempted to identify opportunities to promote greater savings resulting from the program. This effort was initially directed to help PG&E, SCG, and SDG&E improve their progress toward savings goals. Examples of these efforts include sweeps of campuses to identify project opportunities and identification of “quick turnaround projects” that could deliver significant savings such as emerging technologies and monitoring-based commissioning information technologies applications.
Time and staffing constraints within the community colleges hinder the ability for facility managers to support project opportunities through the program. Interviews identified that having a single point of contact would help support these overtaxed community colleges.
Community college staff with whom PA spoke indicated that they are pulled in too many directions to devote significant time or resources to exploring energy-efficiency projects. While some community colleges cited financial constraints, most campuses are constrained by the demands on the facility manager. Not only are these facility managers responsible for any projects requiring capital investment, but they are generally also responsible for maintenance projects. The staff constraints, along with the additional funding for community college upgrades, means that there is not significant time to devote to the program. Therefore, it is not surprising that nearly all said that they could not participate in the program without extensive utility support.
Whereas the UC/CSU usually have dedicated energy managers for each campus, the community college campuses tend to have one facilities manager whose job includes, but is not focused on, energy issues. Additionally, community college campuses tend to be more expansive in terms of the physical space they encompass and the location of their buildings, which creates additional time constraints on the facility managers. Therefore, it is often the case that they have difficulty even completing the administration processes.
The result is that the CCC program needs much more time and effort from the program manager for fewer energy savings than does the UC/CSU program. Facility managers voiced that it would be beneficial to them if utility program staff provided a greater level of assistance, particularly early in the planning process.

6. California Community Colleges Partnership Program. . .
6-5
Final Summary Report: Process Evaluation of the 2006–2008 Local Government and Institutional Partnership Programs. 1/2/09
Interviewed colleges and SCG indicate that SCG is involved in the process and helps to minimize the administrative burden on the participating community colleges. Once a campus in SCG’s territory expresses interest in participating, the SCG program manager works closely with them to complete all the program paperwork. Because the chief business officers and District Boards are the financial decision makers, the program manager must obtain agreement from both, as well as from the facilities manager, before a project can progress. In many cases, SCG’s program manager has had to complete the paperwork for them. The result is that the CCC program needs much more time and effort from the program manager for fewer energy savings than does the UC/CSU program.
One comment expressed by several community colleges is that they would prefer to have one single point of contact “like at SCE” so that they would have one person whom they can call with any questions. Currently, community colleges that work with SCG have a different contact depending on their needs. For example, they have a contact for the partnership program, they may have a contact for other core programs, and they may have yet another contact as an account manager. This differs from SCE’s structure, where one key account manager is the point of contact to direct them on the programs they participate in, their account, etc. This single point of contact structure is appealing to the community colleges.
Program marketing and outreach has continually evolved throughout the program cycle.
Program marketing to the community college campuses has evolved since program inception. In 2006, the partnership management team contracted with a non-profit group called the Foundation for Community Colleges to market the program across the state. The rationale was that because the Foundation works with many community colleges on issues like bulk purchasing, its existing relationships could be leveraged to market the partnership. However, at the end of the first year, the Foundation had done little to market the program and the management team had to develop a new statewide marketing and outreach approach.
SDG&E and PG&E relied heavily on the Foundation for marketing and outreach, whereas SCE took a more proactive approach and had an account representative who was dedicated to working with community colleges. As noted above, SCE is the only utility that provided this sing point of contact. SCE is the only one of the four utility partners that is likely to meet its 2006–2008 CCC Partnership goals. SCG has benefited from SCE’s proactive approach and has revised its own program implementation approach to also involve its key account representatives’ more directly.
The outreach efforts are somewhat thwarted by the relatively low value of funds compared to the $18 billion in public funding that the state voted to use for community college upgrades and expansions. Overall, partnership program funding ($22 million total for the state) is a “drop in the bucket” compared to the public funding. In recognition of the greater challenge associated with getting the community colleges involved, the program offers a higher incentive rate than the UC/CSU Partnership, but that rate has not been sufficient to engage the community colleges.

6. California Community Colleges Partnership Program. . .
6-6
Final Summary Report: Process Evaluation of the 2006–2008 Local Government and Institutional Partnership Programs. 1/2/09
Beginning in 2007, much of the partnership program’s statewide marketing and outreach has been done by a representative from the CCCO. In 2007, SCG’s program manager15 also has become more active in reaching out to the community colleges within the utility’s service territory as a result of the Foundation’s failure to market the program. The Chancellor’s office has helped set up meetings at campuses, but SCG staff have assumed most of the burden of helping campuses develop and submit project applications.
There has been little activity within the training and education component of the program; resource efforts have taken a higher priority.
The CCC Partnership includes a training and education component similar the UC/CSU Partnership. However, training has been a relatively low priority during this program period compared to meeting resource goals.
In one example, the management team spent a year working on getting community college districts to adopt the California High Performance Schools system16, which covers every aspect of operations from landscaping to equipment maintenance and ties in with overall state sustainability and energy-efficiency goals. It became clear after a year that it would take longer than one partnership program cycle for the community colleges to adopt this system, so the management team has instead focused on enrolling community college facility managers in programs offered through IOU-funded Energy Centers. Management team members anticipate that the training will be a greater focus in the partnership’s next phase.
Representatives from the community colleges have participated in a large number of sustainability conferences during the 2006–2008 partnership. Facility staff members from the community colleges have attended the annual UC Santa Barbara UC/CSU Sustainability conferences and energy efficiency-related presentations at the annual Community Colleges Facilities Coalition conferences in Sacramento.
Additionally, the management team is discussing how the partnership might be integrated into curriculum development at the individual campus level. One example being considered is training HVAC technicians on energy-efficient maintenance.
While training has not played as great a role in this initial CCC Partnership program as initially conceived, several of the staff interviewed believe that the partnership has successfully increased awareness about energy-efficiency issues at the individual district and campus level. They believe this increased awareness will make project implementation easier in the next program cycle.
15 The SCG program manager is responsible for both the CCC and UC/CSU Partnerships.
16 “The mission of the Collaborative of High Performance Schools is to facilitate the design of high performance schools; environments that are energy and resource efficient, healthy, comfortable, well lit; and contain the amenities needed for a quality education. CHPS developed the nation's first green building rating program especially for schools.” See website for further details: http://www.chps.net/.

6. California Community Colleges Partnership Program. . .
6-7
Final Summary Report: Process Evaluation of the 2006–2008 Local Government and Institutional Partnership Programs. 1/2/09
Interviews report resource barriers to incorporating partnership and project information into the program tracking database in a timely manner. The program is considering alternative means for collecting and documenting project data, potentially piggybacking on the current community college database system.
As is the case with UC/CSU, NAM maintains the program tracking system and database. All partners have access to the project tracking system, but its use varies by utility. SCG updates its own information, while other utilities rely on NAM to enter information about projects within their service territories.
The online tracking system includes a document library with all program records and a system that tracks each project’s progress from design to completion. Partners can use it to run a variety of reports at any time. The system was not operational at the beginning of the 2006–2008 program, but rather has been developed over the program period and became fully operational in 2007.
NAM has found it difficult to get timely information from the campuses to put into the database. The original thinking was that the campuses would maintain their own information on the website, but that has not happened because campus facility managers are overextended. The utilities have taken on the responsibility for getting information updates from the campuses, but the campuses do not always respond quickly to requests for updates and SCG’s program manager has limited time to pursue them. Therefore, the information is not as current as is the data on the UC/CSU system.
The SCG program manager also maintains her own internal spreadsheets for projects within SCG’s service territory; however, the validity of that spreadsheet, like the data on the website, is dependent on input from the community college facility managers. Therefore, the information is not as current as is the data on the UC/CSU system
The community colleges have developed their own database system for tracking campus maintenance. The system does not include energy efficiency at this time but does have significant information on campus facilities. CCCO is working with the utilities to get access to this system, which will provide the utilities with information about their local campuses’ needs.
Interviews expressed satisfaction with their relationship with SCG. However, these interviews identified barriers to program implementation and/or achieving a higher level of savings. The barriers include staffing, funding levels, low incidence of gas opportunities, program cycle, project duration, and new construction.
Similar to findings for the UC/CSU, participating CCCs appreciate the support they receive from SCG and state how crucial the utility’s involvement is in their level of participation on the program. However, there was discussion from facility staff interviewed that they would like to see greater involvement from SCG earlier in the planning process. Specifically, they stated they would benefit from greater engineering assistance from the utility to do the preliminary assessment.
However, interviews identified barriers to program implementation and/or achieving a higher level of gas savings. These barriers are the same as those identified for the UC/CSU program. It is important to note that while the barriers are the same, due to the

6. California Community Colleges Partnership Program. . .
6-8
Final Summary Report: Process Evaluation of the 2006–2008 Local Government and Institutional Partnership Programs. 1/2/09
high resource constraints discussed earlier in this chapter the barriers tend to be more pronounced for the CCC Partnership.
• Inadequate internal staffing for community colleges. Community colleges are expansive and include many buildings, more than the UC and CSU campuses. Interviews with each community college staff confirmed how incredibly overwhelmed they feel in all they need to do. Therefore, they would like to see more technical assistance from utilities.
• Getting money from the campuses to cover portions of projects that the partnership does not cover. The community colleges have a fixed amount of money to spend on capital improvements annually, so energy projects compete with other non-energy investments for that funding. Also, advanced/early notification by the utility about the amount of funding available for the next program cycle would help facility managers to better plan energy-efficiency projects.
• The low incidence of gas opportunities relative to electric opportunities. The community colleges noted that while SCG is working very hard to achieve savings, the impact cannot be as great because the potential gas savings for the campuses is minor compared to the potential kWh savings. Thus, the community colleges tend to focus on the larger electricity savings.
• Length of program cycle. The process findings from the CCC Partnership interviews illustrates while community colleges would prefer the program cycle to be lengthened, it takes time for a program to understand the market it is serving and the culture of the partners. Although an education system, the culture and organization of community colleges differs from UC and CSU campuses so the processes between the two programs may need to differ. Programs take a considerable amount of time to ramp up and, by the time the program begins to make progress or works out any issues it will begin to ramp down.
• Project duration. Along the same lines as the program cycle, program partners would like to see a longer project duration. Projects usually take a long time to develop, at least a year. Therefore, it would be desirable to have a project pre-planning period of one year, submit projects, get them approved, and then roll them into a three- to five-year cycle.
• Inability to address new construction needs. New construction is provided by a separate program—Savings by Design. According to interviewees, there is significant opportunity for the program to address and achieve greater savings from these new construction projects. Interviewees suggested that new construction be an active component of the program. The program identified this as an area in need of change for the next program cycle and is planning on incorporating new construction into its program offerings.
6.4 CONCLUSIONS AND OPPORTUNITIES FOR IMPROVEMENT
All parties believe that one of the most effective aspects of this program is the regular and ongoing communication among all the partners. While the partnership continues to identify and address various issues, the strong communication between the partners is what makes such work possible.

6. California Community Colleges Partnership Program. . .
6-9
Final Summary Report: Process Evaluation of the 2006–2008 Local Government and Institutional Partnership Programs. 1/2/09
The evaluation process identified three issues that face partnerships that need to be addressed for the 2009–2011 program cycle. First, partnership funding levels are not yet high enough to attract community college attention on a large scale. This is not so much an incentive-level issue; rather, it is an issue of whether the funds available to the community colleges are significant enough to get their attention. They have extensive funds available to encourage upgrades to facilities via the public bonds funding, which dwarfs the funding available through the CCC Partnership and minimizes the campuses’ attention toward the partnership’s offerings.
At the time of this evaluation, the program was developing their 5–7 year maintenance and capital improvement plans. The program uses these plans to develop the 2009–2011 partnership program goals. The colleges expressed that it would be useful to have an understanding of what their budgets would be for the next program cycle so they could plan their energy-efficiency projects accordingly.
Second, community colleges have significantly less resource capacity to implement this partnership than do the UC and CSU campuses on which the program was modeled. SCG resources are being leveraged to help stretch the community college resources and provide greater administrative assistance than anticipated.
Third, community college staff would like to have a single point of contact at the utility who will handle all programs, service issues, etc. This single point of contact would help streamline the resource-constrained community college activities with the utility.
Program partners are working together to revise the program for the 2009–2011 program period. Several of the issues that have been identified during the 2006–2008 CCC Partnership already are being addressed in the 2009–2011 program design.
• The partnership will be increasing education opportunities and expanding those opportunities to provide assistance in developing energy-efficiency plans. Campuses need help with developing energy-efficiency plans, and with the understanding of how to incorporate energy efficiency into their existing plans. Building in this type of assistance will increase program effectiveness overall. The Community College central office hopes to work with districts to develop an energy plan that will be reviewed and approved at the central level.
• The 2009–2011 program will include both retrofits and new construction, which also will facilitate community college involvement.
Additionally, the following opportunities for improvement are identified through evaluation efforts.
• Increase community college account representative involvement in the program. SCE is the only utility on track to meet its 2006–2008 CCC Partnership goals. While SCG’s program manager has done an excellent job of increasing community college involvement since she took over the program in late 2006, SCG would benefit from increasing its community college account representative’s involvement in the program. If that individual can work with the community colleges to actively identify potential projects, then SCG should be able to achieve higher program energy savings during the 2009–2011 program cycle.

6. California Community Colleges Partnership Program. . .
6-10
Final Summary Report: Process Evaluation of the 2006–2008 Local Government and Institutional Partnership Programs. 1/2/09
• Consider adding one or more program assistants. While the program is considered to be a partnership program, the reality is that there are too many community colleges in SCG’s service territory for one person to provide the hand-holding assistance needed. Having an additional person to support the program manager will help facilitate data gathering and maintenance both at the utility and statewide levels.
At the statewide level, PA offers two suggestions in addition to those already under consideration, for improving the program in the next cycle.
• Work with at least one community college within each utility service territory to develop and deliver the program’s training and education component. Using community colleges to provide training will ensure capacity is built locally and will provide a model other colleges can adopt.
• Implement a peer-to-peer program. The CCC Partnership already offers community colleges an opportunity to learn from each other through its participation in the UC/CSU Sustainability conference and the annual Community Colleges Facilities Coalition conference. The partnership can build on that base by matching colleges within utility service territories so that those that are active in the program can provide advice to others that are less active. Such a program will also help to reduce the overall burden on the utility to provide ongoing support to the community colleges, thus helping the program to move in the direction of a more even partnership. One way to accomplish this would be to establish a “sub-management” committee to meet within each district.

7-1
Final Summary Report: Process Evaluation of the 2006–2008 Local Government and Institutional Partnership Programs. 1/2/09
7. CALIFORNIA DEPARTMENT OF CORRECTIONS AND REHABILITATION PARTNERSHIP PROGRAM
7.1 INTRODUCTION
The California Department of Corrections and Rehabilitation (CDCR) Partnership was a new statewide partnership under the 2006–2008 program cycle. This statewide partnership program, led by PG&E, is a nonresidential program targeting prisons and youth facilities. Program offerings include incentives for retrofit projects, continuous commissioning, and training for the facility managers.
The CDCR operates 34 adult facilities, 8 youth facilities, and 16 parole offices throughout California, with a combined conditioned space of almost 50 million square feet. The CDCR was selected as a partner for several reasons, the most notable being their history in promoting energy-efficiency projects.
No gas savings have been claimed to date as no SCG customer facilities have completed their installations yet under this program. This, according to interviewees, is due to a backlog of work. The program anticipates it will reach program goals by the end of the 2006–2008 cycle period.
7.2 PROGRAM BACKGROUND AND STRUCTURE
7.2.1 Program Description
The CDCR Partnership promotes energy-efficiency projects and best practices at the correctional facilities and offices run by the CDCR. The CDCR Partnership is new, established for the 2006–2008 rate cycle.
The CDCR Partnership is a centrally managed program. The Department has a Director of Energy Management who oversees the facilities management operations of all California correctional facility campuses (over 130 campuses, some with multiple buildings). This individual identifies energy-efficiency opportunities, trains facility managers, and coordinates project work. Using a central management approach eliminates the need for each individual campus to pursue its own facilities’ maintenance, improvement, and construction projects.
The program implementation plans developed by the four IOUs for the CDCR Partnership envisioned at least three major components—retrofit projects, retro-commissioning, and education and training:
• Energy-efficiency retrofits. ESCOs work with the CDCR to update early feasibility studies with their own detailed assessments, and install measures using incentives from the program. The projects, capped at $1 million, were required to fall within a five-year payback. ESCOs install the measures and the IOUs provide incentives based on first-year savings. The balance of costs not covered by the program is paid through financing offered by the Department of General Services.
• Monitoring-based commissioning. This program component was designed using the 2004–2005 UC/CSU commissioning program as a basis. The program defined

7. California Department of Corrections and Rehabilitation Partnership Program. . .
7-2
Final Summary Report: Process Evaluation of the 2006–2008 Local Government and Institutional Partnership Programs. 1/2/09
this offering as going beyond the standard commissioning program in that (a) the installation will ensure an extensive and comprehensive built-in measurement and verification capability, (b) the commissioning will be combined with education and training to optimize and sustain the energy savings, and (c) the program will use the institution’s facility management to identify additional opportunities.
• Education and training. The program was designed to offer training opportunities to CDCR project managers and facilities staff on energy efficiency and best practices, building upon work that was done during the 2004–2005 cycle for UC/CSU modified to the CDCR facility environment.
The partnership focused almost completely on developing retrofit projects during the 2006–2008 program cycle. The retrofit component of the program was viewed as having the greatest energy-savings potential; therefore, the CDCR and IOUs decided to devote their resources and energies to honing the process for this program element.
In 2006, the four IOUs commissioned audits of the major CDCR facilities. Those audits provided a preliminary list of cost-effective retrofit measures at each of the institutions. In the same period, the CDCR issued a Request for Qualifications to energy service companies, contractors, and energy management companies to develop energy-efficiency projects for the CDCR. Eleven ESCOs were selected through this process.
The CDCR provided selected ESCOs initial audit results and instructed them to perform an investment grade audit of the facilities assigned to them. Based on this audit, ESCOs proposed to the CDCR a project plan that passed several financial criteria. Specifically, the project was required to (1) have a maximum payback of five years, (2) provide a positive cash flow from savings in the first year, and (3) cost less than $1 million.
The partners hired Newcomb, Anderson, McCormick to act as an “owner’s representative” for the program. NAM is responsible for conducting technical assessments, verifying the financial calculations, and supporting the partners in processing and approving the projects.
The financing of the capital investment retrofit projects comes from two sources. First, utility-offered rebates offset the initial cost. The value of the rebates is determined based on the first year kWh savings. The Energy $mart financing program offered by the California Department of General Services, provides another financing option. Through the Energy $mart program, California government entities can obtain financing at rates that are typically half those of commercial loans.
7.2.2 Program Logic Model and Implementation Theory
As shown in Figure 7-1, the main activities of the CDCR program are marketing, education and training, identification of retrofit projects, and continuous commissioning. These activities are to result in six outputs: (1) energy management staff communications, (2) best practices, (3) trainings and workshops, (4) project approval, (5) develop ESCO infrastructure, and (6) installation of metering equipment.
Based on this process evaluation, there is only one element of the program logic that can be confirmed for SCG—the Retrofit Project element—since this is the only program

7. California Department of Corrections and Rehabilitation Partnership Program. . .
7-3
Final Summary Report: Process Evaluation of the 2006–2008 Local Government and Institutional Partnership Programs. 1/2/09
element that achieved any level of implementation to date. Based on our research, there are two elements that were not reflected in the original logic model that we have now included in the logic model in this final report.
• Technical review of work scope proposals. All projects experience a technical review, whereby recommended retrofits must pass a five-year payback criteria. ESCOs comment that this was not originally articulated as a requirement but, based on interviews, it is a confirmed element of the approval process for projects to proceed.
• Financial package. The securing of financing for the project was not reflected in the original logic model, and yet this became a critical factor in the program process. Projects that receive approval for the financing step can proceed to implementation.
Figure 7-1 CDCR Logic Model

7. California Department of Corrections and Rehabilitation Partnership Program. . .
7-4
Final Summary Report: Process Evaluation of the 2006–2008 Local Government and Institutional Partnership Programs. 1/2/09
7.3 KEY FINDINGS
7.3.1 Partnership Goals and Expectations
The program has made no progress toward its energy saving goals based on reported savings; however, the program claims the committed projects will result in sufficient energy savings to reach their goal by the end of the program cycle. The delay in achieving savings was attributed to financing issues at the state level.
The CDCR program for SCG has net goal of 175,200 therms. The June 2008 Quarterly Report Narrative indicates that there has been no progress made towards these goals. However, with these approved campuses preparing to realize the projected savings, the program is reported as on target to achieving its therms savings goals. The program has a significant “commitment” for therms savings of over 500,000 therms that SCG anticipates will be realized before the end of the cycle as these projects are now moving forward.
The program has suffered from stalled project implementation due to financing issues for the State’s portion of the costs. Those issues, which were only recently resolved, have resulted in a significant backlog of projects awaiting implementation. The partnership expects that those projects will move forward quickly from this time forward. Since most proposed projects have less than a 24-week implementation cycle, CDCR projects that the majority of these projects will be completed by the end of the program cycle (assuming the ESCO contractual extension issue is resolved).
According to the latest quarterly narrative as posted by SCG17, the management team approved projects based on applications from CDCR for projects, including those from SCG, that have met IOU due-diligence review criteria based on CPUC filed plans. Project Agreement Packages were generated based on the audits conducted in 2007. These agreements committed the funds for the projects and allowed CDCR to move forward with implementation activities including procurement of additional funds through the state’s GS $mart financing program. The incentives and savings numbers in the agreement will be modified according to an assessment of the final implementation proposal to be provided by the ESCOs. According to the project manager, there are nine CDCR campuses identified in the SCG service territory and of these seven have achieved the stage of ESCO approval.
Last, due to the delays in implementing projects, none of the training has taken place. The focus of the program for the remaining seven months is to get as many projects completed as possible to contribute to the resource energy-savings goals.
Establishing a means for providing financing to participating facilities is seen as a primary success for the partnership program. With that said, the process took longer than expected and was an initial barrier to project implementation.
17 Q1 2008 Narrative found on CPUC EEGA website.

7. California Department of Corrections and Rehabilitation Partnership Program. . .
7-5
Final Summary Report: Process Evaluation of the 2006–2008 Local Government and Institutional Partnership Programs. 1/2/09
As described above, the program provides a financing option to participating facilities through the Energy $mart program. The partners worked closely with the California Department of General Services to integrate the financing option into the CDCR Partnership program.
The partnership members, particularly the IOUs, believe that their collective pressure to establish the process to provide financing to participating facilities was a primary success for this program. It provides a means for facilities to address program costs not covered by IOU rebates at a rate discounted from those traditionally offered to commercial customers.
Unfortunately, this process took longer than anticipated and, in turn, was a significant barrier to project implementation. The financing needed to be in place to approve the projects and, without the financing option being in place, projects stalled. Since securing the financing, the management team has been reviewing project applications and processing them on a regular schedule.
With the mechanism for financing established, an additional barrier arose—the financing approval process for projects. The financing has to be approved for a project before it can move forward. As an example, one ESCO expressed incredulity that a project with almost 90 percent covered by IOU incentive money was not allowed to proceed without the balance of financing worked out and approved. In this case, waiting for the financing details delayed the project for several weeks.
The resolution of the financing problem—using Energy $mart—has far-reaching implications for energy-efficiency projects in state facilities well beyond those included in this partnership. These funds will allow state facilities beyond prison facilities to be upgraded. CDCR provided the impetus for establishing a system to finance facilities such as correctional facilities. As such, the evaluation credits the partnership for its contribution to breaking down that significant barrier to energy savings in the government sector.
Program partners believe that the early feasibility studies were useful for informing the program in the planning process; however, ESCOs are not as satisfied with the process as considerable investment was required to review the initial feasibility studies in light of facility changes. Even so, they are excited about productively moving the program forward.
Early in the program cycle, the program partners conducted preliminary feasibility studies. These studies were then provided to ESCOs when they were assigned to a facility.
Although the audits did not result in project plans as quickly as anticipated due to the delays in securing the financing option, program partners believed that conducting these feasibility studies was a useful activity. The information obtained allowed the program to develop a reasonable plan for budgeting, assess the capacity needed to address the opportunities, and estimate potential energy savings and demand reduction. Also, the audits provided the program with the information necessary to develop a program database.

7. California Department of Corrections and Rehabilitation Partnership Program. . .
7-6
Final Summary Report: Process Evaluation of the 2006–2008 Local Government and Institutional Partnership Programs. 1/2/09
Unfortunately, partners did not anticipate such a long delay between the original audits and project implementation, and the feasibility studies had to be redone by the individual ESCOs to verify the audit findings and assess any changes in the facility. These audits took a considerable amount of time and expense to complete.
Given the delays in project approval, and the (albeit remote) possibility of project rejection by the management team, some ESCOs do not want to incur these costs and want the program to reimburse them for these investment grade audits. The program will have to deal with this issue going forward. Otherwise, the earlier audits have been useful in establishing the scope and potential savings for the overall program.
ESCOs’ initial contract values were based on the early feasibility reviews. As project plans at times changed considerably based on a follow-up audit, the contract values needed to change. As such, ESCOs interviewed voiced the desire to have their own review of the facilities be the basis of their contractual agreement to deliver savings.
Aside from the audit issue, most ESCOs expressed their excitement that the program is moving forward and much needed work is getting done. They were pleased that the program had finally passed the financial hurdles and contracts were being released. They also reported that the CDCR Partnership communicated with them and the other stakeholders regularly and effectively.
Program Partners and participants express satisfaction with the program. Project management, particularly the champion model, is reported effective. However, ESCOs and facility managers expressed some frustration with the central management model. They would like to communicate directly with each other and the utilities rather than explicitly through the Director of Energy Management.
Facility managers report that interactions between the SCG staff, the lead utility (PG&E), and/or CDCR have been generally positive. Only one facilities manager commented negatively regarding his interaction with the utilities, speaking specifically to SCG and SCE. He commented that, in his situation, they have been absent and non-responsive, “They just give you the shuffle.”
Several facility managers also noted their satisfaction with the ESCOs. However, the lack of project implementation made it difficult to evaluate the effectiveness of the ESCOs.
Additionally, program partners were positive about their interactions with each other. All IOU program managers at this point appear to be aligned in their shared goal of getting as many projects implemented before year-end as can be done in a quality manner.
It is clear that the program enjoys a strong central champion in the CDCR Program Manager. The program champion is the head of facilities for the entire CDCR operation and is responsible for over 130 campuses.
This central leadership and strong champion model was particularly useful during the first phase of the program at the point of establishing processes and procedures. The nature of the work required, such as the political and organizational tasks of working through policy and procedural mechanisms, reportedly pulled from the champion’s

7. California Department of Corrections and Rehabilitation Partnership Program. . .
7-7
Final Summary Report: Process Evaluation of the 2006–2008 Local Government and Institutional Partnership Programs. 1/2/09
strengths. Additionally, the champion was in the position to entreat individual facility managers to actively participate in the program.
However, securing financing options consumed the champion’s time to the exclusion of other activities (e.g., facility manager training). A less centralized management structure may have resulted in more activities being addressed; it is possible that other tasks could have proceeded while the financing issue was being worked out.
Some ESCOs interviewed registered some frustration at the centralized management model in that they would prefer to interact directly with the individual facility management teams rather than communicate via the CDCR. These ESCOs commented that there were times when it would be more efficient to follow up directly with facilities managers on project progress and issues; however, they are required to communicate through the CDCR.
Like the ESCOs who would like more opportunity to communicate directly with the facility managers, the facility managers would like to see the utilities work directly with CDCR individual sites more regularly, rather than communicate exclusively through the Director of Energy Management. They commented that there is a relationship building opportunity between the utility and themselves that is missed by this lack of direct communication. There are utilities that do have representatives that interact directly with correctional facility managers; these facility managers expressed high satisfaction in their relationship with the utility.
Program partners and ESCOs believe NAM is effective as a project administrator.
Initially, the project due diligence and management was to be completed in-house by CDCR. The process was more cumbersome than anticipated, and CDCR was quickly overwhelmed and looked to outside contractors for assistance.
The management team selected NAM to serve as project administrator. NAM was hired to provide assistance to CDCR especially in the areas of ESCO coordination and technical evaluation and oversight. The contractor performs the due diligence for CDCR and packages the projects for financing.
The management team seems generally pleased with NAM’s performance and believes using NAM is a cost-effective solution to the internal lack of staff time. Interviews estimate that using NAM saves the CDCR a considerable amount in personnel costs. Additionally, the management team reported that NAM greatly facilitated project flow by standardizing project submission forms, simplifying costing, and providing cost-benefit analysis. One ESCO lauded the efforts of NAM to standardize the project documentation, claiming it was very useful and a necessary change. NAM also created a projects database that serves to support IOU reporting to the commission, which created time efficiencies.
Several ESCOs believed that the $1 million cap for facility projects was too low. A facility can consist of multiple buildings, and the project funding limit can be quickly expended without tending to all the possible cost-effective retrofits. One ESCO suggested allowing higher budgets for a facility and completing fewer projects.

7. California Department of Corrections and Rehabilitation Partnership Program. . .
7-8
Final Summary Report: Process Evaluation of the 2006–2008 Local Government and Institutional Partnership Programs. 1/2/09
A single CDCR participating “facility” can consist of multiple buildings at one site or campus (e.g., residential facilities, garages, warehouses, workhouses). Therefore, any one CDCR facility could provide the opportunity for any number of energy-efficiency upgrade projects throughout multiple buildings.
Thus, while $1 million seems like an adequate amount for a facility, due to the size and complexity of each campus, this amount was a constraint given the size of potential projects. ESCOs reported that this cap prevented excluded retrofit opportunities from being part of the project package.
One ESCO respondent suggested that it might be more cost effective to devote adequate funding for capturing all the energy-savings opportunities at a few campuses rather than try to do a few things at many CDCR campuses. Contractors are already allocating resources to the facility, so this approach may be more cost effective. As the program currently stands, ESCOs would have to return to the facility to capture the additional energy savings not captured through the program.
7.4 CONCLUSIONS AND OPPORTUNITIES FOR IMPROVEMENTS
There appears to be continued potential for significant gas savings from the CDCR program, as across the board the ESCOs found some gas savings in each of their assigned facilities. The program has a significant commitment for therms savings that SCG anticipates will be realized before the end of the cycle.
The project management team on this program appears to be extremely effective and have resulted in significant policy changes that will have long lasting effects beyond just the CDCR facilities. For example, the commitment of the management team for the CDCR program—including the IOU members, the CDCR project manager and the administrative contractor NAM—enabled the team to develop and apply a financing program that will also enable other state facilities to move ahead with energy-efficiency opportunities. Unique among the partnership programs, the CDCR program uses ESCOs to deliver services. The management team successfully secured a pool of ESCOs for implementation of projects with an effective oversight and quality control team in NAM. This ESCO model could be replicated for other state projects where there is a similar oversight mechanism.
The collaboration on this program appears to be going very well and the program is planning to address barriers that hampered it during the 2006–2008 cycle for the 2009–2011 program. However, interviews with facilities managers suggest that they would like utilities to continue to interact directly with facilities managers at the sites, rather than exclusively through the central office of CDCR. This may be a missed opportunity for the utility to build relationships with these important contacts that should be strengthened going forward.
ESCOs commented that the $1 million facility cap impairs the program’s potential. One ESCO suggested that the partnership would have been more successful if it provided more services to fewer facilities. Presuming that targeting a select few CDCR facilities would be politically feasible, doing more work in fewer facilities might have achieved the same energy savings in a more cost and time-effective manner.

7. California Department of Corrections and Rehabilitation Partnership Program. . .
7-9
Final Summary Report: Process Evaluation of the 2006–2008 Local Government and Institutional Partnership Programs. 1/2/09
Moving forward, additional opportunities for improvement exist.
• Move to less centralized control under the construction phase. While the centralized approach may have been necessary for setting up the program and overcoming the initial barriers, the second phase might benefit from a less centralized approach where ESCOs can work directly with facility managers. Once projects have been fleshed out, submitted, and approved, it would appear that a more decentralized model might be appropriate to enable the ESCOs to communicate and work directly with the facilities managers as projects proceed.
• Reconsider the funding cap and payback threshold. The current level of funding, along with the five-year payback threshold, encourages ESCOs to design the projects by selecting the “low hanging fruit.” However, once the first round of projects are completed and the less costly, high opportunity technologies are implemented, the program may need to reconsider the payback threshold. Also, because of the funding cap, ESCOs felt that many energy-savings opportunities were being left on the table because of this restriction. If feasible, the program should consider the costs and benefits to revising these two metrics.

8-1
Final Summary Report: Process Evaluation of the 2006–2008 Local Government and Institutional Partnership Programs. 1/2/09
8. BAKERSFIELD-KERN PARTNERSHIP PROGRAM
8.1 INTRODUCTION
The Bakersfield and Kern County Energy Watch Partnership was designed to achieve immediate, long-term peak energy and demand savings and establish a permanent framework for sustainable, long-term, comprehensive energy management programs. Additionally, it sets the foundation for sustainability and best practices for the partnership’s participating jurisdictions and customers through information and direct installation of energy-efficiency equipment. The program is a continuation of a successful 2004–2005 program.
The partnership is jointly offered by PG&E, SCG, and SCE, partnering with the City of Bakersfield (the City) and Kern County (the County). SCG customers largely reside within the County and, while the City is primarily served by PG&E, some of the (largely residential) western edge of the City lies in SCG service territory.
The partners are responsible for identifying retrofit and retro-commissioning projects and referring those projects to the utilities. In addition to these partners, the program works with Staples Marketing, who administers various components of the program such as the direct installation and homebuyers program (discussed in the next section).
The partnership is reducing energy use by providing energy-efficiency information and direct installation of energy-efficient equipment to homeowners and small businesses in targeted areas, while continuing to retrofit municipal properties. Both existing homeowners and new home buyers are targeted with audit and direct install measures, while small businesses receive walk-through audits (no leave-behind materials) and direct install measures. The program was enhanced in 2008 by a new component that offers training to City building inspectors.
8.2 PROGRAM BACKGROUND AND STRUCTURE
8.2.1 Program Description
The Bakersfield-Kern Energy Watch Partnership is a multi-faceted program that provides services to multiple sectors of the population, including residential, small commercial, and municipal facility customers. The program strives to achieve therms savings through installation of energy-efficient technologies while promoting the long-term savings through workshops and education opportunities.
The program has three major components—a direct installation service, a municipal audit, and retrofit component aimed at municipal and county buildings, and a training and education element delivered through SCE’s Technology Center and PG&E’s Energy Center. The program also offers a home-buyer program.
1. Direct installation for residential and small business customers. Direct installation is the largest component of the Bakersfield-Kern Partnership Program. This component provides water efficiency measures such as faucet aerators, low-flow showerheads, boiler steam traps, HVAC tune-ups, and monitoring-based

8. Bakersfield-Kern Partnership Program. . .
8-2
Final Summary Report: Process Evaluation of the 2006–2008 Local Government and Institutional Partnership Programs. 1/2/09
commissioning to residential customers (both single and multi-family) and small businesses. In addition to these offerings, the program may offer electric measures such as high-efficiency lighting and ballasts to SCE and PG&E customers. A direct installation contractor, Staples Marketing, canvasses neighborhoods designated by the government partners and provides the efficient devices to businesses and households at no cost. The government partners select the geographical areas to target based on demographics.
2. Municipal facility projects. There are two types of municipal facility projects. The first is an audit and retrofit component. The program completes audits of municipal facilities to identify project opportunities for energy-efficiency retrofits. Applications that may be pertinent to facilities in SCG territory include replacement of: HVAC systems, domestic hot water boilers, and domestic water heaters to high-efficiency tankless water heaters. The program also offers electric measures such as lighting retrofits to SCE and PG&E customers. The second type of project is direct delivery where the program provides the equipment to municipal facilities who in turn install the equipment. This component was developed in reaction to municipal facilities not having the funds to have another contractor install the equipment. Staples Marketing administers the direct delivery of the municipal facility projects.
3. Energy education and training. The program offers education and training through SCE’s Agricultural Technology Application Center and PG&E’s Pacific Energy Center. These training events are offered to City staff, residential and small business contractors, and other market actors (e.g., engineers) on topics such as energy management systems, new construction, codes and standards, and emerging energy efficient technologies. Courses are selected based on the potential to effect energy savings and needs of the community. While training offerings exist for end-users, the program shifted its focus early in the program cycle to provide trainings for groups that would influence behaviors and purchasing patterns such as the contractors and architects.
4. Homebuyers program. Staples Marketing provides services for the Homebuyers Program. The program is marketed through realtors and events. Through this component of the program, homeowners receive an energy audit of their recently purchased home and along with free energy-efficient equipment (e.g., CFLs, faucet aerators, and low-flow showerheads). Trained CHEERS-certified professionals complete the audit and identify ways the homeowner can improve the efficiency of the home. Additionally, the program provides recommendations for incentive programs they can participate in through one of the three participating utilities from where they receive their electric and gas service.
8.2.2 Program Logic Model and Implementation Theory
Figure 8-1 presents the logic model, which represents the initial program concept. As the logic model shows, the partnership’s primary activities include marketing and outreach, training and education, residential projects, small business projects, and municipal projects. These activities are to result in six outputs (1) marketing materials, (2) media activities, (3) 20 workshops, (4) canvassing of targeted areas, (5) audits and installation of energy-efficiency equipment, and (6) identification of additional projects via audits.

8. Bakersfield-Kern Partnership Program. . .
8-3
Final Summary Report: Process Evaluation of the 2006–2008 Local Government and Institutional Partnership Programs. 1/2/09
This logic model represents the initial program concept. The logic model is, for the most part, consistent with the program as it is currently being offered. One difference is that the Homebuyers program is not detailed as a separate programmatic component; rather, it is represented in the Residential Projects section. Another programmatic component not explicitly relayed in the logic model is the retrofitting of municipal facilities.
Figure 8-1 Bakersfield-Kern Logic Model
8.3 KEY FINDINGS
The program is reportedly falling short of meeting its therms savings goals. Staples reports finding gas opportunities has proven to be more difficult than projected. However, the program projects it will still meet its target by the end of the program cycle.
Only 22 percent of program funding for the three year cycle has been spent to date, leaving over $500,000 to be spent over the final seven months of the program. The gas-savings goal for the 2006–2008 cycle is 144,000 net therms. As of June 2008, EEGA

8. Bakersfield-Kern Partnership Program. . .
8-4
Final Summary Report: Process Evaluation of the 2006–2008 Local Government and Institutional Partnership Programs. 1/2/09
reports that only 1 percent of the energy-savings goal has been claimed to date (2,081 net therms). SCG indicates that EEGA is not current with the work that has been done for Small Business and Residential customers.
Municipal projects have been harder to identify on the gas side, but one project that may produce significant gas savings is moving forward in the second half of 2008. The First Quarterly Report Narrative from June 2008 noted that the shortfalls are temporary and administrative:
“Although the partnership is falling short of its goals through the first quarter, we expect to be on target by the end of 2008. The reason for the current shortfall is that it has taken longer than projected to complete the installation of both City and County municipal projects and to move additional funding to the Direct Install program.”
Interviews with Staples Marketing revealed that gas measures have proven to be more difficult for the contractor. They noted that they were having difficulty finding a cost-effective measure to achieve the goal. They reviewed the feasibility of installing pipe wraps, but doing so can void warranties so they could not install those consistently. Furthermore, the few feet of wrap needed did not warrant the visit. They also reviewed steam traps, which was also not a cost-effective measure.
In fact, Staples Marketing said they will be re-evaluating their gas-savings goals for the next contract period. The current measures and cost-effectiveness tests available make it difficult for the contractor to identify projects that will yield significant gas savings. They are currently focused on larger municipal facility projects, which tend to be more difficult to complete but result in higher savings values.
The program plans to realize additional savings through the Small Business direct install and Homebuyers program through the remainder of the year. Staples Marketing stopped promoting these services when the funding depleted. However, the program shifted funds to restart the Small Business direct install and the Homebuyers program activities.
There is question, also, if the reported savings are current and an accurate reflection of achieved savings. Early in the evaluation, PA researchers learned that PG&E was not processing invoices in a timely manner. This affected the savings reported by the program, making it appear that there were fewer savings.

8. Bakersfield-Kern Partnership Program. . .
8-5
Final Summary Report: Process Evaluation of the 2006–2008 Local Government and Institutional Partnership Programs. 1/2/09
Staples Marketing’s role in the partnership program is expansive and addresses the needs of Residential, Small Business, and Municipal customers.
Staples Marketing provides a multitude of services for the Bakersfield-Kern Partnership. Their responsibilities include marketing and outreach, residential audits and direct installations, small business audits and direct installations, and direct delivery of municipal retrofits. Staples Marketing’s activities under these elements are described in more detail below.
Marketing and outreach activities. These activities are conducted at fairs, home shows, etc. For example, there is a home show twice a year in Bakersfield where Staples Marketing sets up displays such as an SCE mobile display and a PG&E pool pump display.
PG&E, as lead utility, maintains the database that tracks the marketing and outreach activities. Utilities raised, in interviews, concerns that the system may be inadequate for tracking these activities. They would like to see a better system to track these activities, as well as participants or individuals reached under these activities if available.
Residential audits and direct installations. Staples Marketing uses the home shows and canvasses neighborhoods to recruit households for the residential audit and direct install program component. The residential audit consists of a walk-through with the homeowner by a representative from Staples Marketing. Although the audit results mostly in CFLs replacing incandescent bulbs through SCE and PG&E offerings, program data shows that residential customers are also receiving gas-saving water efficiency measures (low-flow showerheads and faucet aerators).
Small business audits and direct installations. Staples Marketing also recruits small businesses through events and canvassing targeted areas. The program also leverages the visit to a participating small business to meet other businesses in the area when doing the audit and direct installation. They do this most prevalently when installing equipment in strip malls. The contractor goes door-to-door to recruit additional participants.
Staples Marketing uses a software tool proprietary to the Bakersfield-Kern program to determine what type of equipment should be installed in the small business and to provide additional recommendations for energy-efficiency retrofits. Unfortunately, after the audit is complete the program does not provide any sort of report that the small business can reference. Respondents identified this as an area where the program could improve and optimize the recommendation and referral process.
Direct delivery of municipal retrofits. Through the direct delivery of municipal projects, Staples Marketing makes recommends and orders equipment but does not complete the installation. The facility installs the equipment, thereby saving money on the installation. Staples Marketing has had minimal activity with direct installations for SCG customers.

8. Bakersfield-Kern Partnership Program. . .
8-6
Final Summary Report: Process Evaluation of the 2006–2008 Local Government and Institutional Partnership Programs. 1/2/09
The partnership program experienced staff turnover and contractor changes in the 2006–2008 program cycle. With staffing stabilized, these changes do not appear to have affected program progress.
Early in the program cycle, Winegard Energy Inc, a California-based contractor specializing in marketing and weatherization of residential and small business buildings, was responsible for direct installation for residential customers. However, their contract ended early in the program cycle and Staples took over the direct install component of the program after Winegard’s contract ended. By most accounts, this change did not hinder the progress of the residential direct installations. PG&E’s staff overseeing the direct install component expressed satisfaction with the work being done, and Staples management similarly appeared fairly enthusiastic and satisfied with their expanded role.
In addition to the shift in contractors, PG&E experienced staff turnover within the 2006–2008 program cycle. This turnover does not seem to have had a significant impact on program operations and was not raised an as issue within process interviews. Once the current program manager for PG&E was in place, the program operated smoothly, and the partners appear to be positively engaged. Turnover at PG&E does not appear to have been a continuing issue.
Partners interviewed expressed satisfaction with the program and relationships with each other. However, the billing and tracking mechanisms were noted by Partners interviewed as an area for improvement. Additionally, SCG voiced that the their presence in the program is, at times, suboptimal.
All individuals interviewed as of the Bakersfield-Kern Partnership program expressed satisfaction with the program relationships and communications. Staples Marketing lauded the communication as one of the best aspects of the program. They specifically noted the collaboration between themselves and the City and County to identify savings opportunities as particularly effective.
Interviewees also expressed satisfaction with Staples Marketing. They believed that Staples Marketing was effective in delivering services, particularly to the residential customers. One interview specifically singled the residential component of the program out, saying that Staples Marketing was “doing a good job in reaching the target population and providing value to them.” All parties interviewed also expressed satisfaction at how they work together to market the program and identify opportunities, a program element managed by Staples Marketing.
However, interviews identified that while the relationship with the three partnering utilities has been largely successful, program billing has been problematic. There are reported instances when PG&E delayed in processing SCG invoices. Invoices are the process to claim savings; therefore, this delay prevented SCG from claiming energy savings on a timely basis for their monthly reporting to the CPUC.
Also related to the tracking system, one of the greatest challenges for the overall evaluation has been to get good data lists from PG&E for each of the three utilities. PA staff attempted to work with PG&E to obtain the lists to for the facility manager and customer surveys. PA was never able to receive lists for these interviews.

8. Bakersfield-Kern Partnership Program. . .
8-7
Final Summary Report: Process Evaluation of the 2006–2008 Local Government and Institutional Partnership Programs. 1/2/09
PA researchers also had trouble obtaining lists for the participant surveys. PG&E could only provide lists for participants within their own territory. Additionally, the information received for SCG customers was extremely limited for both small commercial and residential sectors and only included the direct install component. No customer information was provided for education and training related specifically to SCG territory.
A representative from PG&E confirmed that although they are the lead utility, their tracking databases only reflect participants in their service territory. They receive hardcopy invoices from Staples Marketing that represent the measures installed for the other utilities, but do not enter customer level data. Interviews suggest that PG&E does not capture customer specific data as logging other utilities’ customer data is a confidentiality concern for PG&E and the other utilities.
These experiences suggest that the program could benefit from a better, more integrated tracking system. The system should allow users to efficiently log invoices, show the status of invoices, and track program participants and progress for all participating partners.
Last, while the relationships among the management team are collaborative and positive, utility interviews indicate the marketing and program activity has favored PG&E. This may be in part due to geography; however, SCG has had to work to ensure it is adequate representation in this program. The collaboration has evolved and is more satisfactory at this time. According to one SCG person involved in the program,
“Program works pretty well, county and city seem to be happy with the program. Collaboration is across the board.”
Interviews identified a variety of barriers to administering the program. These barriers include the vastness of Kern County in terms of size and reach, changes in rebate qualification requirements, and the level of financial investment required to implement retrofit projects.
Interviewees for the most part felt the program was operating well. Other than the invoicing issue referenced above, the program partners were positive about their relationships with the utilities.
Other than the barrier of identifying gas applications, interviews identified numerous program-related barriers for program administration These barriers are applicable to the program as a whole, and are not identified as an SCG-specific issue.
One issue is the relatively large size of Kern County, noted as the biggest obstacle in program administration by one interviewee. Because the county is fairly large, and distances need to be covered to deliver program benefits, it is not cost-effective to visit some areas of the county frequently, particularly the rural areas. To make the process more cost-effective, a minimum number of installations needs to be set up to warrant a visit to the area.
Interviews also identified marketing to the rural areas as a barrier in getting more participants involved in the program. The partnership has tried different marketing

8. Bakersfield-Kern Partnership Program. . .
8-8
Final Summary Report: Process Evaluation of the 2006–2008 Local Government and Institutional Partnership Programs. 1/2/09
strategies, such as radio and local television advertisements. Unfortunately, these approaches have yielded limited success.
Another issue raised by interviews was when utility rebate qualifications change and program representatives are not informed of the change. In the example provided by the partner interviewed, PG&E was mentioned as the utility that changed the requirements. This modification of rebate specifications not communicated to the partner resulted in dissatisfied customers that planned installations around the initial assumption. Although this comment was related to PG&E specifically, the point is noted in this report as something to keep in mind if it has occurred or were to occur with SCG within a program cycle. The solution to this issue is communication. The individual interviewed suggested that if a change in qualifications were to happen that the partners would be informed well ahead of time so that the information could be effectively disseminated.
One last barrier identified by a representative of the City is the level of investment required by target populations to complete retrofit projects. The City focuses its attention on government building upgrades and small business installations. These populations tend to have significant funding constraints. This constraint, coupled with a reduced level of funding for the 2006–2008 program cycle, has hindered the City’s ability to move projects from concept to completion.
There has been significant emphasis on achieving resource goals. Partners interviewed felt this emphasis is at the expense of providing a more comprehensive service to its participants. Contractors suggested incorporating an education piece as part of the audit process to leave with participants.
As the Bakersfield-Kern program is primarily a resource program, it is reasonable to expect that there would be the greatest emphasis on making progress toward its resource goals. However, program partners interviewed expressed that this focus on reaching resource goals may be limiting the impact the program has on its customers by limiting the education opportunities18. Individuals interviewed felt that the direct install component of the program dominates the site visits at the expense of a more comprehensive customer interaction.
In fact, respondents specifically noted the need to provide more information after the audit process as an area for improvement. No information is left behind for program participants to review and refer to after an audit is complete. Providing this information would provide an opportunity for the contractor to discuss the recommendations more fully and reinforce the messages conveyed during the walk-through audit.
There is no significant overlap in participants or program activities between the Bakersfield Kern and other partnership programs.
One researchable topic identified in the evaluation plan was whether there were any issues of overlap between the Bakersfield-Kern program and other partnership program
18 PA process evaluations with the four IOUs identified this as a common issue across many of the government partnership programs.

8. Bakersfield-Kern Partnership Program. . .
8-9
Final Summary Report: Process Evaluation of the 2006–2008 Local Government and Institutional Partnership Programs. 1/2/09
activities. Interviews did not identify any issues associated with program overlap for the Bakersfield-Kern program in SCG territory.
SCG reports that they have been trying to get a project off the ground with Kern County at the Lerdo Prison in Bakersfield, but that this facility does not overlap with CDCR as it is a county facility. SCG is hopeful that this municipal project will be completed this year for the 2008 program cycle so that therms savings can be increased for this program.
Few program participants were interviewed as part of the process evaluation. Those who were interviewed expressed satisfaction with the program and claim the equipment installed remained installed at the time of the interview.
The Bakersfield-Kern participant telephone survey focused on two program elements: direct install and workshop attendance. The data file provided by SCG details customer contact information, as well as the measures customers received. The measures listed were limited to water conservation measures (low-flow showerheads and faucet aerators). The data also provided the number of measures installed.
The SCG sample, aggregated so that each record only represented one household or one contact at an organization, included 75 residential records and four small commercial records. All records were participants that received the direct install component of the program. Due to the limited number of survey respondents represented in the Bakersfield-Kern sample for SCG, the information is reported qualitatively.
Respondents were very satisfied with their experience with the Bakersfield-Kern program. They cite the benefits of the program as being the belief that they save energy and save water. The benefit of saving money on their energy bill was also mentioned.
Respondents heard about the Bakersfield-Kern program through the local newspaper, a local government, and word of mouth. The residential participants noted that a representative came out to their home or building and spent, on average, a couple of hours with them. All measures installed by the program remained installed at the time of the interview.
8.4 CONCLUSIONS AND OPPORTUNITIES FOR IMPROVEMENT
Bakersfield-Kern is a strong partnership that has matured over time. The partnership is shifting toward a peer exchange model, whereby the experienced County staff are now moving toward engaging more local governments within the County to participate in the program. It is almost too large in its multifaceted approach, in that it takes more than one IOU lead to manage all the components, but each of the components have been doing well so one cannot conclude that there is a need to change the multifaceted approach.
For SCG, the program has been more disappointing in that the marketing focus to date has been more toward electric savings opportunities and the identification of gas-savings projects has been largely left to the IOU to pursue. SCG may wish to revisit the value it is getting out of the collaborative relationship in this program and may wish to either pursue a more directed effort with an implementation contractor to focus more

8. Bakersfield-Kern Partnership Program. . .
8-10
Final Summary Report: Process Evaluation of the 2006–2008 Local Government and Institutional Partnership Programs. 1/2/09
specifically on the achievement of the gas-savings goals or assign more dedicated staff within the region to more aggressively pursue projects in the SCG service territory.
At the time of the interviews, whatever gas savings are being realized as a result of the program were not included in the monthly reports. The lead utility model, where one utility serves to hold the contract with the implementation contractor on behalf of the other IOUs, is flawed in that the lead utility does not capture the data on the other utilities’ customers (due to obvious confidentiality issues and the fact that they are only concerned with achieving their own goals), and the invoicing process takes an inordinate amount of time to complete. A representative from the lead utility for Bakersfield-Kern, PG&E, noted the following:
“PG&E is the lead utility [for the Bakersfield-Kern Partnership], however, our tracking databases only reflect participants in our service territory. We just receive hardcopy invoices from the direct install Contractors for measures installed in other utilities, but do not enter or use the customer-level detail. They also send the other utilities detailed invoices with other customer information. They enter this information and then let us know they approve the invoices. Once we receive notice that they are approved, we pay the invoices and the other utilities pay us back. In order to get customer level detail for non-PG&E customers, you will need to get the data from SCE and SCG.”
Accurately maintaining a program and invoicing database is a critical component to successful program management. It would behoove the partnership to provide a means to centrally manage and track program data to allow for more current and accurate reflection of savings and activities of the partnership. Providing this upgrade in tracking and invoicing would also improve the satisfaction of other utility partners.
Last, the program should continue to evaluate a means for providing a post-audit report for residential and small business customers after an audit is complete. The report would serve several functions. First, it would provide an opportunity to reinforce the messages and recommendations relayed during the audits. Second, participants may forget specific recommendations, and the report would provide a good reference and more effectively funnel customers into IOU programs. Finally, the program could use data captured in the report to track customers funneled into IOU programs and provide opportunities for additional follow-up.

9-1
Final Summary Report: Process Evaluation of the 2006–2008 Local Government and Institutional Partnership Programs. 1/2/09
9. ENERGY COALITION PARTNERSHIP PROGRAM
9.1 INTRODUCTION
The Energy Coalition is a hybrid and multidimensional partnership for the delivery of sustainable energy efficiency in Southern California. For nine years, the Energy Coalition has facilitated the development of a far-reaching, innovative program for engaging communities in responsible energy use, raising their awareness regarding energy efficiency, the importance of peak-demand reductions, as well as renewables and transportation energy.
The program also draws on the strengths of key energy stakeholders’ partner cities. The partnering cities include Irvine, Corona, Santa Monica, San Bernardino, Moreno Valley, Cathedral City, Palm Desert, Hermosa Beach, Brea, and Santa Clarita. These cities cover a wide geographical area with diverse climatic zones. They also represent some of the most innovative and engaged cities on sustainability, climate change and energy efficiency in the state.
The CEP Partnership covers both resource and non-resource activities. The program’s primary focus is delivering energy savings, regardless if the savings are a result of resource or non-resource events. The resource program creates a stream of immediate savings through a variety of initiatives including direct installation to residential and small business customers, demonstration projects, and community outreach events.
The non-resource component includes training and workshop opportunities. There is a potential for indirect savings resulting from the non-resource component of the program. Also, the program includes a component called PEAK Student Energy Actions (PEAK). PEAK is a central feature of the non-resource component of the program that provides energy-efficiency information curriculum to 4th to 6th grade students. The PEAK Schools program has been adopted by many cities in the partnership and the Energy Coalition has taken it nationwide and even overseas.
Although the program documentation categorizes the resource and non-resource programs separately, the Energy Coalition does not separate the two in their offerings. The rationale behind separating the two program elements was to avoid burdening the resource program with non-resource program costs and thus its cost-benefit ratio lowering. However, since there are measurable savings associated with the PEAK program through the measures distributed, there is no reason to separate the two elements.
9.2 PROGRAM BACKGROUND AND STRUCTURE
9.2.1 Program Description
The Energy Coalition integrates both resource and non-resource savings into one partnership. The theory is that the non-resource components of the program will supplement and perpetuate the savings offered through the resource component of the program as well as affect participants’ behaviors and purchasing decisions to yield

9. Energy Coalition Partnership Program. . .
9-2
Final Summary Report: Process Evaluation of the 2006–2008 Local Government and Institutional Partnership Programs. 1/2/09
indirect savings. Under the premise of these program goals, the program provides two distinct types of offerings: direct installation of equipment and educational activities.
• Direct install. Direct installation of equipment is offered to residential and small commercial customers. The Energy Coalition provides the direct installation services and the program incorporates a variety of measures into the direct-install component. The following gas measures are identified:
− Faucet aerators
− Low flow showerheads
− Pipe wrap
− Water heater wrap
− Thermostats
− Weather-stripping
− Furnace and air filter replacement
• Education. The program provides education opportunities via a variety of venues. Examples of venues include PEAK student lessons, Energy Rallies, and community events. The program also provides workshops to both residential and nonresidential customers. Another opportunity for the program to provide education is through the Tune-up program component. Audits are a mean for providing information related to additional energy saving opportunities and behavior changes the participant can make to save energy. Tune-up installers are paid for one hour of time at each Tune-up to discuss energy efficiency. This discussion is supplemented with a detailed checklist that covers lighting, end-uses, building envelope, and water use. The PEAK component focuses on distributing information through municipalities and schools. Students are targeted, which in effect become the PEAK households as they transfer the knowledge they receive to their home.
9.2.2 Program Logic Model and Implementation Theory
Figure 9-1 illustrates the logic model for the Energy Coalition, incorporating both the resource and non-resource components of the program. As the logic model shows, the partnership’s primary activities include demonstration efficiency makeovers, local government energy plans, municipal services, PEAK student services, residential services, and small business services. These activities result in seven outputs (1) education activities, (2) demonstration projects, (3) efficient lighting distribution, (4) installation of gas measures; (5) school curriculum and outreach activities, (6) residential Tune-Ups, and (7) small business Tune-Ups.
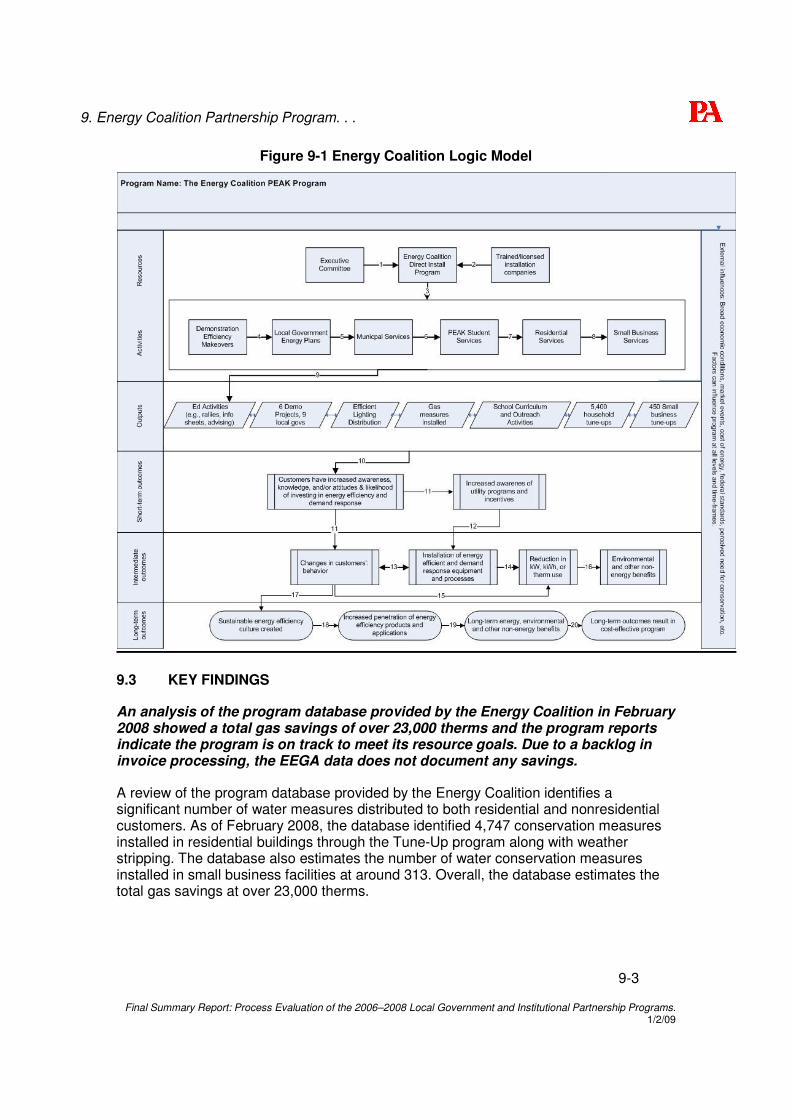
9. Energy Coalition Partnership Program. . .
9-3
Final Summary Report: Process Evaluation of the 2006–2008 Local Government and Institutional Partnership Programs. 1/2/09
Figure 9-1 Energy Coalition Logic Model
9.3 KEY FINDINGS
An analysis of the program database provided by the Energy Coalition in February 2008 showed a total gas savings of over 23,000 therms and the program reports indicate the program is on track to meet its resource goals. Due to a backlog in invoice processing, the EEGA data does not document any savings.
A review of the program database provided by the Energy Coalition identifies a significant number of water measures distributed to both residential and nonresidential customers. As of February 2008, the database identified 4,747 conservation measures installed in residential buildings through the Tune-Up program along with weather stripping. The database also estimates the number of water conservation measures installed in small business facilities at around 313. Overall, the database estimates the total gas savings at over 23,000 therms.

9. Energy Coalition Partnership Program. . .
9-4
Final Summary Report: Process Evaluation of the 2006–2008 Local Government and Institutional Partnership Programs. 1/2/09
The Quarterly Report Narrative for Quarter 1, 2008, indicates continued distribution of gas-savings measures through the Direct Install component. Specifically, the resource program during the first quarter of 2008:
• Distributed 265 faucet aerators and 247 showerheads
• Completed 1,280 residential Tune-ups
• Completed 131 small business Tune-ups
While the PEAK component is technically a non-resource program, the program is including measures such as aerators in its Energy First giveaway packs and distributed 5,000 of them in Quarter 2, 2007, after these gas measures were added.
The Quarterly Report Narrative for Quarter 1, 2008, claims the program to be “on track.” However, the EEGA data does not show any savings related to the program.19
Accordingly to SCG, the reason for the underreporting of savings to date is primarily due to late delivery of invoices from the lead utility, SCE. Calls made in July 2008 indicate that SCG had just received a batch of invoices and would be processing them shortly. Once these are paid, they can claim the associated savings.
The other issue affecting claiming of therms savings relates to the lack of accurate savings estimates in the E3 calculator for residential measures when applied to commercial situations. In order to post savings for faucet aerators and low-flow shower heads (for example) in nonresidential applications, SCG has to file working papers that detail the basis for the assumptions and savings values. This is a task that is underway and that is anticipated to be complete prior to the end of this program cycle.
The program has spent less than a quarter of its allocated funding for both the resource and non-resource programs to date (as of June 2008). Further, the energy savings achieved have not been reported. For the PEAK program, there is over $1 million left to spend over the last seven months of the program cycle and a considerable amount yet to be spent on the resource side as well.
Although there was early contention between the Energy Coalition and utilities, interviews found general satisfaction with the partnership relationship. However, interviews with the Energy Coalition and participating utilities indicate there is room for the partnership to improve in terms of the coordination and communication between the partners. Program branding is one example of where the partners should better coordinate.
SCG and the Energy Coalition commented that this partnership has evolved into a strong partnership where both parties play important roles and have balanced influence over the activities and goals for the program. This was not always the case, as interviews revealed some early contention between the utilities and the Energy Coalition.
19 As of the May 2008 status report posted on the CPUC’s EEGA website.

9. Energy Coalition Partnership Program. . .
9-5
Final Summary Report: Process Evaluation of the 2006–2008 Local Government and Institutional Partnership Programs. 1/2/09
Earlier in the partnership, there was utility perception that the Energy Coalition was primarily concerned with its own profile and brand, and most prominently displays their information when promoting the program. However, the Energy Coalition noted that they make sure the IOU partners’ logos are prominent in materials. Additionally, they claim that they make concerted efforts to ensure customers understand the utilities’ role in the partnership program and the services they provide.
Another issue raised that alluded to a lack of collaboration and branding coordination was the presence of both Energy Coalition and utility booths at events. There have been events produced under the program whereby the Energy Coalition had a booth promoting the partnership program activities and the utilities similarly had booths at the same event. The Energy Coalition believes this causes confusion among customers and sends the wrong signal about the partnership. This type of situation led the organization to believe there was a lack of cooperation and coordination between the two organizations. Additionally, it does not promote a sense of a unified front and true partnership from the customer’s perspective.
Interviews with both the Energy Coalition and the utility indicate that the partnership has evolved into a more positive relationship. More recently, the program seems to be benefiting from the different but equally important roles that the two groups play—the Energy Coalition brings political muscle, community organizing, and strong outreach capabilities, while SCG provides technology expertise and content. However, due to differing opinions about the balance of roles between the Energy Coalition and the other utility partners, it is not clear that the partnership relationship with the Energy Coalition will continue into the next cycle in the same fashion.
The emphasis on resource activities was an area of frustration for the Energy Coalition.
SCG and SCE instructed the Energy Coalition to focus its efforts to meet resource goals. The program was struggling to achieve its resource goals; therefore, the utilities instructed the Energy Coalition to spend less effort on the non-resource, capacity-building activities and focus on the Tune-Up and other resource-generating program activities.
The Energy Coalition expressed frustration with this approach. As a community-based organization, they are generally committed to building energy efficiencies through education and outreach initiatives. In fact, they view this as one of the strengths that they bring to the partnership.
Partnering cities were positive about the partnership and felt their expectations were being met. Their perception of the program structure and partners is also generally positive; however, there are some that believe the structure creates another layer of unnecessary bureaucracy.
Partnering cities also remarked positively about their experience with the program. Overall, the combination of the resource and non-resource components reportedly satisfies or exceeds the requirements of the participating communities. They believe the mix of offerings in the partnership reinforces the message of energy efficiency. Also, most partnering cities interviewed said that they liked having a one-stop shop for their

9. Energy Coalition Partnership Program. . .
9-6
Final Summary Report: Process Evaluation of the 2006–2008 Local Government and Institutional Partnership Programs. 1/2/09
energy and water conservation needs—whether simply information or assistance in staffing an event, doing direct outreach, or performing an energy audit.
PA asked partnering cities to rate the partnerships on a scale of 1 to 10, 1 means the utility is doing most of the implementation work and 10 means the partner is doing most of the work. This program seems to be close to ideal for most respondents. Six of the 10 ranked the partnership as a “5”—the ideal. The remaining respondents ranked it as a “4”, saying that they felt as communities that due to budget and staffing constraints they relied on the utilities and the Energy Coalition to do a bit more to maintain the momentum of the program. While some have seen their departments shrink due to cutbacks, for others the hurdle is resistance from some community members who will only listen to an outside non-profit organization and therefore require external entities to raise awareness.
Typically, the expectations of the communities focused on having a centralized information source, outreach, and tune-ups to senior citizens (including Meals on Wheels), mobile home residents, multi-family rental units, and PEAK students. For a few, it was working on a specific retrofit project or a larger pilot initiative such as Palm Desert’s.
For the most part, respondents said the program met their expectations and most were content with their relationship with the utilities. However, a few said that although they were interested in any collaborative opportunity that would increase energy efficiency, they felt that expanding projects with the utilities would be too cumbersome and demanding, citing excessive paperwork, additional staff time, and contract negotiations as the major hurdles.
City partners for the most part commended the work of the Energy Coalition. Respondents noted that Energy Coalition staff is very energetic and generally has a good vision of what is necessary to achieve the program goals. Additionally, one partner stressed the importance of the Energy Coalition, saying there are strong opinions about both SCG and SCE and having an intermediary like the Energy Coalition is necessary to buffer those beliefs and make a partnership work.
There were some, though, that felt that having an intermediary organization built in an unnecessary layer of bureaucracy and resulted in miscommunication. Several partners interviewed also commented that they felt the Energy Coalition tended to over-promise and under-deliver due to chronic understaffing. They believe the chronic understaffing results in greater burnout and higher attrition rates, affecting program quality20.
Partnering cities’ level of commitment to energy-efficiency improvements varied, and often was a reflection of the commitment of the communities and elected officials to energy efficiency.
20 It is important to remember that the information represents the opinions of individuals interviewed.

9. Energy Coalition Partnership Program. . .
9-7
Final Summary Report: Process Evaluation of the 2006–2008 Local Government and Institutional Partnership Programs. 1/2/09
Partnering cities’ level of involvement in the program varied considerably, from those who are extremely involved to those who are only slightly, if at all, involved. Those who are aggressively involved in the partnership participate in all elements of program (e.g., PEAK, Tune-Up, events), or use the partnership to leverage innovative projects. Other partnering cities are more passive in their participation and work with the program to do lesser-impact activities such as distributing flyers.
The interviews with partnering cities explored these differences in participation levels. The most prevalent reason identified was the differences in the level of commitment of their participating communities. The greater the commitment from the community and, particularly, elected officials, the more active the partnering city tended to be in the program.
For example, more aggressive cities, like Santa Monica or Palm Desert, report a high level of commitment from their elected officials. This level of commitment allows them to push the envelope and tackle a plethora of energy saving opportunities. Other committed cities may not be aggressive in terms of projects, but are purposeful in the populations they are targeting. These cities also work along with the elected officials and community to distribute program benefits.
As an example of the opposite view of buy-in, one city lamented that the current budget crisis impaired his ability to do more and looked forward to the day when his city council would view energy efficiency as fiscally prudent. “At least,” he said, “awareness is building.”
Partnering cities, when asked what was working well, produced examples such as the Tune-Up and PEAK components as well as the comprehensiveness of the program. Recommendations noted include increasing outreach and more information about State initiatives.
PA researchers probed partnering cities about what was working well with the program and what they felt was most in need for improvement. Responses varied as much as the needs and priorities of the participating cities. For some, the most notable component that they felt was working well as the residential Tune-Ups and the education and outreach components. For others, the general support and “plug and play” programming that the Energy Coalition offers topped the list. Still others highlighted the access to the utilities as well as the synergy that all partners brought to the table as being greater than the sum of its parts.
Partnering cities interviewed also provided a handful of recommendations for improving the program. These recommendations include more information on the State’s Million Solar Roofs, creating a more holistic approach, increasing outreach, expanding to more cities, and increasing the number of technical tours. The specific recommendations are detailed below. They are listed in no particular order.
“More information on the State’s Million Solar Roofs initiative [would be useful] so the City can better understand the return on investment and payback assumptions, and assist residents in the permitting process.”
9. Energy Coalition Partnership Program. . .
9-8
Final Summary Report: Process Evaluation of the 2006–2008 Local Government and Institutional Partnership Programs. 1/2/09
“[It is] hard to align the Public Benefits Charge program with the City’s needs. Going upstream and downstream is not sufficient. The CPUC is still struggling with what cities can offer. A more holistic approach with longer range planning (beyond the two to five years of a rate cycle) should be incorporated. The utilities’ consultants and cities alike need to understand where local governments fit best into the process. Thanks to the current long-term strategic planning now underway, this is beginning to become clearer.”
“How to boost outreach and implementation uptake at the local level is critical and it is more than just handing out information. Ensuring that the information is applied is critical and it affects local, regional, and statewide demand response programming.”
“The partnership needs to expand to more cities. Constituents should not have to be told there are no rebates or incentive available for them because they live in or moved to the ‘wrong’ community.”
“Partnership programming should be more comprehensive and include other sustainability issues beyond energy such as water.”
“More technical tours would be very helpful. Seeing the application [of a given measure] in person really opens your eyes. It would also present the opportunity to reach out to other neighboring partnerships [South Bay, South Coast, Ventura Co.] to see what works and what doesn’t.”
The Energy Coalition maintains resource data in a web-based program database. The database captures a plethora of information, including customer details, equipment installed in the building at the time of the audit, equipment installed by the program, and the top three recommendations made to the participant.
The Energy Coalition details all projects on a web-based database that captures all activities through Tune-Up, the direct install component of the program. The Energy Coalition provided evaluators access to the online Tune-Up database. Using this database, it is possible to view a listing of all projects completed, filterable by date and sector. The database lists the date the program installed measures, contractor name, customer contact information, and whether the customer completed a follow-up survey and the results of that survey.
The database also provides specific audit details, completed by the contractor. Information retained includes energy saving recommendations, measures installed in participants’ buildings prior to the program, characteristics of these measures (e.g., refrigerator age, building envelope conditions), and utility programs participants to which program participants were referred.
The database includes a reporting vehicle that allows the user to review participant information and program activities in a variety of different ways. One report, for example, provides an analysis of recommendations. The recommendations can be viewed by

9. Energy Coalition Partnership Program. . .
9-9
Final Summary Report: Process Evaluation of the 2006–2008 Local Government and Institutional Partnership Programs. 1/2/09
participant sector (residential or small business) and can be modified to fit a specific period.
The Energy Coalition also maintains counts of Efficiency First! packs distributed to participants. These packs provide information and a CFL, faucet aerators, and other information and low-cost measures. However, they do not maintain a list of people who received the Efficiency First! packs.
9.4 SURVEY FINDINGS—EXPERIENCES OF RESIDENTIAL PARTICIPANTS
This section presents results of households’ experiences with the workshops and installation of faucet aerators and low-flow showerheads. The Energy Coalition provided program participant data to be used in the survey process.
• The Tune-up data, which provides information about direct installations, was extracted from Energy Coalition’s Tune-up database. The comprehensive file provided contact information for each participant, as well as measure-specific details including the specific measures installed (e.g., low flow showerheads, faucet aerators) and quantity of those measures installed. The database also indicated if the respondent was a residential or small business customer via the Tune-up identification number.
• Workshop participant data was provided in both Excel format and PDF files, which were data entered. The files, also inclusive, supplied participant contact details and information related to measures included and handed out as part of the workshop (e.g., faucet aerators and CFLs).
All participants that participated in workshops per the Energy Coalition and said they receive gas from SCG21 are included in the workshop analysis. Only participants that received water conservation or gas measures (faucet aerators, low-flow showerheads, water heater wraps, pipe wraps) are included in the direct install and audit analysis.
Although water heater wraps and pipe wraps are also included as program offerings, these measures were far less prevalent than the faucet aerators and/or low-flow showerheads (referred to as “measures”) and few respondents included in the survey provided information related to these measures.
9.4.1 Direct Install and Audit Process
All but one respondent recalled the program and confirmed the measures were installed in their home. Respondents generally noted that they would not have installed the measure outside of the program; 77 percent said that they had no plans to install the measures before participating in the program. Of those who said they would have installed the measure without the program, three-quarters believe they would have installed the measure at the same time (Figures 9-2 and 9-3).
21 This question is pertinent to residential customers only, per the question “From which utility do you receive your natural gas.” Respondents who answered don’t know responses are also included in the data.

9. Energy Coalition Partnership Program. . .
9-10
Final Summary Report: Process Evaluation of the 2006–2008 Local Government and Institutional Partnership Programs. 1/2/09
Figure 9-2 Would have installed low-flow showerheads/faucet aerators in absence
of program (n=35)
Figure 9-3 [If would have installed measure] Without the program, would have installed
at the same time (n=8)
23%
77%
Yes No
25%
75%
Yes No
While completing the install, half of the respondents said they received information from the representative related to saving energy in their home. Another fifteen percent said they received information related to appliances they should install or replace to save energy. For the most part, participants felt the information presented was useful; in fact, nearly 75 percent rated the usefulness of the information a 4 or 5 on a 1 to 5 scale (where 1 was not at all useful and 5 was very useful).
All participants that received measures via the direct install component of the program were asked a series of audit questions. Most respondents confirmed they received an audit as part of the installation process (83 percent). Three-quarters were able to provide information about how long the respondent spent with them in their home (responses varied from one to three hours).
Respondents were asked another series of questions related to information they received via the audit. As the audit and direct install tend to happen concurrently, it stands to reason that the information participants reported receiving during the direct installation series of questions is the same as the type of information received through the audit.
However, there was some variability between the two series of questions and information received. The most notable difference is that participants felt the information received through the audit was more useful than the information provided during the direct install. Those who received information through the audit provided an average rating for the usefulness of information a 4.4 (where 5 is very useful), compared with an average rating of 3.9 for the information received at the point of the direct install (see Table 9-1). Given the small number of cases, these differences are not statistically significant but can be viewed as indicators of usefulness of these two methods.

9. Energy Coalition Partnership Program. . .
9-11
Final Summary Report: Process Evaluation of the 2006–2008 Local Government and Institutional Partnership Programs. 1/2/09
Table 9-1 Usefulness of Information Received During Direct Install and Energy Audit
Usefulness of information
received during direct install (n=32)
Usefulness of information received during energy
audit (n=28)
1—Not at all useful 6.2% 3.6%
2 12.5% 3.6%
3 9.4% 3.6%
4 25.0% 32.1%
5—Very useful 46.9% 57.1%
When asked how the information could have been more helpful, respondents who provided a low rating primarily said they would have liked more information on how to save energy in their home and asked that the information be more specific. Several respondents also said they would like to have more contact information with the information and/or referrals to other energy-efficiency programs.
“I think I would have liked information about different programs related to energy.”
“They could have given other info for home to become more energy efficient, more educational.”
Only forty percent of households interviewed that recalled receiving an audit said the contractor made recommendations on appliances or measures they should install in their home to be more energy efficient. Figure 9-4 presents the most notable suggestions recalled by the respondents. Note that the “other” category captures a significant portion of responses to this question. Other suggestions made by the contractor included installing a gas dryer and lowering water usage.

9. Energy Coalition Partnership Program. . .
9-12
Final Summary Report: Process Evaluation of the 2006–2008 Local Government and Institutional Partnership Programs. 1/2/09
Figure 9-4 Suggestions Made by Contractor (n=13)
27%18% 18%
9% 5%
55%
0%
20%
40%
60%
80%
100%
Replace/removesecondary fridge
Install energyefficient dishwasher
Install CFLs Install energyefficient washer
Add/improveinsulation
Other
Contractor Suggestion
Per
cen
t
Reviewing the recommendations report on the Tune-up database, it appears the trend of recommendations noted by the respondent corresponds to the recommendations denoted within the data system. The most commonly cited appliance-related recommendation is to replace the refrigerator. Additionally, several of the recommendations noted as “other” recommendations by respondents correspond to recommendations noted in the database, such as clean filters, replace windows, and reduce water usage.
Seventy percent of households say they will act on the recommendation(s) provided by the contractor. It is possible that the figure is high due to self-report bias; however, it is encouraging to note that respondents felt the information was useful enough to note they would act on the recommendation.
Overall, participants rated their satisfaction with the direct install and audit portion of the program highly. Additionally, they noted numerous benefits for program participation, including that felt they:
• Saved money on energy bills (40 percent)
• Saved energy (30 percent)
• Learned how to save energy (15 percent)
• Installed more measures on own (9 percent).
9.4.2 Education/workshop
Surveys also addressed education and workshop offerings provided by the Energy Coalition. Event titles include the Splash Festival, Public Services, Fair, and Santa Monica Festival.
According to workshop sign-up sheets, participants received a variety of water conservation measures such as faucet aerators. Eighty-two percent of respondents recalled receiving measures to take home with them. Only eighteen percent recalled
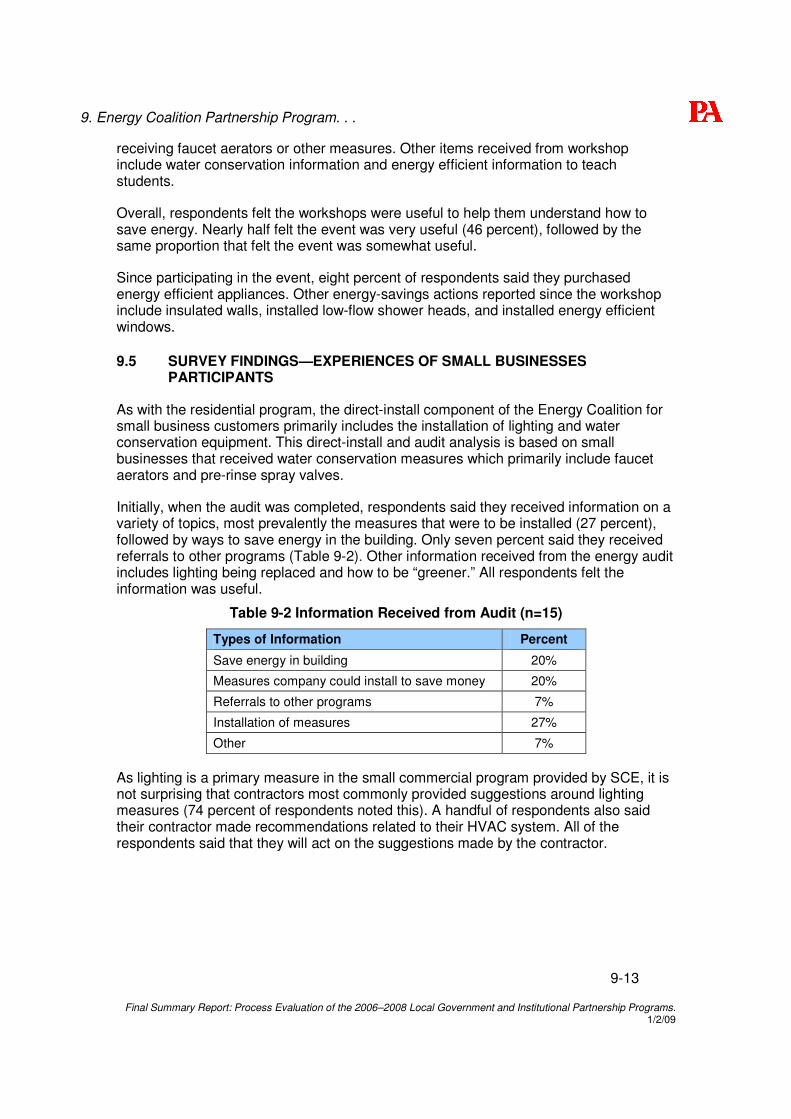
9. Energy Coalition Partnership Program. . .
9-13
Final Summary Report: Process Evaluation of the 2006–2008 Local Government and Institutional Partnership Programs. 1/2/09
receiving faucet aerators or other measures. Other items received from workshop include water conservation information and energy efficient information to teach students.
Overall, respondents felt the workshops were useful to help them understand how to save energy. Nearly half felt the event was very useful (46 percent), followed by the same proportion that felt the event was somewhat useful.
Since participating in the event, eight percent of respondents said they purchased energy efficient appliances. Other energy-savings actions reported since the workshop include insulated walls, installed low-flow shower heads, and installed energy efficient windows.
9.5 SURVEY FINDINGS—EXPERIENCES OF SMALL BUSINESSES PARTICIPANTS
As with the residential program, the direct-install component of the Energy Coalition for small business customers primarily includes the installation of lighting and water conservation equipment. This direct-install and audit analysis is based on small businesses that received water conservation measures which primarily include faucet aerators and pre-rinse spray valves.
Initially, when the audit was completed, respondents said they received information on a variety of topics, most prevalently the measures that were to be installed (27 percent), followed by ways to save energy in the building. Only seven percent said they received referrals to other programs (Table 9-2). Other information received from the energy audit includes lighting being replaced and how to be “greener.” All respondents felt the information was useful.
Table 9-2 Information Received from Audit (n=15)
Types of Information Percent
Save energy in building 20%
Measures company could install to save money 20%
Referrals to other programs 7%
Installation of measures 27%
Other 7%
As lighting is a primary measure in the small commercial program provided by SCE, it is not surprising that contractors most commonly provided suggestions around lighting measures (74 percent of respondents noted this). A handful of respondents also said their contractor made recommendations related to their HVAC system. All of the respondents said that they will act on the suggestions made by the contractor.

9. Energy Coalition Partnership Program. . .
9-14
Final Summary Report: Process Evaluation of the 2006–2008 Local Government and Institutional Partnership Programs. 1/2/09
Table 9-3 Suggestions Made by Contractor (n=19)
Types of Suggestion Percent
Install efficient lighting 74%
Install/retrofit HVAC 16%
Remove inefficient equipment 5%
Other 11%
The sample database provided information about the measures installed. All participants confirmed that they received lighting; however, of the 15 respondents where the database said they received water conservation measures (low-flow showerheads and pipe wraps), only sixty percent recall receiving the equipment. It is unclear from the data why that would be the case, other than these individuals also received lighting measures and it is possible the lighting installations received greater emphasis during the visit.
Overall, participants were very satisfied with their experience with the program with all respondents rating their experience a 4 or 5 on a 5-point scale where 5 is very satisfied. Among the top-noted benefits of participating in the program is that they believe they saved or will save energy (34 percent).
9.6 CONCLUSIONS AND OPPORTUNITIES FOR IMPROVEMENTS
Overall, this is a successful partnership program that leverages the enthusiasm and momentum of some innovative and active cities addressing the issues of sustainability, climate change and energy efficiency. The partnership also includes cities that are short staffed and do not enjoy the level of resources or prioritization of energy efficiency that some of the more active and wealthier communities can afford. Nevertheless, the program seems to be meeting the expectations of participants. Across the region, awareness is reportedly building in the cities’ staff, elected officials, and the general public.
It is clear that there needs to be some structural changes. Efforts should be made to expand the reach of the partnership to include the counties and other cities and relevant organizations within the CEP territory. By appropriately and adequately expanding staff at the Energy Coalition, more current and potential partnership members could leverage the expertise of the cutting edge cities (e.g., Santa Monica, Irvine, Palm Desert) by sharing best practices and lessons learned.
At the same time, there should be greater attention paid to the range of needs in the partner communities and the programmatic structure. In doing so, the programming should have the flexibility to adjust to differences between communities.
By combining these last two points—by being more collaborative and transparent—the partnership could increase overall energy savings through greater market penetration and implementation. This would also encourage greater buy-in from each city as the officials and residents reap the benefits of reinvesting the Public Benefit Charge funds in their community.

10-1
Final Summary Report: Process Evaluation of the 2006–2008 Local Government and Institutional Partnership Programs. 1/2/09
10. LA COUNTY PARTNERSHIP PROGRAM
10.1 INTRODUCTION AND SUMMARY
The LA County (County) Partnership program is a three-way partnership between the County (lead by staff at the Energy Management Division of the Internal Services Department), SCE, and SCG. The partnership’s primary purpose is to support retro-commissioning for larger County facilities.22 Vendors, under contract to SCE and directly managed by County staff, carry out the retro-commissioning work.
Overall, based on information from all three partners, the LA County Partnership is working well.23 The relationship of the partners is collegial and active, the decision-making is shared, communication is regular and constructive, and the roles are clear. Building upon past experience (since 2002), the program process has evolved and become a proven track record.
In the 2002–2003 program cycle, the County operated a similar program as a third party program. The utility oversaw, but was not directly involved, with the program. For the 2004–2005 program cycle, the Commission strongly urged third party program operators to partner with utilities when it was appropriate to do so. As a result, the current LA County Partnership program was formed and was continued for the 2006–2008 program cycle. The major difference between the third party operation and the partnership is that the utilities as partners are now much more involved with decision-making. These decisions include selection of the vendors that complete the technical work such as retro commissioning, and, in the case of SCE, handling the contracting.
10.2 PROGRAM BACKGROUND AND STRUCTURE
10.2.1 Program Description
The County Board of Supervisors created the Internal Services Department (ISD) in 1989. It is organized into four business operations: Facilities Operations Service, Information Technology Service, Purchasing and Contracts Service, and Administration and Finance Service. The Facilities Operations Service includes the Energy Management Division (EMD), which, among other responsibilities, has overseen energy-efficiency projects for the county’s 38 departments since its inception in 1994 and provides much of the staff directly involved in the LA County Partnership.24
22 The utilities also provide some assistance for the LA County Green Building and Green Purchasing Ordinances. However, this analysis only deals with the retro-commissioning aspects of the LA County Partnership.
23 The information in this analysis is based on interviews with SCE and SCG staff, as well as staff from LA County’s Energy Management Division and a review of the partnership’s 2006–2008 plan and other background materials.
24 Few other counties in California have dedicated energy-management services like LA County.

10. LA County Partnership Program. . .
10-2
Final Summary Report: Process Evaluation of the 2006–2008 Local Government and Institutional Partnership Programs. 1/2/09
In addition to seeking funds to carry out energy-efficiency projects and managing those projects, the EMD manages the County's utility budget; acquires utility services and products (electricity, water, gas); operates power plants/cogeneration facilities to provide heating and air conditioning to County complexes, and ensures the correctness and payment of utility bills. For this service, they charge county departments a two percent overhead fee that in turn pays for the division; this fee is the sole source of funding for the EMD.25
The EMD does not have an annual budget for carrying out energy-efficiency projects. Thus, it seeks funds from the county, which may allocate funds for specific projects. The EMD may also seek funds from the CPUC and utilities. EMD is able to provide all of its services to the partnership Program as “in-kind” and does not charge any administrative costs.
While the EMD is the primary contact for the LA County Partnership, it works closely with internal partners such as:
• The Alterations & Improvements Division, which provides remodeling/ refurbishments, computer cabling, air-conditioning, etc.
• The Maintenance & Operations Division, which provides maintenance and repair services to 200 facilities (about 20,600,000 square feet)
• The Custodial Services Division that provides custodial/grounds maintenance for 160 facilities (about 13,300,000 square feet).
10.2.2 Partnership Scope
The partnership among the EMD, SCE, and SCG is one of shared responsibilities, with all three entities significantly involved in making decisions about the program. Together a core partnership team selects the projects to be done. SCE provides the contracting services for the vendors and administers the payments and both utilities provide administrative oversight.26 EMD provides the “nuts and bolts” of daily management—doing the scheduling and managing the projects in their facilities. The three partners review project progress and results.
While vendors provide engineering analysis, utilities may also provide such analysis on an as-needed basis. With the primary focus on retro-commissioning County buildings, buildings are evaluated and then tuned up and brought back to their “original” operating standard. Because the County has done more than $50 million in lighting, chiller, and VFD upgrades since 1994, evaluation and change-outs of these items are usually not cost effective and are typically not part of projects.
26 SCE provides the contracting services because until recently, contracts of more than $100,000, required County Board approval, which made it difficult to move projects quickly.

10. LA County Partnership Program. . .
10-3
Final Summary Report: Process Evaluation of the 2006–2008 Local Government and Institutional Partnership Programs. 1/2/09
However, during the evaluation phase of the program, a vendor may discover that a new chiller or boiler is needed or the Building Maintenance Division may have identified needed equipment replacements. The Building Maintenance Division then may apply for utility incentives to supplement County funds so that a more efficient piece of equipment can be installed. The partnership program may then coordinate their retro-commissioning efforts with the equipment change-out activity.
10.2.3 Program Logic Model and Implementation Theory
Figure 10-1 shows the logic model for the LA County Partnership. As the logic model shows, the partnership’s primary activities include retrofit projects, retro-commissioning, and education. These activities are to result in six outputs (1) retrofitting county facilities (2) providing incentives for incremental energy savings (3) addressing system deficiencies (4) training facility managers (5) implementing selected recommendations and (6) expanding the partnership to other agencies.
Figure 10-1 LA County Logic Model

10. LA County Partnership Program. . .
10-4
Final Summary Report: Process Evaluation of the 2006–2008 Local Government and Institutional Partnership Programs. 1/2/09
10.3 KEY FINDINGS
The program exceeded its therms goals.
In past cycles, the partnership has exceeded its goals. At the time of this assessment, the partnership has exceeded its therms goals.
The partnership team collaboratively determines the specifications for each potential project, which is defined by six phases. Technologies implemented need to be deemed cost-effective and post-inspections ensure the equipment is installed properly and will yield estimated savings.
The partnership team meets on a bi-weekly basis and with vendors as necessary. The EMD provides a list of County buildings, their energy use intensity, and other information. The EMD develops the energy use intensity information from utility billings or through its Enterprise Energy Management Information System (EEMIS). The partnership team reviews this information and selects buildings to be targeted for retro-commissioning. SCE then puts these projects out to bid.
Once a vendor is selected and a contract signed, there are six phases to the project:
1. Planning
2. Investigation and pre-functional testing
3. E-quest modeling and measure identification
4. Implementation of measures
5. Post-implementation testing to ensure equipment and sequences are working right, re-running E-quest based on what was done, and developing a savings table
6. Training for maintenance personnel.
In the planning phase, the EMD works with the vendor to plan the evaluation of the building. This involves establishing a timeline and working with the agency occupying the building to establish a timeframe for visits and obtaining access.
The investigative phase involves auditing of the building, obtaining energy use benchmarks for the building, investigating how the systems are set and operated, investigating how well the systems are running, and then doing an “as-is” baseline simulation of the building using E-quest. The simulation is normalized against current energy usage. The assessment may identify a need for controls and missing or broken controls For example, it may find problems with time clocks, failed equipment such as economizers, settings for hours of operation that are inconsistent with the way the building is used, and pre-heating or cooling settings that may be unnecessary or exceed what is necessary.
With observations in hand, the vendor will then simulate improvements and assess the cost-effectiveness of various measures. A list of measures is provided to the partnership team that selects options for implementation. To help ensure fair pricing, vendors are informed up-front that all measures are done via change order and that they may not be

10. LA County Partnership Program. . .
10-5
Final Summary Report: Process Evaluation of the 2006–2008 Local Government and Institutional Partnership Programs. 1/2/09
selected to perform the implementation. Generally, however, the same vendor receives a change order to implement the measures.
In the post-implementation phase, the installation and software changes are examined to insure that the equipment has been installed and programmed correctly and that the operational sequences are properly ordered. E-quest is re-run with the changes and compared to building energy use data. If the building is not already connected to the county EMIS system, this is completed during implementation. In buildings already connected to EMIS, additional monitoring points may be installed.
The partnership program is reviewing means to sustain the energy savings resulting from retro-commissioning, which can be diminished by facility and/or engineering staff. The plan includes educating staff, monitoring building performance, and regularly maintaining buildings.
One of the major threats to the persistence of savings from retro-commissioning is the disabling or bypassing of sensors, equipment, or control equipment. Another threat is the resetting of control parameters to previously-used settings.
As such, LA County found that buildings might need a major retro-commissioning as often as every four years unless there is pro-active attention to and maintenance of the retro-commissioning guidelines. Thus, LA County has chosen a “sustained commissioning” path to avoid repeated retro-commissioning efforts and to ensure savings persist. This path involves three elements.
1. Involvement and training of the facility engineering staff
2. Monitoring of building performance
3. Maintenance of buildings.
Involvement and training of the facility engineering staff. Facility engineers have input to the vendor during the retro-commissioning process. The vendor is required to provide an operations manual that explains system operations, the operating parameters, and the changes that have been made to the system as a result of retro-commissioning.
In addition, the vendor is required to deliver on-site training with county facility engineering personnel who have responsibility for the building. The purpose of the training is to provide hands on experience with the system, familiarize the engineering staff with the new equipment, and familiarize the engineer with the new settings and programs and the rationale for those settings and programs. The goal of the training is to reduce the potential for system changes that reduce savings, but at the same time make it easier for them to fulfill their primary goals of keeping buildings open and their occupants satisfied and comfortable.
Monitoring of building performance. Monitoring and building performance is an electric-specific offering from SCE, but as a program component detailed here. The county’s EEMIS, which was installed in 2002, allows them to monitor building performance. EEMIS gathers real time metered data from the largest facilities including data from air conditioning, lighting, and other building loads. It allows for real-time

10. LA County Partnership Program. . .
10-6
Final Summary Report: Process Evaluation of the 2006–2008 Local Government and Institutional Partnership Programs. 1/2/09
analysis and intelligent control over energy usage, as well as comprehensive data warehousing, reporting, and monitoring. It also allows the county to analyze current and project future energy use.
During retro-commissioning, sensors and controls are connected to EEMIS. The system is programmed to provide alarms when equipment fails or is failing, or when the system is being operated outside of design parameters. This system allows centralized management staff to identify problems early and to take corrective action. The system also allows facility engineers to maintain comfort and efficiency.
Maintenance of buildings. The final leg of sustaining savings is proactive maintenance. Because problems such as failed economizers or sticking valves can be identified early, facilities engineers can plan and use their time productively to deal with maintenance issues. This early warning also helps them anticipate what they face before ever reaching the site. Finally, rather than dealing with a slowly deteriorating system, the county is able to maintain the system at specification over a long period. Thus, the initial savings from the retro-commissioning continue to accrue.
The County maintains that while they welcome a continuation of the partnership, they have the capability of administering the program outside of the partnership with the utility. There would be benefits in doing so for the County; however, they see the value of partnering with the utility and note they are committed to growing their relationship with the utility.
While all parties plan and are pleased to continue the partnership, County staff noted that they successfully ran the program on their own during the 2002–2004 cycle and believe they could do so again. One of the key reasons for the partnership, aside from the CPUC’s strong recommendation that local governments partner with utilities, was that the utilities would be able to more easily handle vendor contracts. As it turns out, contracting delays contributed to the program being slow to reach it goals and, in addition, the County changed its contracting policies so that contracts of less than a million dollars no longer need County board approval. The sense among the LA County staff is that they are now more nimble than the utilities in handling the contracts. A change to the county doing the contracting has been discussed for the 2009–2011 cycle.
In addition, County staff noted that they do not charge any administrative fees for their services on the partnership program while the utilities do. Thus, operating the program would be cheaper without the partnership.
County staff also expressed some sensitivity about the amount of time spent by the utilities on quality control. Some LA County staff believe that the generation of “white papers” is time consuming and probably unnecessary. Their viewpoint is that they have hired vendors for their expertise and vendor proposals are carefully reviewed and that the results are confirmed through post-implementation monitoring. They find the white paper process cumbersome, do not understand its value, and say it results in revisiting decisions to no observable purpose.
With that said, the utilities voiced their need to be stringent in their requirements. SCG is held accountable to the PUC for the savings claimed by the program and need to

10. LA County Partnership Program. . .
10-7
Final Summary Report: Process Evaluation of the 2006–2008 Local Government and Institutional Partnership Programs. 1/2/09
maintain strong controls to ensure the projects will result in the claimed savings in the measurement and valuation of the project.
Thus, County staff see trade-offs between their running the program and having a partnership. They acknowledge that the utilities bring unique aspects to the table, including additional engineering analysis skills and a clear and likely more reliable funding source than the County. They also respect their partners and would rather have a partnership than have utility oversight without their real involvement in the program.
Their utility counterparts are satisfied with the partnership and would like to see it expanded to retrofits and new construction. They acknowledge that the County can do the program on their own, but also suggest that utilities may have more funding than the County for projects.
10.4 CONCLUSIONS AND OPPORTUNITIES FOR IMPROVEMENT
In general, the partnership works very well. All parties indicated that this is a successful, collaborative undertaking with good results, in terms of both savings and in the satisfaction of program partners and participants. The partnership combines experience and a highly competent County and utility team. While some glitches have occurred in this cycle, particularly with the need to change vendors, all respondents spoke highly of the program and want to see it continue.
The sustainable aspects of this program appear to be unusual, yet especially effective, for retro-commissioning programs. Gathering the buy-in of facilities staff through initial involvement and training and having the EEMIS detect and alert them to system problems are key components to having savings persist.
While all parties assume (and welcome) a continuation of the partnership into the next cycle, County staff also noted it is well equipped to pursue funding and operate the program if need be. County staff note that running the program solo could reduce costs, since they do not charge administrative costs while the utilities do. They also hoped it might reduce the need for monitoring and evaluation “white papers” which take considerable resources and for which they see limited value, given their focus on persistence and monitoring building performance over time. Last, the County’s contracting limitations that made utilities the better choice for handling vendor contractors have now been relaxed, making them the likely choice for these program responsibilities in the future. Both County and SCG staff value the partnership. County staff said they greatly prefer partnering with the utilities than having them in a purely oversight role.

11-1
Final Summary Report: Process Evaluation of the 2006–2008 Local Government and Institutional Partnership Programs. 1/2/09
11. CALIFORNIA URBAN WATER CONSERVATION COUNCIL PARTNERSHIP PROGRAM
11.1 INTRODUCTION
The 2006–2008 Pre-rinse Spray Valve (Spray Valve) Partnership between Southern California Gas (SGC) and the California Urban Water Conservation Council (CUWCC) was the third phase of a direct-install program that replaced high energy and water use pre-rinse spray valves with more efficient models at food service facilities. It was a resource acquisition program that targeted hard-to-reach food service operators with the free spray valves.
Both partners report that the Spray Valve program overall was very successful both in terms of being an effective partnership, in operating effectively, and in influencing the State’s adoption of a higher efficiency standard for technology. However, the program was discontinued in June 2007 due to three factors:
• The efficient pre-rinse spray valve it featured became the new state (and eventually national) standard. While a case was made to continue the program to spur more rapid adoption among customers in this hard to reach sector, two other factors (listed below) eventually led to program sponsors deciding to discontinue the program.
• A 2006 impact evaluation27 showed that savings were less than expected—below the initial assumptions and much lower than a previous impact evaluation showed. This reduced the program’s cost-effectiveness to below acceptable levels.
• The program was having a difficult time meeting its goals in the third phase, in large part because it had already saturated the market in the first two phases where it had exceeded its goal (Phase 1) or met it (Phase 2). In addition, the third-phase program started late and newly targeted areas had many older food service establishments that did not contain the “set-up” for spray valves.
Thus, the program achieved significant success, both in installing high-efficiency pre-rinse spray valves and in transforming the market in the future; both factors contributed to its appropriate closure.
11.2 PROGRAM BACKGROUND AND STRUCTURE
While the CUWCC operated the Spray Valve program as a third party program in 2002–2003, when it installed nearly 17,000 efficient spray valves through most of California, it
27 See Impact and Process Evaluation Final Report for the California Urban Water Conservation council, 2004-5 Pre-Rinse Spray Valve Installation Program (Phase 2), SBW Consulting, Inc., Glacier Consulting Group, LLC, ASW Engineering Management Consultants, and ConserVision. This evaluation provides many insights about the program as operated in its second phase and is the source of the savings estimates that showed it was not cost-effective.

11. California Urban Water Conservation Council Partnership Program. . .
11-2
Final Summary Report: Process Evaluation of the 2006–2008 Local Government and Institutional Partnership Programs. 1/2/09
was operated as a partnership with utilities its second and third phases.28 The specific partnership being analyzed in this chapter is the one between SCG and the CUWCC for the 2006–2008 cycle. 29 Third phase goals were to install 10,000 efficient spray heads and save 847,303 net therms per year, with a budget allocation of $1.299 million over three years.
The Spray Valve Program sought to accelerate the replacement of inefficient spray valves with more water-efficient and energy-efficient ones, thus making the partnership between SCG and CUWCC a natural fit. The program’s target audiences included various food service facilities including restaurants, cafeterias, institutional kitchens, and food preparation companies.
11.2.1 Program Logic Model and Implementation Theory
The program logic model for the Spray Valve program is shown in Figure 11-1. As the logic model illustrates, the partnership’s primary activities include door-to-door outreach, spray valve replacements, and quality assurance. These activities are to result in three outputs (1) solicitations, (2) 10,000 spray valves installed, and (3) inspections.
28 PG&E is also a partner for the program in their natural gas service territories.
29 This evaluation is based on interviews with SCG and program staff, as well as a review of the program implementation plan, and progress and evaluation reports.

11. California Urban Water Conservation Council Partnership Program. . .
11-3
Final Summary Report: Process Evaluation of the 2006–2008 Local Government and Institutional Partnership Programs. 1/2/09
Figure 11-1 California Urban Water Conservation Council Logic Model
11.3 KEY FINDINGS
The program, the most progressive in the Partnership programs evaluated, does not project to reach its therms goals.
The resource goal established for the CUWCC Partnership program was 847,303 therms annually, for a cumulative savings of 2,541,910 therms. The goal for the CUWCC Partnership was by far the most progressive in all the partnership programs evaluated for this SCG Partnership Program Evaluation. The program, even amidst the difficulties discussed in this chapter, reached 25 percent of its goal and achieved a reported 643,290 therms saved as of the June reporting on EEGA.
According to the most recent Quarterly Report Narrative on the EEGA system (fourth quarter, 2008), the program is falling short of its expectations and does not project it will meet its goals. According to the documentation, “Current cost of continuing implementation is not cost effective.”
The three-year budget for the partnership is nearly $1.3 million. Only about 30 percent of the budget was spent as of the June reporting.

11. California Urban Water Conservation Council Partnership Program. . .
11-4
Final Summary Report: Process Evaluation of the 2006–2008 Local Government and Institutional Partnership Programs. 1/2/09
The program, funded primarily by SCG, adopted the door-to-door canvassing outreach approach. The program estimated installing 35,000 spray valves.
Overall, the partnership was structured where CUWCC oversaw the program, working with its consultants to deliver the program30. SCG was an important contributor of funds and their savings helped justify the program, but they were generally “hands-off” in terms of day-to-day program operation.31
Based on industry knowledge, the program adopted the door-to-door canvassing approach—“literally went to every food service agency we could find”—where skilled, multi-lingual technicians canvassed neighborhoods and provided free spray valves and free installation at the time of outreach.
The CUWCC conducted 50 percent phone inspections and ten percent on-site inspections to ensure the product was installed and assess customer satisfaction. The plan for the third phase was to conduct 20,000 door-to-door solicitations and to achieve a 50 percent response rate in a limited market estimated at 35,000 spray valves, leading to short-term and long-term reduction in water and energy use.
The program was discontinued due to difficulty meeting its goals. The program overestimated the size of the market. Additionally, even with the modifications in their outreach approach, the program had difficulty engaging participants.
As noted, the program was discontinued. One reason for the discontinuation cited was difficulty in meeting its goals. Response rate was targeted at 50 percent but, in the third phase, dropped to 20 percent.
Program managers believe that the drop off in performance related to an original overestimation of the size of the market. Additionally, the program through previous efforts reached a significant number of businesses, reducing the number of eligible potential participants. Thus, by the third phase, the available businesses were the hardest ones to reach.
To complicate matters, it was difficult for the program to engage potential participants. These businesses were spread out, small, busy, and shift-work oriented. As one person put it, “these folks have five seconds for you.” When they are open, they tended to be very busy; on the other hand, decision-makers might be gone during off-peak hours.
The program attempted to adopt their approach to engage businesses. One example was the move to hire multi-lingual installers. Many businesses have decision-makers with limited English skills, including a variety of Asian and Hispanic dialects. Recruiting and hiring multi-lingual installers presented one challenge, but, once hired, proved to be
30 Maureen Ebreznik, the contact administrator, and Honeywell, the installation vendor.
31 At the time of this process evaluation, the program had already stopped operating, so SCG staff interviews did not reveal a lot of information about the program.

11. California Urban Water Conservation Council Partnership Program. . .
11-5
Final Summary Report: Process Evaluation of the 2006–2008 Local Government and Institutional Partnership Programs. 1/2/09
quite effective as long as the installer ethnicity matched those of the businesspeople. Still, the need to match up installers and businesses made canvassing less efficient.
Chain food service businesses presented another type of problem: the corporate office mandates equipment with certain specifications, making it more difficult to do the “instant” change outs, and often requiring return visits which were not planned for in the program design.
The program identified marketing “lessons learned” for the targeted population.
The program experienced some marketing glitches and learned lessons about what the target population likes or dislikes through the various marketing strategies. First, the program identified that slick or complicated collateral materials did not work. A more straightforward approach proved to be more effective. The program developed straightforward materials with this type of messaging: “it will save you $500 a year, it’s free, if you don’t like it, take it out.”
Also, some businesspeople were suspicious of the “free” aspect of the program, and wondered “where was the catch?” The 2004–2005 process and impact evaluation32 reported that letters from water or utility authorities, or the state, helped overcome these suspicions.
The savings reported by the program were minimized by the participants’ lower water use. Additionally, the savings needed to be modified due to fraudulent reporting, which induced the practice for a higher level of inspections.
The savings realized by the program is directly related to the type of facility in which the equipment is installed. Businesses that have long hours of spray head use using warm water for pre-rinsing will have significantly higher savings potential than businesses with low spray head use using warm water. Therefore, while targeting improved considerably in the third phase, the lower savings in the second phase were in part due to including grocery stores that used the spray valves much less.
Additionally, throughout the program cycle, program managers discovered that some installers were submitting fraudulent paperwork, which was inflating the reported savings. The program reacted to this finding and conducted interviews with 100 percent of participants to make sure the spray valves were installed. The program also and increased the percentage of inspections. This change increased the quality of the data reported, but also meant the savings decreased.
11.4 CONCLUSIONS AND OPPORTUNITIES FOR IMPROVEMENT
The administrative aspects of the program worked very well. No problems were reported with the budget allocation and reporting requirements, although cost-effectiveness decreased in the third stage due to an already saturated market.
32 SBW Consulting, Inc., Glacier Consulting Group, LLC, ASW Engineering Management Consultants, and ConserVision.

11. California Urban Water Conservation Council Partnership Program. . .
11-6
Final Summary Report: Process Evaluation of the 2006–2008 Local Government and Institutional Partnership Programs. 1/2/09
One key success indicator for the program was response rate, which was targeted at 50 percent of the offers made to food service businesses. In the third phase, response rate fell to about 20 percent due to saturation and restaurants having no spray valve set up.
The 2004–2005 process and impact evaluation provided valuable information on various success indicators, including:
• High customer satisfaction with the product and process. Few removed the new spray valve and participants particularly liked the “easy” participation process—no paperwork, no cost, no delay.
• Analysis showed that awareness of high-efficiency spray valves was low, resulting in a low free-ridership rate.
• The cost-effectiveness of the program was not sufficient due to the lower level of measured savings.

12-1
Final Summary Report: Process Evaluation of the 2006–2008 Local Government and Institutional Partnership Programs. 1/2/09
12. SOUTH BAY PARTNERSHIP PROGRAM
12.1 INTRODUCTION
The South Bay Partnership is a non-resource program that provides a local clearinghouse for energy-efficiency and water conservation information and training. These services are provided at the South Bay Energy Savings Center (SBESC), a local resource for energy-efficiency information and education. The partnership is a continuation of what was considered an effective partnership program that established the SBESC in 200433.
The partnership program is a collaboration among SCE and SCG along with the South Bay Cities Council of Governments (SBCCOG) and the SBESC. The lead utility for this program is SCG.
The program places a strong emphasis on funneling businesses to the partner utilities account representatives through the education, training, and information activities. The partnership monitors which potential participants have been referred into a utility core program and follows up with them as appropriate. The partnership supports sixteen local governments in the South Bay area as well as local communities and businesses.
This successful non-resource partnership exceeded its 2006–2008 program period goals, which are denominated in terms of outreach events and activities. The goals were surpassed in September 2007.
12.2 PROGRAM BACKGROUND AND STRUCTURE
12.2.1 Program Description
The partnership is based on the successful linking of and joint authority of 15 Bay Area cities who work together for the mutual directive of maximizing the quality of life and productivity in their region. The partnership is headed by the executive director of the Council of Governments and the day-to-day operations are managed by a program manager. Both individuals report to the Board and serve as the liaisons between the cities and the utilities supporting the program. There are several contract administration and accounting staff, along with technical staff, that perform audits and provide support to the businesses while efficiency projects are performed.
The partnership management acts as a liaison to the public who utilize this program and to the Board of the Council of Governments. Being former elected officials, the partnership management reports they have experience that allows them to circumvent or facilitate some of the major stumbling blocks associated with proposing, approving, and funding major energy-efficiency projects. Often, they personally know the government employees involved in the energy projects and work closely with these employees to expedite their budgetary approval processes. They also provide information to the
33 2006–2008 Energy Efficiency Program Theory for SCE2520, obtained from EEGA

12. South Bay Partnership Program. . .
12-2
Final Summary Report: Process Evaluation of the 2006–2008 Local Government and Institutional Partnership Programs. 1/2/09
appropriate city staff regarding new technologies being targeted or new and available utility programs operating within the region. Representatives from each city sit on the Council, with some representatives participating on the Board of Directors.
The Council did not originally engage in energy-efficiency issues, but realized that they could enhance their members’ benefits by entering into a partnership contract with SCE and SCG to promote energy efficiency. Now the Council serves as an example to cities by making energy and water efficiency improvements in their own facilities.
The partnership program focuses on the following two major activities:
• Disseminate energy information to all sectors of the community. Through the SBESC, the program provides the communities with a central source of energy-efficiency information (both from an energy and water conservation perspective). Additionally, the center provides information to residents, businesses, and local governments on utility programs available to them, and funnels potential participants into applicable utility programs.
• Provide training and workshops. Training and workshops, typically held at the SBESC, are available to all sectors of the communities such as businesses, residents, seniors, mobile home parks, and building professionals. Energy code training is outlined as a specific area of interest by the program, along with other training targeted to the needs of the communities. The program customizes workshop and training opportunities to the target audience, and provides “off-hours” workshops to accommodate scheduling difficulties, particularly for difficult-to-reach businesses. Commercial workshop titles include Title 24 Overview, Energy Efficiency for Businesses, Business Workshop, and Green Building for Architects and Building Officials. Residential workshop titles include Energy Efficiency 101 Workshop and Energy Efficiency 101/Remodeling.
In addition to the primary elements listed above, the program also provides energy audit assistance and referrals, or funneling, into other programs.
• Energy audits. Energy audits are conducted as part of the program entitled The South Bay Public Facilities Energy Efficiency Project (EE+). The audits intend to stimulate equipment retrofitting and building system changes to reduce energy use.
• Program referrals. The program is putting significant emphasis into funneling customers to the partner utilities through the education, training, and information activities. This program monitors which potential participants have been funneled into a utility core program, and follows up with them as appropriate.
12.2.2 Program Logic Model and Implementation Theory
Figure 12-1 presents the logic model for the South Bay Partnership. As the logic model shows, the partnership’s primary activities include provision of program information, energy education, city facilities technical assistance, and new construction technical assistance. These four activities are to result in six outputs (1) exhibits, displays, cable TV public service announcements, (2) Energy Lending Library, (3) community sweeps, (4) workshops, (5) audits, technical and incentives assistance, and (6) early identification through permitting process.

12. South Bay Partnership Program. . .
12-3
Final Summary Report: Process Evaluation of the 2006–2008 Local Government and Institutional Partnership Programs. 1/2/09
Figure 12-1 South Bay Logic Model
12.3 KEY FINDINGS
As a non-resource program, the South Bay Partnership Program has event rather than saving goals. The program exceeded its goals early in the program cycle. The program spent its allocated funding and asserts that additional funding could provide additional outreach opportunities.
The program does not have resource goals, as it is an indirect program. Instead, the program logic lists program indicators, as identified in the logic model above under outcomes. Specifically, the program expects to:
• Funnel projects into SCG rebate and incentive programs
• Increase the marketing of energy information, enabling customers to make informed decisions

12. South Bay Partnership Program. . .
12-4
Final Summary Report: Process Evaluation of the 2006–2008 Local Government and Institutional Partnership Programs. 1/2/09
• Increase participation of small businesses in retrofit programs
• Identify opportunities for municipal facility retrofit projects
• Leverage the City’s infrastructure to identify and react to the needs of the constituents.
The program established very specific annual targets for training opportunities. These activities are detailed below.
• Workshops for businesses and Government organizations. These workshops include titles such as Public Agency Workshop for Planners, Title 24 Overview, Energy Efficiency for Businesses, Business Workshop, and Green Building for Architects and Building Officials.
• Workshops for residential customers. As discussed in the introduction, workshops offered to residential customers include titles such as Energy Efficiency 101 Workshop and Energy 101 and Green Tips for Remodeling.
• Community sweeps. A component of outreach, the program goes into the community and goes door-to-door to provide information related to energy efficiency, energy conservation, and utility program opportunities.
• Community outreach. The program provides outreach to the community through events such as the City of Torrance Appreciation Day and Hawthorne Community Earth Day Festival. Program representatives also provide information to the community by appearing for interviews for shows on Cable TV, distributing newsletters, and publishing articles in publications such as the Palos Verdes Peninsula News.
In addition to these targeted non-resource activities, the program also provides visitors to the South Bay Energy Savings Center the opportunity to sign up for The Gas Company Energy Efficiency Kit. The kit, containing a low-flow showerhead and faucet aerator, further promotes therms savings education and opportunities.
Program managers believe they have been successful at program outreach and believe additional funding would benefit the program and community. The additional funding would, in part, be earmarked to attempt to reach the businesses that might have a difficult time attending meetings and workshops during regular business hours. Additional funding could also allow the program to provide workshop and outreach events at the business sites so that the owners and employees would not need to leave their business’ premises.
The program markets itself and distributes energy-efficiency information via a variety of venues.
SBESC developed a marketing and outreach plan designed to reach the community through various marketing and media venues. The plan intends to market the program to all sectors of the community, including residential, small business, non-profit, and government organizations.

12. South Bay Partnership Program. . .
12-5
Final Summary Report: Process Evaluation of the 2006–2008 Local Government and Institutional Partnership Programs. 1/2/09
The program markets itself through direct mailings, program literature, and fact sheets. The program uses personal opportunities, such as face-to-face meetings customer education, and outreach events, to promote the program. Additionally, electronic resources such as electronic newsletters and a web page are employed. The SBESC also develops public service announcements for local cable television (CATV) as well as coordinates opportunities for local cable television interview shows with local elected officials, IOUs, and SBESC representatives. The program gains inputs and approval by the IOUs for these activities.
Statewide and national energy marketing information is distributed by the SBESC. An Energy Lending Library’s exhibits and displays that focus on energy efficiency and the programs that are available.
Program staff believe they have been successful in marketing the program. However, the partnership depleted their funding early in the program cycle. Partnership staff believe that additional funding would allow them to market the program even further
The partnership offers technical assistance to nonresidential customers through Energy Efficiency Plus. The technical assistance provides audits, recommendations for improvements, and direction into utility programs and paperwork assistance. Customers expressed satisfaction with the assistance in interviews.
The partnership offers technical assistance to nonresidential customers through Energy Efficiency Plus (EE+). A contractor, hired by the partnership, provides audits and makes recommendations for improving the energy efficiency of buildings. The program also takes the opportunity to direct customers into utility programs through the recommendation process.
The audits performed for this partnership support the application for incentives offered by the electric and gas utilities. For general information regarding energy efficiency within a building, customers can access the partnership website and link to SCG’s online energy surveys.
The utility does not provide feedback to the partnership regarding completed projects, so the partnership is unable to assess the success of the marketing and information dissemination provided to participants. However, the partnership keeps internal records of those who were funneled to the utility along with the audit results and recommendations.
In an effort to assess participant satisfaction, a partnership contractor contacted partnership participants in 2007 and 2008. These calls asked participants which measures they installed after the referral. Additionally, the calls assessed participant satisfaction with the program.
From a perusal of the results of that initial follow-up, it seems that most participants were satisfied with the information provided to them by the partnership and some degree of measure installation did take place after funneling to the utility. Where additional information or utility involvement is required, it is provided to the appropriate individual for follow-up. There has been no estimated gas savings produced by the partnership.

12. South Bay Partnership Program. . .
12-6
Final Summary Report: Process Evaluation of the 2006–2008 Local Government and Institutional Partnership Programs. 1/2/09
Overall, interviews with city partners indicate they believe the partnership has increased public and participating members’ level of awareness and buy-in for energy efficiency. Energy efficiency has since become a more regular topic among city staff during City Council meetings and a greater consideration of energy efficiency exists in purchasing and planning decisions
Since this partnership is relatively new in cooperating with the joint utilities, the initial push has been to produce electric and water savings. Linkage to hot water conservation opportunities has produced some side benefit in saving energy, including gas. However, as this program matures, it would be beneficial for the program to continue to assess the gas applications to encourage additional therms savings.
SCG and the program received positive feedback from city partners. Partners reported there was an initial lack of involvement by the utilities, which has been addressed and has improved their satisfaction with the utility.
PA researchers spoke with partnering city staff as part of the evaluation. Overall, most respondents expressed their satisfaction with the partnership and the Center in particular. A few expressed their enthusiastic support for everything the SBESC offers, listing their wide programming scope (from energy to water), excellent outreach to both cities and residents, and the convenience of a “one stop shop” for programmatic assistance. While a couple of respondents mentioned that the information and support provided is a little too “generic,” these responses were in the minority. One city is so impressed with the partnership that they believe it should be held up as the state model for partnerships.
One question the evaluation sought to address was whether SCG’s image improved or changed due to involvement in the program. Interview results indicate that, yes, the image improved, but not immediately. The partners initially felt that utility involvement was less than satisfactory in that they wanted the utilities to be more involved than they were. For example, the partners including the utilities did not initially meet on a scheduled basis to discuss the partnership. This lack of communication led to a disconnect between the partners. Partnership staff felt that disconnect could affect the participating cities as well. In response, the partnership changed the process and mandated that partner meetings be held monthly. This change helped boost the relationships between the partners, especially with the utilities, along with that of the participating clients. The partnership management also believes that since the leadership has changed from SCE to SCG, the processing of invoices and reaction to issues has been expedited and everybody is content with this change.
PA asked both city partners to rate the partnership on a scale of 1 to 10, where 1 means the utility is doing most of the implementation work and 10 means the partner is doing most of the work. The five respondents that replied to this question ranked the partnership positively, with smaller cities claiming the greatest gratitude for the partnership support since they have limited staff and are overwhelmed with work. With a “5” being a true partnership, four respondents ranked the partnership a 4 or a 5. Only one respondent ranked SCG lower than this—a “two and a half or three,” indicting the city partner is less involved.

12. South Bay Partnership Program. . .
12-7
Final Summary Report: Process Evaluation of the 2006–2008 Local Government and Institutional Partnership Programs. 1/2/09
These ranking vary somewhat from SCE. City partners were more likely to say SCE was less involved. One respondent rated SCE a 10, and another rated SCE an eight.
Partners interviewed provided several recommendations that they believe would improve their satisfaction with the program. These recommendations focused on program offerings and marketing efforts.
• Inclusion of solid and liquid waste. Although appreciative of the comprehensive energy and water-related programming, several partners felt that liquid and solid waste needed to be included, especially for coastal cities.
• Marketing expansion. City partners suggested that marketing should expand to engage cities who are less proactive or less involved. City partners interviewed believe that only 14 of the 16 participating cities are highly engaged. Although this is a relatively high percentage, the program should continue to engage the cities, paying attention to the lesser-engaged cities.
Additionally, the interviewees suggested that while the marketing and outreach efforts have been effective, they believe improvements could be made in how information is disseminated to the general public. Different approaches include marketing the success stories and the potential for action more effectively.
Staff from participating municipalities believe they, and the program, would benefit from additional communication from utilities. They would like to improve the feedback loop related to their performance, the planning processes, utility offerings, and the impact of program referrals.
Staff interviewed from participating municipalities raised the topic of utility feedback as an area for improvement. First, program partners believe they would benefit from receiving feedback on their performance in the partnership and if there is anything that could be done to improve the program. Program management felt that this level of feedback would push them to be better contributors to energy efficiency. One proposal was that the utility compare their activity to other local government partnerships and level of referrals into the utilities’ core programs. They believe benchmarking this program against other programs would identify areas for improvement.
Additionally, City partners felt removed from the utility program planning activity. They discussed that they are simply presented with goals rather then being allowed to develop the goals with the utility. While developing the goals with all program partners may slow down the process, engaging the city partners would provide buy-in to the goals of the program and may provide insight into the goals established.
These interviewees also voiced that the utility did not always communicate activities within their area, which they believe are important to know. For example, it was a surprise to them when they found out that the utility performed certain energy-efficiency activities (such as neighborhood blitzes) without their knowledge. If the program had that knowledge beforehand, management felt they could have contributed to the success and provided added elements for greater reach.
Last, program management expressed frustration at not receiving feedback related to the results of the referrals into the utility core program. They would like to be able to

12. South Bay Partnership Program. . .
12-8
Final Summary Report: Process Evaluation of the 2006–2008 Local Government and Institutional Partnership Programs. 1/2/09
assess program’s impacts from the program participant’s actions in the utility program because of their referral. This information would be useful to the program staff for future goal achievement and for public relations purposes. It would also make them feel more engaged in the utility’s energy-efficiency initiatives.
12.4 PARTICIPANT TELEPHONE SURVEY FINDINGS
The partnership provides residential customers with the opportunity to attend a variety of different types of workshops. Workshop titles include: Tips for Reducing Your Energy Bill; Remodeling with Energy Efficiency; and Energy Efficiency 101 Workshop.
The sample source for the South Bay Partnership Program was provided by the SBESC. The information was provided via PDF files and data entered to form the sample file. The PDF files provide contact names, workshop name, and the mixture of branded handouts distributed or made available to participants via the workshop. These handouts are typically referrals to rebate programs (e.g., 2006–2008 Energy Efficiency Programs for Businesses and 2007 Home Efficiency Rebate Programs) and recommendations for energy efficiency (e.g., 45 Ways to Save).
The survey captured participants’ experiences with the workshops, including any equipment they may have received as part of their workshop experience. Note that the sample data did not differentiate SCE and SCG program involvement; therefore, these results include data from customers from both utilities.
12.4.1 Key Findings—Residential
Residential customers first and foremost said they decided to attend the workshops so they could learn how to save energy, followed by how to save money on their energy bills (Table 12-1). Other reasons for attending the workshop included business networking, interest in free inspections, in the market for a water heater, support the City of Torrance, and interest in rebates.

12. South Bay Partnership Program. . .
12-9
Final Summary Report: Process Evaluation of the 2006–2008 Local Government and Institutional Partnership Programs. 1/2/09
Table 12-1 Reasons for Attending Workshops (n=77)*
* Represents SCE and SCG customers
Respondents, for the most part, felt the workshops were either somewhat useful (45 percent) or very useful (52 percent) in understanding how to save energy in their home. Only three percent said they did not believe the workshop was useful at all (Figure 12-2).
Figure 12-2 Usefulness of Attending Workshops (n=71)*
Very useful 66%
Not at all useful
2%
Somewhat useful 32%
* Represents SCE and SCG customers
Respondents noted that the workshops provided them with specific things they could do in their home to save energy, including purchasing energy efficient appliances, lowering water heater temperatures, and installing low-flow showerheads. Nearly 90 percent of these respondents said they have done some of these recommended activities since attending the workshops. The most commonly noted was that they installed CFLs (69 percent), but a small percentage also reported installing low-flow showerheads or conserving water (five respondents), evaluating, replacing, and/or sealing their windows (9 respondents), and installing a new thermostat. One respondent even noted purchasing a tankless water heater as a result of what they learned in the workshop.
Reason Percent
Learned how to save energy 33%
Save money on energy bills 21%
Interested in material 8%
Right thing to do 1%
Want to help utility 1%
Saw ad 3%
Remodel home 5%
Considered adding solar panels 4%
Other 37%

12. South Bay Partnership Program. . .
12-10
Final Summary Report: Process Evaluation of the 2006–2008 Local Government and Institutional Partnership Programs. 1/2/09
Eighty percent of households interviewed said they received a “take-away” from the workshops, such as water saving products. Of those who received equipment, 16 percent said they received a water aerator, and an additional five percent said they received a kit with energy efficient tips. Only a third of these respondents said they installed the water aerator or low-flow showerhead received in the kit.
Figure 12-3 Items Received from Workshop (n=58)*
97%
16%5% 7%
0%
20%
40%
60%
80%
100%
CFLs Water aerator Kit w/energyefficient tips
Other
Item Received
Per
cent
* Represents SCE and SCG customers
In general, households felt as a result of their participation in the workshop they will saved or will save money on their energy bills (35 percent) and/or learned how to save energy (42 percent). Sixteen percent said they did not believe the workshop benefited them at all. Interestingly, only two of these individuals rated their satisfaction with the workshop experience low (a 2 or below on a 5-point scale), with over half of these individuals rating their satisfaction high (4 or 5 on a 5-point scale). So, although sixteen percent did not believe they benefited, a majority still remained satisfied with the program.
Overall, satisfaction was high for the workshops administered by South Bay. The average satisfaction rating was 4.1 on the 5-point scale where 5 is very satisfied. The respondents that rated their satisfaction 3 or below provided recommendations for ways they could have been more satisfied. The most commonly noted issue was that the workshop was too basic of an overview and they wanted more specific information. Several example comments are noted below.
“Maybe demonstration on the weather-stripping and other things on keeping the heating and cooling cost down”
“Wish they can give a little more specific information. Needed to be more concrete. Should have been more of a "how to" then basic overview. It was very basic…”

12. South Bay Partnership Program. . .
12-11
Final Summary Report: Process Evaluation of the 2006–2008 Local Government and Institutional Partnership Programs. 1/2/09
“If it was tailored more for my specific needs. It was basic and I'm a little more knowledgeable on the subject.”
12.4.2 Key Findings—Commercial
Workshops provided to commercial customers revolved around a variety of topics. Workshop names include: Title 24 Overview; Energy Efficiency for Businesses; Self-Generation Workshop: Solar Focus; and Green Building for Architects & Building Professionals.
Like residential customers, commercial customers primarily say they attended the workshops to learn how to save energy (34 percent). Overall, customers felt the workshops were useful; 71 percent said the workshops were very useful, and an additional 27 percent said the workshop was somewhat useful.
Almost half (45 percent) said they did something in their organization as a result of what they learned about in the workshop. Of these respondents that did something as a result of what they learned. Eleven percent said they reviewed their water use and eleven percent said they purchased and installed energy efficient water equipment. Other changes include:
• Changing flush valves in their bathrooms (one respondent)
• Installing a tankless water heater (one respondent)
• Replacing toilets and/or installing low-flow faucets (three respondents)
• Installing waterless urinals (one respondent)
• Having a consultant come into the building to do a water audit (one respondent).
Respondents that made these changes to their facilities were asked how influential the workshop was in their decision to make the change. Respondents generally felt the workshop was influential; rating the level of influence an average 7.9 on a 1 to 10 scale, where 10 is extremely influential. In fact, over half of the respondents rated the level of influence an 8, 9, or 10 (58 percent, n=38). Only 10 percent of respondents provided a rating lower than 6.
Respondents cited various benefits of the workshop including that they learned how to save energy and they believe they have saved or will save money on their energy bill. About a fifth of respondents also said they would share the information with others (Figure 12-4). Other benefits for participating in the workshop include: becoming greener/more energy efficient, understanding programs available, receiving information on new code requirements, saving water, obtaining rebates, and gaining assistance in receiving grants.

12. South Bay Partnership Program. . .
12-12
Final Summary Report: Process Evaluation of the 2006–2008 Local Government and Institutional Partnership Programs. 1/2/09
Figure 12-4 Benefits of Attending Workshop Offered by South Bay (n=77)*
42%
25%20% 20%
7%1%
42%
0%
20%
40%
60%
80%
100%
Learned how tosave energy
Saved moneyon energy bills
Saved energy Shared learnedinfo with others
Installed moremeasures
No benefits Other
Benefit from Workshop
Per
cent
* Represents SCE and SCG customers
CONCLUSIONS AND OPPORTUNITIES FOR IMPROVEMENT
Overall, the partnership program is working well in terms of the centralized information resource, the outreach and education efforts, and working with the cities to identify opportunities for cost savings. City partners who were less familiar with energy efficiency initially appreciated the assistance in learning about regulations (Title 24, AB32, among others) and energy efficiency in general. And program participants interviewed expressed a high level of satisfaction with their interactions with the program.
Despite generally positive feedback and perception of fulfilled expectations, the city partners felt that there is not enough awareness among the general public about the SBESC and the resources they offer. Improved marketing and better outreach, they hope, would increase awareness and the number of residents taking advantage of the program(s). Some attributed the lack of marketing and overall awareness to the lack of funding they believe the program currently suffers. Better funding could mean additional staff resources which could reduce, if not eliminate, the current delays in response time.
Additionally, is striking the level to which the program is exceeding its goals. While the level of outreach and education is commendable, this success indicates that the program has room to continue to expand its reach to include hard therms savings and developing energy-efficiency projects with those organizations reached by the program.
As this chapter discussed, interviews revealed several opportunities for improvement related to expanding the marketing and outreach of the program and inclusion of other elements in the program, such as solid and liquid waste. Additional opportunities for improvement are detailed below.
• Develop a database to track customer referrals. This partnership tracks customers who are funneled into the utility core programs, but is not consistent with who they

12. South Bay Partnership Program. . .
12-13
Final Summary Report: Process Evaluation of the 2006–2008 Local Government and Institutional Partnership Programs. 1/2/09
track and how the data is tracked. Having a utility-developed or approved database structure would ensure that all needed information for evaluation would be available in a manner that can be compared to other partnership data. It is suggested that future data collection be based upon a method/format that can be summarized or produced through the analyses of data formats that are common amongst the partners. The utilities can recommend the best format for the partnership to utilize and to facilitate future data collection.
• Communicate results of referrals. Aside from the tracking database noted above, the partners would like to receive information about projects referred into utility programs. Partners noted that they do not receive data regarding measure implementation after their referral to the utility programs. Data on the work completed as a result of the referral should be summarized and provided back to the partnership for their own records and to identify areas for improvement or to direct their marketing strategies. This would also allow the partnership to see how their activity plays within the utility planning and goal setting.
• Improve feedback and communication loops. Program partners expressed that they would like a better feedback loop between the utility and themselves. First, they would like to receive feedback on their performance so they could know what they are doing well and what they need to do better to increase their impact on the communities. Program partners also mentioned they would like to be more integrated in the program planning initiatives. In addition, Program partners expressed that they would like the utility to better communicate events in their areas. Having information prior to the utility activity would empower this partnership to provide additional information to their clients on efficiency opportunities.
• Increase staffing for program management. City partners and program managers interviewed discussed in interviews the need for additional staffing resources for both the utility and partners. These interviews indicated that insufficient staffing reduced the effectiveness of the program and recommended increasing budget to fund additional staff.

13-1
Final Summary Report: Process Evaluation of the 2006–2008 Local Government and Institutional Partnership Programs. 1/2/09
13. VENTURA COUNTY PARTNERSHIP PROGRAM
13.1 INTRODUCTION
The Ventura County Partnership Program is a non-resource program that provides a local clearinghouse for energy efficiency and water conservation information and training. The partnership is a continuation of a program that established the Ventura County Energy Resource Center (VCERC) in 200434. The program was enhanced to target “community asset” organizations such as schools, hospitals, museums, and community centers. These organizations were identified by the partnership as groups that had under-invested in energy-efficiency upgrades.
The partnership is a collaboration between SCE (as lead utility) and SCG along with the Ventura County Regional Energy Alliance (VCREA). The VCREA is a Joint Powers Agency and, at the time of developing the program theory, represented the County of Ventura, Ventura Community College District, Casitas Municipal Water District, Ventura Regional Sanitation District, and the Cities of Ventura, Oxnard, Thousand Oaks, and Santa Paula.
As denoted in the Program Implementation Plan, the objectives of Ventura County Partnership are to35:
• Provide specialized energy-efficiency service offerings to Ventura local governments, community asset organizations, and small businesses and other target market segments in the region.
• Identify opportunities for municipal building retrofits, new construction, commissioning and retro commissioning as well as funnel existing IOU energy programs.
• Leverage local government communication infrastructure to inform their local communities about the wide variety of energy efficiency and demand reduction offerings available to them and encourage participation.
13.2 PROGRAM BACKGROUND AND STRUCTURE
13.2.1 Program Description
This non-resource program strives to create short- and long-term energy savings for Local Government organizations and the communities. The means to accomplish this is through energy-efficiency education, information, and service offerings. The three primary elements of the program are:
34 2006-2008 Concept Paper for SCE 2519, obtained from EEGA.
35 EEGA.

13. Ventura County Partnership Program. . .
13-2
Final Summary Report: Process Evaluation of the 2006–2008 Local Government and Institutional Partnership Programs. 1/2/09
1. Energy information through the Ventura County Energy Resource Center (VCERC). The program, through VCERC, provides a clearinghouse for energy-efficiency information, education, and technical resources. VCERC is open to the public for community use and research through their meeting rooms and energy and environmental impacts library. Examples include a regional newsletter and “Energy Efficiency 101” classes for the youth market.
2. Energy-efficiency training and workshops. VCREA provides outreach to local communities for training and workshops that target businesses, residents, homeowner associations, business and social groups, seniors, mobile home park residents, and building operation professionals. This training is focused on specific energy-efficiency technologies for building operation managers and system designers (including training on efficiency in pump technology and lighting).
3. Energy efficiency for public agencies. This programmatic component offers energy-efficiency improvement support to public facilities. This support includes (1) development of work scopes for projects, (2) pre-qualifying contractors and serving as project management during construction phases, (3) energy audits, and (4) low-interest loan assistance.
In addition, the program refers customers to incentive programs. Through a qualification process directed by VCREA, buildings are identified for potential energy improvements and, if found to meet the qualification parameters, are funneled to the appropriate IOU program where the project is provided with incentive funding. The funneling activity is something that the VCREA is not given credit for as it is not a specific program goal.
The partnership is headed by the executive director who also manages the program general activities, and provides education to clients through delivery of workshops and educational seminars on energy efficiency. The program manager, an engineer with many years of auditing and energy consulting experience, manages the day-to-day operations and seminar presentations. Both individuals report to the Board and serve as the liaisons between the cities and the utilities supporting the program.
The program manager performs the on-site audits to support the application for project incentive and financing. Additionally, the program manager supports the businesses while efficiency projects are evaluated.
13.2.2 Program Logic Model and Implementation Theory
Figure 13-1 presents the logic model for Ventura County Partnerships. As the logic model shows, the partnership’s primary activities include organization and provision of education and training, general awareness campaigns and community events. These three activities are to result in seven outputs: (1) marketing campaigns, (2) newsletter, (3) workshops and trainings, (4) recycling and Earth Day events, (5) energy-efficiency expo and best practices events, (6) multi-family lighting days, and (7) business expos and conferences.

13. Ventura County Partnership Program. . .
13-3
Final Summary Report: Process Evaluation of the 2006–2008 Local Government and Institutional Partnership Programs. 1/2/09
Figure 13-1 Ventura County Logic Model
13.3 KEY FINDINGS
The program has exceeded its non-resource goals, even amidst the delay in program progress due to contract issues.
As this is a non-resource program, there are no savings goals; however, the program, through services it offers, projected it would influence savings. The annual goals revolve around the variety of non-resource activities provided through the program such as general awareness campaigns, education activities, and community events.
• General awareness campaigns include quarterly newsletters, press advertisements, and a marketing campaign that includes flyers, bill inserts, and posters.
• Education and training classes/workshops provides education to the public, business, and residential sectors. Residential workshop topics include Remodeling

13. Ventura County Partnership Program. . .
13-4
Final Summary Report: Process Evaluation of the 2006–2008 Local Government and Institutional Partnership Programs. 1/2/09
for Energy Efficiency and Energy Efficiency in Your Home. Commercial workshop titles include Energy Efficiency for the Home for Real Estate Agents, Solar Briefing, and Making Non-profit Businesses Energy Efficient.
• Community events include recycling and clean-up events, Earth Day events, VCREA business conferences, and Ventura Chamber of Commerce business expositions.
The partnership was slow to gain momentum due to the lag time required to develop and sign the partnering Contract with the utilities. That lag pushed the initiation of the program by six months.
However, after finalizing all contracting agreements, the partnership made significant strides to fulfill all marketing goals set for them for the initial year. According to the Quarterly Report Narrative from First Quarter 2008, the program is exceeding expectations. It is ahead of its three-year goals and ahead of schedule.
The program also believes it influences savings through its designation of an “energy champion.” The partners report that a main objective of the partnership is for the participating cities to create an environment that promotes the responsible use of the energy resources in their county. To do this, the program assigns “energy champions” at the cities. These energy champions work together and with other entities to support state, national, and local energy-efficiency goals for gas usage.
The partnership Program provides a multitude of education and training opportunities for its participants, concentrating on nonresidential sectors. The partnership also disseminates information through community events and uses a variety of marketing venues to inform the public of the program.
The program provides energy-savings information to all customer sectors through the VCERC. The program also provides recommendations and data to promote changes in behavior and purchasing decisions that promote energy efficiency. While the partnership provides information to residential customers through VCERC, it tends to focus its attention on nonresidential customers. These customers tend to yield the greatest savings opportunities per building.
At the beginning of the program period, VCERC developed a training plan and quarterly schedule. All training and workshop events specifically promote incentives available through the partnership as well as relevant IOU energy-savings programs. Each training event provided information on available programs, how the programs can be implemented, and information on removing the barriers (technical, operational, financial, etc.) to project implementation. Some workshops specifically targeted customers eligible for the incentives program.
Partnership personnel work with appropriate city officials to plan and implement community outreach events. Events include small business hard-to-reach retrofit sweeps and mobile home direct installations.
VCREA markets to potential participants using a variety of marketing tools. Different venues for marketing include web and print notifications, area “blitzes” to deliver

13. Ventura County Partnership Program. . .
13-5
Final Summary Report: Process Evaluation of the 2006–2008 Local Government and Institutional Partnership Programs. 1/2/09
efficiency devices en masse, community events, advertisements on local cable channels, and government representative contacts that are involved with energy efficiency.
The Program offers technical assistance to its customers through audits and project recommendations. The technical assistance results in projects and yields energy savings.
The partnership program collaborates with VCREA to help identify facilities and agencies where cost-effective energy opportunities exist. After energy audits are performed, the program provides incentives and funnels facilities to the SCG core programs where further technical and incentive support can be obtained.
In addition to identifying opportunities, the partnership provides technical support and project management during the project implementation. The partnership also assists clients in locating the proper contractor for project installations, documenting the upgrades, and computing the available incentive from the utility.
Audits are performed by the technical manager for the partnership. The technical manager determines the cost-effectiveness of measures and projects which are calculated using the E3 Calculator provided by Energy and Environmental Economics, Inc.
For general information regarding energy efficiency within a home or building, the individuals can access the partnership website (http://www.vcenergy.org/). This website provides a description of the program, information about future events, and references to SCG’s online energy surveys.
The program emphasized electric measures the first two years of this program cycle. According to interviews with program management and staff, as well as the documentation review, the emphasis for 2008 changed to include gas measures, solidifying the pipeline for funneling to the gas utility core programs along with the electric measures36. The partnership expects to promote programs that will include the following type of measures:
• HVAC and controls
• Retro-commissioning
• Tankless water heaters
• Pre-rinse spray nozzles.
Partners report that all cities and participating groups within Ventura County are involved in the program; however, questions exist about how to engage city and county officials to become even more involved.
36 Source: Quarterly Report Narrative Quarter 3 2007.

13. Ventura County Partnership Program. . .
13-6
Final Summary Report: Process Evaluation of the 2006–2008 Local Government and Institutional Partnership Programs. 1/2/09
VCREA staff believe that all cities within Ventura County, as well as other participating groups (e.g., Ventura Community College District), are engaged in the program, although the level of engagement varies by city. While some cities and facilities within those cities actively seek project opportunities and work with VCREA on a regular basis, other cities do not work directly with VCREA or initiate new projects.
Program staff believe that those cities that are not as engaged are simply not “up to speed” on energy efficiency and the impact of energy efficiency on building energy bills. The theory is that the degree to which cities participate varies depending on the level of understanding the city has regarding energy efficiency. This means that cities with more understanding are more participative.
With this in mind, continuing to improve the awareness and literacy of cities regarding the benefits of energy efficiency should be paramount. Interviews with program partners revealed movement in this direction; less involved cities have expressed a desire to phase in their involvement. For the cities that have not been active participants up to this point, continued education in energy management and efficiency until they are up to speed on the topics will influence their future involvement.
In another effort to engage cities, the program is considering how to encourage city and county officials to attend partnership meetings. Individuals managing energy use for the public agencies tend to be the audience that attends these meetings. And while the county officials are not expected to attend these meetings, they are invited. Increasing city and county officials attendance may further promote the cities to be more involved in the program.
Partnership staff believe that increased incentive budget would benefit the program and move more projects from the planning to implementation stage. The program is considering funding options.
Staff of VCREA, as well as program participants within the municipalities, suggested the funding levels as an area for improvement. Specifically they discussed the rebate money available to participants. The intent was for the partnership to funnel projects to the utility incentive and rebate programs that had funds available, such as On Bill Financing. However, individuals interviewed noted that they could be more successful at influencing project initiation if the incentive funds were more broadly available, which they believed could be done if the utility allocated to the partnership more funds directed to rebates. Additionally, staff believes increased funding would improve the return on investment ratio for the energy-efficiency opportunities, thereby promoting additional opportunities for implementation.
One identified application where a higher level of funding would be beneficial is when participants are short of the investment necessary for the project. For example, the partnership identified opportunities in government buildings that require higher monetary investment than they could support. The provision of additional funding for incentives would push these “borderline” (borderline in terms of the payback needed for the government to move forward with the project, not in terms of overall cost-effectiveness) proposed projects towards implementation.
13. Ventura County Partnership Program. . .
13-7
Final Summary Report: Process Evaluation of the 2006–2008 Local Government and Institutional Partnership Programs. 1/2/09
Another application where higher funding would be useful is for additional technical staff. Interviews reported that staff is overextended, and would benefit from additional personnel.
Staff at the partnership mentioned that there may be other funding sources through the Energy Commission and other organizations. They want to assess funding options beyond the funds being provided via the utilities.
VCREA staff expressed a desire for a means to communicate best practices and lessons learned, similar to a peer-to-peer program approach. VCREA staff also voiced frustration at the delay in communication related to utility offerings and would like coordination to improve.
In order to share experiences, best methods, unique approaches, and enhancements to their program, VCREA staff would like to receive a regular update on other partnership activities. The current Quarterly Report Narratives for the partnership programs are available on the Internet after events take place. Therefore some interviewed VCREA staff felt the material is too outdated for use.
Another suggestion follows a similar approach—a peer-to-peer program component. This would involve partnerships communicating experiences to improve processes and promote greater energy efficiency. Through this type of communication channel, VCREA staff would like to have the opportunity to assess other programs’ successes for consideration in their own program and to have the opportunity to coordinate similar activities with other partnerships.
Additionally, VCREA staff report they struggle to keep up with the changes and new offerings in utility programs. VCREA staff interviewed commented that oftentimes they would “happen on” to new utility initiatives in their daily contact with their clients. They expressed that they would like to receive advance notice of changes and upgrades to the utility core programs.
Community partners satisfaction with the program varied. Dissatisfaction stemmed from issues such as lack of program awareness, unclear understanding of program offerings, and insufficient staffing.
The reviews that the partnership received from the participating communities ranged from the discontented to the very pleased. Those communities who are involved are satisfied with the support the partnership provides and believe VCREA does a good job of leveraging the utility contributions and providing technical support. One interviewee highlighted his great satisfaction with VCREA as “being a one-stop shop for everything environmental and energy. They help me do my job and improve services.”
Partner interviewees suggested various reasons why the partnership may not be operating as well as it could. These items are listed in no particular order.
• Inadequate awareness. Some communities seem not to be aware of the existence of the VCREA. One respondent, promoted to his current post recently, learned about the VCREA only six months ago when his predecessor mentioned it, even though the respondent has been employed with the city nearly five years.

13. Ventura County Partnership Program. . .
13-8
Final Summary Report: Process Evaluation of the 2006–2008 Local Government and Institutional Partnership Programs. 1/2/09
• Partnership offerings. Those customers who are aware of the VCREA but not participating do not have a clear idea of what it offers, what might be of added value and how that might differ from what they would receive by just calling the utility directly. Additionally, it was suggested that organizations such as water conservation districts should be included more effectively.
• Insufficient staffing. As with other partnerships, this VCREA commented that they are staff constrained. Coalition building and outreach are resource and time intensive. VCREA staff reported there are too many people to reach out to and maintain contact with, and not enough time to perform programmatic activities. Staff members should have the time and organizational support to find the right levers to gain wider participation across Ventura County.
• Perception of SCG’s Lack of Involvement. One important point that came out of the interviews with municipalities is that most of them are not aware of SCG’s involvement in the partnership. Those interviewed repeatedly citied SCE as the partner, and indicated that they would like to hear more from SCG.
As another measure of satisfaction, PA asked 10 city partners to rate the partnerships on a scale of 1 to 10, 1 means the partnership is doing most of the implementation work and 10 means the city needs the funding but does most of the work. Respondents ranked the partnership widely. With a “5” being the ideal, true partnership, two respondents ranked the relationship with VCREA a “5” or a ”6” because they believe the working relationship is good, with very open communication.
One respondent ranked the program a “7.” Although he appreciated the VCREA outreach to agricultural and industrial end-users, he felt that his organization held most of the responsibility for programmatic activities.
Only one respondent out of 10 interviewed was thoroughly disappointed with the partnership and had the perception of the partnership failing to deliver on promises made. He felt that the partnership was lacking in its commitment to the stated goals, although provided no specific examples. He also commented that the partnership needs to expand staff in order to help municipalities translate the partnership programs into policies—ordinances, codes, and other city programming. Currently, consultations are only available on a project-by-project basis. This type of assistance is not currently in scope.
Overall, though, most participating respondents said that they have a good relationship with VCREA. They commented that the program staff are accessible, provide good information, and have the required technical competence. “They are always willing to help,” said one respondent.
By addressing the above noted issues appropriately, the partnership should be able to enjoy and leverage effectively what seems like growing awareness and interest in resource conservation and efficiency that already exists in many of the municipalities across Ventura County.

13. Ventura County Partnership Program. . .
13-9
Final Summary Report: Process Evaluation of the 2006–2008 Local Government and Institutional Partnership Programs. 1/2/09
13.4 FINDINGS FROM TELEPHONE SURVEYS
Ventura County Partnership Program provided education opportunities to residential and commercial customers via workshops. Residential workshop topics include Remodeling for Energy Efficiency and Energy Efficiency in Your Home. Commercial workshop titles include Energy Efficiency for the Home for Real Estate Agents, Solar Briefing, and Making Non-profit Businesses Energy Efficient.
SCG provided workshop participant data in PDF format, which was data-entered and became the sample source. The data provided did not represent all program-related participant information, and only ten residential sample points were provided. Therefore, while six of these individuals were contacted and interviewed, their responses should be viewed as qualitative.
Interviewers also spoke with 76 commercial participants. Their responses are included quantitatively below.
a. RESIDENTIAL PARTICIPANT EXPERIENCES
Residential customers surveyed that attended the workshop said they attended the event primarily to learn how to save energy. All participants said the workshop was somewhat useful or very useful in helping them to understand how they can save energy in their home. This may be because they believe the workshop provided specific things they can do to save energy; all but one respondent said the workshop did this. Additionally, all respondents said they received brochures and written materials as part of their participation and that these materials were either somewhat or very useful.
Overall, respondents were satisfied with their workshop experience. On a scale of 1 to 5, where 1 is not at all satisfied and 5 is extremely satisfied, the average rating for the six respondents was 4.2. No respondent rated their satisfaction a 1 or 2.
b. COMMERCIAL PARTICIPANT EXPERIENCES
Commercial customers that attended workshops offered by Ventura County Partnership did so for a variety of reasons, such as they wanted to learn how to save energy and save money. In addition to these reasons, customers also said they wanted to learn about new energy efficient technologies as well as understand “green” building issues. The workshops play into these latter customers’ goals with workshops such as Energy Efficiency and Climate Change Issues for Land Use Planners and Solar Briefing.

13. Ventura County Partnership Program. . .
13-10
Final Summary Report: Process Evaluation of the 2006–2008 Local Government and Institutional Partnership Programs. 1/2/09
Table 13-1 Ventura County Commercial Participants Reason for Participation (n=76)
Reason for Participation Percent
Learn how to save energy 50%
Learn how to save money 15%
Learn how to install energy efficient measures 12%
Learn about new energy efficient technology 32%
Learn how to be more environmental friendly 7%
To understand 'green' building issues 13%
Other 43%
Customers most notably felt the workshops were useful in helping them learn ways to save energy with two thirds noting the workshop was very useful and nearly a third noting the workshop was somewhat useful. Only two percent said the workshops were not at all useful (Figure 13-2).
Figure 13-2 Usefulness of Workshop in Understanding Ways to Save Energy (n=76)
Very useful 66%
Not at all useful
2%Somewhat
useful 32%
In addition, over half of respondents (58 percent) said they used the information they received from the workshops to make changes in their organization. These respondents provided the changes they made, such as purchasing and installing efficient equipment (36 percent) and reviewing their facility’s energy use (19 percent). Other changes made as a result of what they learned about in the workshops included providing internal staff or clients with information about green building practices, making system design changes, and seeking out rebate programs for efficiency upgrades.
As a follow-up question, commercial respondents that said they made any changes were asked how the workshop influenced them to make those changes. They were asked to rate the workshop’s influence on a 1 to 10 scale, where 1 is not at all influential and 10 is

13. Ventura County Partnership Program. . .
13-11
Final Summary Report: Process Evaluation of the 2006–2008 Local Government and Institutional Partnership Programs. 1/2/09
very influential. Respondents generally felt the workshops influenced their decisions and rated the level of influence an average of 7.4 on the 10-point scale.
To support respondents’ claim of usefulness of the workshop, nearly seventy percent of all respondents interviewed said, in the future, they plan to use information or concepts provided in the workshop. Examples of what they plan to do include making their building more efficient, such as by installing efficient lighting; incorporating the information into city plans and regulations; and implementing green building projects.
“We plan to apply for one of the ENERGY STAR certification programs.”
“Follow up with the city planning department to encourage them to come up with a resolution for green building in the city.”
Respondents also noted that they now have resources they can go to as a result of what they learned about in the workshop.
“As we go forward with future projects, we have some resources to call upon to have people help us move forward.”
“…we now have a better understanding of the rebates available..”
Figure 13-3 further exemplifies the benefits provided by Ventura County Partnership participants. While the benefits of learning how to save energy and saving money on energy bills are positive, what is particularly powerful in this figure’s message is that a quarter of respondents said they felt one benefit was that they could share information with others. This filtering of information to others will not only draw others into the program, but will also provide a ripple effect of increasing the opportunities for energy efficiency.
Figure 13-3 Benefits from Participating in Workshop (n=70)
47%
26% 21%14%
3%
49%
0%
20%
40%
60%
80%
100%
Learned how tosave energy
Shared learnedinfo with others
Saved moneyon energy bills
Saved energy Installed moremeasures
Other
Benefits from Workshop
Per
cent

13. Ventura County Partnership Program. . .
13-12
Final Summary Report: Process Evaluation of the 2006–2008 Local Government and Institutional Partnership Programs. 1/2/09
Other benefits for participating in the workshop include becoming more educated, learning alternative energy sources, keeping up-to-date with programs, gaining knowledge on energy efficient equipment, and becoming more connected with nonprofits.
13.5 CONCLUSIONS AND OPPORTUNITIES FOR IMPROVEMENT
The partnership offers non-resource opportunities to its participants, and supports resource activities through audits and referrals into other programs such as SCG’s core programs. The program reports they have exceeded their targets for the partnership.
The program received mixed reviews from partner cities on their satisfaction with the program. Interviews revealed various opportunities for improvement, one of which was to better engage more cities. There is variation in city engagement, which also leads to a variation in satisfaction. However, with reported limited funding and overextended staff, this is not always an easy activity.
The recommendations for changes from respondents varied widely. One suggested change was to expand VCREA staff in order to focus on specific areas, deepen technical expertise, and broaden the organization’s impact in the market. In addition to this recommendation, interviewees suggested a number of other opportunities for the program.
• Provide support for staff and trainings as necessary. Although those who have benefited from the partnership praised their working relationship with VCREA—their willingness to help and their technical knowledge—there are more hurdles that need to be addressed before this partnership achieves its full potential. The VCREA needs more staff not only to specialize technically, but to improve their outreach and follow-up with potential partners, while increasing local awareness. This expanded staff might also require some training (formal or informal) to boost their coalition building and institutional strengthening skills and to improve partner selection.
• Modify and expand outreach. The presentation that VCREA gives as part of its outreach seems to require modification so that it demonstrates the flexibility of the partnership program (to address a given municipality’s needs) and shows the impact (i.e., energy savings) of both the education and outreach and direct install components. This modification would help to better show the value of participating. With expanded outreach assistance and expertise, VCREA could also help participating municipalities leverage opportunities to discuss and disseminate the energy-efficiency message. Finally, SCG should be more visibly involved in this program.
• Improve feedback and communication loops. The topic of feedback was raised by many involved in the evaluation interviews. Program staff mentioned the need for more interaction with utility staff regarding the latest initiatives being implemented within the regional reach of this partnership. On several occasions, partnership staff found that new utility programs implemented in the area could have been linked to the marketing outreach for this partnership. In addition, at times the utilities engaged in neighborhood “blitzes” of program offerings unbeknownst to VCREA staff. Since the partnership is sometimes called upon to serve as an adjunct utility regional representative, it must field questions regarding these

13. Ventura County Partnership Program. . .
13-13
Final Summary Report: Process Evaluation of the 2006–2008 Local Government and Institutional Partnership Programs. 1/2/09
blitzes. Having information prior to the utility activity would empower this partnership to provide additional information to their clients on efficiency opportunities.
• Develop a functional database for partnership use. This partnership tracks the customers who are funneled into the utility core programs, but does so in a rather laborious manner that might be inconsistent in format from project to project. Having a utility-developed or approved database structure would ensure that all needed information for evaluation would be available and consistently documented. Also because of the method of record keeping (on paper and in MS Excel format) by the partnership, data requests by the utilities requires more staff time than necessary. It is suggested that future data collection be based upon a method/format which can be summarized or produced through the analyses of common-formatted data (common between the partnerships). The utilities can recommend the best format for the partnership to utilize and to facilitate future data collection.
• Relay information on implementation and results of funneling. This partnership is not provided with data regarding measure implementation after funneling SCG’s core programs. Data on the work completed as a result of the referral should be summarized and provided back to the partnership for their own records and to identify areas for improvement or for greater emphasis in their marketing. This would also give the partnership a view of how their activity plays within the utility planning and goal setting.

14-1
Final Summary Report: Process Evaluation of the 2006–2008 Local Government and Institutional Partnership Programs. 1/2/09
14. PORTFOLIO-LEVEL CONCLUSIONS AND RECOMMENDATIONS
Each chapter provides key findings, conclusions, and recommendation for the programs reviewed in this evaluation. This chapter brings the report full-circle and provides conclusions and recommendations at the portfolio-level.
14.1 CONCLUSIONS
Achievement of goals. At a portfolio-level, the partnership programs appears it will fall short in terms of the therms goals established for the 2006–2008 program cycle. However, this is difficult to say with certainty as a number of partnerships (e.g., CDCR) say they have committed projects that will bring them up to their targets that are not accounted for in EEGA.
Non-resource programs claim to have not only met, but exceeded their targets. However, they would also like a sense of how their work has helped SCG make progress toward utility resource goals by reporting the outcome of funneling activities.
Long-term capacity building. The potential for longer-term savings varies by program type. To varying degrees, the statewide partnerships provide training associated with energy retrofits and MBCx and are working to impact campus/organizational purchasing policies and building practices. Some partner facilities have made greater commitments in these areas than others and those that do credit this more active pursuit of energy efficiency to their partnership participation.
Local government programs. The most successful partnerships are those in which all partners are fully engaged in the program. The term “engaged” is used to indicate both buy-in to the partnership concept and commitment to making its implementation work. Programs where partners expressed the greatest level of satisfaction also were those programs that collaborated well together and built upon each others’ strengths.
Statewide programs. The statewide partnerships work well in terms of policy development and collaboration between partners and utilities. There are significant differences in how some of these partnerships are implemented at the utility level, but partners are quite complimentary about SCG’s implementation efforts.
Unrealized value. SCG staff and partners maintain that there are many important things that these programs do—helping local government decision makers move toward acting on projects, providing expertise to facilitate projects that otherwise would not happen, reaching customers who would not otherwise participate in core programs (hard-to-reach segments), and building public awareness. Excepting the statewide partnerships, most partners are concerned (as are many SCG staff) that the partnerships will not be given adequate credit for the role they play in stimulating energy saving behaviors and installation of measures beyond those that are easily counted. The concern is that, in the absence of a way to measure indirect program impacts, such as those that show up in the core DSM programs, partnership value to the overall efficiency portfolio will be underrepresented. At the same time, the utilities and most partners understand that the accurate measurement and verification of the statewide programs comes first in terms of CPUC reimbursement of costs and incentives for the utilities.

14. Portfolio-level Conclusions and Recommendations. . .
14-2
Final Summary Report: Process Evaluation of the 2006–2008 Local Government and Institutional Partnership Programs. 1/2/09
Staffing resources. Staffing is an important issue on the local government level, particularly because partnership funds are not designed to fund staff in perpetuity. Local government staffs tend to have limited time to dedicate to partnership work, yet it is important that the partnership has adequate staff resources—at whatever level—to ensure the necessary work is accomplished to support the partnership’s initiatives.
For SCG’s successful local government partnership programs, this means at least one dedicated local government staff person—or champion—as well as others throughout the local government who participate on some level. The local government itself must be present at the table to bring in their unique ideas and resources to make the partnership work.
Clarity of focus. The partnership program model has two main dimensions: it is a resource acquisition vehicle and it is a community outreach and engagement tool. The challenge is that the partnership program model assumes local governments have significant roles to play in delivering direct and indirect kWh, kW, and therms energy savings—roles that are important but necessarily vary with each partnership based on the capacity and capabilities brought to the endeavor. This challenge is addressed in the program design documents, written commitments and contractual documents that articulate the responsibilities of the external partners that they must fulfill in exchange for the Public Goods Charge (PGC) funding provided.
PA’s evaluation effort examined the extent to which SCG’s external partners (1) fully understand and accept this obligation, (2) have the capacity (resources) and capability (skills) to fulfill this role, and (3) feel a direct obligation to fulfill the energy-savings commitments. Not surprisingly, the partners that are most fully engaged are those that meet all three of the above criteria. Every partnership that is not performing as well fails to meet at least one of these criteria.
Balancing resource and non-resource objectives. One potential risk associated with partnership programs is the dual-nature of resource and non-resource activities. Because the partnership program portfolio aims at delivering near term energy savings as well as building capacity and capabilities necessary for long-term energy savings, it may be more appropriate to articulate a partnership’s goals in terms of both near-term or immediate resource goals and long-term resource goals.
There is a tension that has existed in the partnership programs portfolio between delivering the energy-savings commitments related to the PGC incentive mechanism (achieving the metrics), building local government capacity to deliver services over the long run, and providing the non-resource elements detailed in the program design. Programs are a reflection of the goals that are set for them. If partnership goals are articulated as annual energy savings, then the programs as designed will focus on obtaining energy savings.
In order to obtain critically needed resources for the State, the focus on obtaining energy savings is appropriate. However, with that kind of focus, much of the capacity and capability building for which the partnership program concept is so well suited could be marginalized. To balance the two objectives, partnership goals need to ensure that longer-term savings—as well as near term energy-savings targets—are realized and that progress toward reaching both goals is measurable.

14. Portfolio-level Conclusions and Recommendations. . .
14-3
Final Summary Report: Process Evaluation of the 2006–2008 Local Government and Institutional Partnership Programs. 1/2/09
Recording non-resource activities. The CPUC has recognized the potential value of non-resource activities by focusing attention on these partnership elements in the impact evaluation that was launched during the time of this study. Although regulatory documents point to the need for the IOUs to maintain information to allow for their evaluation, few of the IOUs, including SCG, maintain such data (e.g., contact information for participants in non-resource activities). The CPUC’s decision to place more emphasis on indirect impacts and non-resource program elements than originally intended for the 2006–2008 program cycle has placed significant additional pressure on SCG program managers to document these activities and create databases for evaluation purposes.
Length of programs and program maturity. The process evaluation indicates that the local government and institutional partnership concept has gained momentum from its first program cycle. Those programs that started under the earlier program cycle reached a level of maturity under the 2006–2008 cycle that allowed for more progress to be made. It is clear that both the IOUs and the CPUC underestimated the amount of time it takes to set up partnerships with their complex relationships, multi-party contractual documents, and range of services. Several of the partnerships did not begin until the second year of the 2006–2008 program cycle due to these contractual issues.
While most of those interviewed for this evaluation believe the partnership programs will lead to increased local government capacity to implement energy-efficiency actions and measures, there was discussion that a three-year program cycle is insufficient time in which to achieve the results these programs can ultimately produce. The need for a longer program cycle becomes obvious when comparing those programs that began during the 2004–2005 cycle with those that started in 2006. More mature programs like the UC/CSU Partnership are functioning more effectively and delivering greater savings. A longer program cycle might make sense for this type of program.
Program tracking. Program databases are critical tools for reviewing and documenting program progress. Program managers and stakeholders can use databases to identify the populations they are serving, markets that are being underserved, and services that are provided through the programs. Databases are also critical for identifying and tracking energy impacts associated with programs and are a means for optimizing program energy impacts.
Key findings related to the tracking systems include:
• Utilities did not receive clear guidance from the CPUC regarding capturing indirect impacts, so there had been no formal tracking for non-resource programs or components until the issue was raised in mid 2008.
• The level of tracking of programs’ participants vary significantly from exceptionally detailed tracking of all audit, installation, and education offerings, to little or no tracking at all.
• While statewide partnerships are tracked at a central level by implementation contractors, SCG program managers have put their own tracking system in place so that they can maintain a strong project pipeline system.

14. Portfolio-level Conclusions and Recommendations. . .
14-4
Final Summary Report: Process Evaluation of the 2006–2008 Local Government and Institutional Partnership Programs. 1/2/09
• Lack of a tracking system or backlog of entering projects into a tracking system has led to insufficient reporting and potentially under-represents the partnerships’ program progress in the monthly reporting activities.
Accurate and timely recording and tracking of program activities is exceedingly important to the success of programs. The more entities involved “touching” the systems and responsible for reporting their information, the more complicated the tracking process tends to be. This underscores the importance, though, of devoting time early in the program process to develop an effective tracking system and one that is used consistently by program partners.
Communication channels. While the communication between SCG and partners were, for the most part, deemed positive, there were instances when interviews revealed some sort of breakdown in communication between the partner and utility. Communication topics include changes in SCG offerings, SCG activities related to the program (such as blitzes), and any projects and savings resulting from referrals into other SCG’s core programs. One example is the Ventura County Partnership program, where interviews provided examples of instances when utilities (noted generally in interviews) changed program requirements without communicating that change to VCREA. The issue of communication also came up in interviews for the South Bay Partnership program. Continuing to incorporate and practice strong communication practices, incorporating a feedback loop to address areas where the program is working well and results from referred projects, will continue to improve and streamline program performance and partner satisfaction.
Customer segments targeted. In general, the partnerships have been more successful in building awareness and serving commercial customers. This is not surprising given that there are larger energy-savings opportunities with commercial customers who are fewer in number with greater consumption. However, the commercial market has distinct submarkets that are more or less approachable through the local government and institutional partnerships program mechanism. Partnerships may be most able to influence locally owned and operated businesses and much less able to influence large regional and national building owners, manufacturers, retail chains, and housing developers with far away decision-makers. Large regional and national owners are for the most part already aware and scan local settings for incentives that they can obtain.
Residential customers are harder to reach and to gain their participation in energy-efficiency programs as evidenced in the customer survey results. However, there are some SCG partnerships that are doing strong residential program support campaigns that include aggressive outreach using the media, website and brand building, unique offerings to increase referrals and specific targeting based on partners’ knowledge of the residential population and housing stock. Examples include Energy Coalition, South Bay, and Bakersfield-Kern partnerships. To the extent SCG is interested in building more activities directed to residential customers, these partnerships provide a good starting place of best practices.
Incentives and technical assistance. SCG’s partnership portfolio has raised the visibility of energy efficiency. Many of the projects would not have happened without the incentives or technical assistance provided by the partnerships. The visibility provided by the incentives from the partnership may be as important as the actual money.

14. Portfolio-level Conclusions and Recommendations. . .
14-5
Final Summary Report: Process Evaluation of the 2006–2008 Local Government and Institutional Partnership Programs. 1/2/09
14.2 RECOMMENDATIONS
Recognizing the success of the partnership programs on many levels, we offer the following recommendations for SCG to consider for the 2009–2011 program cycle to take advantage of lessons learned and best practices from the 2006–2008 program cycle.
Consider reacting to the variance in sophistication and population among partnership programs by revising funding cycles structure.
It takes many years to build strong partnerships. Programs may need different levels of support given their target population and length of existence. For example, new partnerships that are just getting off the ground may need special care and feeding and more resources to establish themselves. SCG needs to be prepared to work with partnerships to support programs of varying sophistication.
Given this, we recommend the length of the funding cycles be reviewed. Three-year funding cycles for local government and institutional partnerships are too short. We recommend that five- or seven-year funding cycles be considered.
Ensure funding streams do not lapse.
The history of DSM is littered with good programs that have been destroyed because of lapses in funding. Partnership program offerings are particularly sensitive to such lapses. If the decision is to continue funding of partnership programs in three-year cycles, then it is incumbent on the IOUs and the CPUC to make decisions early or to provide bridge funding to prevent lapses.
Streamline the contracting process and begin developing contracts early to attempt to avoid contract-related delays.
The 2006–2008 partnerships have been particularly troubled by the amount of time required to get contracts into place, which have delayed program progress for some programs. Although evaluators recognize that there are issues that are out of the utility or partner control, establishing contract guidelines would be useful and hopefully enable the partnerships to begin work more promptly:
• Start the process early
• Assign sufficient staff to et contract in place quickly
• Develop model contracts to streamline the process
• Limit negotiations to a few weeks, if possible
Review the need for resources by program, taking into consideration the individual needs of the programs.
A recurring theme through all of the programs is the need for more resources. At the present time, allocations are primarily based on the benefit cost ratios for the direct delivery of energy efficient measures. We recognize that the CPUC and the IOUs have a

14. Portfolio-level Conclusions and Recommendations. . .
14-6
Final Summary Report: Process Evaluation of the 2006–2008 Local Government and Institutional Partnership Programs. 1/2/09
fiduciary responsibility to optimize the energy-savings benefits across programs and that funding sources are not endless.
Programs where the partners or target populations themselves are resource constrained may be a target for additional level of funding. One example is CCC where the utility already exhibited a need to be of more assistance than planned due to the limited availability of facility managers.
Along that line, newer programs also may have greater needs than established programs. These emerging partnerships may especially need more resources to establish themselves.
Along with additional funding, local government and institutional partners must recognize that while additional resources might allow them to gather substantial additional savings, the benefit cost ratio for those savings may not be optimal in comparison to other programs.
At least in the case of local government and institutional partnerships, we recommend that the method of allocations needs to be reconsidered in the next round of funding. The Affinity Model may be a good start at addressing proper resource allocation to the partnerships, supporting a mix of resource and non-resource activities. SCG may want to consider integrating a tiered and segmented system for allocating resources into the Affinity Model.
For example, emerging programs could be allowed to divide their programs into resource and non-resource segments. Resource segments would be subject to the same benefit cost criteria as other programs. In the short term, non-resource segments would be allowed to demonstrate that they have met stated goals for particular outcomes. Alternatively, they could be allowed to demonstrate benefit cost ratios of more than one, although this goal tends to be difficult to achieve in pure non-resource programs as it takes great care, diligence, and program records to measure indirect impacts. Energy Coalition is one example of a partnership program that divided the program into such segments.
Provide ongoing support for technical assistance.
Some partners, being time and staff constrained, believed their lack of technical expertise was a barrier to moving forward. Partners noted that having outside administrative and technical support was important to being most effective. Other large projects can distract staff and detract from the ability to engage with their partnership (e.g., a large influx of construction funding for campuses and schools). This issue was most prevalently noted with the statewide partnerships such as UC/CSU and CCC.
Within that context, we recommend that the IOUs create a pool of technical talent that local government and institutional partnerships can draw upon to support their programs. Local government programs could use a project management model in which the local government partner identifies and then appropriates that needed skills and capabilities from the pool.
14. Portfolio-level Conclusions and Recommendations. . .
14-7
Final Summary Report: Process Evaluation of the 2006–2008 Local Government and Institutional Partnership Programs. 1/2/09
Communicate regularly and provide consistent and timely feedback.
As identified above in the study’s conclusions, effective communication and interaction are keys to the success of the partnerships. The profession, social, and networking abilities of the partnership liaisons are critical to the interactions of the partnerships. Partners’ interactions with the utilities and other partner organizations received mixed reviews but were mostly positive. Where the interactions were good, the role of the utility and other organizations tended to be viewed as positive. Where the interactions were minimal, there was little perceived value to partnership involvement or the partner role tended to be viewed as negative or adversarial.
An emergent theme across all of the partnership programs was the need for consistent, frequent, and timely feedback and communication. Partners were particularly interested in knowing how they were doing and what others were doing. However, improved feedback requires better tracking systems as identified below.
First, we recommend periodic teleconferences and perhaps an annual gathering be held in order for partnerships to exchange information. Evaluation efforts found that many programs did this, some incorporating this change mid-cycle to the satisfaction of the partners. As the new cycle ramps us, and even as programs are progressing smoothly, regular communication should be maintained.
Additionally, evaluators need to be more proactive and timely in conducting surveys. More tracking is needed especially of those things that form the basis for longer-term savings. Surveys for educational and training activities would be especially useful but should be focused on resulting behaviors.
Last, particularly for multi-utility partnerships, feedback needs to be streamlined so that each utility can have immediate feedback about activities and the commitments by customers. The logistics to integrating participant data can be challenging, but having a central source of information available to all participating utilities would facilitate this feedback process.
Follow procedures set by LA County Partnership as an example of best practices for increasing energy efficiency in public buildings.
Many communities have efforts focused on increasing the efficiency of their public buildings. The LA County Partnerships represents a particularly good model for this. Best practices to be gleaned from this partnership are:
• Retro-commission buildings after they are screened, contracting the service to a vendor. Connect the building to the EMS (if not already available) after the buildings are retro-commissioned.
• Use the vendor to train and provide a training manual to facility. The vendor provides a training manual for facility staff.
While this system is particularly well suited to larger buildings, it can be adapted to work with small buildings as well. We strongly recommend that partnerships be challenged and incentivized to create such systems.

14. Portfolio-level Conclusions and Recommendations. . .
14-8
Final Summary Report: Process Evaluation of the 2006–2008 Local Government and Institutional Partnership Programs. 1/2/09
Develop a tracking system that is usable and accessible between utilities for multi-utility programs and between partners and utilities.
The lack or difficulty of data tracking was an opportunity for improvement raised across several of the partnerships. Such a tracking system would allow the programs to report progress more accurately and timely. Additionally, it would provide additional support to attempt to assess impacts related to non-resource activities. Collecting data to support the review of indirect impacts resulting from non-resource activities is not done consistently across partnerships and may support the ability to evaluate these indirect impacts.
The IOUs and their local government and institutional partners need to develop universal and simple tracking systems for the partnership programs. The tracking system should have the capability of capturing a variety of program-specific data. These tracking systems, at minimum, need to be able to track:
• Non-resource information (e.g., workshop/event name, items received per participation, outreach activities, etc.)
• Resource information (e.g., measures received, method for distribution such as direct install or direct delivery, equipment replaced, savings assumptions)
• Audit results and recommendations
• Referrals to SCG’s core programs generated from partnership activities
• Data to support both program and evaluation needs, including contact information, baseline equipment, savings data, etc.
• Utility/utilities related to the participant
The systems need to be flexible with simple interfaces that will allow field use with participants at training and events.

A-1
Final Summary Report: Process Evaluation of the 2006–2008 Local Government and Institutional Partnership Programs. 1/2/09
APPENDIX A: IN-DEPTH INTERVIEW PROTOCOLS
A.1 COLLEGE/UNIVERSITY FACILITY MANAGERS INTERVIEW GUIDE (UC/CSU, CCC)
My name is from PA Consulting Group. Our company is under contract with the California utilities to evaluation their Partnership Programs with the UC/CSU and Community College systems. I am calling to speak to you about your campus’ involvement in the [name of] Partnership. I understand you are the key individual on this campus who has been involved with the program. Is that correct? I’d like to talk with you about a few topics related to this program and your campus’ involvement. Is this a good time? If not, can you suggest a more convenient time? _______. Your input to this study is very important to our clients, and your answers will be held in strict confidence. You responses will not be shared with either the UC/CSU/CCC main offices or the utilities but will rather be summarized in a report along with the responses of other facility managers.
LAST RESORT: If you prefer I can email you the questions and ask that you write in your responses.
My questions relate to the [name of] Partnership Program
Participation
• Are you familiar with this program? Y/N ?
• If yes, what services/aspects of this Partnership Program have you used and which ones have you found most useful?
• If participating, what is your primary motivation? What are your expectations for the program?
• If not familiar with the program, do you use outside services/contractors to assist you in your facilities management? Do you have unmet needs (capital constraints, training/education, difficulty reducing energy costs)?
• If familiar but not participating, why not? What are the barriers to engagement?
Program Goals
• If participating, does the program as currently structured serve your biggest needs? What needs are not being met?
• How could the program better serve you? What existing barriers do you see to the program achieving its energy-savings goals? What are some ways to overcome those barriers?
Program Delivery
• Have the outreach and support materials met your needs and been easy to use?

A:. In-Depth Interview Protocols. . .
A-2
Final Summary Report: Process Evaluation of the 2006–2008 Local Government and Institutional Partnership Programs. 1/2/09
• Describe how you interact with program staff (UC/CSU/CCC head offices, NAM, utility).
• How well do you think the program delivery process works? Has the program encouraged actual changes in behavior on your campus? How do you know? Probe to see what changes, if any, have taken place in purchasing and approval processes.
• What specific measures or actions result in energy savings and how are those savings tracked?
• How could the delivery process be improved?
• Is information management adequate (i.e. do you have access to the information and knowledge transfer/training that you need)?
• These Partnership Programs were set up to tap into skills and resources of both parties, in this case the [UC/CSU/CCC system] as one partner and the utility(ies) as the other partners. On scale of 1 to 10 where 5 is a true partnership where each party brings resources to the table, 1 means you have no capacity and need the utility to do it all, and 10 means you need the funding but want to or can do most of the work yourself , where does this partnership fall?
Implementation and Response
• Internal capacity building—what was pre-engagement capability vs. your current capabilities? Has the partnership improved your campus’ capabilities? If so, how?
• Have you received any funding through the partnership? On what are these funds spent? (general categories and percentages)
• Staff/labor
• Education/training
• Measures (retrofits, retro-commissioning, monitoring-based commissioning, new construction)
• Other (specify _____________)
• How is the communication between you and the utility? You and the [Chancellor’s Office/Office o the President]? Do you have recommendations on how to improve/optimize it?
Utility Involvement (Differentiate as much as possible to get feedback on specific IOUs)
• How much do you feel the utilities’ presence in the partnership activities?
• How did you feel about SCE/SDGE/PGE and The Gas Co before your experience with this partnership? How do you feel about them now?
• How well do you feel the utility is doing its job in the partnership? Any problems?
• Have your expectations for this partnership been met? How and how not? What would you change?

A:. In-Depth Interview Protocols. . .
A-3
Final Summary Report: Process Evaluation of the 2006–2008 Local Government and Institutional Partnership Programs. 1/2/09
• How likely would you be in the future to engage the utility directly to pursue these types of services?
Metrics
• What metrics would you use to measure this program’s success? Have these metrics been defined for you, and if so, how clearly have then been articulated?
• What do you think needs to be done to increase UC/CSU/CCC campus participation in the program?
• Do the program incentives address your (the facility manager’s) needs effectively?
• What energy or demand reduction benefits have you seen as a result of this program? (direct attribution— percent of savings)
• How do you know? Are these benefits tracked? How so?
• What percent of these demand reductions would have been implemented in the absence of this partnership?
Conclusion
• What is working well (top 3)?
• What is needs improvement (top 3 concerns)?

A:. In-Depth Interview Protocols. . .
A-4
Final Summary Report: Process Evaluation of the 2006–2008 Local Government and Institutional Partnership Programs. 1/2/09
A.2 FACILITY MANAGERS INTERVIEW GUIDE (UC/CSU, CCC, LA COUNTY, BAKERSFIELD-KERN, VENTURA)
My name is from PA Consulting Group. Our company is under contract with the California utilities to evaluation their Partnership Programs. I am calling to speak to you about your city/county/agency’s involvement in the [name of] Partnership. I understand you are the key individual in your organization who has been involved with the program. Is that correct? I’d like to talk with you about a few topics related to this program and your agency’s involvement. Is this a good time? If not, can you suggest a more convenient time? _______. Your input to this study is very important to our clients, and your answers will be held in strict confidence. You responses will not be shared with either the partner organization or the utilities but will rather be summarized in a report along with the responses of other facility managers.
LAST RESORT: If you prefer I can email you the questions and ask that you write in your responses.
My questions relate to the [name of] Partnership Program
Participation
• Are you familiar with this program? Y/N ?
• If yes, what services/aspects of this Partnership Program have you used and which ones have you found most useful?
• If participating, what is your primary motivation? What are your expectations for the program?
• If not familiar with the program, do you use outside services/contractors to assist you in your facilities management? Do you have unmet needs (capital constraints, training/education, difficulty reducing energy costs)?
• If familiar but not participating, why not? What are the barriers to engagement?
Program Goals
• If participating, does the program as currently structured serve your biggest needs? What needs are not being met?
• How could the program better serve you? What existing barriers do you see to the program achieving its energy-savings goals? What are some ways to overcome those barriers?
Program Delivery
• Have the outreach and support materials met your needs and been easy to use?
• Describe how you interact with program staff (Partnership organization/utility).
• How well do you think the program delivery process works? Has the program encouraged actual changes in behavior? How do you know?

A:. In-Depth Interview Protocols. . .
A-5
Final Summary Report: Process Evaluation of the 2006–2008 Local Government and Institutional Partnership Programs. 1/2/09
• What specific measures or actions result in energy savings and how are those savings tracked?
• How could the delivery process be improved?
• Is information management adequate (i.e. do you have access to the information and knowledge transfer/training that you need)?
• On scale of 1 to 10 where 5 is a true partnership where each party brings resources to the table, 1 means you have no capacity and need the utility to do it all, and 10 means you need the funding but want to or do most of the work yourself , where does this partnership fall?
Implementation and Response
• Internal capacity building—what was pre-engagement capability vs. your current capabilities? Did the partnership improve your organization’s capabilities? If so, how?
• Do you receive any funding through the partnership? On what are these funds spent? (general categories and percentages)
• Staff/labor
• Education/training
• Measures (retrofits, retro-commissioning, monitoring-based commissioning, new construction)
• Other (specify _____________)
• How is the communication between you and the utility? You and the partnership organization? Do you have recommendations on how to improve/optimize it?
Utility Involvement
• How much do you feel the utilities presence in the partnership activities versus the presence of the [NGO]?
• How did you feel about SCE/SDGE/PGE and The Gas Co before your experience with this partnership? How do you feel about them now?
• How well do you feel the utility is doing its job in the partnership? Any problems? How about the [partnership organization]?
• Have your expectations for this partnership been met? How and how not? What one thing would you change?
• How likely would you be in the future to engage the utility directly to pursue these types of services? Or do you feel that the existence of the facilitator is important. If so, why?

A:. In-Depth Interview Protocols. . .
A-6
Final Summary Report: Process Evaluation of the 2006–2008 Local Government and Institutional Partnership Programs. 1/2/09
Metrics
• How do you measure success with this Partnership program? Are these metrics clearly articulated to the customers (or to you, as a customer)?
• How would you increase participation among the CCC and UC/CSU
• Do the program incentives address your (the facility manager’s) needs effectively?
• What energy or demand reduction benefits have you seen as a result of this program? (direct attribution— percent of savings)
• How do you know? Are these benefits tracked? How so?
• What percent of these demand reductions would have been implemented in the absence of this partnership?
Conclusion
• What is working well (top 3)?
• What is needs improvement (top 3 concerns)?

A:. In-Depth Interview Protocols. . .
A-7
Final Summary Report: Process Evaluation of the 2006–2008 Local Government and Institutional Partnership Programs. 1/2/09
A.3 PARTNER INTERVIEW GUIDE
1. What is your role in the ___________Partnership Program? How long have you held this position? If less than one year, who is your predecessor?
2. Which utility (IOU) sponsors do you interact with? Which is the lead utility for this partnership? What is your level of interaction with the sponsoring utilities?
3. What implementation contractors do you work with? Are they under contract to your organization or the IOU?
4. What responsibilities does your organization have in return for the funding provided? (Reporting? Delivering savings?)
5. Whose responsibility is it to:
a) collect names and contact info on who is receiving services b) document actions taken, measures installed c) calculate energy savings
6. What resources does the program use and are they adequate?
a. Budgets b. Measures c. Tools for analysis/audit software d. Contractors/vendors
7. Is the program or activity identified as a partnership with the IOU in any way? How prominent would you say the utility is in your marketing of the program or activity? Very, somewhat not much, etc. What is the reason for this strategy? (intentional downplaying of IOU involvement, unintentional, etc.)
8. Are roles and responsibilities among the key parties clear and effective? Why/why not?
9. Whose (or what organization’s) role is the most essential to program success?
Program Goals.
10. What are the objectives of the _____Partnership Program for your organization?

A:. In-Depth Interview Protocols. . .
A-8
Final Summary Report: Process Evaluation of the 2006–2008 Local Government and Institutional Partnership Programs. 1/2/09
11. Did your organization initiate the partnership application? If not, what organization initiated the program?
12. To what extent did your organization already provide EE services prior to participating in the 2006-2008 partnership program:
a. To a large extent—several years of experience providing EE services to constituents
b. To some extent—recent or small amount of EE services to constituents c. None—no prior experience or virtually none in providing EE services to
constituents
13. Why did your organization elect to pursue a partnership with the IOU(s) through this vehicle?
14. Would you be providing these same services to the same degree without the partnership program?
15. I’d like to understand what the respective organizations bring to the partnership. On a scale of 1 to 10, where 10 means that you run the program with minimal utility involvement and 1 means the utility runs the program with minimal involvement from your organization, where would you place this partnership? Why is that?
16. What metrics and/or goals are established by your organization to determine success? Do you have individual performance goals associated with the ________Partnership Program? What are they?
17. What barriers exist that your partnership is trying to overcome?
18. Why are the IOU's conducting partnership programs? Why is the CPUC?
19. Some programs are considered RESOURCE Programs. What does this mean? (Do they consider it their responsibility to deliver energy savings in return for the funding provided?)
20. In what ways is your organization/type of organization better able to influence energy-efficiency actions among the target markets than the IOUs? (will be compared against survey results)

A:. In-Depth Interview Protocols. . .
A-9
Final Summary Report: Process Evaluation of the 2006–2008 Local Government and Institutional Partnership Programs. 1/2/09
Program Delivery
21. Let’s envision a flow chart of this Partnership Program (process mapping activity). Tell me about:
a. intake—ways in which a participant finds out about the services offered (includes marketing and outreach)
b. services delivered c. data recorded and put into a database? d. decision-points in regard to what projects proceed? Are these points of
control exercised by the IOU sponsors versus the implementation contractor?
e. project completion—when is a project considered complete an recorded as such?
22. What do you feel are the weakest points of this process flow? Why is that?
23. How effective are the outreach and marketing activities associated with this partnership?
24. How is your program branded? By this I mean … Is there a NAME or LOGO that is associated with activities promoted by the program that customers would recognize?
25. From the customer’s perspective, do you feel this process works well? What do you think they feel is the weakest point in the process from the customer’s perspective?
26. What hard-to-serve markets are being targeted/reached/not being reached?
27. What level of action is being taken (measures installed on time)? Are you satisfied with the level of action being taken? What barriers are preventing more actions from being taken?
28. Which strategies have been most effective with the following groups (if targeted): a) Low income residents b) Local govt agencies (retrofitting LG buildings) c) Small business d) Non-English language groups e) General residential f) Elderly g) Other hard to reach groups?

A:. In-Depth Interview Protocols. . .
A-10
Final Summary Report: Process Evaluation of the 2006–2008 Local Government and Institutional Partnership Programs. 1/2/09
29. How do you feel the program delivery process could be improved?
Program Administration
30. Are administrative processes between your organization and the IOU sponsor(s) adequate, excessive or inadequate?
31. Is information easily and readily available for you to perform your duties under the program? Why/why not?
32. What are the formal and informal communication procedures between your organization and the IOU sponsor(s)? Do you feel they are adequate? What could be improved?
33. How clear and useful are the systems in place for reporting and budgeting purposes?
34. Partnerships aim to leverage unique qualities of local government for delivering energy-efficiency services. What does your organization bring to the partnership that is unique and could not be delivered by an IOU?
35. What do you think of the effectiveness of this approach of using local governments to implement EE programs? In what ways does it make sense, and in what ways not?
Program Implementation and Customer Response
36. Earlier we talked about participation levels. Are your levels of activity in the program consistent with where you expected to be in relation to goals or plans? How about in terms of numbers of activities completed? (no. of trainings, no. of people trained?) How about in terms of numbers of customers taking EE actions?
37. Beyond the measures and services provided under this partnership, what specific other IOU programs does this program promote or directly recruit customers for, if any? Do you feel the program coordinates adequately with other programs available to the customers? Do you track customers’ participation in these other programs?
38. What do you think about the potential for this partnership program to achieve its targets for the 2006-2008 cycle? Why/why not?
39. What target market groups are you able to reach that others could not? What groups are still underserved?
40. How do you obtain feedback about this program from participants/customers? What formal and informal processes are in place to get feedback?

A:. In-Depth Interview Protocols. . .
A-11
Final Summary Report: Process Evaluation of the 2006–2008 Local Government and Institutional Partnership Programs. 1/2/09
41. What stakeholders are critical to the success of this program?
42. What follow up activities or QC procedures, if any, are performed to check on installed measures or contractors’ work?
Program Issues
43. What are your top 3 issues of concern regarding this program? What ideas can you suggest for resolving these issues?
44. What do you see as your organization’s future with the partnership program in general going forward? How about with the services provided in this partnership specifically?
45. Will you applying to the program for the next cycle? What should change?
46. What, if anything, might affect future activities?
47. Do you feel the IOU(s) devotes adequate resources to provide good services under the partnership? What could they do better?
48. What needs to be done to increase program success in terms of achievement of goals? What of these actions are within your control? Some other group's control? (If the latter, whose?)
49. Will you reapply? With what changes? Any new initiatives?
Evaluation Data
50. We will be surveying _____________________as part of our evaluation of this partnership. What do you feel are the key issues we should address when talking with them? Ask for each.
51. Any other questions or issues you would like to raise regarding the partnership program as part of this process evaluation?

A:. In-Depth Interview Protocols. . .
A-12
Final Summary Report: Process Evaluation of the 2006–2008 Local Government and Institutional Partnership Programs. 1/2/09
A.4 UTILITY PROGRAM MANGERS INTERVIEW GUIDE
Roles and Responsibilities
1. What is your role in working with the Local Government Partnerships (LGP) program? What actions and activities do you perform in support of the program?
2. How many utility staff work on this program and what are their roles? [Get names and contact information.]
3. Does your utility work on any other SDG&E/SOCALGAS programs for this population and if so what percentage of time is spent on LGP?
Program Goals.
4. Do you have specific numerical goals for your utility related to the LG program? (no. of referrals, participants, improved payment behaviors, amount of energy arrearages reduced, etc.?)
5. How many customers did you serve the last year in SDG&E/SOCALGAS’s Local Government Partnerships program?
6. What is the effectiveness of current program features at meeting goals:
a. targeting and recruitment, b. management and administration, c. marketing, information dissemination, educational outreach d. program content in terms of benefits offered
7. Are there any prior and planned changes in Program design and delivery that we should know about?
8. What are the existing barriers to the Program achieving its goals? What are some ways to reduce those barriers?
Program Delivery.
9. How do you (or do you) track customers of yours that are referred to the program?
10. Describe the program delivery process (how you interact with the Partnership management). How well do you think the program delivery process is operating? How could it be improved?
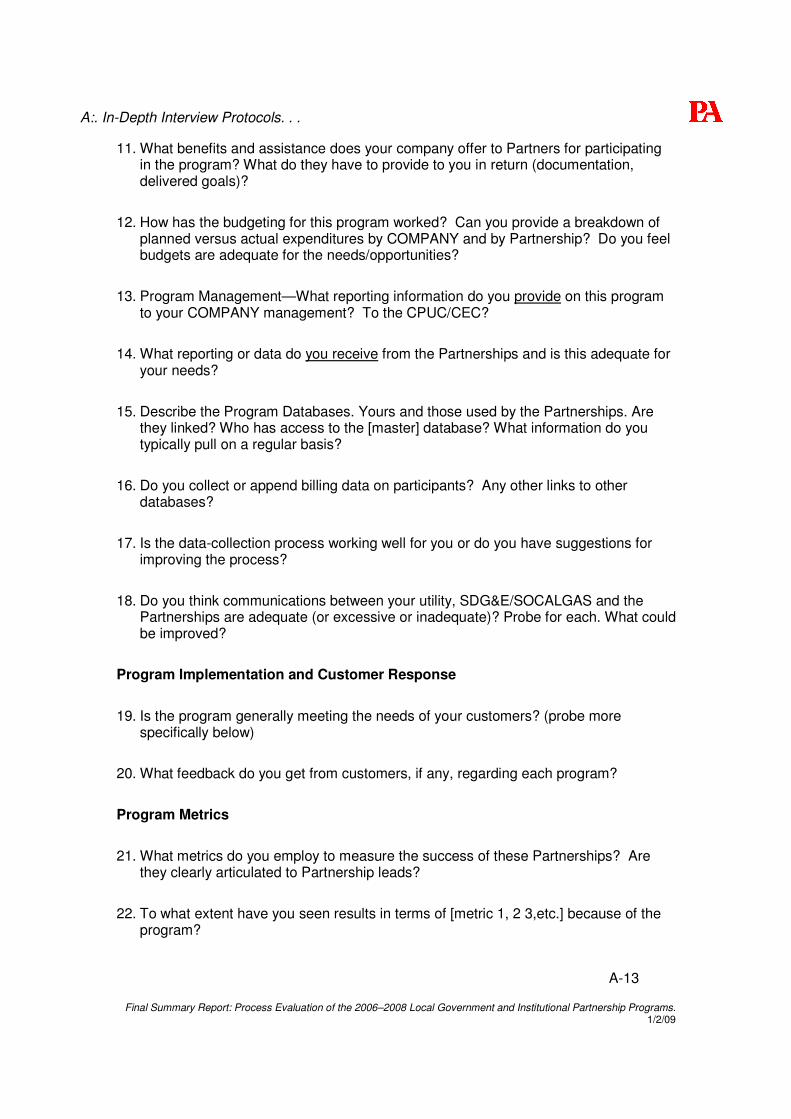
A:. In-Depth Interview Protocols. . .
A-13
Final Summary Report: Process Evaluation of the 2006–2008 Local Government and Institutional Partnership Programs. 1/2/09
11. What benefits and assistance does your company offer to Partners for participating in the program? What do they have to provide to you in return (documentation, delivered goals)?
12. How has the budgeting for this program worked? Can you provide a breakdown of planned versus actual expenditures by COMPANY and by Partnership? Do you feel budgets are adequate for the needs/opportunities?
13. Program Management—What reporting information do you provide on this program to your COMPANY management? To the CPUC/CEC?
14. What reporting or data do you receive from the Partnerships and is this adequate for your needs?
15. Describe the Program Databases. Yours and those used by the Partnerships. Are they linked? Who has access to the [master] database? What information do you typically pull on a regular basis?
16. Do you collect or append billing data on participants? Any other links to other databases?
17. Is the data-collection process working well for you or do you have suggestions for improving the process?
18. Do you think communications between your utility, SDG&E/SOCALGAS and the Partnerships are adequate (or excessive or inadequate)? Probe for each. What could be improved?
Program Implementation and Customer Response
19. Is the program generally meeting the needs of your customers? (probe more specifically below)
20. What feedback do you get from customers, if any, regarding each program?
Program Metrics
21. What metrics do you employ to measure the success of these Partnerships? Are they clearly articulated to Partnership leads?
22. To what extent have you seen results in terms of [metric 1, 2 3,etc.] because of the program?

A:. In-Depth Interview Protocols. . .
A-14
Final Summary Report: Process Evaluation of the 2006–2008 Local Government and Institutional Partnership Programs. 1/2/09
23. How do you link causality? How do you attribute these results to the program?
24. What energy or demand reduction benefits do you observe?
25. Any other benefits that you have seen from the program not addressed so far in this discussion?
26. Do you have any evaluation results from this program or for your customers that have participated in this program that you can share with me?
Program Metrics
27. What is going well?
28. What is not working as well?
29. Biggest issue on your mind today?
30. What specific questions or issues you would like to raise regarding the Local Government Partnerships program as part of this process evaluation?

A:. In-Depth Interview Protocols. . .
A-15
Final Summary Report: Process Evaluation of the 2006–2008 Local Government and Institutional Partnership Programs. 1/2/09
A.5 LOCAL GOVERNMENT REPRESENTATIVE INTERVIEW GUIDE (VENTURA, SOUTH BAY, ENERGY COALITION)
INTERVIEWER NOTE: Whenever the question specifies the utility, noted by [EDISON/THE GAS COMPANY] within the question, ask for each utility where the program is relevant.
NOTE: THIS SURVEY IS ONLY FOR MUNICIPALITIES, NOT FOR VCREA, THE ENERGY COALITION, OR SOUTH BAY. THEY GET A DIFFERENT INTERVIEW PROTOCOL.
Introduction:
My name is [INTERVIEWER NAME] from PA Consulting Group. Our company is under contract with [Edison/The Gas Company—or both] to evaluation their Partnership Programs.
[IF PARTICIPANT OR WAS A PARTICIPANT] I am calling to speak to you about your city/county’s involvement in the [Partnership Program name]. I understand you are the key individual in your organization who has been involved with the program. Is that correct? [IF YES, CONTINUE. IF NOT, GET APPROPRIATE CONTACT AND CALL BACK.]
I’d like to talk with you about a few topics related to this program and your agency’s involvement. Is this a good time? If not, can you suggest a more convenient time?
[IF NOT A PARTICIPANT] I am calling to talk to you about the [Partnership Program Name]. Could I please just ask you a few questions related to your organization and your awareness of the [Partnership Program Name].
[IF NEEDED: Your input to this study is very important to our clients, and your answers will be held in confidence. You responses will not be shared with either the partner organization or the utilities but will rather be summarized in a report along with the responses of other local government representatives.]
[LAST RESORT: If you prefer I can email you the questions and ask that you write in your responses.]
Participation Status:
1. Is your [CITY] an active participant in the [PARTNERSHIP PROGRAM NAME]?
Yes GO TO PARTICIPANT QUESTIONS No GO TO NONPARTICIPANT QUESTIONS

A:. In-Depth Interview Protocols. . .
A-16
Final Summary Report: Process Evaluation of the 2006–2008 Local Government and Institutional Partnership Programs. 1/2/09
Nonparticipant Questions
2. Were you ever an active participant in the [PARTNERSHIP PROGRAM NAME]?
3. A. [IF WERE A PARTNER PREVIOUSLY] How long ago were you a partner? For how long were you participating in the program? Why are you no longer participating? B. What was the primary value of the Partnership services to your local government? To those target groups the program is meant to serve, e.g. facilities managers, small businesses, or residential consumers? C. From your experiences, what could be improved about the partnership? [NOTE: IMPROVEMENTS COULD ALREADY HAVE BEEN MADE SINCE PARTICIPATING]
4. A. [IF NOT PARTICIPATING AND NEVER AN ACTIVE PARTNER] Are you
aware of this partnership program offered by [the Gas Company/Edison/Edison and the Gas Company]? INTERVIEWER—IF NOT AWARE, WILL NEED TO EXPLAIN PARTNERSHIP AND PROGRAM TO THEM. B. Have you ever been approached by [Edison/the Gas Company], or approached [Edison/the Gas Company] to partner on this program? C. [IF YES] Why aren’t you participating? D. Do you have any interest in participating in the partnership with [Edison/the Gas Company]? E. [IF INTERESTED] What interests you about the partnership with [Edison/the Gas Company]? How do you feel the partnership could be beneficial to your organization? To those you service? Why do you think this? F. [IF NOT INTERESTED] Why aren’t you interested in participating? G. What are the barriers to your organization’s involvement in the partnership with [Edison/the Gas Company]? How could these barriers be overcome?
5. In what ways, if any, do you feel local governments differ in their ability to engage people and businesses in energy efficiency than other groups that deliver energy services? What particular strengths does your local government have? What weaknesses or limitations for delivering energy-efficiency services and messages does your local government have?
THANK PARTICIPANT AND END INTERVIEW

A:. In-Depth Interview Protocols. . .
A-17
Final Summary Report: Process Evaluation of the 2006–2008 Local Government and Institutional Partnership Programs. 1/2/09
Participant Questions
5. Why is your local government participating in the program? What are your expectations for the Partnership?
6. Do you have a signed memorandum of understanding, resolution or other formal agreement governing your participation? Yes/No
[AND IF THEY DO, WITH WHOM? SOME WILL BE WITH THE UTILITY AND SOME WILL BE WITH OTHER ORGANIZATIONS]
Level of Engagement on Energy Programming (overall):
7. Has this partnership changed the priority of energy efficiency in the allocation of municipal funding?
8. Do you expect that level of funding to increase, decrease or stay the same over the next 3-5 years?
9. Which elements in the set of service [for Energy Coalition] or of the offered set of services [for other partnerships] is your local government engaged in promoting? (Reference the specific partnership program’s services inquire about awareness of each item and whether they are utilizing each one.) 1. Community Workshops 2. Training 3. Assessments of local government facilities 4. Outreach to residential consumers 5. Outreach to businesses 6. Promotion of [Edison or the Gas Company] programs 7. Distribution of energy-efficiency measures (CFLs, low flow showerheads,
faucet aerators, etc.) 8. Other activities
10. How did you prioritize or select the elements of the set of services you are emphasizing?
11. Of these, which are most successful and why do you think that is so? Which have been least successful? Are there portions of the Partnership or [other] services and utility programs you have not taken advantage of? What ones? What is the reason why you have not taken advantage of other portions of the Partnership or [other] services and utility programs?
Internal capacity:
12. How many people in your agency or department work on this partnership? How many worked on energy efficiency prior to the program’s start?

A:. In-Depth Interview Protocols. . .
A-18
Final Summary Report: Process Evaluation of the 2006–2008 Local Government and Institutional Partnership Programs. 1/2/09
13. How is the funding37 you receive allocated in the following areas. Please provide a percentage, where the sum adds up to 100 percent. [TRY TO GET, AT MINIMUM, THE MAJOR CATEGORIES, THEN PROBE FOR ALLOCATIONS WITHIN MINOR CATEGORIES]
Administrative: a. Staff/labor b. Facility (Energy Center) c. Consultants/Contractors d. Other? [specify_______]
Marketing & Outreach: e. Marketing and outreach events f. Marketing materials, brochures g. Publications
Direct Implementation: h. Training & Education i. Direct install—measures j. Other? [specify_____]
14. What is the level of commitment on the part of the elected officials? Whose participation and commitment is essential from your agency for this partnership to be successful?
15. [IF A LOW LEVEL OF COMMITMENT] Why do you believe there is a low level of commitment? In what ways can this be overcome?
16. How (if at all) has your agency’s participation in this program altered decision making processes regarding energy efficiency in your local government?
Leveraging grassroots participation:
17A. In what ways, if any, do you feel local governments differ in their ability to engage people and businesses in energy efficiency than other groups that deliver energy services? What particular strengths does your local government have? What weaknesses or limitations for delivering energy-efficiency services and messages does your local government have?
17B. How do you use your leverage in engaging and stimulating public agencies, cities or counties to achieve real results in energy efficiency in your program?
37 Note that this is not the funding received by the partnership from the IOU, but rather this is for instances where the local government participants in a regional partnership receive funding from the partner (like CEP, or VRECA).

A:. In-Depth Interview Protocols. . .
A-19
Final Summary Report: Process Evaluation of the 2006–2008 Local Government and Institutional Partnership Programs. 1/2/09
18. Are there ways in which your local government could do more to achieve behavioral changes? If so, what more could be done? (Government policies, procedures, outreach, etc.)
Partnership Quality:
19. On scale of 1 to 10 where 5 is a true partnership where each party brings resources to the table, 1 means you have no capacity and need the utility to do it all, and 10 means you need the funding but want to or do most of the work yourself , where does this partnership fall?
20. Why do you rate it that way?
21. How supportive is your council and/or elected officials of this partnership?
22. How supportive are they regarding the concept of energy efficiency /sustainable communities in general?
23. How difficult was it/is it to get buy-in to these activities from decision makers in your community and public agency?
Results:
24. How effective have these services been for encouraging actual changes in behavior in your community and public agency? E.g., do you think people are making more of an effort to save energy?
25. How effective have these services been for encouraging actual changes in behavior in your local government agency(ies)? How do you know? [PROBE FOR ENERGY EFFICIENCY’S INCLUSION AS PART OF REGULAR BUSINESS PRACTICES]
26. How do you define effectiveness? What does it mean for the program to be effective?
27. What specific measures or actions result in energy savings and how do you track that?
28. What barriers remain that prevent more of the services being used and more in the community from participating?
a. Lack of awareness of opportunity and savings
b. Lack of technical knowledge
c. No skills for implementing projects
d. No knowledge of vendors to do the work
e. Lack of funding, financing

A:. In-Depth Interview Protocols. . .
A-20
Final Summary Report: Process Evaluation of the 2006–2008 Local Government and Institutional Partnership Programs. 1/2/09
f. Motivation—Nothing in it for me
g. Other priorities
Utility Presence/involvement:
29. What is the extent of active involvement of [Edison/the Gas Company] in this partnership? Do you consider this level of involvement adequate, not enough or too much? Why is that?
30. How has your experience in this partnership altered your opinion about [Edison/the Gas Company]? Is your opinion more positive, less positive or about the same as before your experience with this partnership?
31. What issues do you have if any regarding your relationship with [Edison/the Gas Company]?
32. How likely are you to engage directly with [Edison/the Gas Company] in the future to pursue these types of services?
33. Do you feel that the existence of an intermediary organization like [South Bay, Energy Coalition, etc.] is important and if so why? [ONLY ASK FOR SOUTH BAY, VENTURA, ENERGY COALITION, AND SOUTH COAST]
34. In what specific ways does [Organization Name] provide value to making energy efficiency happen in your community or public agency?
Actions/Behavioral Changes:
35. What evidence do you have, if any, of actions taken and behavioral changes as result of the educational and outreach components offered through this partnership?
36. How could one better capture this information?
37. Are there lists of participants or other data we could use to show results?
38. What barriers would need to be overcome in order for you to engage in more of the services offered in this partnership?
Promotion and Activities:
40. Beyond this partnership, what other [Edison/Gas Company] programs are promoted through your portfolio of energy-efficiency activities?
41. To what extent has the partnership increased participation in these programs? Do you have evidence to support this?
42. To what extent have people been made more aware of the opportunities through the partnership?

A:. In-Depth Interview Protocols. . .
A-21
Final Summary Report: Process Evaluation of the 2006–2008 Local Government and Institutional Partnership Programs. 1/2/09
43. Do you believe there is room for additional promotion or outreach that is not being pursued? What would that be?
44. What actions and behavioral changes have taken place due to the program (where they would not have otherwise taken place)? How do you see this?
Direct Attribution:
45. Which of your city’s activities have contributed measurable energy savings? Have these savings been quantified and reported to the utility/CPUC?
46. When you talk about overall impact of your program, what percent of the energy savings referred to in the question above would you directly attribute to the partnership activities?
47. What percent would you have implemented without these services?
Satisfaction and Relationships
48. What is the primary value of the Partnership services to your local government? To those target groups the program is meant to serve?
49. How well do you feel the utility is doing its job in the partnership—any problems? How about the {partnership organization}? Are there any areas that the utility does particularly well? Any areas where you feel there could be some improvement?
50. Have your expectations for this relationship been met? How and how not? What is one thing would you change?
Conclusion:
51. What’s working (top 3)?
52. What are your biggest concerns (top 3) about the program?

B-1
Final Summary Report: Process Evaluation of the 2006–2008 Local Government and Institutional Partnership Programs. 1/2/09
APPENDIX B: SURVEY INSTRUMENTS
B.1 RESIDENTIAL PROGRAM PARTICIPANT TELEPHONE SURVEY Hello, my name is [interviewer name], and I'm calling on behalf of UTILITY OR PROGRAM. May I speak with [named respondent]? 1 Yes 2 No [attempt to convert; if R not available, ask for an adult who makes decisions on how household uses energy] I'm with PA Consulting Group, an independent research firm. We have been hired to evaluate services available to customers of UTILITY OR PROGRAM. I'm not selling anything; I'd just like to ask your opinion about these types of services and whether you’ve taken advantage of them. I’d like to assure you that your responses will be kept confidential and your name will not be revealed to anyone. (Why are you conducting this study: Studies like this help the utility and its partners better understand customers’ awareness of and interest in energy programs and services. (Timing: This survey should take less than 15 minutes of your time. Is this a good time for us to speak with you? IF NOT, SET UP CALL BACK APPOINTMENT OR OFFER TO LET THEM CALL US BACK AT 1-800-454-5070) (Sales concern: I am not selling anything; we would simply like to learn about your awareness of services that could save energy in your home, and your opinions about these services. Your responses will be kept confidential. If you would like to talk with someone about this study, feel free to call [Program contact] (NOTE: For all questions, “don’t know” and “refused” will be coded if offered as a response.) S1. First, do you own or rent your home? 1 Own 2 Rent S2. In which type of building do you live? 1 Single family home 2 Multi-family dwelling (2-4 units) 3 Apartment buildings (5 or more) 4 Other (specify)

B:. Survey Instruments. . .
B-2
Final Summary Report: Process Evaluation of the 2006–2008 Local Government and Institutional Partnership Programs. 1/2/09
S3. Per our records, your zip code is [READ ZIP CODE]. Is this correct? 1 Yes 2 No --� Could you please tell me the correct zip code? S4. From what utility do you buy your electricity? 1 Southern California Edison (SCE) 2 Pacific Gas & Electric (PG&E) 3 Los Angeles Department of Water and Power (LADWP) 4 Sacramento Municipal Utility District (SMUD) 5 Other (record) D Don’t know S5. From what utility do you buy natural gas? 1 Southern California Gas (SCG) 2 Pacific Gas & Electric (PG&E) 3 Other (record) D Don’t know
Thank you. I now have a few questions related to your home and energy use. U1A. Would you say that your home is very energy efficient, somewhat energy efficient
or not very energy efficient? 1 Very energy efficient [SKIP TO U2] 2 Somewhat energy efficient [SKIP TO U2] 3 Not very energy efficient D Don’t know U1B. Why don’t you think your home is very energy efficient [DO NOT READ; INDICATE ALL THAT APPLY] 1 Home is old 2 Home is drafty/does not feel tight 3 Have not done anything to make the home energy efficient 4 Have old, inefficient appliances 5 Household behaviors (i.e., leave lights on) 6 Other (record) 7 Don’t know
ATTITUDES TOWARD AND USE OF ENERGY-EFFICIENCY SERVICES

B:. Survey Instruments. . .
B-3
Final Summary Report: Process Evaluation of the 2006–2008 Local Government and Institutional Partnership Programs. 1/2/09
U2. On a scale of 1 to 5, with 1 being not at all important and 5 being very important, how important is lowering the cost of your energy bills to you? 1 Not at all important 2 3 4 5 Very important D Don’t know U3. How much, on average, are your monthly electric bills? ________ U4. On a scale from 1 to 5 where 1 is not at all active and 5 is very active, how active
would you say your local government is in promoting energy-efficiency messages and helping you to save energy with specific programs?
1 Not at all active 2 3 4 5 Very active D Don’t know U5. Are you aware of any school -based programs that promote energy efficiency? 1 Yes 2 No [SKIP TO NEXT SECTION] D Don’t know [SKIP TO NEXT SECTION] U6 Do you have school aged children that participate in these programs? 1 Yes 2 No [SKIP TO NEXT SECTION] D Don’t know [SKIP TO NEXT SECTION] U7 What is the name of the program? [RECORD RESPONSE] IF NOT A PARTICIPANT IN PROGRAMS [FROM UTILITY SAMPLE] SKIP TO EE1.

B:. Survey Instruments. . .
B-4
Final Summary Report: Process Evaluation of the 2006–2008 Local Government and Institutional Partnership Programs. 1/2/09
EDUCATION/WORKSHOP PROGRAM MODULE
ASK FOR NON-RESOURCE EDUCATION PROGRAMS THAT PROVIDE EDUCATION AND TRAINING OR RESOURCE PROGRAMS THAT OFFER EDUCATION AND TRAINING. OTHERWISE, SKIP TO NEXT SECTION. SE1. Our records indicate you attended a workshop] in [DATE], where they provided
information related to ways to save energy in your home. This may have occurred at a location such as [Provide description based on program]. Do you recall attending a session like this?
1 Yes 2 No [SKIP TO NEXT SECTION] D DK SE2. Who sponsored the session? [DO NOT READ; RECORD ALL THAT APPLY] 1 Southern California Gas 2 Southern California Edison 3 Ventura County Energy Resource Center/Regional Energy Alliance 4 South Bay/South Bay Energy Savings Center 5 Local Government Energy Action Resources (LGEAR) , Mammoth Lakes/Ridgecrest 7 Energy Coalition 8 County/City of Santa Barbara, Goleta and Carpenteria 9 Other [RECORD] SE3 Why did you attend this activity or workshop? [DO NOT READ; RECORD ALL
THAT APPLY] 1 Wanted to learn about ways to save water/energy in my home 2 Wanted to learn about ways to save money on utility bills 3 Heard about it from others 4 Saw it and stopped by 5 Want to protect the environment 6 It’s the right thing to do 7 Want to help out the utility 8 It was sponsored/recommended by local government organization 9 Other [RECORD] 10 Don’t know

B:. Survey Instruments. . .
B-5
Final Summary Report: Process Evaluation of the 2006–2008 Local Government and Institutional Partnership Programs. 1/2/09
SE4. How useful was the event in helping you understand ways to save energy in your home: Not at all useful, somewhat useful, or very useful? 1 Not at all useful 2 Somewhat useful 3 Very useful SE5. Did the event provide you with specific things you can do in your home to save
energy? 1 Yes 2 No [SKIP TO SE7] D Don’t know [SKIP TO SE7] SE6. Since attending the workshop, what energy saving actions have you taken in
your home? [RECORD ALL THAT APPLY] 1 Nothing 2 Lowered water heater temperature 3 Use programmable thermostat or adjust temperature when not at home 4 Installed CFLs 5 Purchased energy efficient appliances 6 Other [RECORD] SE7. As part of this event, did you receive any brochures or written information to take
home with you? 1 Yes 2 No [SKIP TO SE9] D Don’t know [SKIP TO SE9] SE8. How useful did you find this information in helping you understand ways to save
energy in your home? Not at all useful, somewhat useful, or very useful. 1 Not at all useful 2 Somewhat useful 3 Very useful

B:. Survey Instruments. . .
B-6
Final Summary Report: Process Evaluation of the 2006–2008 Local Government and Institutional Partnership Programs. 1/2/09
SE9. Did you receive any other take-aways as part of the event, such as CFLs? [INTERVIEWER, IF NECESSARY: “TAKE-AWAYS ARE ITEMS THE WORKSHOPS MAY HAVE GIVEN AWAY FOR YOU TO USE IN YOUR HOME TO SAVE ENERGY] 1 Yes 2 No [SKIP TO SE13] 3 Don’t know [SKIP TO SE13] SE10. What did you receive? [DO NOT READ; INDICATE ALL THAT APPLY] 1 A kit or box of energy-efficiency tips/equipment 2 CFLs 3 Water aerators 4 Pipe wraps 5 Other [RECORD] SE11. Did you use or install this/any of these items? 1 Yes 2 No [SKIP TO SE13] 3 Don’t know [SKIP TO SE13] SE12. What did you use or install? 1 CFLs 2 Water aerators 3 Pipe wraps 4 Low-flow showerheads 5 Other [RECORD] SE13. What information or activity from this event did you feel was the most useful for
you? [RECORD RESPONSE]

B:. Survey Instruments. . .
B-7
Final Summary Report: Process Evaluation of the 2006–2008 Local Government and Institutional Partnership Programs. 1/2/09
SE14. What benefits, if any, have you or your household received from participating in
this program? [DO NOT READ; INDICATE ALL THAT APPLY] 1 Learned how to change energy using behaviors/learned how to save
energy 2 Able to share what I learned with others 3 Installed more measures on my own 4 Saved energy 5 Saved money on energy bills 6 Make home more comfortable 7 Affect climate change/environmental benefits 8 Other (specify________________) 9 No benefits 10 Don’t know SE15. How satisfied are you with the workshop you attended? Please rate your
satisfaction on a scale from 1 to 5, where 1 is not at all satisfied and 5 is more satisfied.
1 Not at all satisfied 2 3 4 5 Very satisfied D Don’t Know SE16. [IF RATE 3 OR LESS] How could you have been more satisfied with the
workshop? [RECORD RESPONSE]
DIRECT INSTALL MODULE ASK OF PARTICIPANTS THAT RECEIVED ENERGY EFFICIENT MEASURES VIA DIRECT INSTALL, EXCLUDING CFLS (E.G., INTERIOR HARDWIRE LIGHTING, APPLIANCES, ETC.) Ask of each measure direct installed. DI1. Our records indicate someone from [PROGRAM NAME/ORGANIZATION] came
into your home and installed [MEASURE] in [MONTH/YEAR]. Is this correct? 1 Yes 2 No D DK

B:. Survey Instruments. . .
B-8
Final Summary Report: Process Evaluation of the 2006–2008 Local Government and Institutional Partnership Programs. 1/2/09
DI2. [IF NO] What is incorrect? [Probe if necessary with below categories] 1 Do not recall someone coming to home [SKIP TO NEXT SECTION] 2 Measures listed are incorrect �
ASK AND RECORD: WHAT ARE THE CORRECT MEASURES? 3 Date is incorrect 4 Other [RECORD] [SKIP TO NEXT SECTION IF NECESSARY] DI3. How did you hear about the program? [DO NOT READ; RECORD ALL THAT
APPLY] 1 Another program (which program?) 2 Local government partnership activities 3 Water utility bill stuffing 4 Electric/gas utility bill stuffing 5 Water utility mailing 6 Electric/gas utility mailing 7 Community Sweeps 8 Community displays 9 Energy fairs 10 Friends/neighbors/relatives 11 Newspaper article 12 Other [RECORD] DI4. How long was the representative at your home to install the [MEASURE]? _____ hours DI5. What information did you receive from the representative as part of the visit? 1 None 2 How to take care of or use the measure 3 How to save energy in my home (general brochures and discussions) 4 Measures/appliances I should install to save energy in home 5 Ways to improve the draftiness/tightness of home 6 Other [RECORD RESPONSE] D Don’t know

B:. Survey Instruments. . .
B-9
Final Summary Report: Process Evaluation of the 2006–2008 Local Government and Institutional Partnership Programs. 1/2/09
DI6. [IF RECEIVED INFORMATION] How useful was the information you received from the visit? Please rate on a scale from 1 to 5, where 1 is not at all useful and 5 is very useful. 1 Not at all useful 2 3 4 5 Very useful D Don’t Know DI7. [IF DI6<4] How could information have been more useful for you? [RECORD RESPONSE] DI8. Had you planned to install [MEASURE] before the program? 1 Yes 2 No D Don’t know DI9. Without the program, would you have installed [MEASURE] at the time you did? 1 Yes 2 No D Don’t know DI10. Is the measure still installed in your home? 1 Yes 2 No D Don’t know DI11. [IF NO] Why isn’t the measure still installed? [RECORD RESPONSE] DI12. How satisfied are you with this program? Please rate your satisfaction on a scale
from 1 to 5, where 1 is not at all satisfied and 5 is more satisfied. 1 Not at all satisfied 2 3 4 5 Very satisfied D Don’t Know

B:. Survey Instruments. . .
B-10
Final Summary Report: Process Evaluation of the 2006–2008 Local Government and Institutional Partnership Programs. 1/2/09
DI13. [IF RATE 3 OR LESS] How could you have been more satisfied with the program? [RECORD RESPONSE]
DI14. What benefits, if any, have you or your household received from participating in
this program? [DO NOT READ; INDICATE ALL THAT APPLY] 1 Learned how to change energy using behaviors/learned how to save
energy 2 Received energy efficient measures 3 Saved energy 4 Saved water 5 Saved money on energy/water bills 6 Able to share what I learned with others 7 Other (specify________________) 8 No benefits 9 Don’t know
CFLS REBATE/BUY-DOWN/DIRECT INSTALL/GIVE-AWAY MODULE ASK OF PARTICIPANTS WHO REDEEMED BULBS VIA CFL PROMOTION OR AS PART OF A DIRECT INSTALL PROGRAM GIVE-AWAY C1A. [IF RECEIVED BULBS VIA REBATE] Our records indicate you participated in a
program where you redeemed a rebate for CFL bulbs for the value of $X. Is this correct?
1 Yes 2 No [INTERVIEWER: PROBE “Is it the value you disagree with, or do you
now recall participating?”. IF STILL NO, SKIP TO M1] C1B. [IF RECEIVED BULBS VIA DIRECT INSTALL] Our records indicate you
participated in a program where [ADMINISTERING AGENCY] came to your home and installed [X CFL bulbs] Is this correct?
1 Yes 2 No [SKIP TO NEXT SECTION] C1C. [IF RECEIVED BULBS VIA GIVE-AWAY] Our records indicate you received [X
CFL bulbs] as part of participating in [AUDIT/WORKSHOP NAME]. Is this correct?
1 Yes 2 No [SKIP TO NEXT SECTION]
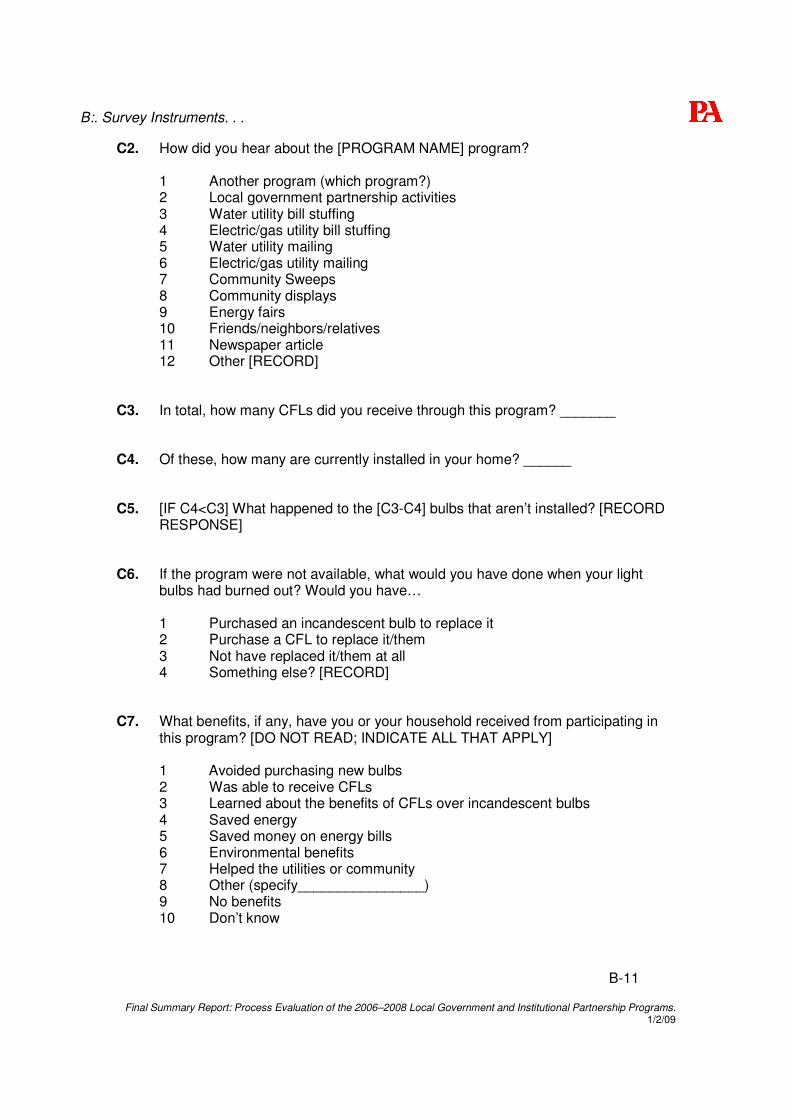
B:. Survey Instruments. . .
B-11
Final Summary Report: Process Evaluation of the 2006–2008 Local Government and Institutional Partnership Programs. 1/2/09
C2. How did you hear about the [PROGRAM NAME] program? 1 Another program (which program?) 2 Local government partnership activities 3 Water utility bill stuffing 4 Electric/gas utility bill stuffing 5 Water utility mailing 6 Electric/gas utility mailing 7 Community Sweeps 8 Community displays 9 Energy fairs 10 Friends/neighbors/relatives 11 Newspaper article 12 Other [RECORD] C3. In total, how many CFLs did you receive through this program? _______ C4. Of these, how many are currently installed in your home? ______ C5. [IF C4<C3] What happened to the [C3-C4] bulbs that aren’t installed? [RECORD
RESPONSE] C6. If the program were not available, what would you have done when your light
bulbs had burned out? Would you have… 1 Purchased an incandescent bulb to replace it 2 Purchase a CFL to replace it/them 3 Not have replaced it/them at all 4 Something else? [RECORD] C7. What benefits, if any, have you or your household received from participating in
this program? [DO NOT READ; INDICATE ALL THAT APPLY] 1 Avoided purchasing new bulbs 2 Was able to receive CFLs 3 Learned about the benefits of CFLs over incandescent bulbs 4 Saved energy 5 Saved money on energy bills 6 Environmental benefits 7 Helped the utilities or community 8 Other (specify________________) 9 No benefits 10 Don’t know

B:. Survey Instruments. . .
B-12
Final Summary Report: Process Evaluation of the 2006–2008 Local Government and Institutional Partnership Programs. 1/2/09
C8. How satisfied are you with this program? Please rate your satisfaction on a scale from 1 to 5, where 1 is not at all satisfied and 5 is more satisfied.
1 Not at all satisfied 2 3 4 5 Very satisfied D Don’t Know C9. [IF RATE 3 OR LESS] How could you have been more satisfied with the
program? [RECORD RESPONSE]
IN-HOME ENERGY ANALYSIS MODULE ASK OF PARTICIPANTS WHO RECEIVED AN IN-HOME ENERGY ANALYSIS INCLUDING TUNE UP PARTICIPANTS EA1. Our records indicate that [AGENCY/PARTNERSHIP] came to your home to
review how your home uses energy and provide suggestions to save energy in your home. Is this correct?
1 Yes 2 No [SKIP TO NEXT SECTION] EA2. How did you hear about the [PROGRAM NAME] program? 1 Another program (which program?) 2 Local government partnership activities 3 Water utility bill stuffing 4 Electric/gas utility bill stuffing 5 Water utility mailing 6 Electric/gas utility mailing 7 Community Sweeps 8 Community displays 9 Energy fairs 10 Friends/neighbors/relatives 11 Newspaper article 12 Other [RECORD] EA3. How long did a representative spend at your home? _____ hours

B:. Survey Instruments. . .
B-13
Final Summary Report: Process Evaluation of the 2006–2008 Local Government and Institutional Partnership Programs. 1/2/09
EA4. What information did you get as part of the visit? 1 How to save energy in my home (general brochures and discussions) 2 Measures/appliances I should install to save energy in home 3 Ways to improve the draftiness/tightness of home 4 Other [RECORD RESPONSE] D Don’t know EA5. How useful was the information you received from the visit? Please rate on a scale from1 to 5, where 1 is not at all useful and 5 is very useful. 1 Not at all useful 2 3 4 5 Very useful D Don’t Know EA6. [IF EA5<4] How could information have been more useful for you? [RECORD RESPONSE] EA7. [IF EA4<>2] Did the program make suggestions on appliances or measures you should install in your home to make it more energy efficient? 1 Yes 2 No [SKIP TO EA13] D Don’t know [SKIP TO EA13] EA8. What suggestions did the contractor make? [SELECT ALL THAT APPLY] 1 Install an energy efficient washer 2 Install an energy efficient dishwasher 3 Replace or remove secondary refrigerator 4 Replace heating system 5 Replace cooling system 6 Install CFLs 7 Add/improve insulation 8 Other (specify) EA9. Will you act on [any of these suggestions/this suggestion]? 1 Yes 2 No [SKIP TO EA12] D Don’t know [SKIP TO EA13]

B:. Survey Instruments. . .
B-14
Final Summary Report: Process Evaluation of the 2006–2008 Local Government and Institutional Partnership Programs. 1/2/09
EA10. [IF MORE THAN ONE] Which ones? [RECORD RESPONSE] EA11. Are there any suggestions the contractor made that you decided not to do? 1 Yes 2 No [SKIP TO EA13] D Don’t know [SKIP TO EA13] EA12. Why did you decide not to follow through with those suggestions? [RECORD RESPONSE] EA13. What benefits, if any, have you or your household received from participating in
this program? [DO NOT READ; INDICATE ALL THAT APPLY] 1 Learned how to change energy using behaviors/learned how to save
energy 2 Able to share what I learned with others 3 Installed more measures on my own 4 Saved energy 5 Saved money on energy bills 6 Other (specify________________) 7 No benefits 8 Don’t know EA14. How satisfied are you with this program? Please rate your satisfaction on a scale
from 1 to 5, where 1 is not at all satisfied and 5 is more satisfied. 1 Not at all satisfied 2 3 4 5 Very satisfied D Don’t Know EA15. [IF RATE 3 OR LESS] How could you have been more satisfied with the
program? [RECORD RESPONSE]

B:. Survey Instruments. . .
B-15
Final Summary Report: Process Evaluation of the 2006–2008 Local Government and Institutional Partnership Programs. 1/2/09
OTHER PROGRAM AWARENESS AND INTEREST
M1. As part of your participation in [this program/these programs], did you receive
materials or application forms for other utility programs? 1 Yes 2 No D DK
M2. [IF YES ABOVE] Did you sign up for other utility programs? 1 Yes 2 No D DK M3. [IF YES ABOVE] Which programs? [RECORD PROGRAM(S)] M4. Do you know of other organizations in your area where you could receive these
types of services? 1 Yes [What organization:___________] 2 No

B:. Survey Instruments. . .
B-16
Final Summary Report: Process Evaluation of the 2006–2008 Local Government and Institutional Partnership Programs. 1/2/09
EE1. I’m going to read a list of things you can do to make your home more energy
efficient. Please say “yes” or “no” to indicate whether you have made any of these efficiency improvements to your home since January 2006.
1 Yes 2 No D Don’t know In the last two years, have you . . . In the last two years, have you . . . a. Had an energy audit conducted of your home, where a professional walks through
your home and identifies ways that you can improve the energy efficiency of your home or appliances?
b. Had a hot water blanket or pipe wrap installed? c. Installed water conservation products such as a low flow showerhead or faucet
flow restrictors? d. Installed compact fluorescent or other energy efficient lighting [IF RECEIVED
LIGHTING: beside what you received through the program]? e. Purchased an ENERGY STAR labeled appliance for your home [IF RECEIVED
REBATE FOR APPLIANCE: other than the [appliance/appliances] you purchased]? (IF YES, Which ones?_____________)
f. Purchased an ENERGY STAR labeled thermostat for your home? g. Had the efficiency of your heating, cooling or water heating equipment checked? h. Installed a high-efficiency furnace, heat pump, water heater or air conditioner? (IF
YES, What type of equipment did you install__________?) i. Added insulation to the walls, ceilings or crawlspaces? j. Installed new energy efficient windows or doors? k. Made other improvements to increase the energy efficiency of your home? (IF
YES, What have you done? ___________________) IF SAID NO OR DON’T KNOW TO ALL, SKIP TO EE5
ENERGY-EFFICIENCY ACTIONS TAKEN

B:. Survey Instruments. . .
B-17
Final Summary Report: Process Evaluation of the 2006–2008 Local Government and Institutional Partnership Programs. 1/2/09
EE2. [IF SAID MADE AT LEAST 1 IMPROVEMENT ABOVE] Why did you make these improvements? [DO NOT READ; RECORD ALL THAT APPLY]
1 To save energy/water 2 To save money on my utility/water bill 3 Environmental benefits 4 Information received from workshop or program 5 It is the right thing to do 6 Make home more comfortable 7 Everyone else is doing it 8 Other 9 Don’t know EE2A. [If any EE1=1 AND PARTICIPANT] For the energy-efficiency improvement(s)
you said you made in the past two years, did you do this based on your participation in the [program]?
1 Yes � Which program? 2 No [SKIP TO NEXT SECTION] D Don’t Know [SKIP TO NEXT SECTION] EE3. [If EE2A=1] How influential was the [program] in your decision to take that
action? Please rate on a scale of 1 to 5, where 1 is not at all influential and 5 is very influential.
1 Not at all influential 2 3 4 5 Very influential D Don’t Know

B:. Survey Instruments. . .
B-18
Final Summary Report: Process Evaluation of the 2006–2008 Local Government and Institutional Partnership Programs. 1/2/09
EE4. [If EE3=1] Would you have taken this action without participating in the [LIST NAMES OF PROGRAMS NOTED IN EE2A] 1 Yes 2 No D Don’t know EE5. [ASK IF ALL EE1=NO] What are some of the reasons you have NOT made
energy-efficiency improvements to your home? [DO NOT READ; INDICATE ALL THAT APPLY]
1 No reason given 2 Home is new 3 Can’t afford/too costly 4 Cost/benefit trade-off is too low 5 Don’t know what to do 6 Plan to move soon 7 Too difficult to do by myself 8 Don’t have the time 9 Home is already energy efficient/I’m already doing everything I can 10 Just haven’t got around to it yet 11 Don’t know a reliable contractor 12 I don’t care 13 Other (please specify: _________________________________) 14 Don’t know
GENERAL PARTNERSHIP QUESTIONS IF DID NOT PARTICIPATE IN ANY PARTNERSHIP PROGRAM, SKIP TO NEXT SECTION. GP1. On a scale from 1 to 5, where 1 is not at all satisfied and 5 is very satisfied, what
would you rate your overall satisfaction with your involvement in the [PROGRAM NAME/WORKSHOP]?
1 Not at all satisfied 2 3 4 5 Very satisfied D Don’t Know
B:. Survey Instruments. . .
B-19
Final Summary Report: Process Evaluation of the 2006–2008 Local Government and Institutional Partnership Programs. 1/2/09
GP2. Who sponsored this program? [UNPROMPTED, THEN PROMPTED. NOTE SPECIFIC NAME IF OFFERED] 1 Electric utility 2 Gas utility 3 Water utility 4 Environmental or non-profit group 5 City or county government 6 Other______ D Don’t know GP3. What was most positive about your experience with this program? [RECORD
RESPONSE] GP4. What was the least effective part of your experience with this program?
[RECORD RESPONSE] GP5. Do you feel you are more satisfied, less satisfied, or have the same level of
satisfaction with [LOCAL GOVERNMENT PARTNER] as a result of participating in the program?
1 More satisfied 2 Less satisfied 3 Same satisfaction D Don’t know GP6. Do you feel you are more satisfied, less satisfied, or have the same level of
satisfaction with [UTILITY] as a result of participating in the program? 1 More satisfied 2 Less satisfied 3 Same satisfaction D Don’t know GP7. Were you more likely, less likely, or just as likely to participate in the program
because of the involvement of [local government partner]? 1 More likely (Why do you say that?_________________) 2 Less likely (Why do you say that?_____________________)
3 Have no effect

B:. Survey Instruments. . .
B-20
Final Summary Report: Process Evaluation of the 2006–2008 Local Government and Institutional Partnership Programs. 1/2/09
FINAL PERCEPTION
ALL RESPONDENTS TO ANSWER PD1. There are various organizations that provide information and services to help you
save energy or water, such as local governments, nonprofit groups, and utility companies. From what types of organizations would you prefer to receive this type of information…. [READ CHOICES. INDICATE ALL THAT APPLY]
1 Local government 2 Nonprofit organization 3 Electric/gas utility 4 Water utility 5 Other organization � Which organization (RECORD) 6 Does not matter D Don’t know PD2. Why is that? [RECORD RESPONSE] PD3A. Do you feel these organizations differ in their ability to provide you with services
to help you save energy or water? 1 Yes 2 No [SKIP TO PD4] D Don’t know [SKIP TO PD4] PD3B How do you think they differ? [RECORD RESPONSE] PD4. Finally, what do you believe is the source of funding for this program? [DO NOT
READ; INDICATE ALL THAT APPLY] 1 The [PARTNER NAME] 2 My local government 3 My electric or gas utility 4 My gas utility 5 My water utility 6 Ratepayers 7 Taxes 8 The State of California 9 The federal government 10 Other [RECORD] D Don’t know

B:. Survey Instruments. . .
B-21
Final Summary Report: Process Evaluation of the 2006–2008 Local Government and Institutional Partnership Programs. 1/2/09
DEMOGRAPHICS
I JUST HAVE A COUPLE MORE QUESTIONS ABOUT YOUR HOUSEHOLD. D1 [IF OWN] In what year was your home built?
1 2000 or later 2 1990 to 1999 3 1985 to 1989 4 1980 to 1984 5 1970 to 1979 6 1960 to 1969 7 1950 to 1959 8 1940 to 1949 9 1939 or earlier D Don’t know
D2 What condition do you feel your home is in? Excellent condition, good condition,
fair condition, poor condition, or terrible condition?
1 Excellent 2 Good 3 Fair 4 Poor 5 Terrible D Don’t know
D3 [IF POOR OR TERRIBLE] Why do you feel your home is in [terrible/poor]
condition? [DO NOT READ; INDICATE ALL THAT APPLY]
1 Home is drafty/uncomfortable 2 In need of many repairs (roof, siding, etc) 3 Structure is bad 4 Home is just old 5 Other [SPECIFY]
D4 Including yourself, how many people are currently living in your household? ____PEOPLE

B:. Survey Instruments. . .
B-22
Final Summary Report: Process Evaluation of the 2006–2008 Local Government and Institutional Partnership Programs. 1/2/09
D5 Do you have any….
D6. Are you currently…?
1 Married 2 Widowed 3 Divorced 4 Separated 5 Never married R Refused
D7 Are you Spanish, Hispanic, or Latino?
1 Yes 2 No D Don’t know R Refused
D8 What is your racial classification? Is it…
1 American Indian 2 Alaskan Native 3 Asian or Pacific Islander 4 African American or Black 5 White 6 Other (Please specify):_________________ D Don’t know R Refused
A. IF D4=1, SKIP Children under 6 living with you?
1 Yes 2 No D DK R Refused
B. Adults over 60 in your household? 1 Yes 2 No D DK R Refused C. Disabled individuals in your household?
1 Yes 2 No D DK R Refused

B:. Survey Instruments. . .
B-23
Final Summary Report: Process Evaluation of the 2006–2008 Local Government and Institutional Partnership Programs. 1/2/09
D9 I am going to read to you some income ranges. Please estimate your total gross annual household income, before taxes, for this year. Include all sources of income for including all earned wages in the household, all salary, financial assets, pensions, public assistance, or any other service. Will your total annual household income in 2007 be…
[IF NECESSARY, READ: We know that most people consider their income to be very private information. Your income and name will not be disclosed to anyone, for any purpose.]
1 Less than $15,000 2 $15,000-29,999 3 $30,000-39,999 4 $40,000-49,999 5 $50,000-59,999 6 $60,000-69,999 7 $70,000-79,999 8 $80,000-89,999 9 $90,000–99,999 10 $100,000–109,999 11 $110,000–149,999 12 $150,000–$200,000 13 Greater than $200,000 14 Don’t know 15 Refused
End THANK YOU FOR YOUR TIME.

B:. Survey Instruments. . .
B-24
Final Summary Report: Process Evaluation of the 2006–2008 Local Government and Institutional Partnership Programs. 1/2/09
B.2 SMALL COMMERCIAL PARTICIPANT TELEPHONE SURVEY Hello, my name is [interviewer name], and I'm calling on behalf of SPONSOR and your local utility. May I speak with [named respondent]? 1 Yes 2 No [attempt to reach contact or someone else who may have attended, else
terminate] I'm with PA Consulting Group, an independent research firm. We are conducting a study about some of the services available in California to commercial customers. I'd just like to ask about these types of services and [IF NONPARTICIPANT: whether you’ve taken advantage of them IF PARTICIPANT: your experiences with the programs that offer these services]. Your responses will be kept confidential and your name will not be revealed to anyone. (Why are you conducting this study: Studies like this help the utility and its partners better understand customers’ awareness of and interest in energy programs and services. (Timing: This survey should take less than 15 minutes of your time. Is this a good time for us to speak with you? IF NOT, SET UP CALL BACK APPOINTMENT OR OFFER TO LET THEM CALL US BACK AT 1-800-454-5070) (Sales concern: I am not selling anything; we would simply like to learn about your awareness of services that could save energy in your business, and your opinions about these services. Your responses will be kept confidential. (NOTE: For all questions, “don’t know” and “refused” will be coded if offered as a response.) DK = DON’T KNOW R = REFUSED S1. First, could you tell me if you help specify, recommend, or approve equipment
purchases for your facilities?
1 Yes 2 No [IF NONPARTICIPANT: get other respondent contact info; thank
and terminate]

B:. Survey Instruments. . .
B-25
Final Summary Report: Process Evaluation of the 2006–2008 Local Government and Institutional Partnership Programs. 1/2/09
S2. What is your organization’s primary building activity? Is it . . . (READ)
1 Education 2 Food sales 3 Food service 4 Health care 5 Lodging 6 Retail 7 Office 8 Public use building 9 Something else?
S3. What is your title? (DON’T READ)
1 Owner/operator 2 President 3 Manager 4 Purchasing agent 5 Other (RECORD)
PARTICIPATION CONFIRMATION IF SAMPLE SHOWS ATTENDED WORKSHOPS OR TRAININGS P1 According to our records, you attended a workshop training through [PROGRAM].
Workshops or trainings you attended include: [FILL WITH WORKSHOP NAME]. Is this correct?
1 Yes [SKIP P2] 2 No
P2 Did you attend any workshops offered by [program]?
1 Yes What workshops did you attend? [Record and continue] 2 No [Thank for time and terminate]
IF CONFIRMS PARTICIPATION, WORKSHOP =1

B:. Survey Instruments. . .
B-26
Final Summary Report: Process Evaluation of the 2006–2008 Local Government and Institutional Partnership Programs. 1/2/09
IF SAMPLE SHOWS RECEIVED EQUIPMENT—DIRECT INSTALL P3 According to our records, you received [MEASURE DESCRIPTIONS] through a
program offered by the [PARTNERSHIP]. Is this correct?
1 Yes [SKIP P4] 2 No
P4 Is there someone else who would know about your organization’s participation in
the program? 1 Yes—Continue (ENTER CONTACT INFO and
TRANSFER) 2 Yes—Not available (ENTER CONTACT INFO and EXIT) 3 No [Thank for time and terminate] IF SAMPLE SHOWS RECEIVED REBATES P5 According to our records, you received rebates for the following equipment:
[DESCRIPTION OF EQUIPMENT]. These rebates were provided by a program offered by [PARTNERSHIP]. Do you remember participating in the program?
1 Yes [SKIP P6] 2 No
P6 Is there someone else who would know about your organization’s participation in
the program? 1 Yes—Continue (ENTER CONTACT INFO and
TRANSFER) 2 Yes—Not available (ENTER CONTACT INFO and EXIT) 3 No [Thank for time and terminate] IF CONFIRMS PARTICIPATION, INCENT=1 IF SAMPLE SHOWS RECEIVED TECHNICAL ASSISTANCE—AUDITS P7 According to our records show someone came in and performed an audit or
provided technical assistance for your building. These services were provided by a program through [PARTNERSHIP].
Do you recall receiving the audit?
1 Yes [SKIP P8] 2 No

B:. Survey Instruments. . .
B-27
Final Summary Report: Process Evaluation of the 2006–2008 Local Government and Institutional Partnership Programs. 1/2/09
P8 Is there someone else who would know about your organization’s participation in the program?
1 Yes—Continue (ENTER CONTACT INFO and
TRANSFER) 2 Yes—Not available (ENTER CONTACT INFO and EXIT) 3 No [Thank for time and terminate] IF CONFIRMS PARTICIPATION, AUDIT=1
COMMERCIAL WORKSHOPS/TRAINING/EDUCATION MODULE
W1 How did you first hear about the workshops offered through [PARTNER]? [DO
NOT READ; INDICATE ALL THAT APPLY] 1 Flyers from utility 2 Flyers from [PARTNER] 3 Flyers from somewhere else (Probe on who) 4 Manufacturer/distributor 5 Tradeshow 6 Website (Which website?) 7 SCE/SCG/PG&E 8 [PARTNER] employee 9 Calendar of events 10 Other Utility (which utility: ___________________________) 11 Other (specify: _______________________________)
W2. Who sponsored the session? [DO NOT READ; RECORD ALL THAT APPLY] 1 Southern California Gas 2 Southern California Edison 3 Ventura County Energy Resource Center/Regional Energy Alliance 4 South Bay/South Bay Energy Savings Center 5 Local Government Energy Action Resources (LGEAR) , Mammoth
Lakes/Ridgecrest 7 Energy Coalition 8 County/City of Santa Barbara, Goleta and Carpenteria 9 Other [RECORD] 10 Don’t Know

B:. Survey Instruments. . .
B-28
Final Summary Report: Process Evaluation of the 2006–2008 Local Government and Institutional Partnership Programs. 1/2/09
W3 Why did your organization participate in the workshop(s)? [DO NOT READ; INDICATE ALL THAT APPLY]
1 To learn about ways to save energy in our business 2 To learn about ways to save money 3 To learn how to install energy-efficiency measures 4 To learn about new energy-efficiency technologies on the market 5 To learn about ways to be more environmentally friendly (Saving the
planet) 6 To understand ‘green’ building issues and practices 7 Other (specify: __________________________________) 8 Don’t Know
W4 Has your organization used any of the information from the workshops to make
changes in your facility?
1 Yes 2 No [SKIP TO W7] D DK [SKIP TO W7]
W5 What specifically have you done in your organization as a result of what you
learned in this event? [DO NOT READ; RECORD ALL THAT APPLY]
1 Replaced less efficient lighting with more efficient lighting 2 Reviewed energy use in business 3 Reviewed water use in business 4 Purchased or Installed more energy efficient equipment 5 Purchased or installed more water efficient equipment 6 Changed behavior to be more efficient (turning off lights, turning down
A/C or heat) 7 Tuning up HVAC 8 Other (specify: _____________________________________________) 9 Nothing
W6 [IF W5<9] On a scale of 1 to 10, with 1 being not at all influential and 10 being
extremely influential, how influential was the information you received in the workshop in your decision to do that/these things?
_____
W7 Do you plan to use any (IF DID SOMETHING ALREADY: other) concepts and
technologies you learned about from the workshop(s)?
1 Yes 2 No [SKIP TO W9] D DK [SKIP TO W9]

B:. Survey Instruments. . .
B-29
Final Summary Report: Process Evaluation of the 2006–2008 Local Government and Institutional Partnership Programs. 1/2/09
W8 What do you plan to do? [RECORD RESPONSE] W9. How useful was the event in helping you understand ways to save energy: Not at
all useful, somewhat useful, or very useful?
1 Not at all useful 2 Somewhat useful 3 Very useful
W10. Do you think the information you received will help your organization save
energy?
1 Yes 2 No D Don’t know
W11. As part of this event, did you receive any brochures or literature to take with you?
1 Yes 2 No [SKIP TO W13] D Don’t know [SKIP TO W13]
W12. How useful did you find the literature in helping you understand ways to save
energy in your organization? Not at all useful, somewhat useful, or very useful.
1 Not at all useful 2 Somewhat useful 3 Very useful
W13 Have you participated in any other utility energy-efficiency programs as a direct
result of your interactions with [PROGRAM]?
1 Yes (which utility and program: ______________ _________________) 2 No D DK
W14. Do you feel your organization has benefited from participating in the program?
1 Yes 2 No [SKIP TO ER1] D DK [SKIP TO ER1]

B:. Survey Instruments. . .
B-30
Final Summary Report: Process Evaluation of the 2006–2008 Local Government and Institutional Partnership Programs. 1/2/09
W15. How has your organization benefited from participating in this program? [DO NOT READ; INDICATE ALL THAT APPLY]
1 Learned how to change energy using behaviors/learned how to save
energy 2 Able to share what I learned with others 3 Installed more measures on my own 4 Saved energy 5 Saved money on energy bills 6 Other (specify________________) 7 No benefits 8 Don’t know
EQUIPMENT REBATES MODULE (OTHER THAN LIGHTING) ASK OF PARTICIPANTS THAT RECEIVED REBATES TOWARD ENERGY-EFFICIENT EQUIPMENT. ASK FOR EACH MEASURE CATEGORY RECEIVED (E.G., HVAC, LIGHTING, ETC). ER1. Our records indicate you purchased a [MEASURE] and redeemed a rebate for
[$X] for in [YEAR]. Is this correct? 1 Yes 2 No D DK ER2. [IF NO] What is incorrect? [Probe if necessary with below categories] 1 Purchased equipment but did not receive a rebate 2 Did not purchase any new equipment through the program 3 Purchased different type of equipment (What equipment? ______) 4 Timing is incorrect 5 Other [RECORD] IF ER2=1 OR ER2=2, SKIP TO NEXT SECTION

B:. Survey Instruments. . .
B-31
Final Summary Report: Process Evaluation of the 2006–2008 Local Government and Institutional Partnership Programs. 1/2/09
ER3. How did you hear about the program? [DO NOT READ; RECORD ALL THAT APPLY]
1 Another program (which program?) 2 Local government partnership activities 3 Water utility bill stuffing 4 Electric/gas utility bill stuffing 5 Water utility mailing 6 Electric/gas utility mailing 7 Community Sweeps 8 Community displays 9 Energy fairs 10 Friends/neighbors/relatives 11 Newspaper article 12 Other [RECORD] ER4. How convenient was it for you to redeem the rebate? Please rate on a scale from
1 to 5, where 1 is not at all convenient and 5 is very convenient. 1 Not at all convenient 2 3 4 5 Very convenient D Don’t Know ER4a. [IF ER4<=3] Why wasn’t it convenient for you to redeem the rebate? [RECORD RESPONSE] ER5. Had you planned to purchase a new [MEASURE] before you heard about the
program? 1 Yes 2 No D Don’t know ER6. How important was the program in your decision to purchase a high efficiency
[MEASURE] rather than a less efficient [MEASURE]? Please rate on a scale of 1 to 5, where 1 is not at all important and 5 is very important.
1 Not at all important 2 3 4 5 Very important D Don’t Know

B:. Survey Instruments. . .
B-32
Final Summary Report: Process Evaluation of the 2006–2008 Local Government and Institutional Partnership Programs. 1/2/09
ER7. Without the rebate offer, would you have purchased a high-efficiency [MEASURE] at the time you did?
1 Yes 2 No D Don’t know ER8. [IF NO] Would you have purchased a lower efficiency [MEASURE], a different
high-efficiency [MEASURE], the same [MEASURE] at a later time, or not made a purchase at all?
1 Lower efficiency [APPLIANCE] 2 Different high-efficiency [APPLIANCE] 3 Same [APPLIANCE] at a later time 4 Would not have made any purchase D Don’t know ER9.How has your organization benefited from participating in this program? [DO NOT
READ; INDICATE ALL THAT APPLY] 1 Saved water 2 Saved energy 3 Reduced water bill 4 Reduced energy bill 5 Have a better appliance 6 Was able to purchase appliance that could not purchase before 7 Environmental benefits 8 Help the utilities or community 9 Other (specify) 10 No benefits 11 Don’t know

B:. Survey Instruments. . .
B-33
Final Summary Report: Process Evaluation of the 2006–2008 Local Government and Institutional Partnership Programs. 1/2/09
DIRECT INSTALL MODULE (OTHER THAN LIGHTING)
ASK OF PARTICIPANTS THAT RECEIVED ENERGY EFFICIENT MEASURES VIA DIRECT INSTALL, EXCLUDING CFLS (E.G., INTERIOR HARDWIRE LIGHTING, ETC.) ASK OF EACH MEASURE DIRECT INSTALLED. DI3. How did you hear about the program? [DO NOT READ; RECORD ALL THAT
APPLY] 1 Another program (which program?) 2 Local government partnership activities 3 Water utility bill stuffing 4 Electric/gas utility bill stuffing 5 Water utility mailing 6 Electric/gas utility mailing 7 Community Sweeps 8 Community displays 9 Energy fairs 10 Word of mouth 11 Newspaper article 12 Technical assessment/audit 13 Other [RECORD] DI1. I just want to confirm someone from [PROGRAM NAME/ORGANIZATION] came
into your organization and installed [MEASURE] in [MONTH/YEAR]. Is this correct?
1 Yes 2 No D DK DI2. [IF NO] What is incorrect? [Probe if necessary with below categories] 1 Do not recall someone coming to organization [SKIP TO NEXT SECTION] 2 Measures listed are incorrect �
ASK AND RECORD: WHAT ARE THE CORRECT MEASURES? 3 Date is incorrect 4 Other [RECORD] [SKIP TO NEXT SECTION IF NECESSARY]

B:. Survey Instruments. . .
B-34
Final Summary Report: Process Evaluation of the 2006–2008 Local Government and Institutional Partnership Programs. 1/2/09
DI4. Without the program, would your organization have installed new [MEASURE] at the time you did? 1 Yes 2 No [SKIP TO DI6] D Don’t know DI5. Would the [MEASURE] have been lower efficiency, the same efficiency, or higher
efficiency than what was installed through the program? 1 Lower efficiency 2 Same efficiency 3 Higher efficiency D Don’t know DI6. Is the measure still installed? 1 Yes 2 No D Don’t know DI7. [IF NO] Why isn’t the measure still installed? [RECORD RESPONSE] DI8. How have you or your business benefited from participating in this program? [DO
NOT READ; INDICATE ALL THAT APPLY] 1 Learned how to change energy using behaviors/learned how to save
energy 2 Received energy efficient measures 3 Saved energy 4 Saved water 5 Saved money on energy/water bills 6 Able to share what I learned with others 7 Other (specify________________) 8 No benefits 9 Don’t know

B:. Survey Instruments. . .
B-35
Final Summary Report: Process Evaluation of the 2006–2008 Local Government and Institutional Partnership Programs. 1/2/09
LIGHTING REBATE/DIRECT INSTALL MODULE
L1A. [IF RECEIVED BULBS VIA REBATE] Our records indicate you participated in a
program where you redeemed a rebate for [LIGHTING DESCRIPTION] for the value of $X. Is this correct?
1 Yes 2 No [SKIP TO NEXT SECTION] L1B. [IF RECEIVED BULBS VIA DIRECT INSTALL] Our records indicate you
participated in a program where a rep from [ADMINISTERING AGENCY] came to your organization and installed lighting measures which will include: T8 ballasts, Compact fluorescent bulbs, or Indoor light fixtures. Is this correct?
1 Yes 2 No [SKIP TO NEXT SECTION] L2. How did you hear about the [PROGRAM NAME] program? 1 Another program (which program?) 2 Local government partnership activities 3 Water utility bill stuffing 4 Electric/gas utility bill stuffing 5 Water utility mailing 6 Electric/gas utility mailing 7 Community Sweeps 8 Community displays 9 Energy fairs 10 Word of mouth 11 Newspaper article 12 Other [RECORD] L3. Why did you participate in the program? [DO NOT READ, INDICATE ALL THAT
APPLY]
1 Needed new bulbs 2 To save energy/have more efficient lighting 3 To save money 4 To help the environment/prevent global warming 5 To get better lighting/lighting advice 6 Needed to dispose of old bulbs 7 Other (specify: ___________________________)

B:. Survey Instruments. . .
B-36
Final Summary Report: Process Evaluation of the 2006–2008 Local Government and Institutional Partnership Programs. 1/2/09
L4. In total, how many efficient bulbs and fixtures did you receive through this program? _______
L5. Of these, how many are currently installed? ______ L6. [IF L5<L4] What happened to the [L4-L5] bulbs that aren’t installed? [RECORD
RESPONSE] L7. In general, how satisfied are you with the quality of the lighting from these bulbs?
Please tell me on a 1 to 5 scale, where 1 is not at all satisfied, 3 is moderately satisfied, and 5 is very satisfied.
1 Not at all satisfied 2 3 4 5 Very satisfied D Don’t Know
L8. [IF L6>1 AND L7<3] Was your dissatisfaction with the lighting quality a reason why
some of the bulbs are not installed?
1 Yes 2 No D Don’t know
L9. If the program were not available, what would you have replaced these light bulbs
with when they burned out? Would you have…
1 Replaced the bulbs with ones that were similar to what you had 2 Replaced the bulbs with more efficient light bulbs 3 Not have replaced the bulbs at all 4 Something else? [RECORD]
L10. Since the program, has your company purchased other lighting for your building
outside of the program?
1 Yes 2 No [SKIP TO L13] D Don’t know [SKIP TO L13]

B:. Survey Instruments. . .
B-37
Final Summary Report: Process Evaluation of the 2006–2008 Local Government and Institutional Partnership Programs. 1/2/09
L11. Was the lighting you purchased more efficient, the same efficiency, or less efficient than the lighting you would have purchased before this program?
1 More efficient 2 Same efficiency 3 Less efficient 4 Other [RECORD] D Don’t know
L12. How influential was your experience with the program in your decision to
purchase lighting that was high-efficiency? Very influential, somewhat influential, or not at all influential?
1 Very influential 2 Somewhat influential 3 Not at all influential D Don’t know
L13. How has your organization benefited from participating in this program? [DO NOT
READ; INDICATE ALL THAT APPLY]
1 Received new lighting 2 Learned how to change energy using behaviors/learned how to save
energy 3 Directed us to other programs 4 Saved energy 5 Saved money on energy bills 6 Other (specify________________) 7 No benefits 8 Don’t know
ENERGY AUDIT/TECHNICAL ASSISTANCE ASK OF PARTICIPANTS WHO RECEIVED AN ENERGY AUDIT OR TECHNICAL ASSISTANCE, INCLUDING TUNE-UP PARTICIPANTS EA1. Our records indicate that [AGENCY/PARTNERSHIP] came to your organization
to CONDUCT AN ENERGY AUDIT and provide suggestions to save energy. Is this correct?
Press 1 to continue

B:. Survey Instruments. . .
B-38
Final Summary Report: Process Evaluation of the 2006–2008 Local Government and Institutional Partnership Programs. 1/2/09
EA2. How did you hear about the [PROGRAM NAME] program? 1 Another program (which program?) 2 Local government partnership activities 3 Water utility bill stuffing 4 Electric/gas utility bill stuffing 5 Water utility mailing 6 Electric/gas utility mailing 7 Community Sweeps 8 Community displays 9 Energy fairs 10 Friends/neighbors/relatives 11 Newspaper article 12 Other [RECORD] EA3. What information or service did you get as part of the visit? [DO NOT READ;
INDICATE ALL THAT APPLY] 1 How to save energy in building (general brochures and discussions) 2 Measures company should install to save energy 3 Contractors to use to design an efficiency project 4 Demand response program options 5 Referrals to other programs/rebates (Which programs did you receive
referrals to?) 6 Installation of measures (What measures?) 7 Other [RECORD RESPONSE] D Don’t know EA4. How useful was the information you received from the visit? Please rate on a scale from1 to 5, where 1 is not at all useful and 5 is very useful. 1 Not at all useful 2 3 4 5 Very useful D Don’t Know EA5. [IF EA4<4] How could information have been more useful for you? [RECORD RESPONSE] EA6. Did the program make suggestions on equipment you should install? 1 Yes 2 No [SKIP TO EA12] D Don’t know [SKIP TO EA12]

B:. Survey Instruments. . .
B-39
Final Summary Report: Process Evaluation of the 2006–2008 Local Government and Institutional Partnership Programs. 1/2/09
EA7. What suggestions did the contractor make? 1 Install efficient lighting 2 Install/retrofit HVAC 3 Remove inefficient equipment (What equipment?) 4 Other (specify) EA8. Will you act on [any of these suggestions/this suggestion]? 1 Yes 2 No [SKIP TO EA11] D Don’t know [SKIP TO EA11] EA9. [IF MORE THAN ONE] Which ones? [RECORD RESPONSE] EA10. Are there any suggestions the contractor made that your organization will not do? 1 Yes 2 No [SKIP TO EA12] D Don’t know [SKIP TO EA12] EA11. Why won’t you follow through with those suggestions? [RECORD RESPONSE] EA12. How has your organization benefited from participating in this program? [DO NOT
READ; INDICATE ALL THAT APPLY] 1 Learned where building needed improvements 2 Directed organizations to other programs/resources (What
programs/resources?) 3 Direct installed measures 4 Saved energy 5 Saved money on energy bills 6 Other (specify________________) 7 No benefits 8 Don’t know

B:. Survey Instruments. . .
B-40
Final Summary Report: Process Evaluation of the 2006–2008 Local Government and Institutional Partnership Programs. 1/2/09
OTHER PROGRAM AWARENESS
M1. As part of your participation in [this program/these programs], did you receive
materials or application forms for other utility programs?
1 Yes 2 No D DK
M2. [IF YES ABOVE] Did you sign up for other utility programs?
1 Yes 2 No D DK
M3. [IF YES ABOVE] Which programs? [RECORD PROGRAM(S)] M4. Do you know of other organizations in your area where you could receive these
types of services? 1 Yes [What organization:___________] 2 No
GENERAL PARTNERSHIP QUESTIONS IF NONPARTICIPANT, SKIP TO NEXT SECTION. GP1. On a scale from 1 to 5, where 1 is not at all satisfied and 5 is very satisfied, what
would you rate your overall satisfaction with your involvement in the [PROGRAM NAME/WORKSHOP]?
1 Not at all satisfied 2 3 4 5 Very satisfied D Don’t Know

B:. Survey Instruments. . .
B-41
Final Summary Report: Process Evaluation of the 2006–2008 Local Government and Institutional Partnership Programs. 1/2/09
GP1a. How could you have been more satisfied with the program? [RECORD RESPONSE] GP2. Who sponsored this program? [READ IF NECESSARY. INDICATE ALL THAT
APPLY] [NOTE SPECIFIC NAME IF OFFERED] 1 Electric utility 2 Gas utility 3 Water utility 4 Environmental or non-profit group 5 City or county government 6 Other______ D Don’t know GP3. What was most positive about your experience with this program? [RECORD
RESPONSE] GP4. What was the least effective part of your experience with this program?
[RECORD RESPONSE] GP5. Do you feel you are more satisfied, less satisfied, or have the same level of
satisfaction with [LOCAL GOVERNMENT PARTNER] as a result of participating in the program?
1 More satisfied 2 Less satisfied 3 Same satisfaction D Don’t know GP6. Do you feel you are more satisfied, less satisfied, or have the same level of
satisfaction with [UTILITY] as a result of participating in the program? 1 More satisfied 2 Less satisfied 3 Same satisfaction D Don’t know GP7. Were you more likely, less likely, or just as likely to participate in the program
because of the involvement of [local government partner]? 1 More likely (Why do you say that?_________________) 2 Less likely (Why do you say that?_____________________) 3 Have no effect

B:. Survey Instruments. . .
B-42
Final Summary Report: Process Evaluation of the 2006–2008 Local Government and Institutional Partnership Programs. 1/2/09
NP4. [IF REPLIED NOT AT ALL INTERESTED IN NP3] Why wouldn’t you be interested in receiving these services? [DO NOT READ; INDICATE ALL THAT APPLY]
1 No reason 2 Building is new 3 Do not need equipment (HVAC/CFLs) 4 Too costly/payback isn’t there 5 Don’t know what to do 6 Already participated in programs to make building efficient 7 Don’t know a reliable contractor 8 I don’t care 9 Energy use is not a priority for organization 10 Other (please specify: _________________________________) 11 Don’t know NP5. [ASK IF SAID AWARE OF PROGRAM, BUT DID NOT PARTICIPATE] You said
you heard of the program, but have not participated. Why haven’t you participated in the program? [DO NOT READ; INDICATE ALL THAT APPLY]
1 Do not need services provided by the program 2 Have not gotten around to participating 3 Do not know how to participate 4 Do not want to participate 5 Do not need equipment (HVAC/CFLs) 6 Other [RECORD] D Don’t know NP6. Do you know of other organizations in your area where you could receive these
types of services? 1 Yes [What organization:___________] 2 No

B:. Survey Instruments. . .
B-43
Final Summary Report: Process Evaluation of the 2006–2008 Local Government and Institutional Partnership Programs. 1/2/09
PARTNERSHIP PERCEPTION QUESTIONS
ALL RESPONDENTS TO ANSWER PD1. There are various organizations that provide information and services to help you
save energy or water, such as local governments, nonprofit groups, and utility companies. From what types of organizations would you prefer to receive this type of information…. [READ; INDICATE ALL THAT APPLY]
1 Local government 2 Nonprofit organization 3 Electric/gas utility 4 Water utility 5 Other organization � Which organization (RECORD) 6 Does not matter D Don’t know PD2. Why is that? [RECORD RESPONSE] PD3A. Do you feel these organizations differ in their ability to provide you with services
to help you save energy or water? 1 Yes 2 No [IF PART SKIP TO PD4, IF NONPART SKIP TO O1] D Don’t know [IF PART SKIP TO PD4, IF NONPART SKIP TO O1] PD3B How do you think they differ? [RECORD RESPONSE] IF NONPART SKIP TO O1 PD4. What do you believe is the source of funding for this program? [DO NOT READ;
INDICATE ALL THAT APPLY] 1 The [PARTNER NAME] 2 My local government 3 My electric utility 4 My gas utility 5 My water utility 6 Ratepayers 7 Taxes 8 The State of California 9 The federal government 10 Other [RECORD] D Don’t know

B:. Survey Instruments. . .
B-44
Final Summary Report: Process Evaluation of the 2006–2008 Local Government and Institutional Partnership Programs. 1/2/09
ORGANIZATIONAL QUESTIONS My last questions for you are about your organization.
O1 How many locations does your organization have? ____ O2 [IF ABOVE >1] Are decisions to purchase and install equipment made . . . [READ
LIST]
1 At the corporate level? 2 At the regional level? 3 At the local level? 4 At the location level? 5 Other (specify: ________________________________)
[IF S1<>1, SKIP TO END] O4 What factors into the decision about the level of energy efficiency when
purchasing new equipment or during a remodel or new construction? (DO NOT READ; INDICATE ALL THAT APPLY)
1 Rebates available 2 Recommendation of experts 3 Manufacturer warranties 4 Energy savings 5 Being perceived as green company 6 Standard specifications for business 7 Required for business in other regions 8 Efficiency level of equipment available from manufacturers 9 Past experience with equipment brand 10 Building codes 11 Other (specify) ________________________________
O5 I would like to understand how the following factors fit into your decision to
purchase new energy using equipment. For each please rate on a 1 to 10 scale where 1 is not at all important and 10 is very important. How important is… [READ EACH; ROTATE LIST]
a. The amount of energy the equipment can save b. The price of the equipment, including installation costs c. The pay-back period d. Company culture or policies e. Its impact on the environment f. How well the equipment performs/does the job g. The recommendation of the distributor h. The recommendation of others in the same business
Thank you for your time. Do you have any final comments or questions?

C-1
Final Summary Report: Process Evaluation of the 2006–2008 Local Government and Institutional Partnership Programs. 1/2/09
APPENDIX C: PROGRAM-SPECIFIC RESPONSE RATES
C.1 SURVEY METHODOLOGY
The process evaluation of SCG partnership programs surveyed participants from Bakersfield-Kern, Energy Coalition, South Bay, and Ventura County Partnerships. These four partnership programs were included in the study as they were the only programs that provided sample lists to support the survey.
As agreed upon with SCG, only program participants were interviewed. The surveys were administered in May 2008 and June 2008.
Participant databases served as the sample source for the participant surveys. In total, PA collected 217 surveys from residential participants and 289 commercial participants. Residential customers that said they received gas from a utility other than SCG were eliminated from the data.
Depending on which program they participated in, and the equipment they received, these participants may not have been included in all program-specific questions. For example, the Energy Coalition program serves both SCE and SCG customers. The program data does not denote which utility a participant represents and the participant could be a customer for both utilities. If the participant only received electric equipment, then that individual was not retained for the SCG analysis.
Because SCE and PG&E have engaged PA to conduct a separate process evaluation of their portions of the program, data-collection efforts took place concurrently. In some cases, the sample lists overlap completely so efficiencies could be realized in the data-collection process. For example, sample that supports the Energy Coalition residential survey is the same for SCG and SCE.
Table C-1 Summary Data Collection Activities
Program Name SCG Telephone Surveys Completed
SCG3523 Bakersfield-Kern • 62 residential participants • 71 commercial participants
SCG3524 and SCG3525
Energy Coalition Resource and Non-Resource
• 71 residential participants • 65 commercial participants
SCG3522 South Bay • 78 residential participants • 77 commercial participants
SCG3521 Ventura • 6 residential participants • 76 commercial participants

C:. Program-Specific Response Rates. . .
C-2
Final Summary Report: Process Evaluation of the 2006–2008 Local Government and Institutional Partnership Programs. 1/2/09
C.2 RESPONSE RATE TABLES
This section details the participant response rates. Note that the number of completed surveys may not match up with the number of SCG-specific surveys detailed above. As discussed, depending on the program, the final dataset may have eliminated cases that did not receive services from SCG or where the program data included a flag to indicate the participant was not related to SCG. However, because the participant survey was combined with SCE and PG&E efforts, the response rates are representative of the entire survey effort for all participating IOUs.
Table C-2 Response Rates, Residential Participants
Sample Disposition Bakersfield
Kern Energy
Coalition South Bay
Ventura County
Sample Size 119 272 256 10 Temporarily disconnected 0 9 0 0 Fax/data line 0 1 3 0 Number not in service 2 8 3 0 Disconnected number 7 8 7 0 Business/Residential number 0 1 6 1 Ineligible—deceased 1 0 2 0 Adjusted Sample Size 109 245 235 9 Hard Refusal 12 20 18 0 Soft Refusal1 2 3 14 0 Incompletes (partial interviews) 3 2 4 0 Unavailable for duration 2 1 4 1 Incapable/incoherent 0 1 1 0 Language barrier/non-English 10 14 7 0 Active 32 132 109 2 Completed Surveys 48 72 78 6 Response Rate2 44.0% 29.4% 33.2% 66.7% 1 Attempts were made to convert all soft refusals 2 Number of completed surveys divided by adjusted sample size

C:. Program-Specific Response Rates. . .
C-3
Final Summary Report: Process Evaluation of the 2006–2008 Local Government and Institutional Partnership Programs. 1/2/09
Table C-3 Response Rates, Commercial Participants
Sample Disposition Bakersfield
Kern Energy
Coalition South Bay
Ventura County
Sample Size 232 172 268 187 Temporarily disconnected 0 1 0 0 Fax/data line 0 6 5 1 Number not in service 0 0 0 0 Disconnected number 11 1 6 2 Business/Residential number 2 1 4 1 Ineligible—deceased 0 0 0 0 Adjusted Sample Size 219 163 253 183 Hard Refusal 9 15 22 10 Soft Refusal1 1 4 2 2 Incompletes (partial interviews) 3 6 0 1 Unavailable for duration 1 1 2 3 Incapable/incoherent 0 0 0 0 Language barrier/non-English 7 13 0 0 Active 127 62 148 90 Completed Surveys 71 62 79 77 Response Rate2 32.4% 38.0% 31.2% 42.1%
1 Attempts were made to convert all soft refusals 2 Number of completed surveys divided by adjusted sample size