southern downs: tourism market research program · for the purposes of this analysis, sdrc has been...
TRANSCRIPT

Southern Downs: Tourism Market Research Program February 2018
1

ContentsContents
1. Introduction 3
2. Research Methodology 6
3. Brand/ Destination Awareness 9
4. Current Visitor Market Snapshot 17
5. Southern Downs: Visitor Profile and Market Analysis 19
6. Appendices 44
DisclaimerThe information and recommendations provided in this document are made on the basis of information available at the time of preparation and the assumptions outlined throughout the document. While all care has been taken to check and validate material presented in this report, independent research should be undertaken before any action or decision is taken on the basis of material contained in this report. This report does not seek to provide any assurance of project viability and EarthCheck accepts no liability for decisions made or the information provided in this report. Images courtesy of Tourism and Events Queensland 2

Southern Downs Market Research : January 2018
1. Introduction
3

Southern Downs Market Research : January 2018
1.1 Introduction and Purpose of Report
IntroductionSouthern Downs Regional Council commissioned EarthCheck to carry out a program of tourism marketresearch to inform Council’s future investments in the visitor economy – in marketing, communications,and product development.
Purpose of Report
This report provides a summary of market research conducted during the program; focusing on;
1. Gaining a comprehensive understanding of the Southern Downs visitor market, covering:• Trend analysis;• Visitor demographics;• Visitor origins;• Visitor activities;• Seasonality in travel patterns;• Visitation forecasts• Benchmarking of performance/visitation patterns with neighbouring areas and the wider Southern
Queensland Country region.
Market profile and forecasting information has been sourced from Tourism Research Australia’sinternational and domestic visitor surveys, and from the Tourism Forecasting Reference Panel.
2. Gaining an understanding of awareness of the region, incorporating;
• Visitor awareness of the region from its key leisure and day visitor market - south east Queensland• Intention to visit the region in the next 12 months• Profile/awareness of the region’s key destinations, attractions and attributes• Awareness of region as a leisure/holiday destinations, testing an identified range of regional and
local destination names and brands.
Market awareness intelligence has primarily been gathering via a 2,500 sample Google panel survey ofSouth East Queensland and northern NSW residents, complementing existing desktop information andprevious brand studies, including Tourism and Events Queensland’s regional brand health survey.
4

Southern Downs Market Research : January 2018
1.2 Research Area Context
Figure 1: Southern Queensland Country RegionSource: Tourism Research Australia
Figure 2: Southern Downs Regional Council areaSource: Tourism Research Australia
Historically an area focussed on mining, timber andpastoral pursuits, the Southern Downs region iscurrently known for its award-winning food and wineand a plethora of striking natural assets and heritagetrails. The landscape is characterised by orchards andvineyards in a rolling countryside. In the summermonths, sunflower fields line the highway.
The Southern Downs Regional Council area is locatedapproximately a two hour drive south-west fromBrisbane CBD, and within a 3 hour drive of the GoldCoast. As part of the Southern Queensland CountryRegion tourism area (see Figure 1), it is one of a smallnumber of Queensland regions which have atemperate climate with definitive seasons.
1. 2016 ABS Census Data
The area is home to a growing population of over 35,000 residents, and hosts a variety of travellers andbackpackers for its annual picking seasons. While the area is best known for its agriculture, other majorindustries include retail, manufacturing, education and training, health care and social assistance andaccommodation and food services1.
The tourism industry within the area is estimated to support almost 800 direct full-time equivalent jobs,29% of which are aged 15-241. According to census data the industry is growing, with an additional 130jobs in tourism and hospitality in the region between 2006 and 2011, 95 of which were full-time equivalent(2016 data is due for release in the near future).
5

Southern Downs Market Research : January 2018
2. Research Methodology
6

Southern Downs Market Research : January 2018
2. Methodology
Visitor Market AnalysisMarket profile and forecasting information has been sourced from Tourism Research Australia’sinternational and domestic visitor surveys, and from the Tourism Forecasting Reference Panel.
For the purposes of this analysis, SDRC has been defined as the statistical areas (SA2 regions) ofStanthorpe, Stanthorpe Region, Warwick, Southern Downs East and Southern Downs West. Thesestatistical areas are created by the Australian Bureau of Statistics (ABS) and are defined by populationdensity (averaging 10,000 people per SA2 region but varying between 3,000 and 25,000 depending on themaintenance of recognisable local boundaries). The above areas have been cross-referenced within boththe Tourism Research Australia (TRA) databases and with the ABS to align with the Southern DownsRegional Council bounds current to 2017.
Setting the above SA2 regions as the destination of “Southern Downs”, visitation data was sourced for thefollowing aspects:
• Visitor numbers and nights• Visitor demographics
• Age• Origin• Travel Party Type• Preferred transport• Accommodation usage
• Purpose of visit• Visitor activities• Seasonality• Visitor Spend (which was sourced from TRA’s Tourism Satellite Account).
In order to gain insight into the region’s performance and market characteristics, the same marketanalysis methodology was applied to the neighbouring Toowoomba, Goondiwindi, Scenic Rim, Tenterfieldand the Western Downs council areas, as well as the broader Southern Queensland Country Region(SQRC).
Additionally, the areas of visitor numbers, nights and spend for all SDRC markets (domestic day, domesticnight and international) have been utilised as the foundation for forecasting until 2023 utilising TourismForecast Review Panel’s forecasts for the tourism industry within Queensland and Australia. Theforecasting percentages applied relate to regional Queensland’s future expected performance. It shouldbe noted that all data in this report is based on Financial YE June 2017 data sourced from TRA, and as suchis subject to change and readjustment by TRA based on survey data releases.
7

Southern Downs Market Research : January 2018
2. Methodology
Brand/Destination AwarenessHistorically the region has been promoted under a range of sub-regional and regional brand names andmarketing areas including Southern Queensland Country and Granite Belt.
To help inform future marketing investment, it was necessary to gain a clear perspective on thedestinations and brand names/ tourism areas having greatest awareness and interest in taking a trip tothe Southern Downs area.
Gaining this type of information at local level is challenging as most research of this type is traditionallyundertaken at regional and State levels. Data sources such as the Holiday Tracking Survey (Roy Morgan)potentially provide regional level data, as does’ TEQ’s brand health survey, but local level information isabsent.
At local level, utilisation of Google analytics (frequency of search terms) can provide a useful, albeit crudeindicator of interest in searching for information on an area/different destination names, however it ischallenging to relate this specifically to tourism/visitor economy interests.
Therefore the approach taken in this study was as follows;
1. A context for Southern Downs was provided by analysis of brand health of Southern QueenslandCountry
2. Conducting a 2,500 Google panel survey of South East Queensland and Northern NSW residents,covering;• Intention to visit the region in the next 12 months• Profile/awareness of the region’s key destinations, attractions and attributes• Awareness of region as a leisure/holiday destinations, testing an identified range of regional and
local destination names and brands• Southern Downs• Southern Queensland Country• Warwick• Stanthorpe
3. The survey touched 8,000 respondents, prior to filtering questions on origin of visitors and age/sex,selected 2.500 respondents
4. After pilot testing, the survey was in market from 14th December 2017 to 31st December 2017.
8

Southern Downs Market Research : January 2018
3. Destination/ Brand Awareness
9

Southern Downs Market Research : January 2018
3. Destination/ Brand Awareness
Context: Southern Queensland CountrySouthern Queensland Country is the newest of Queensland’s thirteen tourism regions, but provides anessential forum for ensuring that the region’s constituent parts are profiled via Tourism and EventsQueensland’s marketing investment, and at international level via Tourism Australia’s marketing andcommunications platforms.
Brand Equity Index (BEI) provides a means of relative measurement of tourism brand health – it iscalculated based on consumers’ responses to their favourite brand, brand that they would recommend,and willingness to pay higher prices. Figures 3 and 4 shows that SQC has an BEI of 0.8 - at the lower end ofthe scale of Queensland’s tourism regions. Scores of 3.1-5 are regarded as strong.
10
Figure 3: Southern Queensland Country Brand Equity Index (Source TEQ)

Southern Downs Market Research : January 2018
3. Destination/ Brand Awareness
11
Figure 5: Brand Relationship Summary - Queenslanders
Figure 4: Queensland Region BEI Trends (Source: TEQ)

Southern Downs Market Research : January 2018
3. Destination/ Brand Awareness
12
Figure 6: Brand Relationship Summary - Interstate Visitors
Figure 6: Prompted Destination Marketing Awareness (Source TEQ)

Southern Downs Market Research : January 2018
3. Destination/ Brand Awareness
Context: Southern Queensland CountryRegional brand awareness, consideration and recommendation for SQC among the interstate visitormarket is higher than for intrastate markets. SQC is ranked towards the lower end of the scale on bothmeasures.
Destination marketing awareness scores for SQC place it in a similar ranking with other BEI measures –intrastate awareness is higher than is the case for interstate markets - in this regard, the region is on asimilar footing to other Queensland regions such as Outback and Townsville. Intention to visit dataindicates a more positive picture, placing the region above a number of other Queensland regions.
13
Figure 7: Destinations intended to visit in the next 12 months (Source TEQ)
Implications for Southern DownsThe Southern Queensland Country ranks towards the bottom of regional brand health indicators. This is not an indicator of poor delivery performance, but does show the challenge of gaining traction in he marketplace. Overall health is influenced by a range of factors including; longevity as a brand, levels of marketing investment, attractiveness as a leisure destination etc.
• While awareness and recognition levels are relatively low - they are notably higher among interstate visitors markets compared with intrastate markets elsewhere in Australia
• The SQC umbrella provides an essential means of ensuring that the region and its constituent destinations gains profile on State-wide and international platforms - in addition to experience-led approaches, TEQ’s approach is built around the concept of tourism regions.

Southern Downs Market Research : January 2018
3. Destination/ Brand Awareness
Southern Downs Destination Research: AwarenessA question was posed to the survey panel regarding awareness of brand names and destinations. Resultsare shown in figure 8, below. Stanthorpe and Warwick recording the highest familiarity levels followed byGranite Belt and Southern Queensland Country. The name ‘Southern Downs’ had the lowest familiaritylevels at 18% of respondents. The most significant result was that nearly half (48%) of all respondentswere not familiar with any of the destination names or brands, whether local or regional.
14
Figure 8: Familiarity with Southern Downs ‘Holiday Destinations (Source: EarthCheck Google Panel Survey)
Implications for Southern DownsGiven the target audience for the survey which reflected key Southern Downs visitor markets, familiarity and recognition for all search terms was relatively low. Familiarity was highest for Stanthorpe, followed by Warwick.
• Relatively low familiarity levels can have their roots in two principal areas – limited presence in market (level/impact of marketing investment, and lack of high profile tourism product (events, attractions, experiences, landscapes , signature experiences etc) that visitors associate with the region.
• ‘Southern Downs’ showed lowest recognition levels as a familiar holiday destination, inferring that future marketing investment should not focus on this option - the scale and consistent investment of resources needed to ‘shift’ the market is unlikely to represent good returns on investment.

Southern Downs Market Research : January 2018
3. Destination/ Brand Awareness
Southern Downs Destination Research: Triggers for Recognition and AwarenessSurvey respondents were asked to indicate which experiences (from a prepopulated list of options) theythought about first for the region. Results are summarised in figure 9, below. Wineries were clearlyidentified as the experience at the forefront of most visitors’ minds, (38%),followed by GirraweenNational Park. Queen Mary Falls, the Apple and Grape Festival, snow in Queensland and Warwick Rodeogenerated lower scores. 18% of respondents did not associate any of the listed experiences with theregion.
15
Figure 9: Familiarity with Southern Downs ‘Holiday Destinations (Source: EarthCheck Google Panel Survey)
Implications for Southern Downs• Wineries were clearly identified as the stand out trigger set of experiences associated with the region,
inferring that they should continue to feature prominently in marketing initiatives
• Nearly 20% of respondents were unfamiliar with any of the experiences, again inferring a lack of standout signature experiences which generate familiarity or interest in the marketplace. Building investment in facilitating new product and building signature experiences is an option for Council to consider
• Prominence of wineries achieves good alignment with SQC’s hero experiences and TEQ’s emerging positioning on food and drink experiences.

Southern Downs Market Research : January 2018
3. Destination/ Brand Awareness
Southern Downs Destination Research: Intention to visitApproximately 30%-40% of respondents indicated that they were unlikely to visit the region in the nexttwelve months. However 24% of respondents indicated a strong likelihood (scores of 8 to 10) of visitingin the next 12 months. This a positive statistic from a group of respondents who are representative of akey visitor market for the Southern Downs region.
16
Figure 10: Intention to visit the region in the next 12 months (Source: EarthCheck Google Panel Survey)
Implications for Southern Downs• Intention to visit responses are relatively encouraging (circa 25% of respondents). With regard to
the 30%-40% very unlikely to visit, it is important to recognise that awareness of the region does not necessarily infer interest or intent to visit.
Southern Downs Market Research : January 2018
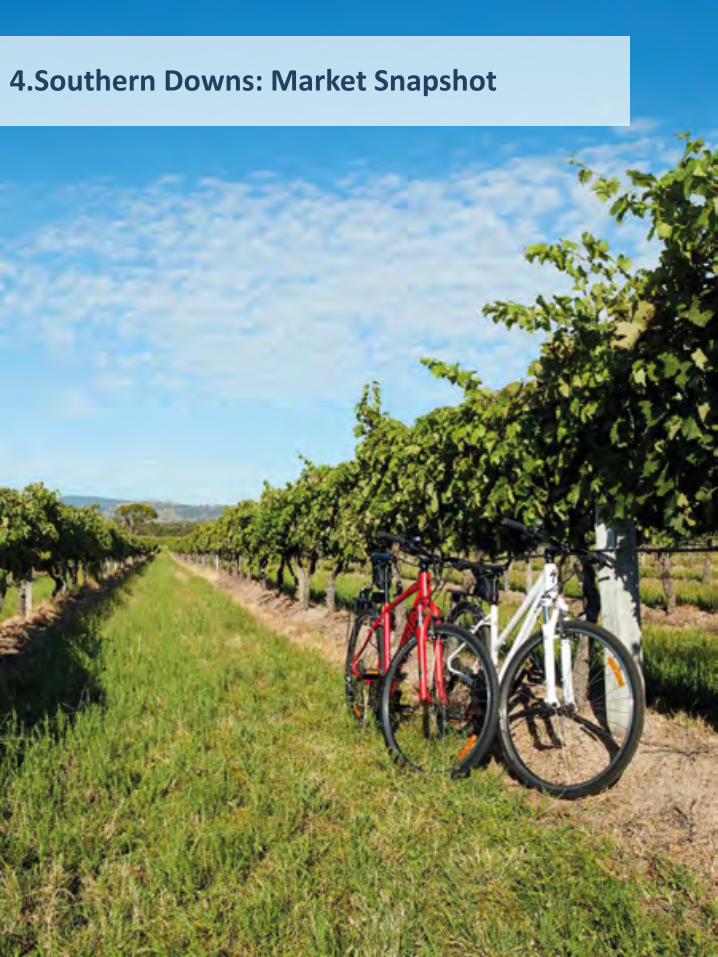
4.Southern Downs: Market Snapshot
17

Southern Downs Market Research : January 2018
Southern Downs Market Research 2016/17
Visitors usually travel as an adult couple
822,294 visitors in 2016-17 1.28 million domestic visitor nights
99% of visitors self-drive to Southern Downs 54% of visitors are Day Visitors
Only 1% of visitors are International* Visitors
50% of visitors are from Brisbane, 38% are from elsewhere in the Southern Queensland Country Region
Overall visitor expenditure is worth approximately $99 million
Half of visitors are aged 50+
Common activities include dining out at restaurants and cafes (17%) and visiting friends and relatives (17%) and visiting national parks (7%)
47% are on Holiday, while 33% are travelling with the main purpose of visiting friends and relatives
Southern Downs Regional Council is an area defined by its landscape; proudly hosting all four seasons andhome to the coldest place in Queensland, the region has a breathtaking range of vistas and a reputation forquality produce against a background of culture and heritage which makes it attractive as a destination.
Southern Downs Regional Council (SDRC) commissioned EarthCheck to undertake an analysis of the currentvisitor economy and tourism market to provide a picture of the current market trends in SDRC, and tobenchmark its performance against the wider Southern Queensland Country Region (SQCR). This analysisrevealed key target markets, visitor demographics and included forecasts for visitors, visitor nights andvisitor expenditure to 2023. This is intended to provide SCRC with an informed snapshot of tourism industryperformance within SDCR, how the area compares to its peer group, and to highlight growing markets forpotential focus in the coming years.
Southern Downs Tourism Snapshot:
18
*SDRC’s international cohort is largely made up of long-stay, working holiday backpackers with low spending habits

Southern Downs Market Research : January 2018
5. Southern Downs: Visitor Profile and Market Analysis
19

Southern Downs Market Research : January 2018
5.1 Current Visitor Economy: Visitor Trends
-
100,000
200,000
300,000
400,000
500,000
600,000
700,000
2006
-07
2007
-08
2008
-09
2009
-10
2010
-11
2011
-12
2012
-13
2013
-14
2014
-15
2015
-16
2016
-17
Domestic Day Domestic Overnight International
+8% p.a.
+5% p.a.+0.2% p.a.
Figure 11: Visitation trends by market within SDRC 2006-07 to 2016-17
In the past decade, the SDRC area has experienced fluctuations in domestic visitation, ranging from a low of442,264 total visitors in 2007/08 to a peak of 986,394 total visitors in 2009/10. As is illustrated in Figure 11,below, the largest and most variable market is the domestic day market. Despite this variability, domesticday visitation has increased by an average of 8% per annum since 2006/07, with the peaks and troughsappearing to ease in the later part of the decade.
Each market has experienced modest overall growth, the greatest of which was exhibited by the domesticday market (8%p.a.), followed by 5% average per annum growth in the domestic overnight market, and asmall increase of 0.2% average growth per annum in the international* market.
Visitation in 2016/17 of 822,294 visitors comprised; domestic day visitors (54%), followed by domesticovernight visitors (45%) and a small number of international* visitors (1%). Overall, there were anadditional 312,521 visitors in 2016/07 than there were in 2006/07 - an average of 6% per annum.
International* visitor nights have also increased, albeit from a small base, with an average annual growthof 3% since 2006/07.
Despite declining by an average of 1% per annum in the period between 2006/07 and 2016/17, domesticvisitor nights to the region have subsequently grown, resulting in 776,5777 nights in 2016/17 in comparisonto 824,741 in 2006/07.
20
*SDRC’s international cohort is largely made up of long-stay, working holiday backpackers with low spending habits

Southern Downs Market Research : January 2018
5.1 Current Visitor Economy: Visitor Trends
Visitation to the Southern Queensland Country Region (SQC), has seen lower levels of year on year visitationvariation (Figure 13, below).
- 500,000
1,000,000 1,500,000 2,000,000 2,500,000 3,000,000 3,500,000 4,000,000 4,500,000
2006
-07
2007
-08
2008
-09
2009
-10
2010
-11
2011
-12
2012
-13
2013
-14
2014
-15
2015
-16
2016
-17
Domestic Day Domestic Overnight International
+4% p.a.
+4% p.a.
+1% p.a.
Figure 13: Visitation to SQC 2006/07-2016/17
- 100,000 200,000 300,000 400,000 500,000 600,000 700,000 800,000 900,000
1,000,000
2007
-08
2008
-09
2009
-10
2010
-11
2011
-12
2012
-13
2013
-14
2014
-15
2015
-16
2016
-17
Domestic Overnight International
Figure 12: Visitor nights by market within SDRC 2006-07 to 2016-17
-1% p.a
+3% p.a
However, as seen in Figure 14 (over page), SQC demonstrates a different visitor nights pattern to SDRC. Nightsto the region have increased at a significantly higher rate than those to the SDRC area, with SQC experiencingan average 10% increase p.a. of international* nights, with significantly less variation year-on-year.
21
*SDRC’s international cohort is largely made up of long-stay, working holiday backpackers with low spending habits

Southern Downs Market Research : January 2018
5.1 Current Visitor Economy: Visitor Trends
The variability in visitor nights to Southern Downs has had an impact on visitor Average Length of Stay (ALoS).ALoS in a region can be indicative of several factors:
• Visitor reason for visit• Attractiveness of tourism offerings and activities which entice longer stays• Whether there is an industry which employs visitors short-term.
For SDRC, the current ALOS for domestic overnight visitors is 2.1 days, a number which increases to 46.4 daysfor international* visitors to the region. From these figures it can be inferred that domestic overnight visitorsare usually short-break visitors, while international visitors likely partake in local industry such as fruit picking,skewing the ALOS to a much higher number than is usually seen for leisure visitors. As can ben seen in Figure15, below, domestic overnight ALOS has remained fairly consistent since 2006-07, while international ALOShas increased quite significantly, reflecting the increase in nights seen in Figure 12, as well as the consistentvisitor numbers in Figure 13.. ALoS for the SQC region is 3 nights for domestic visitors, and 28.9 forinternational visitors, indicating that SDRC has a lower domestic ALoS but a higher international ALoS than thebroader region.
010203040506070
2006-07 2007-08 2008-09 2009-10 2010-11 2011-12 2012-13 2013-14 2014-15 2015-16 2016-17
Domestic Overnight International
Figure 15: Average Length of Stay (ALOS) in SDRC 2006-07 to 2016-17
-1% p.a
+25% p.a
-
1,000,000
2,000,000
3,000,000
4,000,000
5,000,000
6,000,000
2006-07 2007-08 2008-09 2009-10 2010-11 2011-12 2012-13 2013-14 2014-15 2015-16 2016-17
Domestic Overnight International
+4% p.a.
+10% p.a.
Figure 14: Night to SQC 2006/07 to 2016/17
22*SDRC’s international cohort is largely made up of long-stay, working holiday backpackers with low spending habits

Southern Downs Market Research : January 2018
5.1 Current Visitor Economy: Visitor Trends
Average length of stay (ALoS) is intrinsically related to visitor spend, as this is normally calculated on a per-night basis. Increasing ALoS of domestic visitors is linked to increased expenditure as it includes visitorspend related to accommodation, activities and food and beverage.
Average visitor expenditure per night/day in 2016 for Southern Downs was $108 for domestic day visitors,$132 for domestic overnight visitors and $35 for international* visitors. Applying CPI to this results in anapproximate current visitor spend of $108.86 for domestic day visitors, $136.88 for domestic overnightvisitors, and $36.51 by international visitors. ALoS can also affect visitor spending habits: it is likely that theextended ALOS for international visitors (workers, students etc) has resulted in the lowest spend per nightout of the market groups.
A percentage breakdown of expenditure is shown in Figure 16. Out of the total expenditure pool of justover $99 million, international visitors due to their small spend and low visitor proportions make up lessthan 1% (please note that percentages in Figure16 are rounded to the nearest whole number). In realterms, international expenditure for 2016/17 was less than $400,000, while the larger markets of domesticday ($48.3 million) and domestic overnight ($50.2 million) had very similar expenditures despite adifference in visitor numbers which can be attributed to the number of visitor nights and a higher visitorspend for overnight visitors.
49%
51%
>1%
Domestic Day Domestic Overnight International
Figure 16: A breakdown of total visitor expenditure by market 2016/17
23
*SDRC’s international cohort is largely made up of long-stay, working holiday backpackers with low spending habits

Southern Downs Market Research : January 2018
5.2 Current Visitor Economy: Demographics
Visitor demographics are integral to discovering the attributes, preferences and behaviours of targetmarkets. Establishing key trait and preferences can allow tourism offerings to be adapted to become moreattractive to target markets, increasing visitor length of stay, promoting visitor spend and maximisingtourism.
Figure 17, below, outlines visitor numbers per age group for all markets. This demonstrates that acrossboth domestic markets, there are common age groups which visit SDRC with more frequency that others.Overwhelmingly this illustrates that across both domestic markets, the 55+ age group holds the largestshare (48% for domestic day visitors, and 33% for domestic night visitors), with the next most commonvisitor being aged between 30-34 (for domestic day visitors at 14%) and 40-44 (for domestic night visitorsat 15%).
-
50,000
100,000
150,000
200,000
250,000
15-19 20-24 25-29 30-34 35-39 40-44 45-49 50-54 55+
Domestic Day Domestic Night International
Figure 17: Age groups for all markets to SDRC 2016/2017
A further analysis of age spread across all markets can be seen in Figures 8, 9 and10, over the page.
24

Southern Downs Market Research : January 2018
5.2 Current Visitor Economy: Demographics
- 50,000
100,000 150,000 200,000 250,000
Domestic Day Visitors
-
1,000
2,000
3,000
International Visitors
-
50,000
100,000
150,000
Domestic Overnight Visitors
Figure 18: Age spread of Domestic Day Visitors to SDRC 2016/17
Figure 19: Age spread of Domestic Overnight Visitors to SDRC 2016/17
Figure 20: Age spread International Visitors to SDRC 2016/17
Figures 18, 19 and 20, to the right, illustrate ingreater detail the individual age spread withineach market. There are significant differencesin the age profile between each market,markedly between both of the domesticmarkets and the international* market.
Domestically, the age profile of visitors isweighted more heavily towards the older agegroups, although the overnight market ismore stable across all age groups whichindicates a wider appeal in the overnightmarket. The international market shows aweighting towards younger age groups, withthe largest proportion of international visitorsaged between 25-29 (25%). Proportionally,the 55+ age group is also significant to theinternational market, with 20% ofinternational visitors falling into this agegroup.
Collectively, the age breakdown of visitorsacross all markets is as follows:• 15-19: 5%• 20-24: 2%• 25-29: 7%• 30-34: 13%• 35-39: 4%• 40-44: 9%• 45-49: 9%• 50-54: 11%• 55+: 41%
25
*SDRC’s international cohort is largely made up of long-stay, working holiday backpackers with low spending habits

Southern Downs Market Research : January 2018
5.3 Current Visitor Economy: Origin of Visitors
- 100 200 300 400 500 600 700 800
New South WalesVictoria
QueenslandSouth Australia
Western AustraliaTasmania
Northern TerritoryACT
ThousandsDomestic Day Domestic Night
Figure 21: Origin by State for both Domestic Day and Overnight visitors to SDRC 2016/17
As can be seen in Figure 21, below, domestic visitors to Southern Downs for both Domestic Day andDomestic Overnight markets are predominately from Queensland (90% of all domestic visitors). Overnightvisitors are predominately from Queensland (86%), with an additional 15% from New South Wales and 2%from Victoria.
Interstate visitors (see Figure 22, below) are sourced from two major regions - for day visitors, halforiginate from elsewhere in the Darling Downs, and just under half (42%) travel from the Brisbane region.Both Brisbane and the Darling Downs remain the largest source markets for overnight visitors (61% fromBrisbane, 20% from elsewhere in the Darling Downs).
The Brisbane market across both overnight and day visitors has experienced an average 6% per annumgrowth since 2006/07.
-
50
100
150
200
250
Thou
sand
s
Domestic Day Domestic Night
Figure 22: Source markets for Domestic visitors to SDRC from within Queensland
26

Southern Downs Market Research : January 2018
In terms of the total number of trips from Brisbane to the region;
• Overnight visitors from Brisbane made a total of 647,639 trips to SQC in 2016/17. Southern Downsreceived 23% of these visitors, with approximately 146,000 visitors from Brisbane (average growth of6% p.a.)
• Day Visitors from Brisbane made 1.3 million trips in SQC in 2016/17. Southern Downs captures 14% ofthis market (180,328 trips). This market to the region has declined by 7% since 2012/13.
-
500
1,000
1,500
2,000
2,500
Figure 23: International source markets for visitors to SDRC 2016/17
International visitors to Southern Downs travel from a range of different countries, as illustrated in Figure23*.
The top 5 source markets are:
• New Zealand (20%)• Taiwan (20%)• Germany (10%)• United States of America (9%)• Thailand (7%)
Although based on small sample sizes, date suggests strong growth from New Zealand has experiencedsignificant growth (an average change per annum of 15% since 2006/07, but an average increase of 12%per annum since 2011/12).
5.3 Current Visitor Economy: Origin of Visitors
27
*SDRC’s international cohort is largely made up of long-stay, working holiday backpackers with low spending habits

Southern Downs Market Research : January 2018
5.4 Current Visitor Economy: Purpose of VisitViewed collectively, the main purpose of visit for visitors to Southern Downs is for Holiday (47%), followed byVisiting Friends and Relatives (33%), Business (12%) and “Other” (8%) which includes employment andeducation or an unspecified purpose.
Domestic day visitors maintain this trend, with just overhalf visiting Southern Downs for Holiday purpose, 35%to Visit Friends and Relatives, 75 to do Business and 9%for “other” reason.
Domestic Overnight visitors show a higher preferencetowards Business trips (18%), a stable preference forVisiting Friends and Relatives (33%) and smallerpreference for each of the remaining purposes whencompared to Day visitors.
International* visitors show similar preference to thedomestic market for Visiting Friends and Relatives(34%) and Holiday (47%), but less preference forBusiness and a greater preference for “Other”, whichcan be broken down into 2% for Education and 7% forEmployment purposes.
Holiday51%
Visiting friends
and relatives
33%
Business7%
Other reason
9%
Domestic Day
Figure 24: Domestic Day Purpose
Holiday44%
Visiting friends
and relatives
33%
Business18%
Other reason
5%
Domestic Overnight
Figure 25: Domestic Overnight Purpose
Holiday47%
Visiting friends
and relatives
34%
Business4%
Other reason
15%
International
Figure 26: International Purpose
28*SDRC’s international cohort is largely made up of long-stay, working holiday backpackers with low spending habits

Southern Downs Market Research : January 2018
5.5 Current Visitor Economy: Visitor Activities
The most common activity group for visitors to Southern Downs are ‘social activities’ (eating and drinking),with 55% of domestic day, 43% of domestic overnight and 25% of international* visitors all undertaking someform of social activity during their visit.
As can be seen in Figure 19, the next most popular activity group is Outdoor/Nature activities, with 17% ofdomestic day, 17% of domestic overnights and 22% of international visitors undertaking activities such asvisiting national parks and state parks, bushwalking, fishing, or going on BBQ’s and picnics.
Tourism Australia has organised activities into themed market segments which relate to target markets, thefull list of activities in each segment can be viewed in Appendix 1. Figure 28, below, outlines the total numberof activities undertaken by visitors to SDRC within these market categories, and illustrates the average changeper year since 2012/13 for each of the market segments.
- 50,000
100,000 150,000 200,000 250,000 300,000 350,000 400,000
Outdoor/nature ActiveOutdoor/Sports
Arts/Heriatge Localattractions/tourist
activities
Social activities
Domestic Day Domestic Overnight International
Figure 27: Activities undertaken in SDRC by market 2016/17
Tourism Australia Segment Number of Activities undertaken Average change p.a. since 2006/07
Food and Wine 195,925 -3%
City 1,045,113 -2%
Sport and Adventure 108,807 +22%
History and Culture 114,395 +34%
Natural Beauty and Wildlife 365,295 +15%
29Figure 28 : Activities undertaken in SDRC by TA Segment in 2016/17
*SDRC’s international cohort is largely made up of long-stay, working holiday backpackers with low spending habits

Southern Downs Market Research : January 2018
5.5 Current Visitor Economy: Visitor Activities
As can be seen in Figure 28, there has been a significant growth visitors undertaking “Sports and Adventure”activities, “History and Culture” activities and Natural Beauty and Wildlife” activities. Each of these havegrown by an average of 22%, 34% and 15% per annum respectively since 2012/013. These 3 activity marketsegments also make up almost a third of all activities undertaken in 2016/17.
“City” based activities, which include activities such as guided tours, visiting friends and relatives, shoppingfor pleasure and dining out and visiting pubs make up the largest proportion of activities at 54% of allactivities, but has experienced an average of a 2% decline per annum since 2012/13. “Food and Wine”activities make up 10% of all activities undertaken, and has experienced an average 3% per annum decline inthe last five years.
Figure 29, below, illustrates the range of current tourism products which may encourage activities withindifferent market segments.
Product Regionally Significant State Significant Nationally Significant
Apple & Grape Festival X
Memorial Parks X
Cunningham’s Gap National Parks X X
Darling Downs Zoo X X
Stanthorpe Heritage Museum X
Wineries and Tours X
Australian Rodeo Heritage Centre X
Lawdogs Australia X
Speedway Races X
Horse Racing and Pollocrosse X
Figure 29: Reach of tourism products within SDRC
30

Southern Downs Market Research : January 2018
5.6 Current Visitor Economy: Seasonality
- 10,000 20,000 30,000 40,000 50,000 60,000 70,000
Domestic Day Domestic Overnight
Figure 30: 5-year average of domestic visitor seasonality in SDRC
Visitation to Southern Downs is reasonably consistent across the calendar despite the climatic seasonalityexperienced throughout the region. Only December shows a significant dip in overnight visitation. Figure 30,below, is an average of monthly visitation to the region for the years 2012/13-2016/17. An average was takento smooth anomalies and to provide a more consistent picture of visitor seasonality to Southern Downs.
Figure 30 reveals that July is consistently the most popular month for visiting Southern Downs for bothdomestic day and domestic overnight visitors: 12% of each market visit during this month. Similar overalltrends are experienced in the Southern Queensland Country region (Figure 31).
- 100,000 200,000 300,000 400,000
Domestic Day Domestic Overnight
Figure 31: 5 year average of visitor seasonality within SQC
31

Southern Downs Market Research : January 2018
5.7 Current Visitor Economy: Short-Break Behaviour
“Short-Break” refers to overnight visitors who remain in region for 1-3 nights. For Southern Downs, this is anessential market segment as 70% of all visitors fall into this category, as illustrated by Figure 32, below. Thelargest proportion of visitors stay for 2 nights, followed by single night visitors and 3 night visitors.
-
10,000
20,000
30,000
40,000
50,000
60,000
70,000
Sunday Monday Tuesday Wednesday Thursday Friday Saturday1 night 2 nights 3 nights
Figure 33: 5-year average of domestic overnight
0%5%
10%15%20%25%30%35%
1 night 2 nights 3 nights 4 - 7 nights 8 - 14 nights 15 - 30 nights 31 or morenightsFigure 32: 5-year average of length of visit proportions for overnight visitors to SDRC
Each segment within the short break categories display different behaviours in terms of days of preference.Figure 33, below, illustrates the day of return for each of the market segments (over a 5 year average).
32

Southern Downs Market Research : January 2018
5.8 Current Visitor Economy: Forecasts
Tourism Research Australia releases expected forecasts for Australia’s tourism market on an annual basis,based on a range of factors which are expected to affect travel patterns and visitor spend in each market.Figure 34, below, demonstrates an approximation of Southern Downs visitor numbers beyond 2016/2018based on the most recent forecasting data at the time of writing. These figures cannot account forunexpected variability in visitor patterns, and also do not assume that there is an increase each year.Based on these figures as a baseline, Southern Downs can potentially expected an additional 252,900visitors in 2026, a market with similar visitor proportions to now (55% domestic day, 43% domesticovernight, 2% international*) should ALoS remain consistent and the area follows growth trends forregional Queensland.
-
100,000
200,000
300,000
400,000
500,000
600,000
700,000
Domestic Day Domestic Overnight International Forecast
Figure 34:: Historical and forecasted visitor numbers for SDRC to 2026/27
Following this approach, Figure 35 (over page) outlines the potential additional visitors for differentmarket segments within SDRC based on a “business as usual” projection. Unless otherwise specified, allprojections are based on combined domestic markets (i.e. overnight and day) due to their marketdominance. As the forecasting rates are adjusted annually, these should be utilised as indicative figuresonly. Additionally, while some can be viewed as discrete segments (such as Domestic Day, Overnight andInternational), most markets overlaps (some visitors fall into both domestic overnight and holiday purposecategories) and as such they should not be considered cumulative as this may cause duplication and over-projecting.
33
*SDRC’s international cohort is largely made up of long-stay, working holiday backpackers with low spending habits

Southern Downs Market Research : January 2018
5.8 Current Visitor Economy: Forecasts
Market Segment Forecasted Additional Visitors
Domestic Day +146,482
Domestic Overnight +98,189
1 night (Domestic) +25,674
2 nights (Domestic) +27,765
3 nights (Domestic) +16,922
International* +8,248
Visiting Friends and Relatives +79,750
Holiday +115,869
Business +28,117
Nature Based +76,773
Adventure Based +38,126
Arts and Heritage Based +25,617
Figure 35: Potential Additional visitors per market segment for SDRC in 2026/27
34
*SDRC’s international cohort is largely made up of long-stay, working holiday backpackers with low spending habits

Southern Downs Market Research : January 2018
5.9 Benchmarking
Benchmarking is useful tool to establish a baseline level of performance in key metrics against a series ofcomparable or neighbouring regions. In order to establish snapshot of performance for SDRC, neighbouringregions - Toowoomba, Goondiwindi, Western Downs, Scenic Rim and Tenterfield were identified as in-regioncomparators.
A brief overview can be found in Figure 36, below.
VISITORS (% OF SQC)
HOBART13%5% 15% 55%
G’indi West SDRC T’ba
Avg. Length of Stay(ALOS)
HOBART14 Days8 Days 17 Days 24 Days
Avg. Spend per Night($)
HOBART$102$63 $82 $91
G’indi SDRCT’baWest
West T’ba
Figure 36: A overview of in-region peer groups
G’indi West SDRC
35

Southern Downs Market Research : January 2018
5.9 Benchmarking: Market Overview
Market Overview: Benchmarks
Region Market Share of SQCR Average change p.a. since 2006/07
SDRC 15% +6%
Goondiwindi 5% +0.2%
Toowoomba 55% +4%
Western Downs 13% +2%
Figure 37 (below) illustrate that Southern Downs holds a growing market share of the SQC visitor economy,with a higher growth rate than other in-region areas.
36
Figure 37: Market share of SQC Region
- 1,000,000 2,000,000 3,000,000 4,000,000 5,000,000 6,000,000
2006
-07
2007
-08
2008
-09
2009
-10
2010
-11
2011
-12
2012
-13
2013
-14
2014
-15
2015
-16
2016
-17
SDRC Scenic Rim Goodiwindi Toowoomba Western Downs Tenterfield SQCR
+6%p.a +8%p.a +0.2%p.a +4%p.a +2%p.a -4%p.a +4%p.a
Figure 38: Comparative total visitor growth 2006/07 to 2016/17
Region Market Share of SQC Average change p.a. since 2006/07
SDRC 19% +3%
Goondiwindi 7% +10%
Toowoomba 47% +5%
Western Downs 18% +9%
Figure 39: Market share and growth of nights

Southern Downs Market Research : January 2018
5.9 Benchmarking
Demographics
Across all of the peer group regions, the 55+ age group is the most common, dominating age profiles withan average of over 40% of all visitors falling into this age group. Despite this commonality, there are anumber of differences in age profiles between regions. Southern Downs aligns with the broader SQCregion in terms of rough age profile structure, if not numbers. Most of the peer group follow this generalstructure, with slight variations.
-
100
200
300
400
Thou
sand
s
Southern Downs
-
500
1,000
1,500
2,000
Thou
sand
s
SQC
- 100 200 300 400 500
Thou
sand
s
Scenic Rim
-
50
100
150
Thou
sand
s
Goondiwindi
Figure 40: Age profile of SDRC Figure 41: Age profile of SQCR
Figure 42: Age profile of Scenic Rim Figure 43: Age profile of Goondiwindi
37
Southern Downs Market Research : January 2018
5.9 Benchmarking
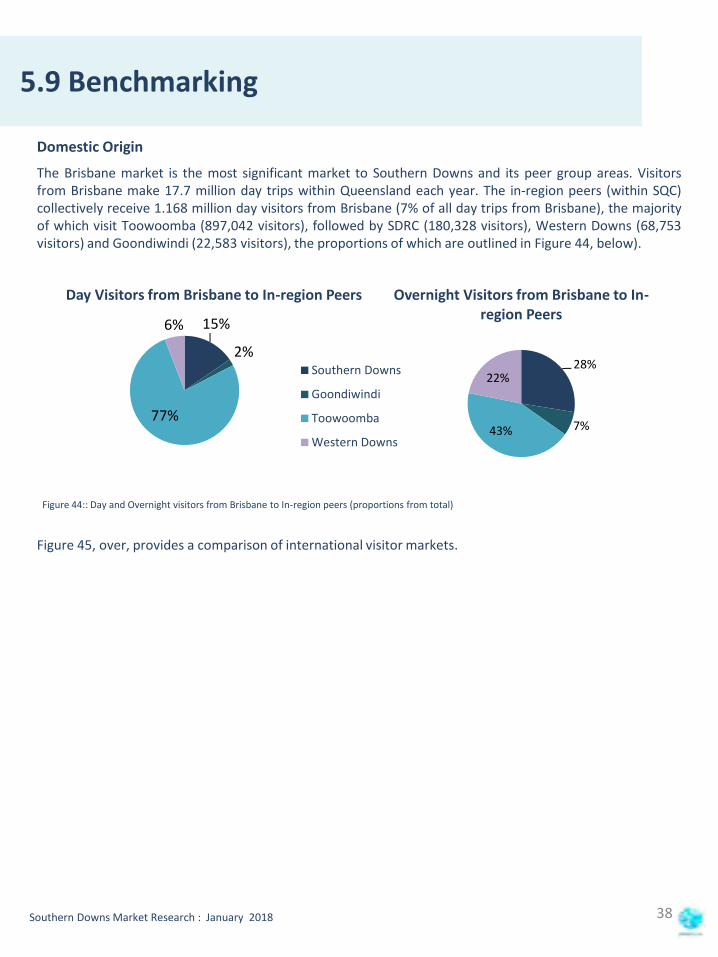
Domestic OriginThe Brisbane market is the most significant market to Southern Downs and its peer group areas. Visitorsfrom Brisbane make 17.7 million day trips within Queensland each year. The in-region peers (within SQC)collectively receive 1.168 million day visitors from Brisbane (7% of all day trips from Brisbane), the majorityof which visit Toowoomba (897,042 visitors), followed by SDRC (180,328 visitors), Western Downs (68,753visitors) and Goondiwindi (22,583 visitors), the proportions of which are outlined in Figure 44, below).
15%
2%
77%
6%
Day Visitors from Brisbane to In-region Peers
Southern Downs
Goondiwindi
Toowoomba
Western Downs
Figure 45, over, provides a comparison of international visitor markets.
28%
7%43%
22%
Overnight Visitors from Brisbane to In-region Peers
Figure 44:: Day and Overnight visitors from Brisbane to In-region peers (proportions from total)
38

Southern Downs Market Research : January 2018
5.9 Benchmarking
Region and Number of InternationalVisitors
Source Market Proportion of International Visitors
Southern Downs 10,941 international visitors
New Zealand 20%
Taiwan 10%
Germany 10%
United Kingdom 9%
Goondiwindi3,418 international visitors
United States of America 28%
United Kingdom 13%
Netherlands 10%
Scandinavia 8%
Toowoomba24,327 international visitors
New Zealand 18%
United States of America 16%
Taiwan 8%
United Kingdom 8%
Western Downs 5,970 international visitors
United States of America 26%
New Zealand 22%
United Kingdom 10%
Netherlands 5%
Scenic Rim14,389 international visitors
United Kingdom 20%
Germany 18%
New Zealand 10%
Scandinavia 7%
Tenterfield3,127 international visitors
France 23%
United Kingdom 22%
United States of America 21%
Scandinavia 9%
Southern Queensland Country46,272 international visitors
New Zealand 19%
United States of America 16%
United Kingdom 10%
Germany 6%
39Figure 45 : International visitor source markets

Southern Downs Market Research : January 2018
5.9 Benchmarking
0%10%20%30%40%50%60%70%
SouthernDowns
Goondiwindi Toowoomba WesternDowns
Scenic Rim Tenterfield SQCR
Holiday VFR Business Other
Purpose of Visit
Overall, Holiday and Visiting Friends are the dominant purpose of visits across all comparatordestinations.The changes in visitation structure across the comparator group are outlined in Figure 47, over thepage.
Figure 46: Comparative purpose of visit proportions for each peer group
40

Southern Downs Market Research : January 2018
5.9 Benchmarking
Region Purpose Segment Change since 2006/07
Southern Downs Holiday +8%
VFR +4%
Business +8%
Other +4%
Goondiwindi Holiday +5%
VFR +3%
Business -3%
Other +41%
Toowoomba Holiday +6%
VFR +5%
Business -1%
Other +4%
Western Downs Holiday -1%
VFR 0.1%
Business +12%
Other +11%
Scenic Rim Holiday +10%
VFR +4%
Business +35%
Other -3%
Tenterfield Holiday -7%
VFR +2%
Business +56%
Other Sample size too small
Southern Queensland Country Holiday +4%
VFR +4%
Business +2%
Other +7%
Figure 47: Growth in purpose segments for each peer group region
41

Southern Downs Market Research : January 2018
5.9 Benchmarking
Visitor Activities
Across most of the comparator areas, and in line with the broader SQC region, social activities (eating outetc) are the most popular, with outdoor and nature also featuring prominently.
As can be seen in Figure 49, over page, Scenic Rim has a similar range of ADTW listed product offerings.However, Western Downs has a markedly different range of offerings, particularly in terms of Art andHeritage, but a similar participation structure despite the disparity in offerings. Southern Downs has asignificantly larger set of Nature and Wildlife offerings, but level of Outdoor/Nature and ActiveOutdoor/Sports activity participation which is on par with Western Downs. .
0%
10%
20%
30%
40%
50%
60%
SouthernDowns
Goondiwindi Toowoomba WesternDowns
Scenic Rim Tenterfield SQCR
Outdoor/Nature Active Outdoor/Sports Arts/Heritage Local attractions Social activities
Figure 48: Comparative activity proportions
42

Southern Downs Market Research : January 2018
5.9 Benchmarking
ProductGrouping
SDRC Goondiwindi Toowoomba Scenic Rim WesternDowns
Tenterfield
Arts and Heritage
35 19 47 31 122 12
City 32 3 31 32 7 21Natural Beauty and Wildlife
33 8 19 33 19 19
Food and Wine 56 4 5 24 16 21Aquatic and Coastal
1 1 1 0 14 0
Sport andAdventure
33 5 1 16 30 4
Total 190 40 104 136 208 77
Product RegionallySignificant
State Significant Nationally Significant
Apple & Grape Festival X
Memorial Parks X
Cunningham’s Gap National Parks X X
Darling Downs Zoo X X
Tenterfield Saddler X
Girraween National Park X X
Australia’s Country Way X X
Gold Cup Campdraft X
Jumpers and Jazz in July X
Wineries X
Freshwater fishing X
Warwick Rodeo X
43
Figure 49: ATDW listed offerings within each peer group that align with Tourism Australia market segments
Figure 50: The reach of events and tourism offerings within SDRC

Southern Downs Market Research : January 2018
APPENDICES
44

Southern Downs Market Research : January 2018
Appendix 1
Southern Downs Market Research : January 2018Southern Downs Market Research : January 2018Southern Downs Market Research : January 2018
Coastal and Aquatic Go to the beachVisit the reefFishingScuba divingSnorkellingSurfingCharter boat / cruise / ferryVisit or stay on an islandGo whale or dolphin watching
Food and Wine Visit farmsGo to marketsVisit wineriesVisit breweries or distilleries (2016 onwards)Visit farmgates (2016 onwards)Picnics or BBQs
City Visit amusements / theme parksGo on guided tours or excursionsVisit a health spa / sanctuary / well-being centreVisit friends & relativesPubs, clubs, discos etcVisit casinosGo shopping for pleasureEat out / dine at a restaurant and/or cafeSightseeing/looking aroundMovies/videosAttend movies/cinema
Sport and Adventure GolfWater activities / sportsSnow skiingCyclingExercise, gym or swimmingPlay other sportsAttend an organised sporting event
History and Culture Attend theatre, concerts or other performing artsVisit museums or art galleriesVisit art / craft workshops / studiosAttend festivals / fairs or cultural eventsVisit history / heritage buildings, sites or monumentsExperience aboriginal art / craft and cultural displaysVisit an aboriginal site / communityTourist trains
Natural Beauty and Wildlife Visit national parks / state parksVisit botanical or other public gardensBushwalking / rainforest walksOther outdoor activities (no further detail) Visit wildlife parks / zoos / aquariums
Activities by Tourism Australia Market Segments
45