southwest alaska inventory and monitoring network (swan) february 22-25, 2011 anchorage, alaska...
TRANSCRIPT

SOUTHWEST ALASKA INVENTORY AND MONITORING NETWORK (SWAN)
February 22-25, 2011Anchorage, Alaska
SUMMARY OF PROCEEDINGS
Climate Change Planning in Alaska’s National Parks

OVERALL PROJECT BACKGROUNDFOCAL PARKSPARTICIPANTSWHAT IS SNAP?
PRE-WORKSHOP WEBINARSPRE-WORKSHOP READINGS
Part I:General Background

Overall Project Summary
Changing climatic conditions are rapidly impacting environmental, social, and economic conditions in and around National Park System areas in Alaska.
Alaska park managers need to better understand possible climate change trends in order to better manage Arctic, subarctic, and coastal ecosystems and human uses.
NPS and the University of Alaska’s Scenarios Network for Alaska Planning (UAF-SNAP) are collaborating on a three-year project that will help Alaska NPS managers, cooperating personnel, and key stakeholders to develop plausible climate change scenarios for all NPS areas in Alaska.


Parks and Sites
Aleutian WWII not included in assessment
Aniakchak
Lake Clark
Kenai Fjords
Katmai

Workshop Attendees[Note that some additional invited participants were unable to attend, but are still engaged
in the effort]
Amy Miller NPS I&M SWANAnna Schemper UAF SNAP GIS, notes, facilitationBill Schaff USFWS Refuge ManagerBrook Edwards Alaska Wildland Program DirectorCharles Frost ASLC Quantitative EcologistDavid Ward USGS Wildlife Biologist-- Migratory BirdsFritz Klasner NPS Resource Manager KEFJJeff Mow NPS Park Superintendant, KEFJJim Pfeiffenberger NPS I&E OASLC, Education Coordinator Kirk DeSermia NPS Maintenance KEFJ, Facilities ManagerLaura Sturz NPS I&E KEFJ, Interpretive Operations SupervisorMichael Shephard NPS Program Manager, I&M SWANSusan Flensburg BBNA Environmental Manager, NR managementBud Rice NPS AKRO, Environmental Protection SpecialistNancy Fresco UAF SNAP Network Coordinator, SNAP
Nancy Swanton NPS AKRO, Subsistence issues, Planning, Facilitation
Liz Oconnell Wondervisions Heading project to translate science to publicJoel Hard NPS Superintendant LACLJohn Morton USFWS From Kenai, FWS
Aaron Poe USDA FS Wildlife Biologist in Chugach Nat'l ForestDaniel Noon NPS Compliance & Planning SWANGreg Hayward USDA FS Regional Wildlife EcologistJeff Shearer NPS I&M SWANMary McBurney NPS Subsistence Program ManagerRalph Moore NPS Superintendant KATM
Randy Alvarez Community leaderLake and Peninsula Borough Assembly, past chairman of subsistence council, commercial fisherman
Ron Britton USFWS Wildlife Biologist-- Migratory BirdsTroy Hamon NPS Natural KATMBob Winfree NPS AKRODon Weeks NPS NRPCDon Callaway NPS AKRO, Cultural AnthropologistJohn Morris NPS AKRO, Interpretive Specialist

SNAP: Scenarios Network for Alaska Planning
What is most important to Alaskans and other Arctic partners? What changes are most likely? What changes will have the greatest
impact? What are we best able to predict? How can we adapt to those changes?
Scenarios are linked to SNAP models Climate models Models of how people use land and
resources Other models linked to climate and
human behavior
www.snap.uaf.edu

Understanding the Science of Climate Change
[See also ppt entitled “Understanding the Science of Climate Change: Climate drivers and climate effects”]
There is now unequivocal scientific evidence that our planet is warming
How this warming will affect climate systems around the globe is an enormously complex question
Uncertainty and variability are inevitable
Climate change presents significant risks to natural and cultural resources
Understanding how to address uncertainty is an important part of climate change planning
http://geology.com/news/labels/Global-Warming.html
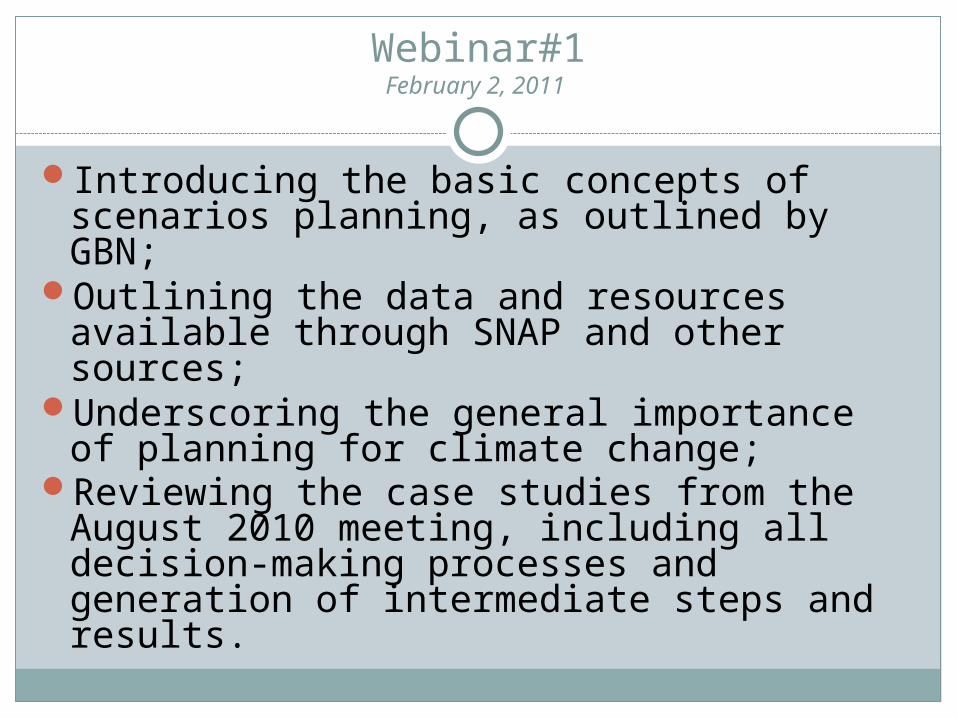
Webinar#1February 2, 2011
Introducing the basic concepts of scenarios planning, as outlined by GBN;
Outlining the data and resources available through SNAP and other sources;
Underscoring the general importance of planning for climate change;
Reviewing the case studies from the August 2010 meeting, including all decision-making processes and generation of intermediate steps and results.

Webinar#2February 9, 2011
Reminder of the role of climate drivers in the scenarios planning process
Overview of climate drivers for the Southwest Alaska park network
Discussion of a climate drivers table generated by John Walsh and Nancy Fresco
“Homework” assignments
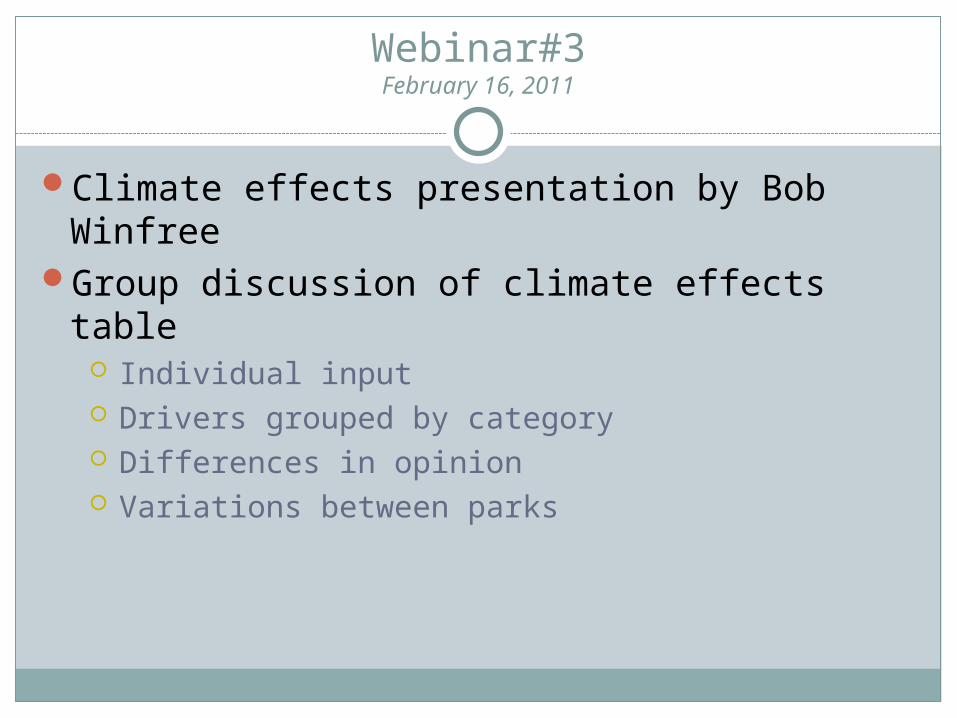
Webinar#3February 16, 2011
Climate effects presentation by Bob WinfreeGroup discussion of climate effects table
Individual input Drivers grouped by category Differences in opinion Variations between parks

Readings (pt. 1)
The Art of the Long View, emphasis on first 4 pages (pp. 3-6); User’s Guide (pp. 227-239); and Appendix (pp.241-248). These can all be read for free on Amazon at http://www.amazon.com/Art-Long-View-Planning-Uncertain/dp/0385267320in the page previews (“Click to Look Inside”)
SNAP one-page fact sheet (Tools for Planners) and link to website for optional browsing.
Detailed notes from the August meeting.

Readings (pt. 2)
Maritime and Transitional Talking Points, entire document, online at http://www.snap.uaf.edu/webshared/Nancy%20Fresco/NPS/Webinar%202%20SWAN/
Beyond Naturalness by David N. Cole and Laurie Yung entire book, but with a focus on pp. 31-33. This section is available for preview on Google Books. http://books.google.com/books?id=gfErgkCy0HkC&printsec=frontcover&cd=1&source=gbs_ViewAPI#v=onepage&q&f=false
Southwest Alaska Climate Drivers table online at http://www.snap.uaf.edu/webshared/Nancy%20Fresco/NPS/Webinar%202%20SWAN/

SNAP METHODSSNAP DATASNAP MAPS
NPS TALKING POINTS PAPERSCLIMATE DRIVERS CLIMATE EFFECTS
Part II:Data and Information Sources
(introduced during webinars)

Projections based on IPCC models
Calculated concurrence of 15 models with data for 1958-2000 for surface air temperature, air pressure at sea level, and precipitation
Used root-mean-square error(RMSE) evaluation to select the 5 models that performed best for Alaska, 60-90°N, and 20-90°N latitude.
A1B, B1 and A2 emissions scenarios
Downscaled coarse GCM data to 2km using PRISM

0.5 x 0.5 degrees to 2 x 2 km
GCM output (ECHAM5)Figure 1A from Frankenberg st al., Science, Sept. 11, 2009
CRU data and SNAP outputs after PRISM downscaling
Benefits of downscaling

SNAP data
TemperaturePrecipitation (rain and snow)Every month of every year
from 1900 to 2100 (historical + projected)
5 models, 3 emission scenarios
Available as maps, graphs, charts, raw data
On line, downloadable, in Google Earth, or in printable formats
Projected January temperatures, 1980 and
2099

SNAP complex linked models
Season lengthShifting plants and animals (biomes and
ecosystems)Soil temperature and permafrostWater availabilityForest fire
Soil temperature at one meter depth: 1980’s, 2040’s, and 2080’s (Geophysical Institute Permafrost Lab, UAF)

Summer precipitation 2000’s
Summer precipitation 2090’s

Winter temperatures 2000’s
Winter temperatures 2090’s

Freeze-up dates
Freeze dates 2000’s
Freeze dates 2090’s

Freeze-up dates
Unfrozen season 2000’s
Unfrozen season 2090’s, A2 scenario
Unfrozen season 2090’s, A1B scenario

NPS Talking Points Papers
Available for Alaska Maritime and Transitional and Alaska Boreal and Arctic
Provide park and refuge area managers and staff with accessible, up-to-date information about climate change impacts to the resources they protect
Talking Points have three major sections: a regional section that provides information on changes,
organized around seven types of impacts a section outlining No Regrets Actions that can be taken
now to mitigate and adapt to climate changes and a general section on Global Climate Change
arranged around four topics
Access these and other documents at http://www.snap.uaf.edu/webshared/Nancy%20Fresco/NPS/

Climate Drivers, a.k.a “Scenario Drivers Based on Climate”
[See also Climate Drivers xls tables for SWAN]
Climate Variable
General Change Expected
Specific Change Expected & Reference Period
Size of Expected Change Compared to Recent Changes
Patterns of Change Confidence Source & Context
Temperature Increase 2050: +3°C ±2° ; 2100: +5°C ±3°
Large More pronounced in north and in autumn-winter
>95% Very likely (for sign)
IPCC (2007) and SNAP/UAF
Precipitation Increase 2050: 10-25% ± 15%; 2100:20-50% ±20%
Large %’s greater in north, amounts greater in south
>90% very likely (for sign)
IPCC(2007) and SNAP/UAF
Relative Humidity
Little change 2050: 0% ±10%; 2100: 0% ±15%
Small Absolute humidity increases 50% About as likely as not
SNAP/UAF
Wind Speed Increase 2050: +2% ±4%; 2100: +4% ±8%
Small More pronounced in winter and spring
>90% (sign) Likely
Abatzoglou and Brown*
Pacific Decadal Oscillation (atmospheric circulation)
Decadal to multidecadal circulation anomalies affecting Alaska
Unknown Large (comparable to climatic jump in 1970s)
Major effect on Alaskan temperatures in cold season
Natural variation, essentially unpredictable
Hartmann and Wendler (2005, J. Climate)
Extreme Events: Temperature
Warm Events Increase / Cold Events Decrease
2050: increase 3-6 times present for warm events; decrease to 1/5-1/3 of present in cold events; 2100: increase 5-8.5 times present in warm events; decrease 1/12 to 1/8 of present in cold events
Large Increase in frequency and length of extreme hot events decrease in extreme cold events (winter)
Modeled and observed >95% Very likely
Abatzoglou and Brown*; Timlin and Walsh, 2007, Arctic )
Extreme Events: Precipitation
Decrease/Increase
2050: -20% to +50%; 2100: -20% to +50%
Large Increase in frequency and contribution especially in winter. Largest increase in autumn (large intermodel differences). Decreases in spring. Percent of annual precipitation falling as extreme events increases.
Modeled and observed Uncertain
Abatzoglou and Brown*
Extreme Events: Storms
Increase Increase in frequency and intensity
Any increases exacerbated by sea ice reduction and sea level increase
Increases at southern periphery of Arctic; little information for central Arctic
>66% Likely Rachel Loehman
SUMMARY OF PROJECTED CLIMATE CHANGES FOR ALASKASea ice Decrease 2050: 40-60% loss in
Bering Sea (winter/spring); 20-70% loss in Chukchi/Beaufort (summer)
Comparable to recent changes
Near-ice-free summers by 2050; ice free summers by 2100; less loss of sea ice in winter than in summer
>90% Very likely
Overland and Wang (2009)
Snow Increased snowfall during winter, shorter snow season
2050: 10-25%; 2100: 20-50%
Recent changes not well established
Cold-season snow amounts will increase in Interior, Arctic; increased percentage of precipitation will fall as rain (especially in spring, autumn)
Large uncertainty in timing of snowmelt (warmer springs, more snow to melt)
AMAP/SWIPA (Snow, Water, Ice and Permafrost in the Arctic, 2011)
Freeze-up date
Later in autumn
2050: 10-20 days near north coast; 5-10 days elsewhere 2100: 20-40 days near north coast, 10-20 days elsewhere
Large >90% Very likely (sign)
SNAP/UAF
Length of ice-free season for rivers, lakes
Increase 2050: 7-10 days 2100: 14-21 days
Large Largest near coasts where sea ice retreats, open water season lengthens
>90% Very likely
IPCC (2007); SNAP/UAF
River and stream temperatures
Increase 2050: 1-3°C 2100: 2-4°C
Large Consistent with earlier breakup and higher temperatures
>90% Very Likely
Kyle and Brabets (2001)
Length of growing season
Increase 2050: 10 to 20 days 2100: 20 to 40 days
Continuation of recent changes
Largest near coasts >90% Very likely
IPCC (2007); SNAP/UAF
Permafrost Increased area of permafrost degradation (annual mean temperature > 0°C)
2050: ~100-200 km northward displacement 2100: ~150-300 km northward displacement
Large Permafrost degradation primarily in area of warm permafrost (southern AK, Interior)
>90% Very likely (sign)
SNAP and Geophysical Institute (UAF)
Sea level Increase 2050: 3 inches to 2 feet 2100: 7 inches to 6 feet
Large Large uncertainties, esp. at upper end of range; complicated by isostatic rebound, esp. in Southeast Alaska
>90% on sign, except in areas of strong isostatic uplift
IPCC (2007)
Water availablility (summer soil H2O = P-PET)
Decrease 2050: decrease of 0-20+% 2100: decrease of 10-40+%
Recent changes not well established
Most profound changes in areas where sub-freezing temperatures have historically limited PET. Much uncertainty regarding role of winter water storage and spring runoff
>90% Very likely , but likelihood varies by region
SNAP and The Wilderness Society
Continued…

Climate Effects, as selected and ranked by participants (pp. 1-2)[see also “edited annotated effects SW parks”]
KEFJ LACL KATM ANIA ALAGAtmosphere Greenhouse
gasesShrub expansion into tundra, new vegetation in deglaciated areas, and increased woody vegetation overall sequesters carbon.
H H MHH LMM MMM Bud: Shrub expansion due to deglaciation is important for KEFJ, LACL, but less so for KATM (although somewhat) and ANIA. Troy: we do have a lot of shrub expansion throughout our unit. More extensive in KATM, but we have a lot of ash blows (?), especially in ANIA
Air temperature
Air temperature increases at an average rate of 1°F (0.56°C) per decade for national parks in Alaska. Warming is especially pronounced for the northernmost parks and during the historically coldest times of the year.
MH M MHH LHH MHHJeff-- High for KEFJ. Bud: an increasing probability for these parks… less so for ANIA
Average annual temperatures shift from below freezing to above freezing in several parks (BELA, DENA, YUCH), changing the freeze/thaw balance.
ML M MHH LMM MMM
Precipitation Average annual precipitation increases in all NPS areas in Alaska through the mid-
to late-21st
Century. Relative proportions of moisture deposited as snow, ice or rain change as temperature increases.
H H M/HHMM
MHMM
M/HHMM
Many areas will experience drying conditions despite increased precipitation, due to higher temperature and increased rates of evapotranspiration.
MH H MMM LLL MLL
More freezing rain events affect foraging success and survival of wildlife, travel safety, and utility transmission.
H H MHLL MHLL MHLL
Avalanche hazards increase in some areas with rising precipitation and rising winter temperatures.
H H MLL LLL LLL
Stormy weather
Lightning and lightning-ignited fires continue to increase. LM M MMM LLL MLLBud: lightning, low, except for northern part of LACL. Jeff:(?)--Here in seward, have seen winter storm events that are larger than previously observed.
Storm and wave impacts ML M MLL MLL LLLAir quality More smoke from longer and more intense fire seasons results in seasonal and
locally-severe smoke events, with respiratory and other associated health risks to populations.
M M LMM LLL LMM Bud: Smoke from longer and more intense fire seasons in more northern parts of these parks
Cryosphere Ice/Snow Snow and ice season is shorter with later onset of freeze-up and snowfalls and earlier spring snowmelt and ice breakup in Alaska.
H H MHH MHH M MM Jeff: Ice and snow: increased frequency of midwinter thaws should be mentioned here. Increased mid-winter thaws
Most glaciers diminish as warming continues. H H HHH LLL LLLGlacial outwash (silt, sand, gravel) accumulates as glaciers melt, affecting aquatic productivity in both positive and negative ways and forming deposits that can complicate shallow water navigation.
H H MLL LLL LLL
Glacial lakes and glacially dammed lakes fail with increasing but still unpredictable frequency, putting park staff, residents, and visitors at risk of flash floods and debris flows.
H H MLL LLL LLL
Undiscovered cultural resources are exposed as perennial snow and ice patches melt and recede.
LM H LMM LMM LLLA bit in LACL, but more in Wrangells
Hydrosphere Falling global phytoplankton concentration could reduce ocean productivity and CO2
sequestration. Phytoplankton has declined at a average rate of ~1% of the global average per year over the last century. These fluctuations are strongly correlated with climate indices and sea surface temperature.
MH M MLL LLL LLL
Freshwater influx from thawing glaciers dilutes marine waters , lowering salinity, calcium saturation, and pH, and stressing sensitive zooplankton, corals, mollusk s and other species in some areas.
M/H L L/MLL LLL LLL
Toxic marine algae and shellfish poisoning affects humans and marine mammals (e.g., PSP, ASP). Outbreaks are attributed to seasonal changes in coastal water temperature, nutrient enrichment, salinity, and ballast water discharge.
H H HLL HLL LLL
Ocean acidification affects plankton and benthic calcifying fauna (e.g., bivalves and echinoderms) in the Arctic more strongly than at lower latitudes, affecting food sources of fish, marine mammals such as walrus and gray whales, plankton feeding birds, and potentially the composition of the ecosystem.
H M/H M/HMM
MMM LLL
high for all of us in the long termOcean acidification reduces sound absorption. Based on current projections of future pH values for the oceans, a decrease in sound absorption of 40% is expected by mid-century.
MH L MLL LLL LLL
Estuarine Coastal erosion and sea level rise increase the frequency of saltwater flooding in some coastal areas , infiltrating freshwater coastal lagoons, marshes, and groundwater with salt.
M M MLL MLL LLL Bud: LACL, KEFJ, KATM, ANIA, but not as big as in the arctic regions (coastal erosion and sea level rise).. Jeff: medium or low for shallow water areas to convert to terrestrial ecosystems
Freshwater Stream flows from by melting glaciers increase and then decrease over time. As glaciers are diminished in extent, the quantity of water they store is also greatly reduced. Even if annual precipitation remains constant, seasonal flows are likely to change substantially.
H H M/HHH LLL LLL Troy: seasonal stream flows from melting glaciers: high impact to KATM. One of the major impacts he foresees is that we may never have mid summer water levels high enough to operate the vessel that serves Brooks Camp.
Groundwater Ground water supplies that depend on seasonal glacial recharge become less predictable.
MH M L/MLL LLL LLL Jeff: for KEFJ, issue is confounded by uncertainty of whether this is related to subsidence/tectonics, or glacial issues (ground water recharge).
Lithosphere Landslides and mud flows increase on steep slopes. Rapid glacial retreat and permafrost thaw also leave steep and unstable slopes in valleys and fjords. Landslides and mudflows will occur widely in some parks.
H H MLL LLL LLLBud: KEFJ and LACL, landslides and mud flows possible to increase in thaw areas.
Bud: Glaciers diminishing—high, except for ANIA and KATM. Jeff: glacial outburst and glacial dam bursts—definitely yes at KEFJ. Daniel/Troy: we don’t have a lot of glacier mass, but we do have very tiny hanging glacier, also have glaciers in KATM: our biggest thing is that the way this is phrased (‘impact to the park”), we were looking at impacts of change
Sector Subsector Potential Effects to Resources, Operations, and People Affected Arctic Alaska ParksNotes
Earthquake activity increases in recently deglaciated areas. Glaciers melting and the associated isostatic rebound of the land may increase the frequency of earthquakes.
MH M LLL LLL LLL Jeff: these issues exist at KEFJ, but not really linked to permafrost issues. Climate change related, but due to other influences than permafrost.
Large and small tsunamis could result from collapse of unstable slopes in fjords (e.g., glacial moraine and sediment deposits, both above and below water). Earthquakes have previously triggered slope collapse and tsunami events in Alaska.
H L MLL LLL LLLBud: KEFJ definitely has potential of large/small tsunamis.
Soil Soil moisture declines due to rising soil temperature, increased evapotranspiration, thawing permafrost, and natural drainage.
L M LLL LMM LLL
Rock and gravel
Demand for rubble and rock increases, as it is required for repairs and new construction, roads, and community relocation.
MH L MLL LLL LLL
Biosphere General Ecological “tipping points” are likely to result in rapid change, when conditions exceed physical or physiological thresholds (e.g., thaw, drought, water temperature).
H MM LL LLJeff: PDO and its ability to exacerbate or dampen impact of climate change fit in this general biosphere category. Troy: KATM is at center of this w/ permafrost. We view conversion of permafrost to non permafrost as contributing to major change. Bob: black spruce is often found on permafrost.
Vegetation Increased growing season length. Modeling predicts that the mean number of frost free days for the Boreal and Arctic bioregion will increase between 20 and 40 days by the end of the century.
MH M MMM MMM MMMM
Large-scale landcover changes occur over periods of years to decades. Some terrestrial vegetation models suggest potential for large-scale conversion of low tundra to shrubs, then to conifers, and from conifers to deciduous forests, or perhaps to grass. Other models indicate increasing lichen, decreased sedges, and increases to deciduous and evergreen shrubs.
HL H HHH M MLL
Bud: would think some veg change issues, particularly in LACL, and maybe KATM and ANIA.
Vegetation expands into deglaciated coastal areas, but less markedly into higher elevation areas.
H M LLL LLL LLL Troy: we don't have a lot of these ranked very high because of reduced set of species.
Tree species and vegetation classes shift as species typical of lower altitudes and latitudes expand into higher areas.
H H MMM MMM LMM
Mountain and arctic ecosystems could change substantially within 50 years, and conditions become unsuited for some native species. Some rare species could become endangered and endangered plants species may go extinct as conditions change.
H H MMM MLL LLL
Bud: mountain ecosystems and rare species-some concern for this expressed in the mountains of LACL
Drought stress affects boreal forests as evapotranspiration increases with warmer/drier summers leading to reduced tree growth, reduced carbon sequestration, and increased disturbance from fires and insect outbreaks.
LH MH LMM LLL LLL
Atypical outbreaks of forest pests and plant diseases occur more widely, increasing fire hazards and hastening decline of native and familiar species.
H H H/MHH LLL MLL Bud: We're seeing this in LACL, KEFJ, and KATM, but less so in ANIA.
Invasive exotic species and native species from other areas expand into parks. It becomes easier for invasive species that are already adapted to such conditions, to survive, reproduce and expand into available habitat as native species become increasingly stressed by changing conditions such as rising temperature and declining soil moisture.
MH M MMM LLL LLL
Black spruce may expand or contract, expanding under warming conditions coupled with increasing fire interval – or contracting as underlying permafrost soils thaw and fire frequency increases.
L M MMM LLL MLL
Mature forests and “old growth” decline, as a result of changing soil moisture, drought, insects, disease, and fire.
H H MLL LLL LLL
Fire Fire increases in boreal and tundra ecosystems. Model simulations show a warming climate leads to slightly more fires and much larger fires, as well as expansion of forest into previously treeless tundra. Flammability increases rapidly in direct response to climate warming and more gradually in response to climate-induced vegetation changes.
MHM H MHHH LHMM
MHMM Daniel Noon: first two points have potential. Fire for
them is exception rather than regular event. Transition to fire would have a big impact. Bud: lots of fires in northern area of LACL.
Wildland fire hazards increase, affecting communities and isolated property owners. LM M MMM LLL MMM
Fire-related landcover and soil changes include vegetation population shifts, major permafrost thawing, soil decomposition, and surface subsidence.
L M MMM LLL MLL
Wildlife - General
Changes to the terrestrial and aquatic species compositions in parks and refuges occur as ranges shift, contract, or expand. Rare species and/or communities may become further at risk, and additional species could become rare. Some early-succession species will benefit from changes.
MH M LLL LLL LLL Troy: ranked these somewhat low at present for first two points. Don't really have them on their borders. Most of their dominant species are fairly resilient to the things we know are happening. Sees trend of predator issues. Not sure if this is climate related. Thinks this is more contingent on politics than it is any specific biological factor.
Parks and refuges may not be able to meet their mandate of protecting current species within their boundaries, or in the case of some refuges, the species for whose habitat protection they were designed. While some wildlife may be able to move northward or to higher elevations to escape some effects of climate change, federal boundaries are static.
HHL MH MHLL MHLL LHLLJeff: for KEFJ, given our enabling legislation, we will be very challenged in meeting the mandate by some of the changes we're seeing now. Both re: mandate and visitor experience.
Changes in terrestrial and marine wildlife distributions affect visitor experiences and subsistence throughout the region.
H M MLL MLL MLL
Some species suffer severe losses. An analysis of potential climate change impacts on mammalian species in U.S. national parks indicates that on average about 8% of current mammalian species diversity may be lost. The greatest losses across all parks occurred in rodent species (44%), bats (22%), and carnivores (19%).
M/H H M/HLL MLL M LL
If salmon populations collapse, then huge changes in species populations will occur
Animals and plants will expand into landscapes vacated by glacial ice and utilize new alpine lakes after ice is gone
H H MLL LLL LLL
Predator-prey relationships may change in unexpected ways. H H HLL MLL MLL

Climate Effects, as selected and ranked by participants (pp. 3-4)[see also ppt “edited annotated effects SW parks”]
Migratory routes and destinations will change for some species (e.g., wetlands, open tundra, snow patches).
LH L LLL LLL LLL
Wildlife - Birds
Arctic and alpine breeding birds’ breeding habitats will be reduced or eliminated as trees and shrubs encroach on areas currently occupied by tundra. 72% of Arctic and alpine birds are considered moderately or highly vulnerable to the impacts of climate change.
ML M MMM LMM LMM
Kittlitz's murrelet populations continue to decline as glacial retreat results in the loss of important nesting and foraging habitats.
H M M/LLL LLL LLLhigh, but not sure it's related strictly to glacial retreat.
Millions of geese could lose almost half of their breeding habitat due to a predicted change in vegetation in the Arctic from tundra to taiga and boreal forest.
HL H HLL HLL HLL
Waterfowl shifts occur as coastal ponds become more salty in some areas. LH MH LHLL LHLL LHLLProductivity of nesting shorebirds may increase if they are able to change their migration and nesting schedules to coincide with the time when the most insects are available.
LH L LLL LLL LLL
Coastal seabirds such as the arctic Ivory Gull, Aleutian Tern, and Kittlitz’s Murrelet show medium or high vulnerability to climate change due to their low reproductive potential and their reliance on marine food webs that are also threatened by climate change.
H M MMM MMM LLL
Bud: coastal seabirds, substantial issue for all parks (John Morris agrees)
The population cycles of birds and their prey, such as spruce budworm, will be decoupled in some Boreal areas due to warming temperatures. Populations could continue to move northward with continued climate warming.
H H HMM HMM HMM
Wildlife - Marine Mammals
Harbor seals may move or decline, spending more time in the water, or using terrestrial haul outs as floating ice declines. Population recovery could be affected.
H L LLL LLL LLL
Jeff: Harbor seal-KEFJ, yes, definitelyIncreased ambient sound affects marine mammals . Reduction in sound absorption and increased human vessel traffic due to receding sea ice and tidewater glaciers may affect marine mammals that rely on echolocation for communication and prey location.
H M MLL MLL LLL
Wildlife – Caribou/Reindeer
Caribou and reindeer health may be affected by changes in temperature and precipitation patterns, increases in insects and pests known to harass caribou and reductions of succulent forage.
L M MLL MMM MLL Bud: yes for KEFJ. Troy: ANIA more of a caribou area than KATM. Caribou success is in two camps-one thinks it's lichen, one thinks it's green up.
Caribou may suffer heavy losses , if vegetation glazes over following rain-on-snow events, preventing successful feeding during cold weather.
L H HLL HLL HLL
Wildlife - Moose
Predicted shifts in forest community could result in less suitable habitat for caribou, but potentially increased habitat for moose in Yukon Flats National Wildlife Refuge and similar habitats.
L M MLL MLL MLL
Climate change could decouple timing and synchrony of birth, hindering moose calf survival.
MH M MLL MLL MLL
Wildlife – Small mammals
Reduced snow cover reduces survival of voles and other subnivian species, due to increased predation and cold stresses, with changes in small and large mammal predator-prey relationships.
M M MLL LLL LLL
Fisheries Commercial fisheries shift. Changes in ocean community organization in the Bering Sea caused by warming climate and associated loss of sea ice alter availability of snow crab and other fisheries resources.
HL H HLL HLL HLL Jeff: we should consider sport fishing here as well. Fish diseases agreed to be not very far from any of the parks
Ocean acidification affects fisheries. Pteropods and crustaceans foods of salmon may decline with ocean acidification.
H H HMM HMM HMM Dan: more likely to become an issue for use. Bud: important for all the major parks.
New stream habitats become available for colonization by fish and wildlife as glaciers decline.
H H L/MLL LLL LLL
Fish diseases such as Ichthyophonus increase with rising water temperatures .
Models indicate that temperature increase in streams in south-central Alaska will be around 3°C, a change that could increase disease in fish.
H H HHLL HHLL HHLL Troy: didn't rank these very high, partly because to get to the point where water is unsuitable for salmon, there has to be almost no surface water flowing, or you have to see a complete change in temp.. not just 3 degrees c, but we're talking temps vastly different cycled from day to day. There's a whole series of things that would have to happen to make that come up. There's a pretty broad range. It's usually more extreme… deforestation, road building, etc is what usually changes this. Doesn't think what we're talking about here will quite get it there.
Some existing salmon waters may become unsuitable for migration, spawning and incubation.
H H HLL MLL MLL
Invertebrates Ice worm populations decline locally as glacier habitats melt. H H MLL LLL LLLLMarine intertidal environments change and may become more susceptible to exotic marine species, including green crabs.
H M HLL MLL LLL
Exotic pests, diseases and their vectors expand into Alaska from warmer areas , and endemic pests expand as host species are stressed by climate change (e.g., bark beetles, budworms, ticks, lice, West Nile virus, Lyme disease, hantavirus, HP avian influenza, plague, vespid [yellowjacket spp.] outbreaks, black flies, mosquito swarms, bott flies, etc.),
H H HMM MMM HMM
Bud: pests, diseases, high for all but ANIA. Jeff: yellowjackets
Subsistence, Fishing, and Hunting
Intensified management expands. Some local residents and management agencies may advocate managing for new species that have the potential to replace diminished subsistence hunting, trapping, and fishing opportunities, and for intensified management of native species.
HM H HHLL HHLL H HLLEspecially for fish/salmon. Troy: ranked as low, bc it’s already happening (intensified management could expand). Nancy Swanton—agrees w/ Troy, thinks it will continue to be an issue. Bud: thinks we will have serious intensified management of fisheries.
Altered migration patterns make hunting more challenging. Migration patterns of terrestrial animals are predicted to change as temperatures, precipitation patterns, and vegetation availability change.
L H HLL MLL MLLDon Calloway: marine subsistence becoming more challenging-LACL, KATM, ANIA… high
Community resources available for subsistence activities decline as increased storm surges, and permafrost erosion compound effects of change to relative sea level, impacting infrastructure in Native Alaskan communities, in some cases requiring relocation of entire communities.
L H HLL HLL HLLBob: this is more about communities that are experiencing major climate change related issues and this. So maybe not so applicable in SWAN.
Other Human Uses and Values
Wilderness Large-scale physical and biological changes across broad landscapes affect abundance and condition of wilderness-associated resources (glaciers, tundra, boreal forest, wildlife, scenic vistas, river flows, access routes, etc.)
H H HLL MLL MLL
The scientific community becomes increasingly interested in wilderness sites for a variety of inventories, monitoring and research projects, some of which involve highly technical instruments, mechanized access, and long-term installations.
H H HHH MMM MLL Jeff: on feisty scientists-maybe not so much an emergence of feisty scientists, but perhaps instead a greater role for environmental compliance.
The changing biophysical landscape, and increased human activity to research, monitor, and respond to threats associated with climate change affect key wilderness values such as naturalness, wild-untamed areas without permanent facilities opportunities for solitude, etc.
H H HM HLL HLL
Tourism Alaska’s tourism season lengthens with increasing temperatures and more snow-free days. Some visitor activities increase, while others (e.g., snow sports) may decline.
H M ML L ML
Visitor use patterns shift as tour operators seek to provide visitors with more opportunities to experience increasingly uncommon glacier scenery. Cruise ships and day tour operators may shift some itineraries away from the parks they’ve traditionally visited, or seek more opportunities to shift itineraries deeper into the parks. Land based operators may press to bring groups further into the park through aircraft, airboats, snowmobile tours, off road vehicles (ORVs), and road extensions.
H L LLL LLL LLL
Visitor demand for new interpretive/education media products, publications and services that address changing climate will increase, putting pressure on existing programs and staffing as a result.
H MH MHLL LHLL LHLL
Other Hazards
Safety hazards develop, expand or are recognized in relation to climate change, such as thin ice, erratic flooding, changing fire and smoke hazards, slope failures (mudslides, landslides, tsunami hazards), and expansion of more disease organisms (fish, wildlife, and human) and their vectors into Alaska.
H M HLL LLL MLLJeff: KEFJ-having to adapt operations to be more prepared to close road, manage visitors, direct to other places, etc. Already seeing this.
Customary and Traditional Knowledge
The predictive uses of traditional ecological knowledge will change, as unprecedented changes develop for weather, freeze/thaw conditions, plants, animals, fire, etc.
LH H ML ML ML Timing of salmon runs may change due to water temp’s and flows. Daniel Noon/Troy: Not particularly high because main things that are relevant to peoples’ experience out here are moose and caribou; this is always cycling anyway (every 40-60 yrs). Don Calloway—hears this more about western and northern Alaska. Lots of oral traditions there about what happens in starvation times.
Resource and Economic Development
Natural resource development and economic activities expand in Alaska with increasing global demand for energy and resources to supply rising global population.
LHM MH MHHH MHM M HMM
Possible oil and gas in Bristol Bay region. Developmental pressures increase as direct or indirect effects of reduced snow and ice cover. These include expanded global and regional transportation systems and their associated infrastructure (e.g. opening of the Northwest Passage due to reduced sea ice, permanent roads to replace ice roads), increased demand for natural resource development (construction materials – especially gravel and rock, energy and minerals for infrastructure repair, replacement, and expansion), shifting agricultural production zones, community resettlement and other population shifts.
HM H HLL HLL HLL
Infrastructure development expands along Alaska’s coasts and Interior to provide needed services, facilities, and transportation systems for other expanded activities.
LM MH LHLL LHLL LLL
Damage to roads, buildings, and other infrastructure increases due largely to permafrost thaw (but also from storms, floods, and landslides) adding 10% to 20% by 2080.
H M MLL LLL LLL
Relocating indigenous communities represents a large social burden, not just financial cost for governments, but also impacts the communities themselves, potentially resulting in loss of integral cultural elements such as access to traditional use areas for subsistence activities, loss of history and sense of intact community, and potential loss of social networks and extended kin support. Significant increases in social pathologies such as alcoholism and domestic violence may be anticipated. In addition, tremendous stresses will be placed on traditional means of conflict resolution. In addition multiple strains will be placed on local governance and delivery of services. Finally, state and federal governments will have huge additional burdens placed on them as they try to provide relief from the impacts of climate change (flooding, destruction of infrastructure, high demands placed on social services and so forth). Response to climate change will require enormous pressures for integrated and efficient bureaucratic structures.
L HM MMLL MMLL
MMLL
Fuel and energy prices increase substantially as carbon mitigation measures are implemented (sequestration, carbon caps, offsets, etc.). Costs of transporting fuels to remote locations by barge, ice roads, aircraft, etc. also becomes more challenging and costly.
M H HHH HMM HMM
H MLL LLL LLLBud: Glacier Bay phenomenon-are we seeing this in SWAN parks? (longer tourism season). Daniel/Troy: didn't rank this as particularly high; we think the foreseeable kinds of tourism here are fishing and wildlife viewing. Can't think of kinds of tourism that would be likely to expand. KEFJ: Jeff-15% increase in visitation last year. But on the road system, close to Anchorage. So much of their visitation is related to Anchorage, whereas other parks are 'destination visitors", i.e. lower 48.
Bud: LACL-higher bc of proposed mining. Troy: listed high for KATM, medium ANIA, etc because: 1) Pebble effect would be felt more in KATM. Airborne effects would be big bc of prevailing winds and 2) Every presidential cycle there is a change re: whether will there be oil and gas development initiatives. Bob: demand for gravel can be related to climate change, etc…. at first these things don't look related to climate change, but they are at closer look. Complex issue. Bob: friend in oil industry said we have to put in fuel and energy price increase as a result of carbon mitigation. Troy: we scored as a high effect in terms of our capability to simply manage the park.
Landscape-level changes affect visitor experiences as iconic scenery changes, and access for subsistence, hiking, boating, etc. changes with vegetation, soil, and water
H

AUGUST TRAINING WORKSHOP
SCENARIOS VS FORECASTS
THE STEPS IN SCENARIOS PLANNING:Orient
Explore Synthesize
ActMonitor
Part III:Global Business Network (GBN)
Scenarios Planning Process (introduced during webinars)
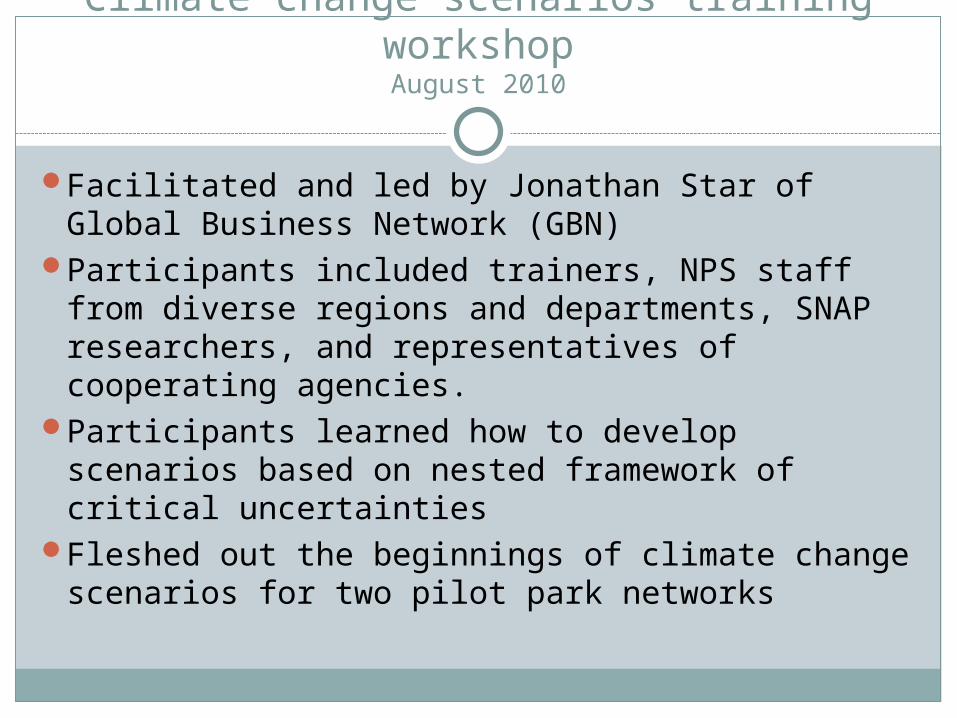
Climate change scenarios training workshopAugust 2010
Facilitated and led by Jonathan Star of Global Business Network (GBN)
Participants included trainers, NPS staff from diverse regions and departments, SNAP researchers, and representatives of cooperating agencies.
Participants learned how to develop scenarios based on nested framework of critical uncertainties
Fleshed out the beginnings of climate change scenarios for two pilot park networks

Forecast Planning One Future
Scenario Planning Multiple Futures
Scenarios overcome the tendency to predict, allowing us to see multiple possibilities for the future
Scenario Planning vs. Forecasting
What we know today
+10%-10%
Global Business Network (GBN) -- A member of the Monitor Group Copyright 2010 Monitor Company Group

Explaining Scenarios: A Basic GBN Scenario Creation Process
What are the implications of these scenarios for our strategic issue, and what actions should we take in light of them?
What is the strategic issue or decision that we wish to address?
What critical forces will affect the future of our issue?
How do we combine and synthesize these forces to create a small number of alternative stories?
As new information unfolds, which scenarios seem most valid? Does this affect our decisions and actions?
This diagram describes the 5 key steps required in any scenario planning process
Global Business Network (GBN) -- A member of the Monitor Group Copyright 2010 Monitor Company Group

Step one: Orient
What is the strategic issue or decision that we wish to address?
How will climate change effects impact the landscapes within which management units are placed over the next 50 to 100 years?
How can NPS managers best preserve the natural and cultural resources and values within their jurisdiction in the face of climate change?
To answer this challenge, we need to explore a broader question:
Cape Krusenstern National Monument All rights reserved by BruceandLetty
Kenai Fjords National Park http://www.ent.iastate.edu/sip/2005/companiontours

Step Two: Explore
What critical forces will affect the future of our issue?
Copyright © 2010 Monitor Company Group, L.P. — ConfidentialERT-HLY 2010 1
CRITICAL UNCERTAINTIESBIOREGION: ______________
Over the next 50 – 100 years, what will happen to . . . ?
Global Busness Network (GBN) -- A member of the Monitor Group Copyright 2010 Monitor Company Group
Critical forces generally have unusually high impact and unusually high uncertainty

CLIMATE SCENARIOSBIOREGION: ______________
Combining two selected drivers creates four possible futures

“Nested Scenarios”?
Lack of senior commitment
Varied approaches and alignment
Short-term concerns
Senior commitmentInternational
alignmentLong-term
perspectives
Widespread indifference
Competing concerns
Nature of Leadership
Deg
ree o
f Socie
tal C
on
cern
Big problems, Big solutions…
Riots and Revolution…
Is Anyone Out There?... Wheel-Spinning…
1 2
3 4
5 6
7 8
9 10
11 12
13 14
15 16
Global Business Network (GBN) -- A member of the Monitor Group Copyright 2010 Monitor Company Group
Broad UnderstandingHeightened Urgency
Nesting each story in a social framework creates 16 possibilities

Socio-Political
NESTED SCENARIO DETAILSBIOREGION:___________
Describe This World in 2030
Major Impacts on the Bioregion
Issues Facing Management
BioregionClimate_______________
Step 3: Synthesize
The 16 possible futures created in the preceding steps must be narrowed down to 3-4 scenarios that are relevant, divergent, challenging, and pertinent. Each has it’s own narrative (story).

Step 4: ActCategorizing Options to Help Set Strategy
Robust: Pursue only those options that would work out well (or at least not hurt you too much) in any of the four scenarios
OR
Bet the Farm / Shaping: Make one clear bet that a certain future will happen — and then do everything you can to help make that scenario a reality
OR
Hedge Your Bets / Wait and See: Make several distinct bets of relatively equal size
OR
Core / Satellite: Place one major bet, with one or more small bets as a hedge against uncertainty, experiments, and real options
Hedge Your Bets
Hedge Your Bets
Hedge Your Bets
Hedge Your Bets
Core
RobustSatellite
Satellite
Bet theFarm
Hedge Your Bets
Hedge Your Bets
Hedge Your Bets
Hedge Your Bets
Core
RobustSatellite
Satellite
Bet theFarm

Selected driversClimate scenariosNested scenarios
ImplicationsActions
ResearchNo regrets actions
Part IV:SWAN Workshop Results,
Coastal

Selected Drivers (Coastal)
Drivers as rated for certainty and importance by the Coastal group. Selected drivers to explore:
Acidification: slight increase (-.1 pH) major increase (-.4 pH) Votes: 10
Temperature: +2 C by 2050/+3 C by 2100 +4C by 2050/+6C by 2100. Votes: 9
Storms: No/slight change Frequent (biannual pummeling). Votes: 6
Precip (i.e., mean annual precip): same/some local decrease more rain, more total water. Votes: 6
Climate Drivers (or, “Scenario Drivers based on Climate”) Uncertain High certainty
Important
Temperature X X Precipitation X X Freeze-up X Length of growing season X Sea Level X Water availability X Relative Humidity X Wind Speed (separate from Aleutian Low) X
(duration) X (increase)
PDO X Extreme Events (temperature) X Extreme Events (precipitation) X X Extreme Events (storms) X X Additional drivers introduced by the group:• Ocean Acidification• Salinity (onshore/near shore)• Aleutian Low• Extreme Event (wind)• AK Coastal Current

Climate Scenarios (Coastal)
Ocean Acidification
Stor
ms
/
Pre
cipi
tatio
n
More rain, frequent pummeling
Not much change
Major Increase (-0.4 pH)
Slight Increase (-0.1 pH)
“Acid Wash”
2
“Low Grade Fever”
3
“Washout”
1
“PB & Jelly Fish”
4
Matrix showing the intersection of changes in storms and precipitation and changes in ocean acidification, as each pertains to coastal regions. Each quadrant yields a set of future conditions which are plausible, challenging, relevant, and divergent.

“Washout”“Washout” “Acid Wash”“Acid Wash”
changes to habitat (influx of salt water)
trail /road washout regular riparian disturbances more dynamic/changing coast
leading to erosion larger floodplain and wetland less appealing destination destruction of cultural resources
due to coastal erosion (communities/ facilities)
possible need to relocate communities
ecotourism crash removal of biota (fish, birds, sea
mammals) spawning areas destroyed subsistence/recreation opportunities
changed coastal erosion catastrophic collapse of salmon
collapse of fishing (subsistence, sport, commercial)
collapse of community cohesion/culture
destruction of cultural resources/infrastructure
loss of clam/mussel habitat and marine mammals that rely on them
requests from communities to intro species for subsistence/sport
change in species composition (more deer?)
possible need to relocate communities.
Climate scenarios 1&2 (coastal)
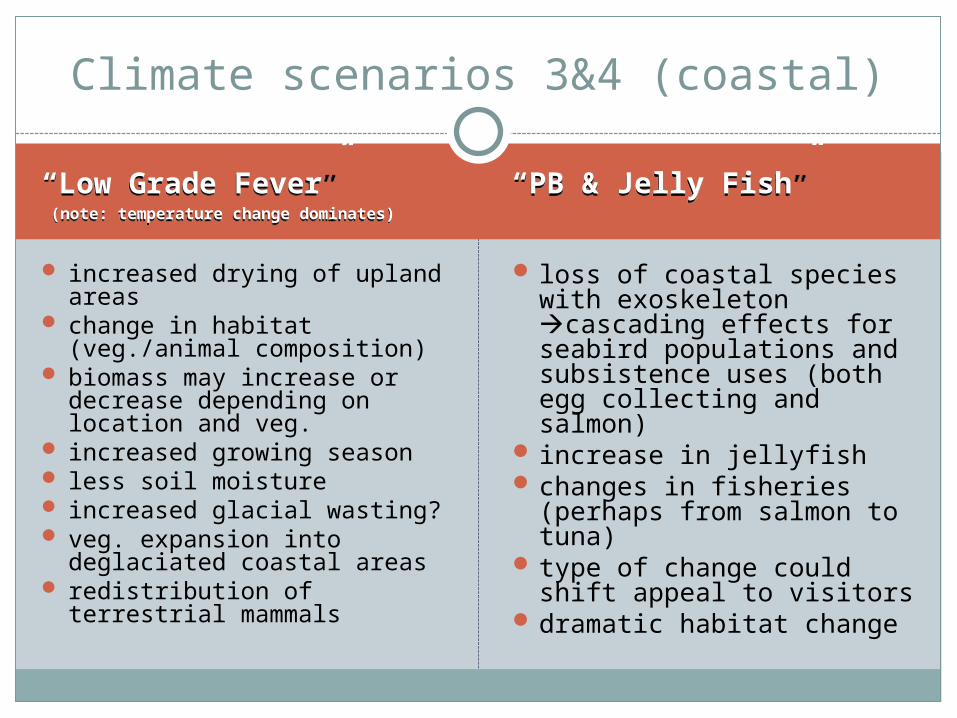
“Low Grade Fever” (note: temperature change dominates)
“Low Grade Fever” (note: temperature change dominates)
“PB & Jelly Fish”“PB & Jelly Fish”
increased drying of upland areas
change in habitat (veg./animal composition)
biomass may increase or decrease depending on location and veg.
increased growing season less soil moisture increased glacial wasting? veg. expansion into
deglaciated coastal areas redistribution of terrestrial
mammals
loss of coastal species with exoskeleton cascading effects for seabird populations and subsistence uses (both egg collecting and salmon)
increase in jellyfish changes in fisheries
(perhaps from salmon to tuna)
type of change could shift appeal to visitors
dramatic habitat change
Climate scenarios 3&4 (coastal)

Nested Scenarios (coastal)
S
oci
etal
C
once
rn
1
1
1 2
4 3 4
2
6
2
3 3
2
4
Institutions
Broad Understanding Heightened Urgency
Widespread Indifference Competing Concerns
Less Integrated More Integrated
Wheel- Spinning
Big Problems, Big EFFORTS…
Is Anyone Out There?...
Riots and Revolution…
Nested scenario selected
2
4
3
1
Matrix showing Coastal climate scenarios nested in a social/institutional framework. Each quadrant yields four linked scenarios; three are selected in red.

Coastal Nested Scenario 1: PB&J/Riots and Revolution: “Jellyfish Jamboree, Fishing Fiasco”
ImplicationsNatural Resources
Pest and disease: increased parasite loads marine mammals, ungulatesPlant diseases: veg diebackPSP (paralytic shellfish poisoning) increaseGlacial retreat or disappearanceVeg shifts with impacts to ungulates: increased black spruce, woody upright veg (alder/willow)Major fisheries and ocean trophic restructuring
Failing: salmon, halibutGaining: unknown
InvasivesMarine: range extensions from BC/WA of tunicates and green crabTerrestrial: new invasives, rapid proliferation in distribution and diversity. Range extensions.
Species of concern: migratory birds and marine mammals
Cultural ResourcesArchaeological site lossCultural disconnect of sacred or significant sites
SocioeconomicOil and gas development: potential for mining, operational season changesAlcoholism and disease in people with dietary and social changesDecline and conflicts in commercial and sport fisheries/struggles with permitting and regulations for historic and or/emerging fisheriesVillage population declines w/ loss of subsistence and traditional economic baseReduced interest in marine wildlife viewingImpacts on transportation options (overland, river boat, float plane access) due to loss of snow and ice
FacilitiesFire safe communities become a priorityChanging priorities for facility funding as use patterns change and resource attractions shift location/
CommunicationCommunications budgets cut; face-to-face interaction lessensPublic demands info; managers unable to meet demands (lack of funding, decentralized info)Visitor (external audience)
Lack of changing venues to engage visitorsFewer tour boat visitorsPoor access to glaciersBear viewing moved or diminished
SubsistenceLoss/decline of traditional hunting species; some replacement speciesIncrease in occurrence of paralytic shellfish poisoning: health impacts to local populationCollapse of salmon in both maritime and riverine lifewaysPlant/berry harvest: change in timing (phenology) and speciesLoss of language and traditions as local demographic changes (e.g. marine mammal customs and crafts)

Coastal Nested Scenario 1 (cont’d): PB&J/Riots and Revolution: “Jellyfish Jamboree, Fishing Fiasco”
Research and Information Needs Develop relevant communication
strategies to feed into existing networks; assign accountability
Resource monitoring: shared responsibility and protocols between communities and agencies Water quality Fish and wildlife populations Invasive species
Trophic interaction linkages research
Ocean acidification research Facilitation of academic
research with clearly communicated needs
Economic/energy development: emphasize mitigation options and build planning (NEPA) capacity
Important Management Actions• Energy development—renewable village development• Economic development (local and community ventures and employment)• Partnerships with NGOs and community groups (LCCs, RACs, development groups, local gov’t, native orgs)• Convert to local resource use• Streamline public engagement by issues rather than by jurisdiction• Implement facility standards for green energy use and efficiency• Provide forums for sharing scientific efforts and expertise

Coastal Nested Scenario 2: Acid Wash/Big Problems, Big Efforts: “Acid Reflex”
Implications
Facilities Increased risk of
flood/mudslide/erosion effects on structures
access to roads and trails more frequently compromised
potential effects on coastal communities and way of life(bridges/roads/river swell)
private ecotourism accessibility (inholdings, lodges, docks, etc) compromised
Communication media/public involved at every step need for a highly evolved
communication network potential misaligned message
delivery Subsistence
Loss of fish, game, “revenue” (community asset)
Shift in way of life Search for surrogates
• Natural Resourceso benthic community declineo food web shifto local extinction, mass redistributiono coastal erosiono extremely moist conditionso unknown glacial dynamics
• Cultural Resourceso flooding and wave action loss of known historic siteso loss of historic record (undiscovered sites)
• Socioeconomico Questions of prioritization re: private vs. public aido livelihoods stressed, leading to industry shift (tourism, fishing)o natural resource development—need for energy and jobso community relocation?

Coastal Nested Scenario 2 (cont’d): Acid Wash/Big Problems, Big Efforts: “Acid Reflex”
Facilities Increased risk of
flood/mudslide/erosion effects on structures
access to roads and trails more frequently compromised
potential effects on coastal communities and way of life(bridges/roads/river swell)
private ecotourism accessibility (inholdings, lodges, docks, etc) compromised
Communication media/public involved at every step need for a highly evolved
communication network potential misaligned message
delivery Subsistence
Loss of fish, game, “revenue” (community asset)
Shift in way of life Search for surrogates
• Natural Resourceso benthic community declineo food web shifto local extinction, mass redistributiono coastal erosiono extremely moist conditionso unknown glacial dynamics
• Cultural Resourceso flooding and wave action loss of known historic siteso loss of historic record (undiscovered sites)
• Socioeconomico Questions of prioritization re: private vs. public aido livelihoods stressed, leading to industry shift (tourism, fishing)o natural resource development—need for energy and jobso community relocation?

Coastal Nested Scenario 3: Low Grade Fever (Cold PDO), Is Anyone Out There: “Is There a Doctor in the
House?”
Implications
Facilities Visitation increase need for visitors
facilities (e.g. trails, lodging, VCs, access, marinas)
Replace old or build new facilities with new sustainable technologies
Energy resources development: pressure to develop oil and gas (Bristol Bay), coal (Chitina), wind farms, tidal facilities, geothermal, hydro.
Communication Climate change hard to sell in SWAN
area, but rest of world suffering New communications technologies
emerge, presenting challenges and opportunities
Public disbelieving re: climate change in SWAN
Scenario planning becomes widely used
Subsistence Subsistence resources remain available
until 2030, but rural lifestyles are more expensive and less viable.
Traditional lifeways around subsistence fishing and hunting supported/enabled until 2030.
Natural Resources Vegetation changes
Shrubs increase Forest fuel loads increase Animal movements impeded Moose increase Caribou decrease
Fisheries Shellfish increase Salmon decrease
Cultural Resources Living cultural resources and
traditional lifeways around subsistence fishing and hunting supported/enabled until 2030.
Socioeconomico Climate change mitigation and
adaptation funds sent to other areas w/ more pronounced change
o Competition for fish and wildlife intensifies between subsistence/commercial/sport users
o Eroding budgets lead to shifts in priority
o Alaska resources increase in value (e.g. fish, clean water, clean air, energy resources)visitor destination

Coastal Nested Scenario 3 (cont’d): Low Grade Fever (Cold PDO), Is Anyone Out There: “Is There a Doctor in the
House?”
Research and Information Needs
Thorough ethnographic studies of subsistence lifeways
Ecosystem mapping to identify critical near shore areas
Monitor elements of PDO shift (e.g. air and ocean temps, precip, fisheries, benthos, coastal wildlife)
Important Management Actions
Reach out for interagency cooperation to effectively communicate PDO oscillations and imminent climate change.
Advocate for more flexible and responsive management of fish and wildlife
Develop flexible, portable infrastructure
Model desired green behaviors
Due to shrinking budgets, use partnerships to address management needs

Common No Regrets Actions: Coastal
1. Collaborate with researchers monitoring programs to track changes in PDO and ocean acidification
2. Model, collaborate and promote energy efficient technologies
3. Increase fluidity and connections between research and monitoring
4. Conduct coastal/marine ecosystem monitoring5. Identify and cooperate with private/public
entities for partnerships6. Create portable, flexible structures7. Re-imagine how institutions can work together
to solve common problems.

SELECTED DRIVERSCLIMATE SCENARIOSNESTED SCENARIOS
IMPLICATIONSACTIONS
RESEARCHNO REGRETS ACTIONS
Part IV:SWAN Workshop Results,
Riverine

Selected Drivers (Riverine)
Uncertain High Certainty
Important
Temperature X X Precipitation X X Freeze-up date X Length of ice free season (rivers/lakes) X River/Stream temperatures X Length of growing season X Water availability (stream flow) X Relative Humidity X Wind Speed X PDO X Extreme Events (temperature) X Extreme Events (precipitation) X Extreme Events (storms) X Soil Moisture
Drivers as rated for certainty and importance by the Riverine group.
Additional drivers introduced by the group:• Volcanic eruptions (local acidification)• PDO/AO/Jetstream• Variable Stream Flow
Selected drivers to explore:• Precipitation (variability)• Temperature (variability)• Thaw days (more/less)• PDO (warm/cold phase)
Group decided to use:• Thaw days (more/less)• Precipitation (low/high variation)• PDO would be included with Thaw days looking at cold phase PDO with less Thaw days and warm phase PDO with more Thaw days to push the extreme possibilities.

Climate Scenarios (riverine)
Precipitation
T
haw
Day
s
More with warming PDO phase
Less with cold PDO phase
High Variation Less Variation
“Juneau-Helly/Hansen”
2
“Freeze Dried”
3
“Smokey”
1
“Tiny Ice Age”
4
Matrix showing the intersection of changes thaw days (summer season) and precipitation, as each pertains to inland (riverine) regions. Each quadrant yields a set of future conditions which are plausible, challenging, relevant, and divergent. The details of each quadrant are described in the text.

“Smokey”“Smokey” “Juneau/Helly Hansen”“Juneau/Helly Hansen”
Drought stressed vegetation Increase in disease/pests Longer growing season Maximum shrub expansion (less overland
access) Long-term reduction stream flow Initially higher stream flows from seasonal
glacial melt Reduction/loss glaciers Increased fire on landscape 40% reduction in salmon fry due to smaller fry. KATM Brooks Camp barge requires glacier
melt for high lake levels…this world would minimize access with warming and less precipitation.
Less biting insects Decrease in waterfowl Exposure of cultural resources Lowering of groundwater tables. More fugitive dust with Pebble Mine Decrease in stream flow Increase competition in water. Decrease in subsistence (difficult winter travel)
Increase in rain on snow events (increased flooding events)
Thicker vegetation Increase erosion Increase lightening Increase evaporation (soil drying) More berries (good habitat for bear,
moose, caribou) Decrease in alpine tundra Arrival of black bear Increase in waterfowl Increase in park infrastructure impacts Decrease in backcountry visitation
(increase in rain, reduction of flying days)
Increase in hurricanes Increase rain on snow events (flooding)
…decrease in salmon Increase difficulty in controlling
contamination (runoff) Increase in avalanches
Climate scenarios 1&2 (riverine)

“Freeze Dried”“Freeze Dried” “Tiny Ice Age”“Tiny Ice Age”
Permafrost persists Decrease in productivity
(plant, berries)…impact on wildlife
Overland access continues Competition of water
resources (mining, communities)
Facilities/infrastructure stable Slow retreat of tundra ponds Extend range of Dahl Sheep Lichens stable, supporting
caribou High wind potential Brown bear decrease
Increase damage risk in cultural resources/infrastructure
Increase bear activity for Brooks Camp (KATM)
Decrease in ungulates Decrease in bark beetle and
fire KATM Brooks Camp barge
has adequate Naknek Lake water depth to access
Stable glaciers High summer stream flows Increase in winter access.
Climate scenarios 3&4 (riverine)

Scenario divergence summary (riverine)
“Smokey” Increase fire potential (converging
non-fire systems to fire) Conversion of ponds, riparian
systems/structure to new ecosystems
Reduction in glaciers Significant restriction to winter
access Broad landscape-level
habitat/ecosystem shifts/changes
“Juneau/Helly Hansen” Wildlife generally doing well
(caribou may be impacted) Extreme events/flooding may
impact (storms, mudslides, avalanches)
High threats to infrastructure Impacts to visitor use access
“Freeze Dried” At extreme may impact salmon fry
(decrease) Limited vegetation growth Significant economic cost-of-living
issues
“Tiny Ice Age” Glaciers stable/growing Winter travel (access) good Pest/disease moderate Extreme events may impact
salmon

Nested Scenarios (riverine)
Matrix showing Riverine climate scenarios nested in a social/institutional framework. Each quadrant yields four linked scenarios; three are selected in red.
S
oci
etal
C
once
rn
1
1
1 2
3 4 3 4
2
6
2
3 4
1
3
2
4
Institutions
Broad Understanding Heightened Urgency
Widespread Indifference Competing Concerns
Less Integrated More Integrated
Wheel- Spinning
Big Problems, Big Solutions…
Is Anyone Out There?...
Riots and Revolution…
Nested scenario selected

Riverine Nested Scenario 1: Smokey/Wheel Spinning
ImplicationsNatural ResourcesPhysical
Hydrological cycle changesReduction in available waterPDO phase (which phase the PDO is in is an implication)
Reduction in available waterBiological
Major biome shiftIncrease in fire, increase in pests/diseasePond Conversion to uplandsESA Issues Species management concerns
Cultural ResourcesExposure of artifacts
Socio/EconomicConservation of F&W for subsistence & recreationAccess and transportation issues
FacilitiesInfrastructure risks, fire protection costsMelting permafrost, damage to infrastructure (buildings)
Interpretation and EducationMaintaining relevant agency in-reach effortsPublic/visitor education costs and challengesGreater need for public application of ecosystem services
ProtectionFire management, public safety risksF&W regulations, harvest quotas, seasons

Riverine Nested Scenario 1 (cont’d): Smokey/Wheel Spinning
Important Management Actions• Re-evaluation of Agency Mission• Environment Planning-What is purpose
of land.• Secure water rights and Implement
water conservation. Include anticipate increase in fire proofing, natural resource engineering.
• Increase in fire proofing• Natural Resource Engineering• More monitoring data

Riverine Nested Scenario 2: Tiny Iceage/Is Anyone out there?
Implications
Facilities Increase storm damage Increase facility maintenance
costs Significant budget decrease Maintenance access good
Interpretation and Education Audiences unaware of masking
PDO Subsistence connection to
resources decrease Harvest management more critical
Physical Resources Glaciers stable Water levels high Water front erosion increases Increase in storm damage
Biological Resources Salmon decrease Bears increase Ungulates
Cultural Resources Storm damage increases
Socio/Economic Access is good Tourism is stable Decrease in commercial fisheries Decrease demand in subsistence Municipal tax revenue decreases Snowmachine, etc. emerging
recreation

Riverine Nested Scenario 2 (cont’d): Tiny Iceage/Is Anyone out there?
Important Management Actions Identify/manage infrastructure based on charging demand
and reduce costs Identify opportunities for shared technical expertise Interagency partnerships
Research and Information Needs TEK- critical element to facilitated subsistence Water and climate data Fish and wildlife population data
Other Issues Institutional barriers to subsistence use (human
movement, species availability) Marketing ecological services (local – national)

Riverine Nested Scenario 3: Freeze Dried/Riots and Revolution
Implications
Socio/Economic Difficult access Fewer local owned fish
permits Deficits, inflation, less real $
for land/resource management
Population (out migration). Lost TK and local culture
Less salmon harvest Higher cost of living, energy.
Facilities Greater fire risk, but facilities
OKInterpretation and Education
Hard to put SE AK in CC context with cool PDO
Loss of TK and living culture Regulatory F&W bottlenecks
(access, seasons, allocations)
Physical Resources Less water, cool
PDO/stable temperature Poor condition for salmon Less snow and more ORV
use Intensified wildlife/fish
managementBiological Resources
Subsistence/extraction conflicts
Wildlife shifts Cultural Resources
Stable archaeology

Riverine Nested Scenario 3 (cont’d): Freeze Dried/Riots and Revolution
Research and Information Needs Science outreach and education to
multiple audiences Need higher understanding of AK
protected areas in global context. Funding for interdisciplinary studies Social scientist for LCC and DOI CSC
and agencies Communication in LCCs All of Bristol Bay should be in one
LCC, not split Enhance ethnography program Explain relevance of resource
protection when developable resources become scarce (ecosystem services)
Validate CC models with I&M data going forward
Other Issues Is this a paradym shift from
naturalness? What does this tell us?
Important Management Actions
Intensive management triggers Title 8 harvest preference
Protect current and future critical habitats, migration routes, ecosystem services.
Get missing players to the CC scenario table at subsequent workshops
Adjust regs to harvest realities (more flexible process)
Resume ANILCA local hire authority Long-term $ for invasive species
management.
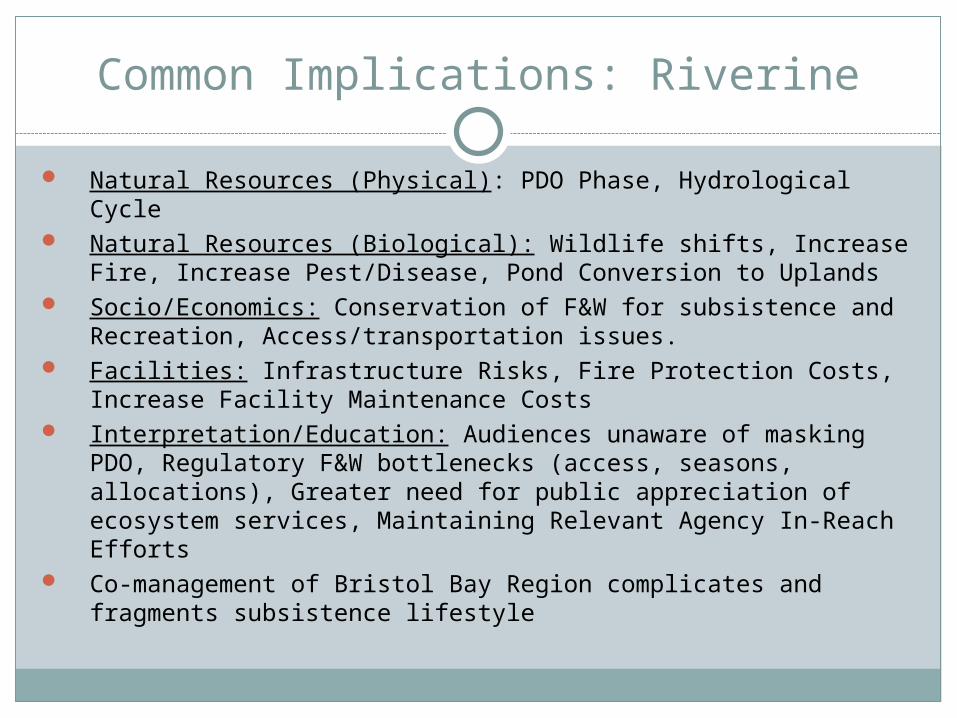
Common Implications: Riverine
Natural Resources (Physical): PDO Phase, Hydrological Cycle Natural Resources (Biological): Wildlife shifts, Increase Fire,
Increase Pest/Disease, Pond Conversion to Uplands Socio/Economics: Conservation of F&W for subsistence and
Recreation, Access/transportation issues. Facilities: Infrastructure Risks, Fire Protection Costs, Increase
Facility Maintenance Costs Interpretation/Education: Audiences unaware of masking PDO,
Regulatory F&W bottlenecks (access, seasons, allocations), Greater need for public appreciation of ecosystem services, Maintaining Relevant Agency In-Reach Efforts
Co-management of Bristol Bay Region complicates and fragments subsistence lifestyle
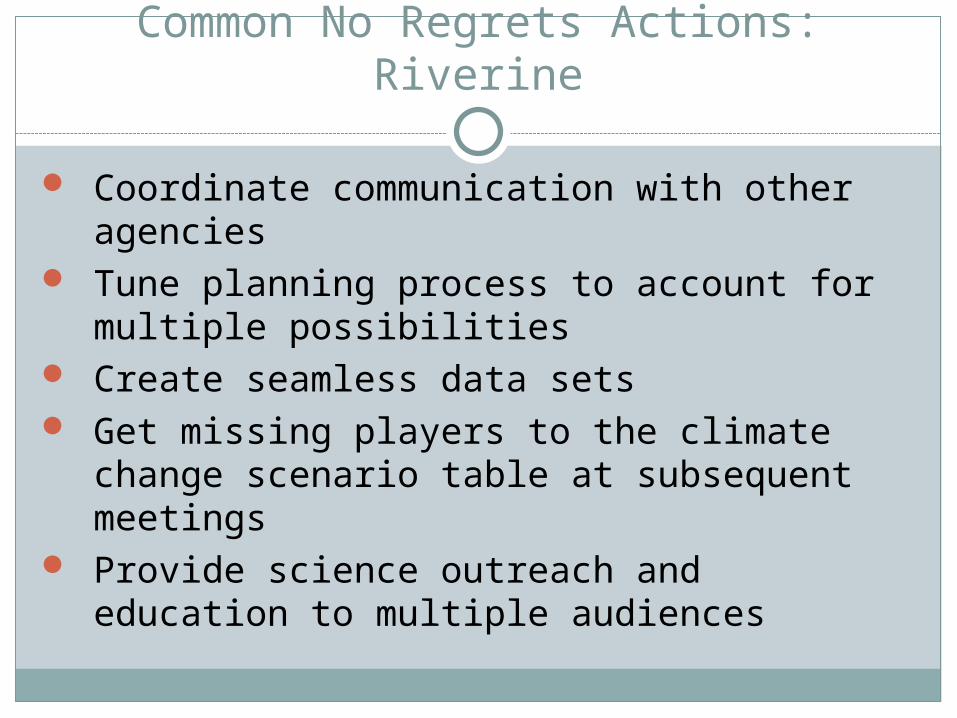
Common No Regrets Actions: Riverine
Coordinate communication with other agencies
Tune planning process to account for multiple possibilities
Create seamless data sets Get missing players to the climate change
scenario table at subsequent meetings Provide science outreach and education to
multiple audiences

CHOOSING RESPONSE STRATEGIES
COMMON NO REGRETS ACTIONSdata, research, and monitoring
collaboration and outreachflexibility and innovation
NEXT STEPS
Part V:Conclusions

Choosing Response Strategies
Hedge Your Bets
Hedge Your Bets
Hedge Your Bets
Hedge Your Bets
Core
RobustSatellite
Satellite
Bet theFarm
Hedge Your Bets
Hedge Your Bets
Hedge Your Bets
Hedge Your Bets
Core
RobustSatellite
Satellite
Bet theFarm
Robust responses are common no-regrets actions, but they are not the only possibility. In some cases, it may make sense to hedge bets to avoid an occurrence that appears in only one or two scenarios, or to set up core and satellite responses to deal with variability among scenarios.
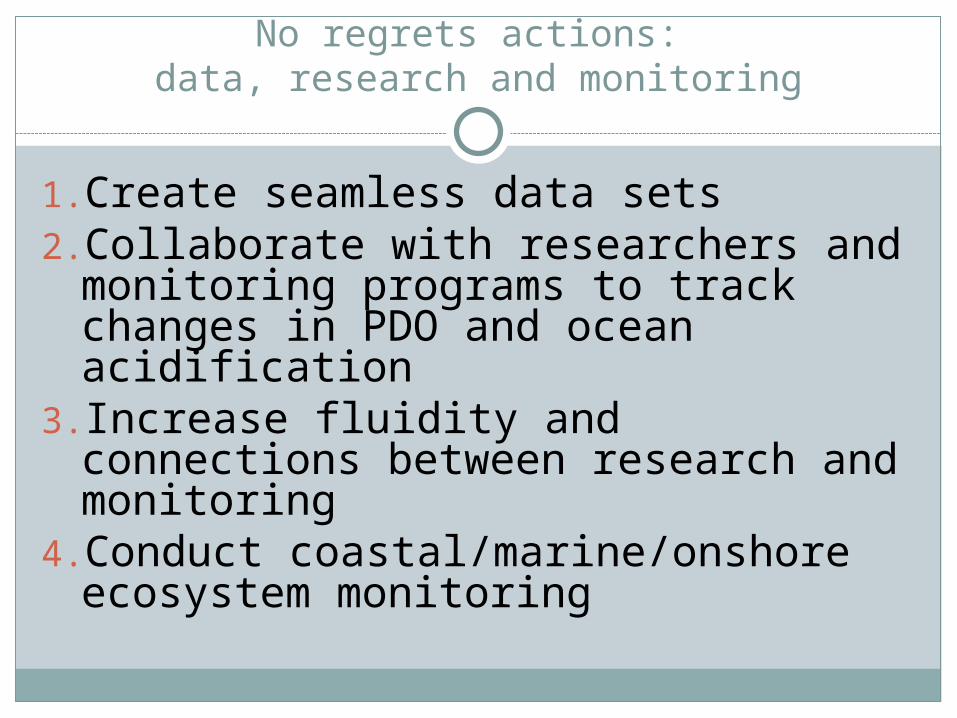
No regrets actions: data, research and monitoring
1.Create seamless data sets2.Collaborate with researchers and
monitoring programs to track changes in PDO and ocean acidification
3. Increase fluidity and connections between research and monitoring
4.Conduct coastal/marine/onshore ecosystem monitoring

No regrets actions:collaboration and outreach
1.Coordinate communication with other agencies
2.Get missing players to the climate change scenario table at subsequent meetings
3.Provide science outreach and education to multiple audiences
4. Identify and cooperate with private/public entities for partnerships
5.Re-imagine how institutions can work together to solve common problems.
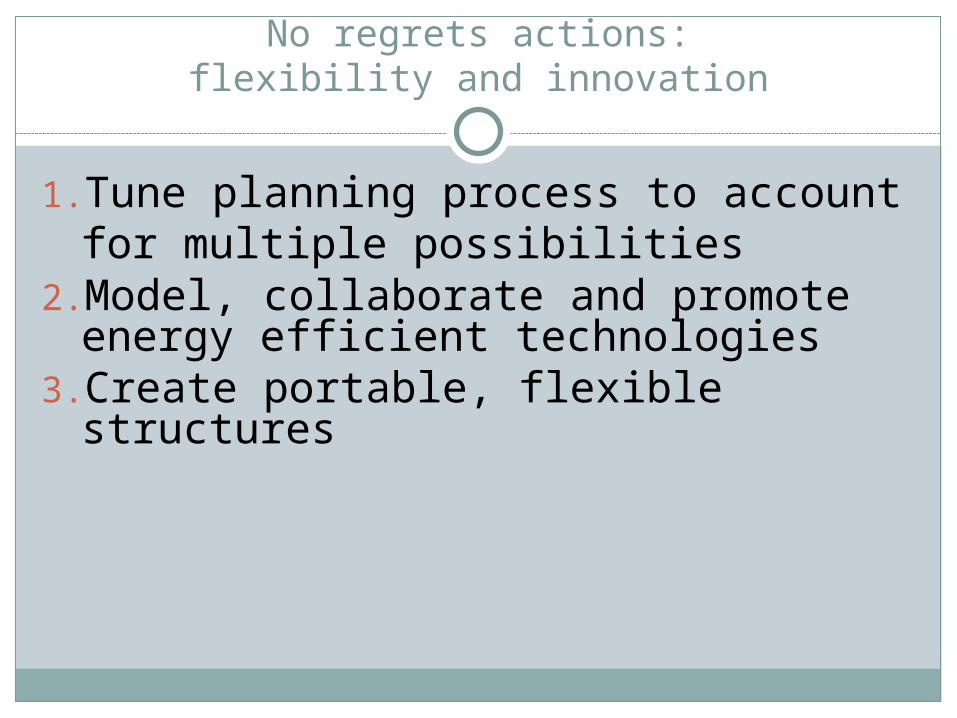
No regrets actions:flexibility and innovation
1.Tune planning process to account for multiple possibilities
2.Model, collaborate and promote energy efficient technologies
3.Create portable, flexible structures
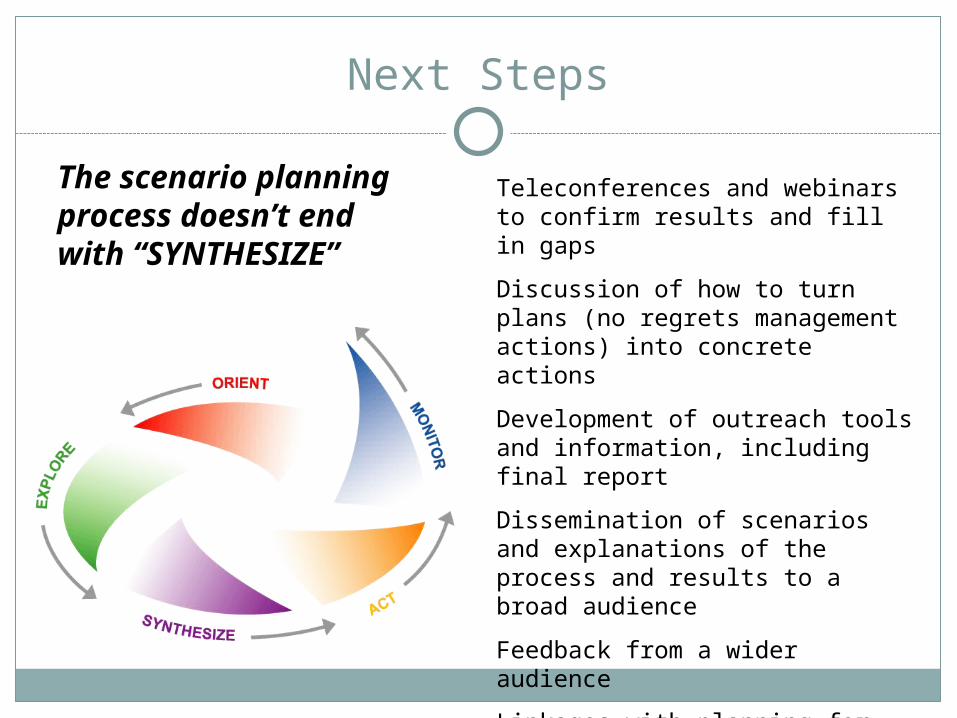
Next Steps
Teleconferences and webinars to confirm results and fill in gaps
Discussion of how to turn plans (no regrets management actions) into concrete actions
Development of outreach tools and information, including final report
Dissemination of scenarios and explanations of the process and results to a broad audience
Feedback from a wider audience
Linkages with planning for other park networks
The scenario planning process doesn’t end with “SYNTHESIZE”