soybean meal potential in africa - wishh. soybean production soybeans are grown mainly in 29 states...
TRANSCRIPT
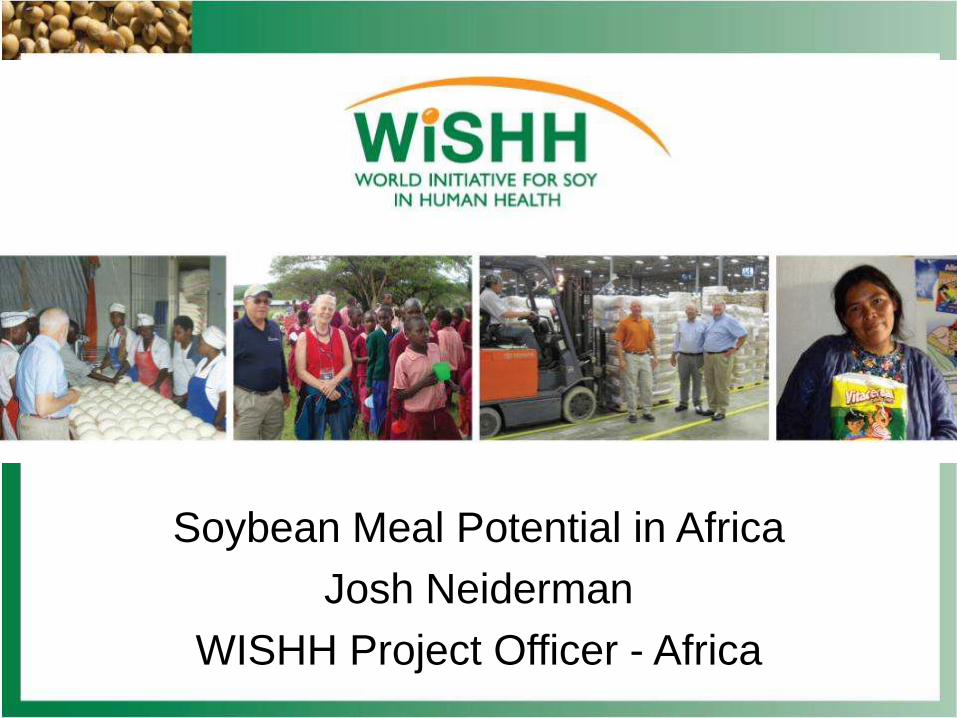
Soybean Meal Potential in Africa
Josh Neiderman
WISHH Project Officer - Africa
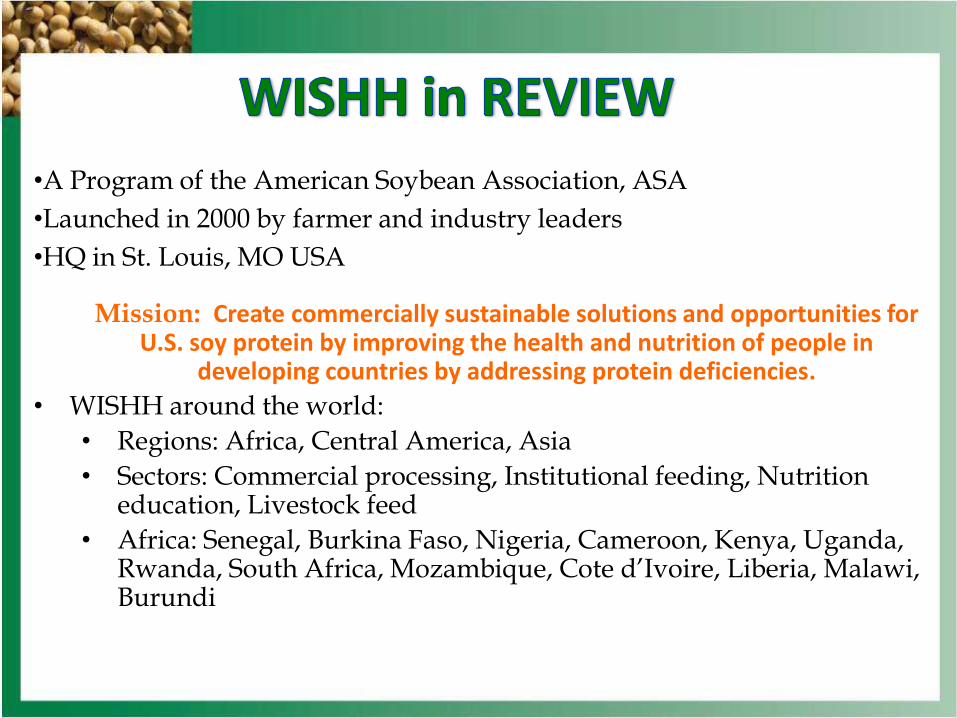
•A Program of the American Soybean Association, ASA
•Launched in 2000 by farmer and industry leaders
•HQ in St. Louis, MO USA
Mission: Create commercially sustainable solutions and opportunities for U.S. soy protein by improving the health and nutrition of people in
developing countries by addressing protein deficiencies.
• WISHH around the world:
• Regions: Africa, Central America, Asia
• Sectors: Commercial processing, Institutional feeding, Nutrition education, Livestock feed
• Africa: Senegal, Burkina Faso, Nigeria, Cameroon, Kenya, Uganda, Rwanda, South Africa, Mozambique, Cote d’Ivoire, Liberia, Malawi, Burundi

The Soybean
More than 3 billion bushels of soybeans are grown in the U.S. annually at a value of about $36 billion

Soybeans are often called ‘super beans’ because there are so many
ways to use them.
38% 50%
50-90%
70% 90%
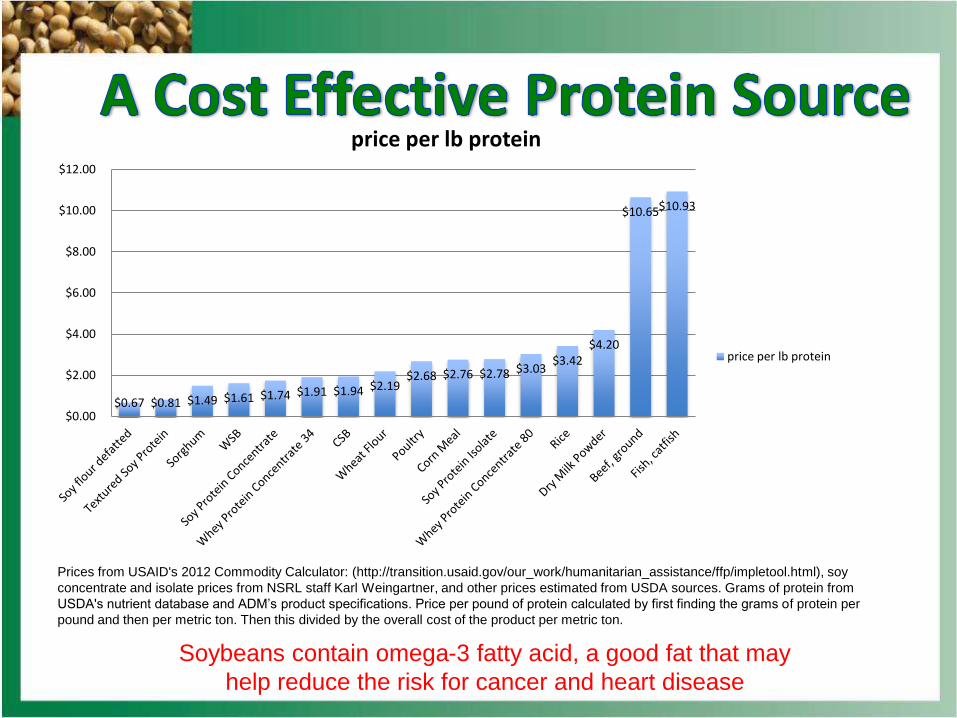
Soybeans contain omega-3 fatty acid, a good fat that may
help reduce the risk for cancer and heart disease
Prices from USAID's 2012 Commodity Calculator: (http://transition.usaid.gov/our_work/humanitarian_assistance/ffp/impletool.html), soy
concentrate and isolate prices from NSRL staff Karl Weingartner, and other prices estimated from USDA sources. Grams of protein from
USDA's nutrient database and ADM’s product specifications. Price per pound of protein calculated by first finding the grams of protein per
pound and then per metric ton. Then this divided by the overall cost of the product per metric ton.
$0.67 $0.81 $1.49 $1.61 $1.74 $1.91 $1.94 $2.19 $2.68 $2.76 $2.78 $3.03
$3.42 $4.20
$10.65 $10.93
$0.00
$2.00
$4.00
$6.00
$8.00
$10.00
$12.00
price per lb protein
price per lb protein

U.S. Soybean Production
Soybeans are grown mainly in 29 states on about 30 million hectares More than half of U.S. production is exported to 37 markets including the EU
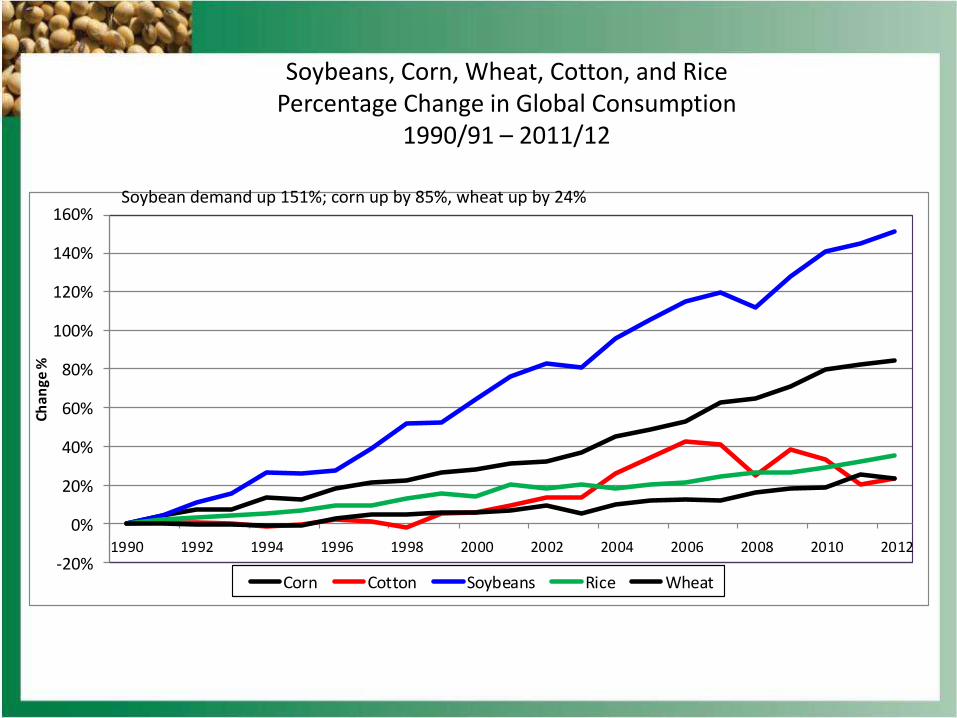
Soybeans, Corn, Wheat, Cotton, and Rice Percentage Change in Global Consumption
1990/91 – 2011/12
-20%
0%
20%
40%
60%
80%
100%
120%
140%
160%
1990 1992 1994 1996 1998 2000 2002 2004 2006 2008 2010 2012
Chan
ge %
Corn Cotton Soybeans Rice Wheat
Soybean demand up 151%; corn up by 85%, wheat up by 24%
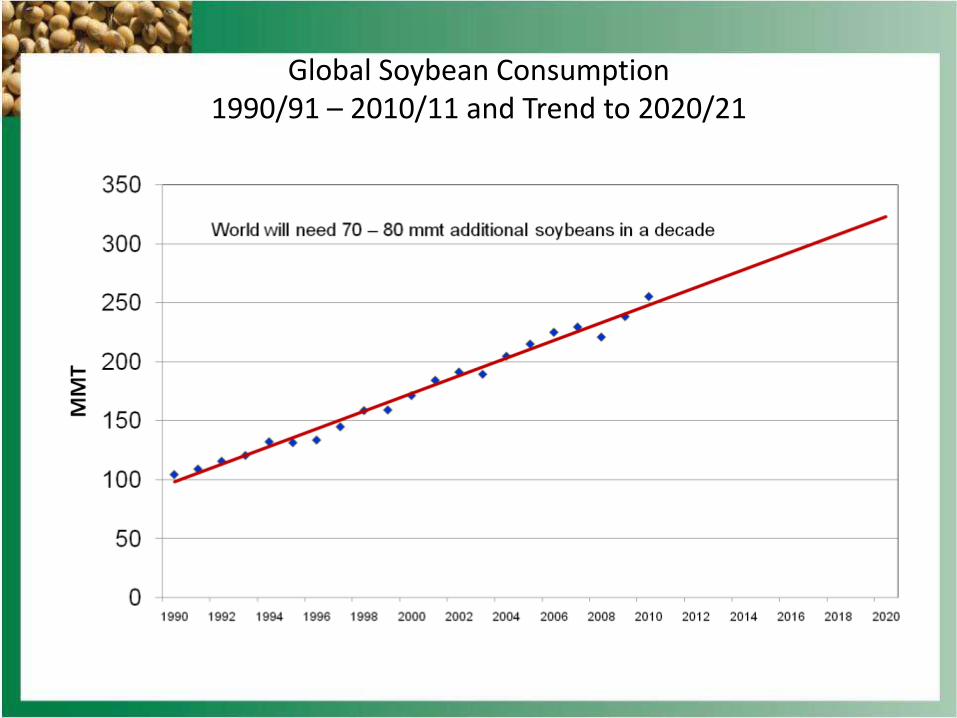
Global Soybean Consumption 1990/91 – 2010/11 and Trend to 2020/21
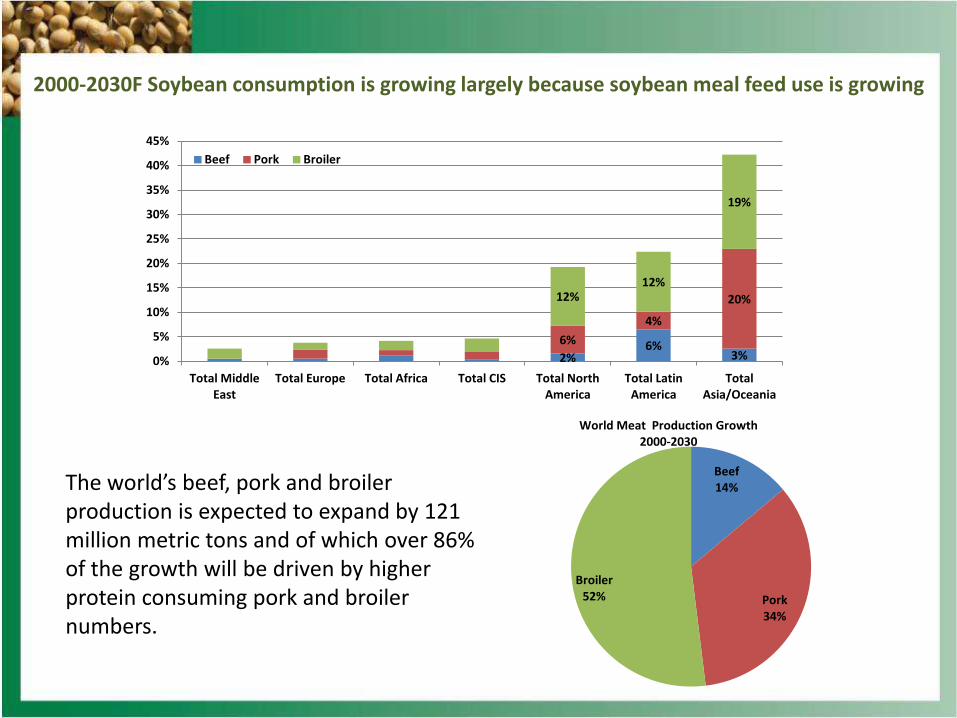
2000-2030F Soybean consumption is growing largely because soybean meal feed use is growing
2% 6%
3% 6%
4%
20% 12% 12%
19%
0%
5%
10%
15%
20%
25%
30%
35%
40%
45%
Total Middle East
Total Europe Total Africa Total CIS Total North America
Total Latin America
Total Asia/Oceania
Beef Pork Broiler
Beef 14%
Pork 34%
Broiler 52%
World Meat Production Growth 2000-2030
The world’s beef, pork and broiler production is expected to expand by 121 million metric tons and of which over 86% of the growth will be driven by higher protein consuming pork and broiler numbers.

FEEDing Pakistan
3 year USDA Aquaculture program
Main Components
• Aquaculture Assessment
• Feeding Trials
• Equipment Purchase
• Technical Assistance (KSU)
• Handbook
• Outreach Campaign

FEEDing Pakistan FY14 Activities
• KSU Aquaculture Conference
• KSU Technical Assistance
• Trade Team - KSU
• Exhibition Participation
• Farmer Field Days
• Media Campaign
• Handbook Publishing
• Evaluation
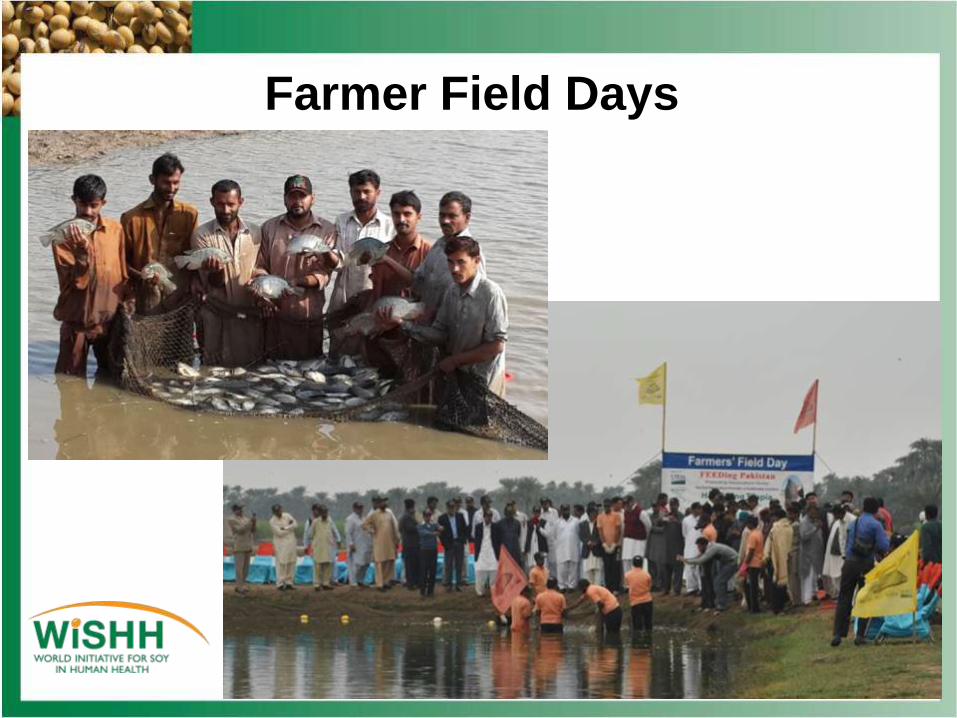
Farmer Field Days
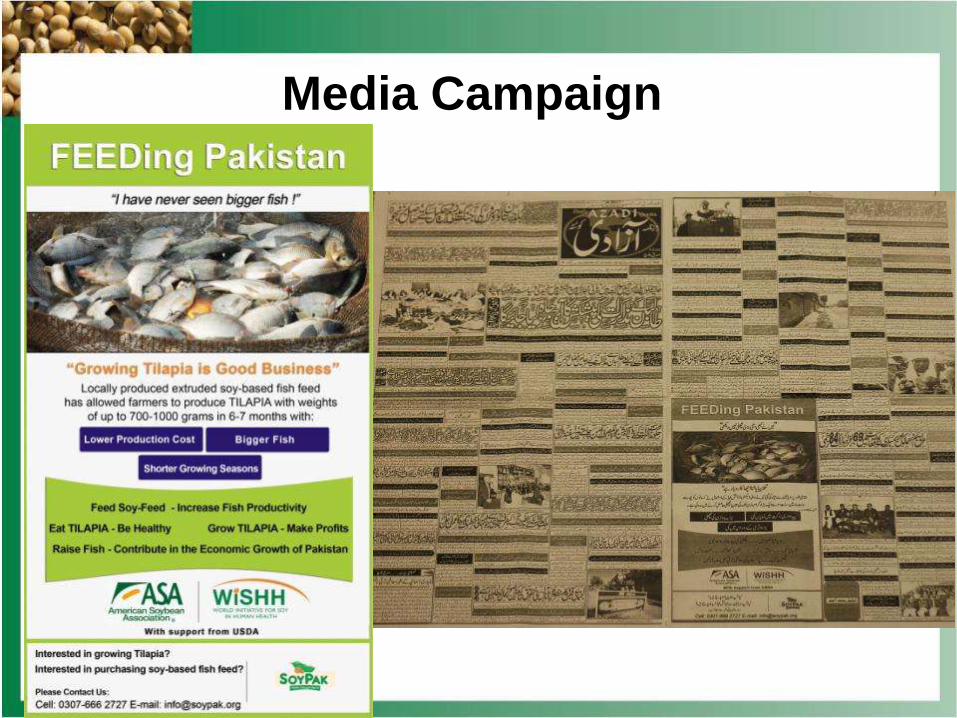
Media Campaign