spatial and temporal - universidade de aveiro
TRANSCRIPT

1
Cybium, the European Journal of Ichthyology 26 (3): 185-196
2002
SPATIAL AND TEMPORAL ORGANIZATION OF A COASTAL LAGOON FISH
COMMUNITY - RIA DE AVEIRO, PORTUGAL
by
Lúcia POMBO & José Eduardo REBELO (1)
(1) Department of Biology, University of Aveiro, 3810-193 Aveiro, PORTUGAL. [lpombo.bio.ua.pt]
ABSTRACT. - The fish community and its spatial and temporal organization were studied in the Ria de Aveiro.
This lagoon system (43 km2 in area), has both marine and fluvial influences and is located between 40º 30’ - 40º 52’N
and 8º35’ - 8º 47’W on the central coast of Portugal. The ichthyofauna was sampled monthly, from December 1996 to
November 1997, at nine selected stations, with “chincha”, a traditionally-used beach-seine-type net of the region. A
total of 14,598 specimens representing 43 species from 21 families were caught. The abiotic parameters (temperature,
salinity and dissolved oxygen) showed significant seasonal variations, although only salinity and transparency showed
statistically significant trends among sampling stations. The diversity and evenness were greater at the borders of the
lagoon. The species richness, diversity and evenness peaked in mid-Summer. Marine seasonal migrant species were
the most numerous, and the marine juvenile and estuarine resident categories had the highest number of species.
Species number and diversity of the ecological guilds showed some spatio-temporal patterns due to some particular
dominant species. Mugilidae, Atherinidae, Moronidae and Clupeidae were the most abundant families. Six species
were dominant and represented more than 74% of the total fish abundance, although they did not occur over the
whole lagoon area or during the whole sampling period. The study concludes that the fish community of the Ria de
Aveiro has well-defined seasonal and spatial patterns.
RÉSUMÉ. - Organis ation spatiale et temporelle de la communauté de poissons d’une lagune côtière – Ria
de Aveiro, Portugal.
La communauté de poissons et son organisation spatiale et temporelle ont été étudiées dans la Ria de Aveiro.
Ce système de lagune (43 km2 de superficie) subit des influences maritimes et fluviales et est situé entre 40º 30’ - 40º
52’N et 8º35’ - 8º 47’W sur la côte centrale du Portugal. Des échantillons ont été prélevés mensuellement de décembre
1996 à novembre 1997, dans neuf stations, avec un filet de pêche traditionnel de la région, la “chincha”. Au total 14

2
598 spécimens ont été collectés représentant 43 espèces et 21 familles. Les paramètres abiotiques (température,
salinité et oxygène dissou) ont montré des variations saisonnières significatives, tandis que sur l’ensemble des stations
de prélèvement seules la salinité et la transparence ont présenté une variation significative. La diversité et l’équatibilité
ont été maximales le long des rives de la lagune. La richesse en espèces, diversité et équatibilité ont leur maximum été.
Les espèces marines étaient les plus nombreuses et les catégories “juvénile marin” et “résident estuarien” sont celles
qui avaient le plus grand nombre d’espèces. Le nombre d’espèces et la diversité des catégories écologiques ont montré
des patterns liés à certaines espèces dominantes. Mugilidae, Atherinidae, Moronidae et Clupeidae étaient les familles
les plus abondantes. Six espèces dominaient, même si elles n’étaient pas présentes sur toute la superficie de la lagune
ou durant toute la période des échantillons, représentant plus de 74% du total de l’abondance en poisson. Cette étude
permet de conclure que la communauté de poisson de la Ria de Aveiro a des patrons saisonniers et spatiaux très bien
définis.
Key words. - Ichthyofauna – Portugal – Diversity – Evenness - Ecological guilds - Lagoon
The Ria de Aveiro, on the west coast of Portugal is a typical estuarine coastal lagoon. The
particular abiotic attributes of this system - shallowness, high turbidity, nature of the substrate,
temperature, salinity and oxygen - associated with its high biotic productivity, offer excellent conditions
for colonisation by many species, especially teleosts (Potter et al., 1990; Rebelo, 1992).
This coastal lagoon is economically important because of its fisheries, industry, agriculture, sea
farming, tourism and, more recently, aquaculture. With a good communication with the sea, that
guarantees a seasonal fish recruitment, the lagoon is an area of considerable fish exploitation (commercial
and recreational). Previous ichthyological studies in the Ria de Aveiro (Osório, 1912; Nobre et al., 1915;
Arruda et al., 1988; Rebelo, 1992) contributed to the knowledge of the dynamics and evolution of the fish
populations inside this lagoon and its relationship with the adjacent ocean.
This paper describes the spatial and temporal patterns of the fish community, in terms of ecological
categories throughout their distribution, number of species, density and biomass. This allows an
interpretation of the use and ecological importance of the lagoon for its various fish populations.

3
Study area
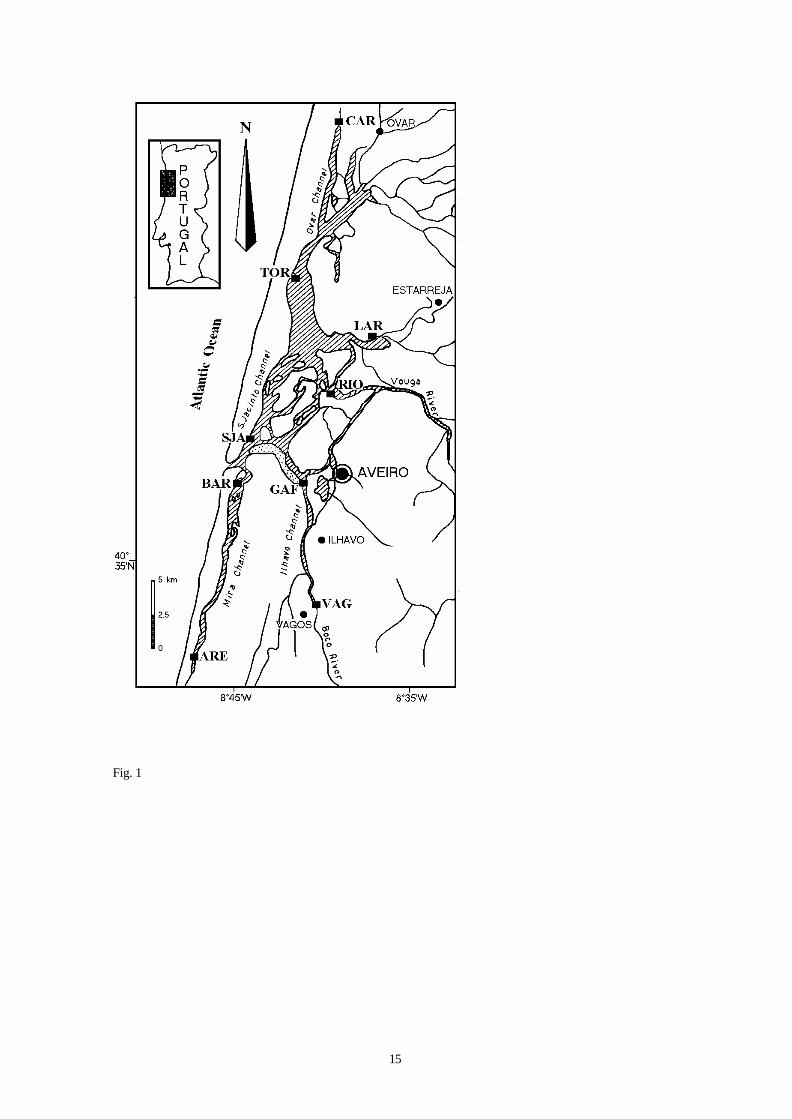
The morphology of the Ria de Aveiro (Fig. 1) shows relatively recent development starting in the
tenth century, and in 1808 the connection with the sea (470 m width) was first stabilized by man. The
topography and physical characteristics of the Ria de Aveiro were described by Barrosa (1980). The area is
42 km2 at low tide and 47 km2 at high tide. The depth at low tide is only 1 m over most of the lagoon, but
can reach 10 m near the mouth and in the navigation channels. Tidal action mixes freshwater with seawater
entering from the mouth. The tidal input is approximately between 25 and 90x106 m3 for tidal amplitudes of 1
and 3 m respectively. Currents produced by this tidal action are significant only in the mouth, the central
part of the main channels and a few other restricted areas. There is a delay of 6 hours in the times of high
and low water between the mouth and the extreme margins of the lagoon.
The nature of the sediments is extremely variable, particularly the granulometry. Its composition
varies between 20 to 90% of sand, 10 to 80% of silt and 0 to 30% of clay. In the north the sediments are
finer but become coarser with progression to the south (Borrego et al., 1994).
The lagoon receives considerable flows of raw and treated wastewater. Three main pollution types
are apparent: organic and chemical pollution from paper-pulp factories (in the rivers of Vouga and Caima);
chemical pollution, particularly mercury, from the industrial area of Estarreja (in Laranjo area); and microbial
contaminants from the urban sewage effluent and cattle raising areas (Ílhavo channel, Vouga river and
Ovar channel) (Lima, 1986; Lucas et al., 1986; Borrego et al., 1994).
MATERAL AND METHODS
Sampling period and study sites
Fish were collected monthly, from December 1996 to November 1997, at nine selected stations (Fig.
1): near the mouth of the lagoon (BAR, GAF and SJA); at the edges of the main channels (ARE, CAR and
VAG); in the main freshwater area, highly organically enriched (RIO); in the area showing the highest
levels of industrial pollution (LAR), and approximately in the middle of the longest channel (TOR).
4
Sampling methods
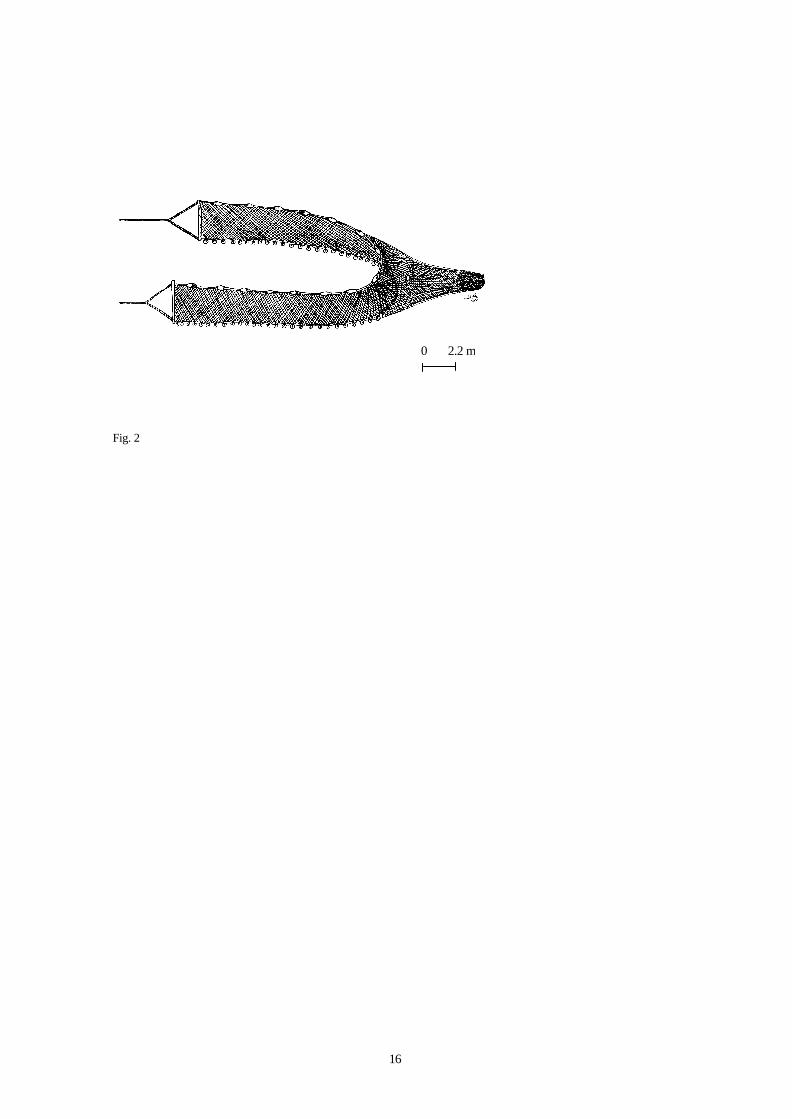
Samples were monthly taken in triplicate at low tide with a “chincha”, a traditional beach-seine (Fig.
2). The area enclosed by the chincha was approximately 1000 m2 at all stations except at VAG where it was
800 m2 due to a narrow topographic configuration. Stretched mesh sizes in the chincha were 19 mm at the
wings, 17 mm at the cod mouth, 16 mm at the cod sleeve, and 10 mm at the cod-end piece.
Abiotic parameters (temperature and dissolved oxygen) were recorded with an oxygen meter
(CONSORT Z621), salinity was recorded with a refractometer (ATAGO) and water transparency was
estimated based on turbidity and Secchi depth, according to Yáñez-Arancibia et al., 1983 (in Rebelo, 1992).
Fishes were preserved by freezing. At the laboratory each specimen was identified, according to
the taxonomic keys of Bauchot and Pras (1987) and Whitehead et al. (1986), measured (total length), and
weighed (total weight).
Data analysis
Two-way ANOVA without replication (Zar, 1984; Sokal and Rohlf, 1995) was carried out to test
significant differences among the abiotic parameters between stations and months. Homogeneity of
variances was tested using the Fmax test (Zar, 1984; Sokal and Rohlf, 1995).
The assemblage structure and dynamics were calculated according to the following parameters:
a) species richness, Margalef index (R) (Margalef, 1958 in Ludwig and Reynolds, 1988; Legendre
and Legendre, 1984b), which refers to a total number of species that compose a community, and is
described by:
RS
n=
−1ln( )
, with S the total number of species and n the total number of individuals observed in a
sample. b) species diversity index (N2), (Hill, 1973) is defined by the inverse of the Simpson index (λ),
N 21
=λ
, where SiNnS
i
i ,...,3,2,1,1
=
= ∑
=
λ with ni the number of specimens of i species and N the total
number of individuals of the S species of a population.

5
c) evenness index, (E) (Ludwig and Reynolds, 1988) which varies between 0 and 1,
( )E
NNHe
=−
−=
−−
1 1
1
2 11 1
λ'
, λ is the Simpson index, H’ is the Shannon-Wiener index and N2 and N1 are the
diversity numbers (Hill, 1973), where '1 HeN = and Sinn
nn
HS
i
ii ,...,3,2,1,ln.'1
=
−= ∑
=
with ni the
abundance of the i species, and n the abundance of all species.
In order to understand the use and importance of the lagoon for fish, species were grouped, using
the method of Elliott and Dewailly (1995). Six categories were defined according to their biology and
behaviour and using background information for the lagoon (Osório, 1912; Nobre et al., 1915; Arruda et
al., 1988; Rebelo, 1992). The categories were i) estuarine resident species (ER), which spend their entire
lives in the estuary; ii) marine adventitious visitors (MA), which occur irregularly in the estuary but have
no apparent estuarine requirements; iii) diadromous (catadromous or anadromous) (CA) migrant species,
which use the estuary to pass between salt and fresh waters for spawning and feeding; iv) marine
seasonal migrant species (MS), which make regular seasonal visits to the estuary usually as adults; v)
marine juvenile migrant species (MJ), which use the estuary primarily as a nursery ground, usually
spawning and spending much of their adult life at sea but often returning seasonally to the estuary; vi) the
freshwater adventitious species (FW), which occasionally enter brackish waters from fresh waters but
have no apparent estuarine requirements.
The data were analysed using a multivariate approach; the sampling stations were clustered
according to Bray-Curtis distance (Legendre and Legendre, 1984), by the ecological characteristics of their
species, the diversity indexes and by the guilds abundance. The clustering was made using the
unweighted, pair-group method using arithmetic averages (UPGMA) (Sneath and Sokal, 1973; Legendre
and Legendre, 1984).
The influence of the abiotic parameters on the results of the previous clustering was studied by
simple canonical analysis, using the Mahalanobis (D2) multivariate distance between the abiotic
parameters recorded in two clustered groups. The percentage contribution of each abiotic parameter was
also estimated for the multivariate distance of the groups. These calculations were made using NTSYS-pc
(Anon, 1989) and SDA.BAS (Ludwig and Reynolds, 1988).

6
RESULTS
Abiotic parameters
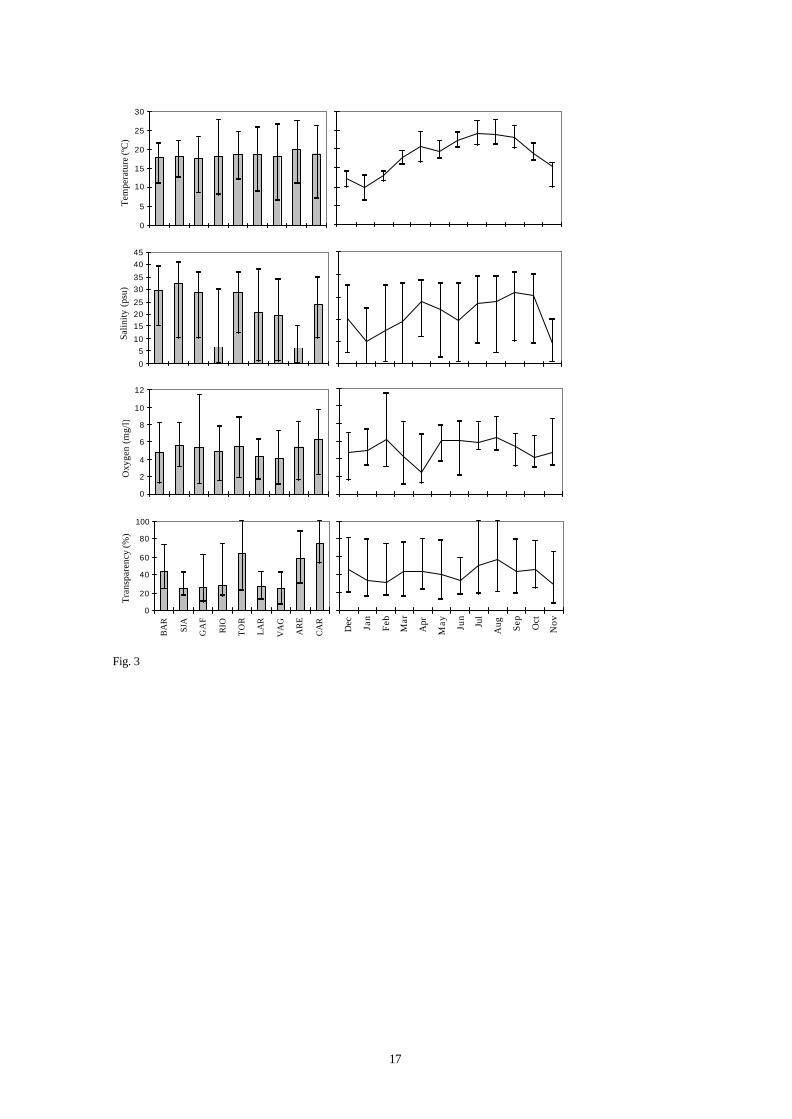
The Ria de Aveiro is influenced by a marine temperate climate. Water temperature varies from 6.5ºC
in the winter to 27.6ºC in the summer. The spatial variation of temperature was not statistically significant
(Table I); however, the observed seasonal temperature amplitudes, in each area, showed significant
differences (Table I). At the channels edges (ARE, CAR, VAG) and at the intermediate stations (LAR, RIO,
TOR), where the water turnover is lower, the water temperature followed the air temperature: 20.5 – 27.6ºC
in summer and 6.5 – 14.0ºC in winter (Fig. 3).
The salinity significantly varied spatially with typically freshwater (ARE and RIO), brackish water
(VAG, LAR and CAR), and marine water, close to the mouth of the lagoon (BAR, SJA, GAF and TOR)
(Table I). Seasonally, salinity variations generally followed those of the temperature (Fig. 3).
The mean spatial variation of dissolved oxygen; although not significant (Table I), showed levels
near the anoxia (1.25 mg.l-1, in BAR), intermediate values (7.76 mg.l-1, in RIO) and oversaturated values
(11.39 mg.l-1, in GAF). The seasonal variations of dissolved oxygen were significant and approximately
inverse of the temperature and salinity (Fig. 3).
The transparency varied significantly among the stations, between 11.9% (LAR) and 100% (TOR
and CAR) (Fig. 3), but the seasonal variation was not significant (Table I).
Community structure
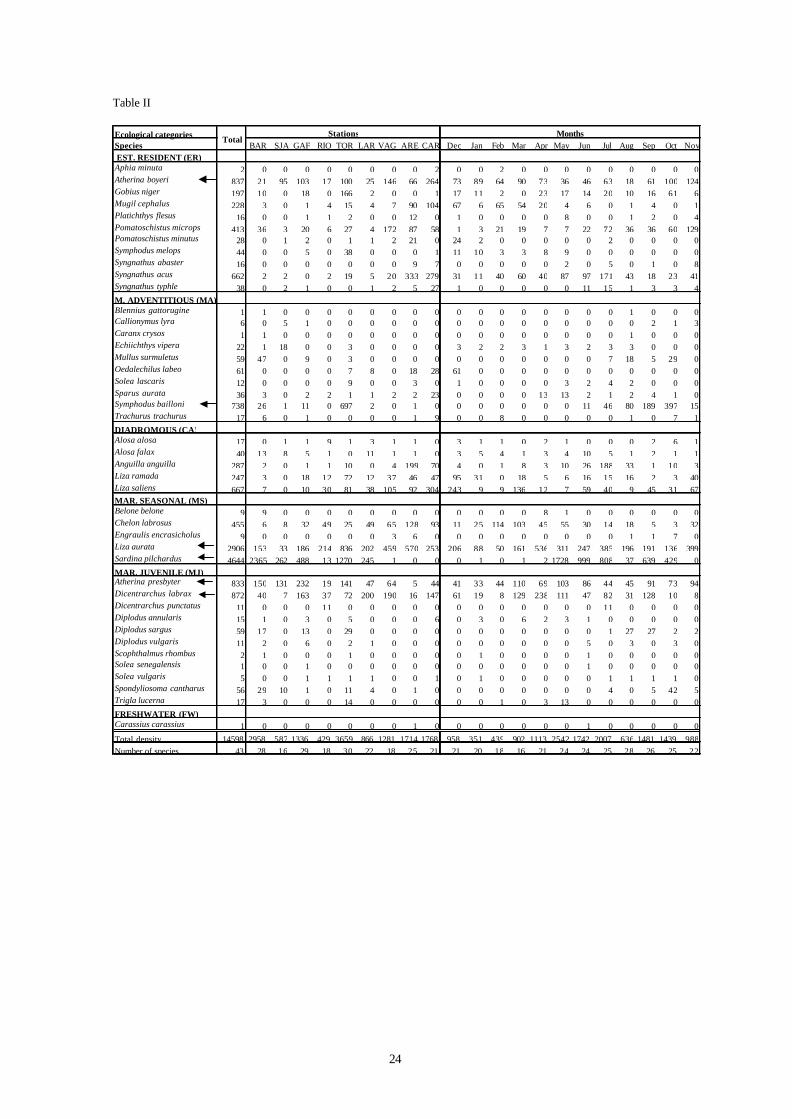
A total of 43 teleost species was identified from 14,598 specimens. The data set of the fishfauna
density over stations and months is given in table II. The six most abundant species (marked with an
arrow), although not occurring across the whole lagoon area or during the whole sampling period,
represented more than 74% of the total fish abundance.
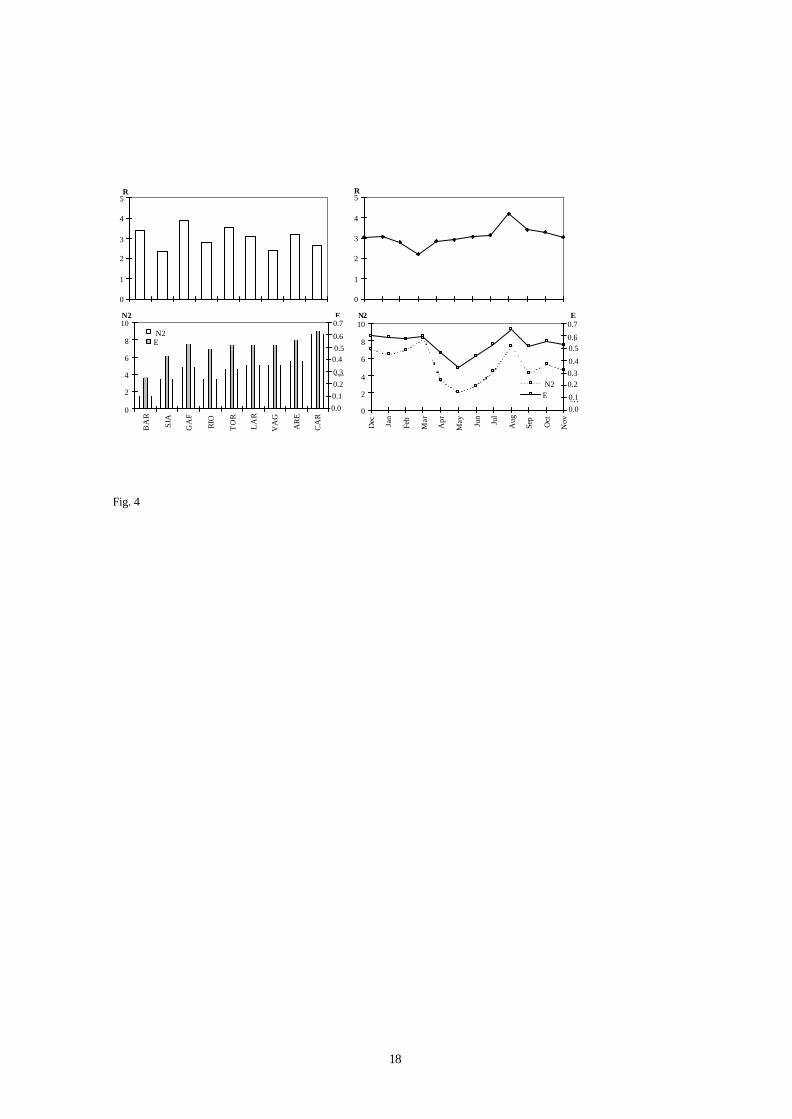
The variation of community indices (species richness, diversity and evenness) is shown according
to the distance from the mouth of the lagoon and by month in figure 4. Specific richness showed some
fluctuations among the sampling stations. Species diversity and evenness were lower at the mouth of the
lagoon; therefore the communities in the upper reaches of the channels were characterised as the best
structured of the lagoon (Fig. 4).
7
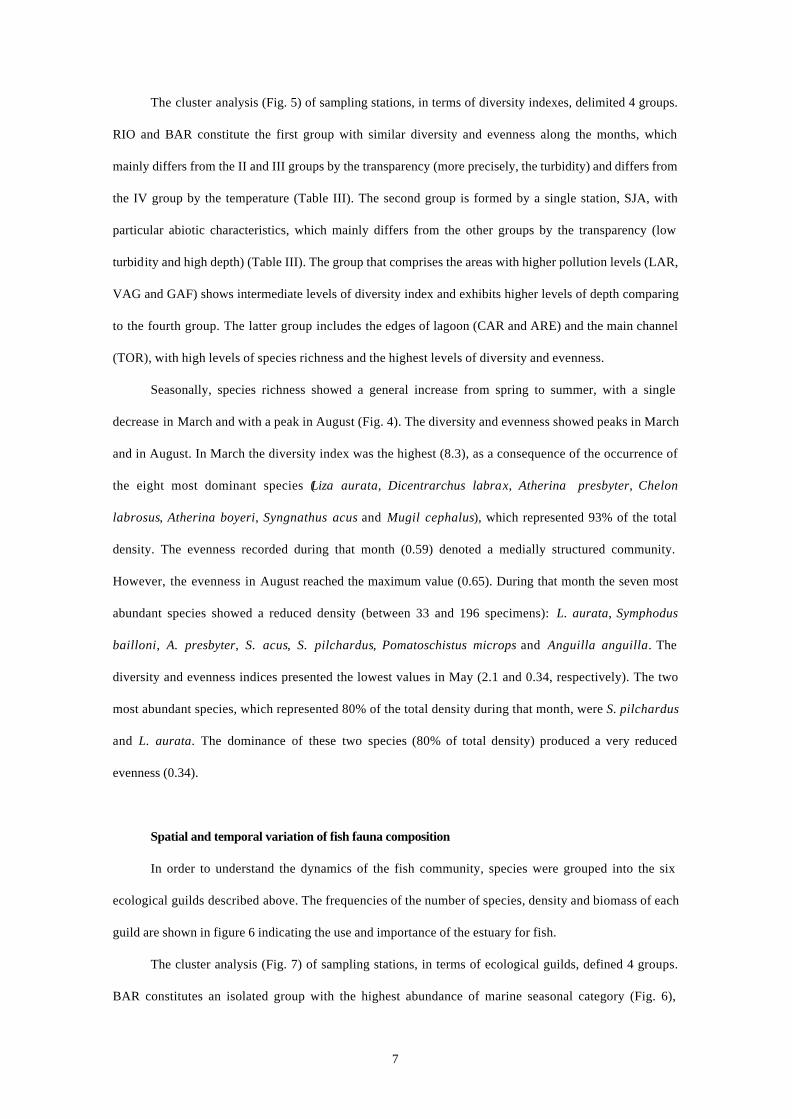
The cluster analysis (Fig. 5) of sampling stations, in terms of diversity indexes, delimited 4 groups.
RIO and BAR constitute the first group with similar diversity and evenness along the months, which
mainly differs from the II and III groups by the transparency (more precisely, the turbidity) and differs from
the IV group by the temperature (Table III). The second group is formed by a single station, SJA, with
particular abiotic characteristics, which mainly differs from the other groups by the transparency (low
turbidity and high depth) (Table III). The group that comprises the areas with higher pollution levels (LAR,
VAG and GAF) shows intermediate levels of diversity index and exhibits higher levels of depth comparing
to the fourth group. The latter group includes the edges of lagoon (CAR and ARE) and the main channel
(TOR), with high levels of species richness and the highest levels of diversity and evenness.
Seasonally, species richness showed a general increase from spring to summer, with a single
decrease in March and with a peak in August (Fig. 4). The diversity and evenness showed peaks in March
and in August. In March the diversity index was the highest (8.3), as a consequence of the occurrence of
the eight most dominant species (Liza aurata, Dicentrarchus labrax, Atherina presbyter, Chelon
labrosus, Atherina boyeri, Syngnathus acus and Mugil cephalus), which represented 93% of the total
density. The evenness recorded during that month (0.59) denoted a medially structured community.
However, the evenness in August reached the maximum value (0.65). During that month the seven most
abundant species showed a reduced density (between 33 and 196 specimens): L. aurata, Symphodus
bailloni, A. presbyter, S. acus, S. pilchardus, Pomatoschistus microps and Anguilla anguilla. The
diversity and evenness indices presented the lowest values in May (2.1 and 0.34, respectively). The two
most abundant species, which represented 80% of the total density during that month, were S. pilchardus
and L. aurata. The dominance of these two species (80% of total density) produced a very reduced
evenness (0.34).
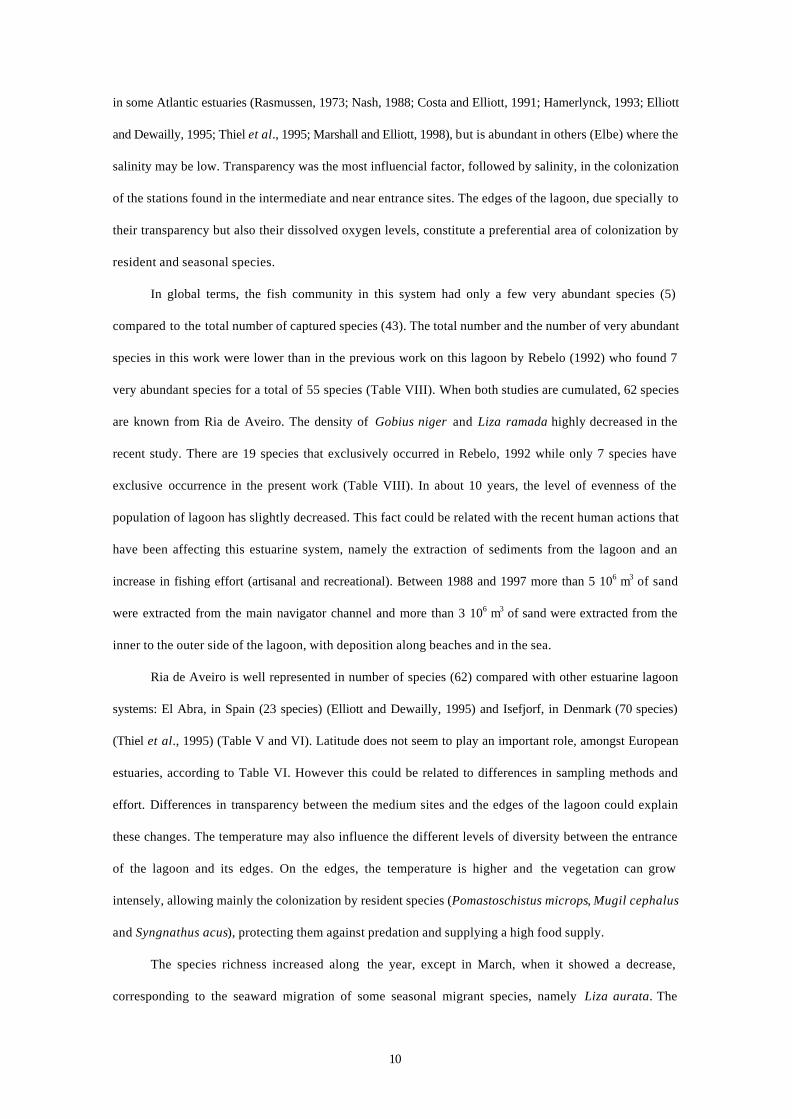
Spatial and temporal variation of fish fauna composition
In order to understand the dynamics of the fish community, species were grouped into the six
ecological guilds described above. The frequencies of the number of species, density and biomass of each
guild are shown in figure 6 indicating the use and importance of the estuary for fish.
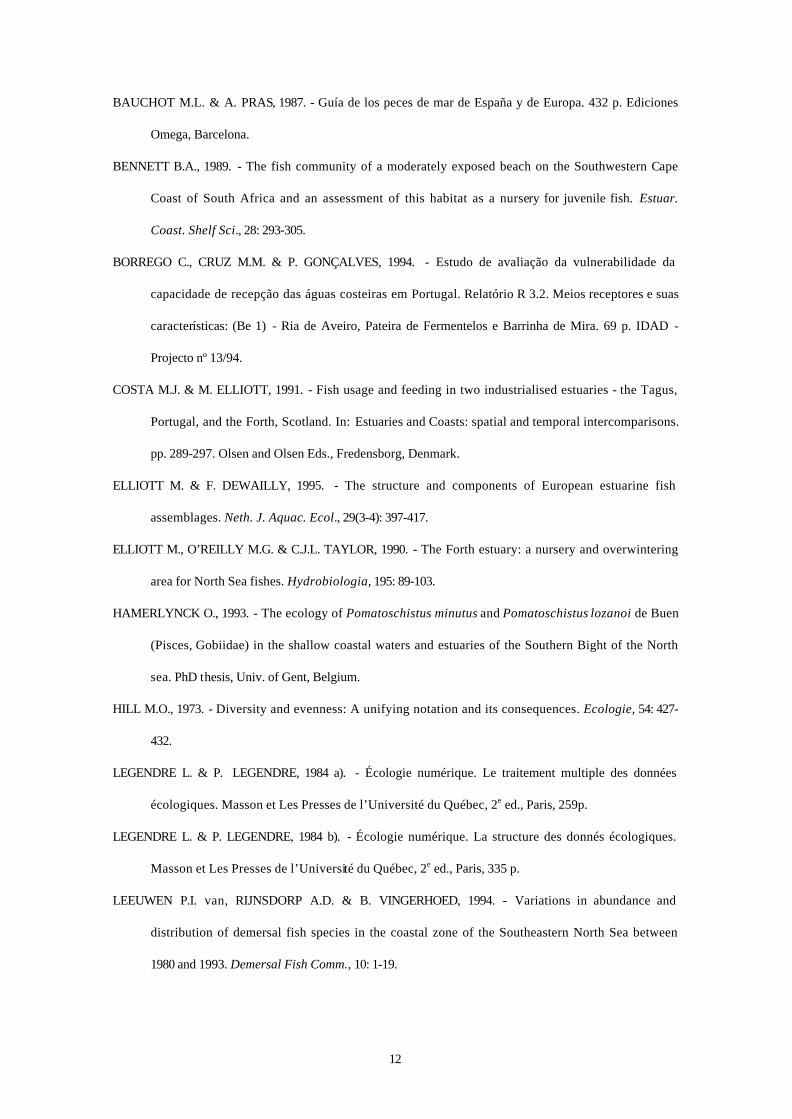
The cluster analysis (Fig. 7) of sampling stations, in terms of ecological guilds, defined 4 groups.
BAR constitutes an isolated group with the highest abundance of marine seasonal category (Fig. 6),

8
despite the occurrence of a low number of species (5), represented by higher density (54%) than biomass
(46%). This ecological category showed a high proportion at all the sampling stations, especially at BAR
with more than 80% of total density (Fig. 6). From April to July the highest density levels of this category
correspond to the recruitment of S. pilchardus. The second group comprises the intermediate areas (LAR,
RIO and SJA), in which the marine juvenile migrant species presented higher densities than the resident
ones (Fig. 6). All the specimens included in this category belong to the families Moronidae, Sparidae and
Soleidae, contributing to higher biomass than density (Fig. 6). The main food items of this ecological
category are insects, mysids, molluscs, isopods and amphipods. Two species are noticeable for their large
distribution in all the lagoon area and for their high density: A. presbyter and D. labrax. These species
contributed to the general predominance of this category in this group during March and April. The
station of this group differs from the first and third group by the transparency and from the fourth group
especially by the oxy gen levels (Table IV). On the TOR, VAG and GAF stations, in spite of high densities
of marine seasonal species, the resident species are more abundant than the marine juveniles. The
estuarine resident category is mainly characterised by small species, such as gobiidae and syngnathidae,
inducing a biomass lower than the density. The diet of this category is based on isopods, insects and
decapods. Compared with BAR the low salinity constitutes the abiotic parameter that contributes to the
difference of species occurrence. Compared with the fourth group the low depth constitutes the most
important parameter. The north and south edges of the lagoon (CAR and ARE, respectively) showed the
highest abundance of resident species, especially during winter. The diadromous species contributed to
more than 10% of total density, occurring particularly in this group during December, January and March,
corresponding to the period of lagoon recruitment of the species A. anguilla, Alosa spp. and Liza spp.
Diadromous species feed mainly on copepods, insects and mysids. This group differs from the others
especially by its low transparency (Table IV). The freshwater group shows low representativity in density
or biomass because only one Carassius carassius was caught.
DISCUSSION
In the estuarine coastal lagoon of Ria de Aveiro, the seasonal climatic variations produce regularly
a high number of species, but also contribute to the occurrence of well-adapted species exhibiting high
productive potential. The most abundant species occur in Torreira, Barra and Carregal, shallow areas with

9
high levels of transparency and primary production (Rebelo, 1992), suggesting that the preference of these
species are related to a high availability of food. Seasonally the most abundant species were found in mid-
summer, when the oxygen levels, as well as the primary production, are higher than during the other
periods. The biomass showed some flutuations along the year but was higher on the edges of the lagoon
than in the other areas.
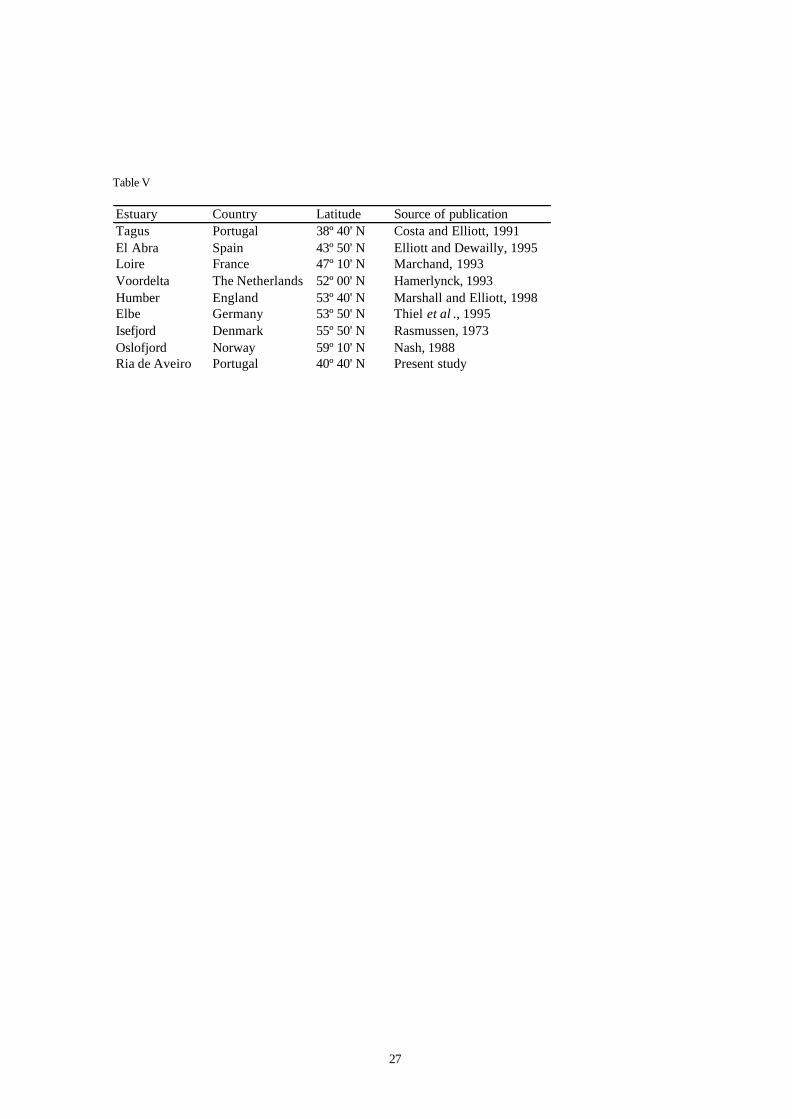
The fishfauna of the Ria de Aveiro is represented by a number of species (43) very similar to other
European estuarine ecosystems (Table V and VI). The species well adapted to the environmental fluctuant
conditions of this system stay in the lagoon during all their lifecycles (ER) or depend on the lagoon during
their juvenile stage (MJ). These ecological groups have colonised the lagoon since 1912 (Osório, 1912;
Nobre et al., 1915; Arruda et al., 1988; Rebelo, 1992). The marine seasonal species (MS) occurred in higher
abundance at the entrance of the lagoon and during summer, corresponding to a period of intensive
migratory activity. Sardina pilchardus and Liza aurata are noticeable in this group for their high
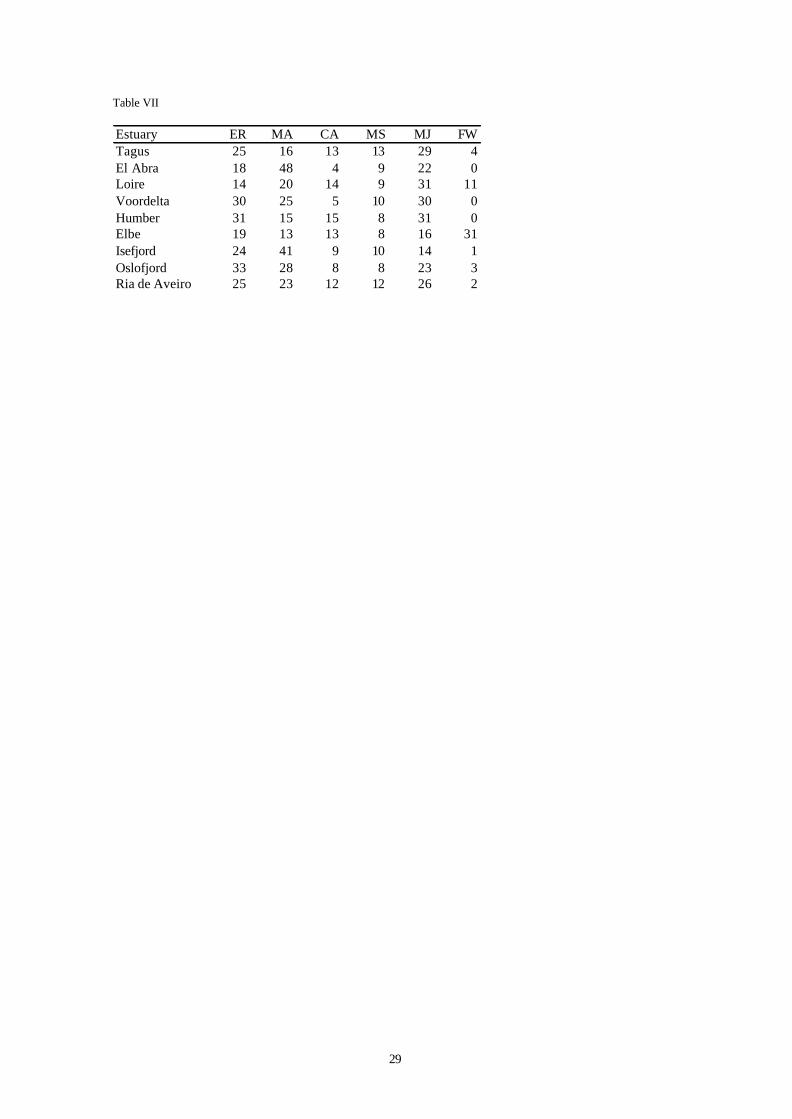
abundance. The diversity of marine seasonal species (MS) is lower than of resident species (ER), like in
other estuaries of the Atlantic coast (Table VII). The adventitious species (MA) accidentally visit the
lagoon because of currents or for trophic motivations (Rebelo, 1992). In other European estuaries, such as
El Abra, in Spain (Elliott and Dewailly, 1995) and Isefjord, in Denmark (Rasmussen, 1973) (Table VII), the
number of species in this group is higher than in our study, reaching more than 40% of all species. In the
present study, although the number of species is very similar to the other categories the abundance was
very low. The dominant species in this group, Symphodus bailloni was very abundant in a region,
Torreira, and during a period, between June and November, when the salinity values were close to the
marine water, approximately 30 psu. The species that use estuaries as a nursery (MJ) occur at low salinity
values. It is noticeable that Dicentrarchus labrax and Atherina presbyter dominate the other nine species
of this category. These fish (MJ) are also well distributed in all the other European coastal lagoons (Table
VII).
Catadromous species (CA), which include Anguilla spp., Alosa spp. and some Liza spp., are well
represented in terms of number of species (12) compared to other European lagoons, from 4 species in El
Abra, in Spain (Elliott and Dewailly, 1995) to 15 species in the Humber Estuary, in England (Marshall and
Elliott, 1998). The freshwater species category (FW) comprised only one species, Carassius carassius,
which distribution is restricted to Areão, with an average salinity of 6. This category is not known to occur
10
in some Atlantic estuaries (Rasmussen, 1973; Nash, 1988; Costa and Elliott, 1991; Hamerlynck, 1993; Elliott
and Dewailly, 1995; Thiel et al., 1995; Marshall and Elliott, 1998), but is abundant in others (Elbe) where the
salinity may be low. Transparency was the most influencial factor, followed by salinity, in the colonization
of the stations found in the intermediate and near entrance sites. The edges of the lagoon, due specially to
their transparency but also their dissolved oxygen levels, constitute a preferential area of colonization by
resident and seasonal species.
In global terms, the fish community in this system had only a few very abundant species (5)
compared to the total number of captured species (43). The total number and the number of very abundant
species in this work were lower than in the previous work on this lagoon by Rebelo (1992) who found 7
very abundant species for a total of 55 species (Table VIII). When both studies are cumulated, 62 species
are known from Ria de Aveiro. The density of Gobius niger and Liza ramada highly decreased in the
recent study. There are 19 species that exclusively occurred in Rebelo, 1992 while only 7 species have
exclusive occurrence in the present work (Table VIII). In about 10 years, the level of evenness of the
population of lagoon has slightly decreased. This fact could be related with the recent human actions that
have been affecting this estuarine system, namely the extraction of sediments from the lagoon and an
increase in fishing effort (artisanal and recreational). Between 1988 and 1997 more than 5 106 m3 of sand
were extracted from the main navigator channel and more than 3 106 m3 of sand were extracted from the
inner to the outer side of the lagoon, with deposition along beaches and in the sea.
Ria de Aveiro is well represented in number of species (62) compared with other estuarine lagoon
systems: El Abra, in Spain (23 species) (Elliott and Dewailly, 1995) and Isefjorf, in Denmark (70 species)
(Thiel et al., 1995) (Table V and VI). Latitude does not seem to play an important role, amongst European
estuaries, according to Table VI. However this could be related to differences in sampling methods and
effort. Differences in transparency between the medium sites and the edges of the lagoon could explain
these changes. The temperature may also influence the different levels of diversity between the entrance
of the lagoon and its edges. On the edges, the temperature is higher and the vegetation can grow
intensely, allowing mainly the colonization by resident species (Pomastoschistus microps, Mugil cephalus
and Syngnathus acus), protecting them against predation and supplying a high food supply.
The species richness increased along the year, except in March, when it showed a decrease,
corresponding to the seaward migration of some seasonal migrant species, namely Liza aurata. The

11
diversity and evenness were higher in spring and in the middle of summer. According to Bennett (1989)
and Monteiro (1989), the seasonal variation of number, distribution and density of species in the lagoon
system is more related with the migratory activity than with the variation of abiotic parameters. However,
in this study, the temperature and the salinity allow to split the year into three seasonal discontinuities:
November to April, May, and June to October. The first period corresponds to low temperature and
salinity and high migration levels of seasonal migrant species. May is characterised by the massive
recruitment of schooling species, especially Sardina pilchardus, which disturbs the evenness of the
system, as well as the diversity index. The last period, from June to October, corresponds to the entrance
in the lagoon of the catadromous species Anguilla anguilla and the adventitious species Symphodus
bailloni, which comprises the best structured period with higher specific diversities.
It may be concluded that as the other European estuarine lagoon ecosystems (Alcolado, 1996), the
fish community in the Ria de Aveiro can be organized in a well-defined seasonal and spatial patterns. This
ecotone is greatly influenced by the abiotic conditions that affect the ichthyological system since it
supports abundant sedentary species, provides a suitable nursery area to marine migratory species and is
sought by many occasional species, particularly in their juvenile stage, as the other estuarine ecosystems
in general (Leeuwen et al., 1994).
Acknowledgements. - We would like to thank people who helped in the field and lab work and the
University of Aveiro that supported this study. We are very grateful to Professor Mike Elliott for his
precious advice and review of the manuscript. Thanks to the reviewers that improved the paper by their
remarks.
REFERENCES
ALCOLADO P.M., 1996. - Controversia sobre la relación entre la diversidad de especies y la estabilidad de
las comunidades . Avicennia 4/5: 13-26.
ANON, 1989. – NTSYS-pc. Version 1.5. Applied Biostatistics Inc.
ARRUDA L.M., ANDRADE J.P. & M.M. CUNHA, 1988. - Abundance, diversity and community structure
of the fish population in the Ria de Aveiro (Portugal). Oceanol. Acta, 11(3): 235-240.
BARROSA J.O., 1980. - A Ria de Aveiro e a sua influência na economia da região. Recur. hídr., 1(3): 83-96.
12
BAUCHOT M.L. & A. PRAS, 1987. - Guía de los peces de mar de España y de Europa. 432 p. Ediciones
Omega, Barcelona.
BENNETT B.A., 1989. - The fish community of a moderately exposed beach on the Southwestern Cape
Coast of South Africa and an assessment of this habitat as a nursery for juvenile fish. Estuar.
Coast. Shelf Sci., 28: 293-305.
BORREGO C., CRUZ M.M. & P. GONÇALVES, 1994. - Estudo de avaliação da vulnerabilidade da
capacidade de recepção das águas costeiras em Portugal. Relatório R 3.2. Meios receptores e suas
características: (Be 1) - Ria de Aveiro, Pateira de Fermentelos e Barrinha de Mira. 69 p. IDAD -
Projecto nº 13/94.
COSTA M.J. & M. ELLIOTT, 1991. - Fish usage and feeding in two industrialised estuaries - the Tagus,
Portugal, and the Forth, Scotland. In: Estuaries and Coasts: spatial and temporal intercomparisons.
pp. 289-297. Olsen and Olsen Eds., Fredensborg, Denmark.
ELLIOTT M. & F. DEWAILLY, 1995. - The structure and components of European estuarine fish
assemblages. Neth. J. Aquac. Ecol., 29(3-4): 397-417.
ELLIOTT M., O’REILLY M.G. & C.J.L. TAYLOR, 1990. - The Forth estuary: a nursery and overwintering
area for North Sea fishes. Hydrobiologia, 195: 89-103.
HAMERLYNCK O., 1993. - The ecology of Pomatoschistus minutus and Pomatoschistus lozanoi de Buen
(Pisces, Gobiidae) in the shallow coastal waters and estuaries of the Southern Bight of the North
sea. PhD thesis, Univ. of Gent, Belgium.
HILL M.O., 1973. - Diversity and evenness: A unifying notation and its consequences. Ecologie, 54: 427-
432.
LEGENDRE L. & P. LEGENDRE, 1984 a). - Écologie numérique. Le traitement multiple des données
écologiques. Masson et Les Presses de l’Université du Québec, 2e ed., Paris, 259p.
LEGENDRE L. & P. LEGENDRE, 1984 b). - Écologie numérique. La structure des donnés écologiques.
Masson et Les Presses de l’Université du Québec, 2e ed., Paris, 335 p.
LEEUWEN P.I. van, RIJNSDORP A.D. & B. VINGERHOED, 1994. - Variations in abundance and
distribution of demersal fish species in the coastal zone of the Southeastern North Sea between
1980 and 1993. Demersal Fish Comm., 10: 1-19.

13
LIMA C., 1986. - Impacto da poluição por mercúrio nos organismos aquáticos da Ria de Aveiro . Relat. Inst.
Nac. Invest. Pescas, 66: 28 p.
LUCAS M.F., CALDEIRA M.T., HALL A., DUARTE A.C. & C. LIMA, 1986. - Distribution of mercury in
the sediments and fishes of the lagoon of Aveiro, Portugal. Water Sci. Technol., 18: 141-148.
LUDWIG J.A. & J.F. REYNOLDS, 1988. - Statistical Ecology. A primer on Methods and Computing. 337 p.
Wiley-Interscience Publications, New York.
MARSHALL S. & M. ELLIOTT, 1998. - Environmental influences on the fish assemblage of the Humber
Estuary, UK. Estuar., Coast. Shelf Sci., 46:175-184
MONTEIRO C.L.C., 1989. – La faune ichthyologique de la lagune Ria Formosa (sud Portugal). Dissertation,
Instituto Nacional de Investigação das Pescas, Algés, Portugal, 218 p.
NASH R.D.M., 1988. - The effects of disturbance and severe seasonal fluctuations in environmental
conditions on north temperate shallow-water fish assemblages. Estuar. Coast. Shelf Sci., 26: 123-
125.
NOBRE A., AFREIXO J. & J. MACEDO, 1915. - A Ria de Aveiro, Relatório oficial do regulamento da Ria de
28 de Dezembro de 1912. Imprensa Nacional, Lisboa, 197 p.
OSÓRIO B., 1912. - Pescas e peixes. Uma nota relativa à pesca e aos peixes da Ria de Aveiro. Bol. Soc.
Geogr. Lisboa, 30(4-5): 216-224 e 30(6): 264-271.
POMFRET J.R., ELLIOTT M., O’REILLY M.G. & S. PHILLIPS, 1991. - Spatial and temporal patterns in the
fish communities in two UK North Sea estuaries. Estuar. Coasts: Spat. Temp. Intercomp., 87: 277-
284
POTTER I.C., BECKLEY L.E., WHITFIELD A.K. & R.C.J. LENANTON, 1990. - Comparisons between the
roles played by estuaries in the life cycles of fishes in temperate Western Australia and Southern
Africa. Environ. Biol. Fish., 28: 143-178.
RASMUSSEN E., 1973. - Systematics and ecology of the Isefjord marine fauna (Denmark). Ophelia, 11: 1-
507.
REBELO J.E., 1992. - The ichthyofauna and abiotic hydrological environment of the Ria de Aveiro,
Portugal. Estuaries, 15(3): 403-415.
SNEATH P.H.A. & R.R. SOKAL, 1973. - Numerical Taxonomy . W.H. Freeman and Company, San
Francisco, 573 p.

14
SOKAL R.R. & J.F. ROHLF, 1995. - Biometry. W.H.Freeman and company, New York. 3rd ed., 887 p.
WHITEHEAD P.J.P., BAUCHOT M.-L., HUREAU J.-C., NIELSEN J. & E. TORTONESE, 1986. - Fish. North-
eastern Atl. Med.. 3 vols. UNESCO, U.K., 1984 p.
THIEL R., SEPULVEDA, KAGEMAN R. & W. NELLEN, 1995. - Environmental factors as forces structuring
the fish community of the Elbe estuary. J. Fish Biol., 46:47-69.
ZAR J.H., 1984. - Biostatistical Analysis . 718 p. Prentice-Hall, Inc., 2nd ed., New Jersey.
15
Fig. 1
16
Fig. 2
0 2.2 m
17
0
5
10
15
20
25
30
Tem
pera
ture
(ºC
)
0
510
152025
3035
4045
Salin
ity (
psu)
0
2
4
6
8
10
12
Oxy
gen
(mg/
l)
Dec Jan
Feb
Mar
Apr
May Ju
n
Jul
Aug Sep Oct
Nov
0
20
40
60
80
100
BA
R
SJA
GA
F
RIO
TO
R
LAR
VA
G
AR
E
CA
R
Tra
nspa
renc
y (%
)
Fig. 3
18
0
1
2
3
4
5R
0
1
2
3
4
5R
0
2
4
6
8
10
BA
R
SJA
GA
F
RIO
TO
R
LA
R
VA
G
AR
E
CA
RN2
0,0
0,10,20,30,4
0,50,6
0,7E
N2E
0.7
0.60.5
0.4
0.30.20.10.0 0
2
4
6
8
10
Dec Jan
Feb
Mar
Apr
May Jun
Jul
Aug
Sep
Oct
Nov
N2
00,1
0,20,30,4
0,50,6
0,7E
N2E
0.7
0.60.5
0.40.30.2
0.10.0
Fig. 4

19
RIO IBARSJA II
VAGLAR IIIGAFTORCAR IVARE
1.00 0.96 0.80 0.64 0.48 0.32 0.16 0.00
Fig. 5

20
0%
20%
40%
60%
80%
100%
Dec Jan
Feb
Mar
Apr
May Ju
n
Jul
Aug Sep
Oct
Nov
Biomass (113.2 kg)
0%
20%
40%
60%
80%
100%
BA
R
SJA
GA
F
RIO
TO
R
LA
R
VA
G
AR
E
CA
R
ERMACAMSMJFW
0%
20%
40%
60%
80%
100%
Dec Jan
Feb
Mar
Apr
May Ju
n
Jul
Aug Sep
Oct
Nov
0%
20%
40%
60%
80%
100%
BA
R
SJA
GA
F
RIO
TO
R
LA
R
VA
G
AR
E
CA
R
ERMACAMSMJFW
0%
20%
40%
60%
80%
100%
Dec Jan
Feb
Mar
Apr
May Ju
n
Jul
Aug Sep
Oct
Nov
Number of species (43)
Density (14,598 specimens)
0%
20%
40%
60%
80%
100%
BA
R
SJA
GA
F
RIO
TO
R
LA
R
VA
G
AR
E
CA
R
ERMACAMSMJFW
Fig. 6

21
BAR IRIOSJA IILARTORVAG IIIGAFCARARE IV
1.00 0.96 0.80 0.64 0.48 0.32 0.16 0.00
Fig. 7

22
Figure legends
Fig. 1. - Map of the Ria de Aveiro lagoon showing sampling stations ( ): ARE= Areão, BAR= Barra,
CAR= Carregal, GAF= Gafanha, LAR= Laranjo, RIO= Rio Novo de Príncipe, SJA= São Jacinto, TOR=
Torreira, VAG= Vagos.
Fig. 2. - Perspective drawing of the “chincha”, showing the conical cod-end in the centre of the net. Scale
bar= 1:220 cm.
Fig. 3. - Minimum, mean and maximum values of abiotic parameters by sampling stations and months.
Fig. 4. - Variation of diversity indices by sampling stations and by months. A: Margalef index (R); B:
Diversity (N2) and evenness (E).
Fig. 5. - Dendrogram of sampling stations, for the diversity indexes. The vertical line defines the groups (I,
II, III and IV) used in the discriminant analysis.
Fig. 6. - Frequencies (%) of the number of species, density and biomass of estuarine resident species (ER),
marine adventitious visitors (MA), diadromous (catadromous and anadromous migrant species) (CA),
marine seasonal migrant species (MS), marine juvenile migrant species (MJ) and freshwater adventitious
species (FW).

23
F P F PTemperature 0.254 ns 64.500 ***Salinity 13.990 *** 4.744 ***Dissolved oxygen 1.343 * 4.068 ***Transparency 19.860 *** 1.167 *
Stations MonthsParameters
Fig. 7. - Dendrogram of sampling stations, for the ecological guilds abundance. The vertical line defines
the groups (I, II, III and IV) used in the discriminant analysis.
Table I
24
Table II
Ecological categoriesSpecies BAR SJA GAF RIO TOR LAR VAG ARE CAR Dec Jan Feb Mar Apr May Jun Jul Aug Sep Oct Nov EST. RESIDENT (ER)Aphia minuta 2 0 0 0 0 0 0 0 0 2 0 0 2 0 0 0 0 0 0 0 0 0Atherina boyeri 837 21 95 103 17 100 25 146 66 264 73 89 64 90 73 36 46 63 18 61 100 124Gobius niger 197 10 0 18 0 166 2 0 0 1 17 11 2 0 23 17 14 20 10 16 61 6Mugil cephalus 228 3 0 1 4 15 4 7 90 104 67 6 65 54 20 4 6 0 1 4 0 1Platichthys flesus 16 0 0 1 1 2 0 0 12 0 1 0 0 0 0 8 0 0 1 2 0 4Pomatoschistus microps 413 36 3 20 6 27 4 172 87 58 1 3 21 19 7 7 22 72 36 36 60 129Pomatoschistus minutus 28 0 1 2 0 1 1 2 21 0 24 2 0 0 0 0 0 2 0 0 0 0Symphodus melops 44 0 0 5 0 38 0 0 0 1 11 10 3 3 8 9 0 0 0 0 0 0Syngnathus abaster 16 0 0 0 0 0 0 0 9 7 0 0 0 0 0 2 0 5 0 1 0 8Syngnathus acus 662 2 2 0 2 19 5 20 333 279 31 11 40 60 40 87 97 171 43 18 23 41Syngnathus typhle 38 0 2 1 0 0 1 2 5 27 1 0 0 0 0 0 11 15 1 3 3 4M. ADVENTITIOUS (MA)Blennius gattorugine 1 1 0 0 0 0 0 0 0 0 0 0 0 0 0 0 0 0 1 0 0 0Callionymus lyra 6 0 5 1 0 0 0 0 0 0 0 0 0 0 0 0 0 0 0 2 1 3Caranx crysos 1 1 0 0 0 0 0 0 0 0 0 0 0 0 0 0 0 0 1 0 0 0Echiichthys vipera 22 1 18 0 0 3 0 0 0 0 3 2 2 3 1 3 2 3 3 0 0 0Mullus surmuletus 59 47 0 9 0 3 0 0 0 0 0 0 0 0 0 0 0 7 18 5 29 0Oedalechilus labeo 61 0 0 0 0 7 8 0 18 28 61 0 0 0 0 0 0 0 0 0 0 0Solea lascaris 12 0 0 0 0 9 0 0 3 0 1 0 0 0 0 3 2 4 2 0 0 0Sparus aurata 36 3 0 2 2 1 1 2 2 23 0 0 0 0 13 13 2 1 2 4 1 0Symphodus bailloni 738 26 1 11 0 697 2 0 1 0 0 0 0 0 0 0 11 46 80 189 397 15Trachurus trachurus 17 6 0 1 0 0 0 0 1 9 0 0 8 0 0 0 0 0 1 0 7 1DIADROMOUS (CA)Alosa alosa 17 0 1 1 9 1 3 1 1 0 3 1 1 0 2 1 0 0 0 2 6 1Alosa falax 40 13 8 5 1 0 11 1 1 0 3 5 4 1 3 4 10 5 1 2 1 1Anguilla anguilla 287 2 0 1 1 10 0 4 199 70 4 0 1 8 3 10 26 188 33 1 10 3Liza ramada 247 3 0 18 12 72 12 37 46 47 95 31 0 18 5 6 16 15 16 2 3 40Liza saliens 667 7 0 10 30 81 38 105 92 304 243 9 9 136 12 7 59 40 9 45 31 67MAR. SEASONAL (MS)Belone belone 9 9 0 0 0 0 0 0 0 0 0 0 0 0 8 1 0 0 0 0 0 0Chelon labrosus 455 6 8 32 49 25 49 65 128 93 11 25 114 103 45 55 30 14 18 5 3 32Engraulis encrasicholus 9 0 0 0 0 0 0 3 6 0 0 0 0 0 0 0 0 0 1 1 7 0Liza aurata 2906 153 33 186 214 836 202 459 570 253 206 88 50 161 536 311 247 385 196 191 136 399Sardina pilchardus 4644 2365 262 488 13 1270 245 1 0 0 0 1 0 1 2 1728 999 808 37 639 429 0MAR. JUVENILE (MJ)Atherina presbyter 833 150 131 232 19 141 47 64 5 44 41 33 44 110 69 103 86 44 45 91 73 94Dicentrarchus labrax 872 40 7 163 37 72 200 190 16 147 61 19 8 129 238 111 47 82 31 128 10 8Dicentrarchus punctatus 11 0 0 0 11 0 0 0 0 0 0 0 0 0 0 0 0 11 0 0 0 0Diplodus annularis 15 1 0 3 0 5 0 0 0 6 0 3 0 6 2 3 1 0 0 0 0 0Diplodus sargus 59 17 0 13 0 29 0 0 0 0 0 0 0 0 0 0 0 1 27 27 2 2Diplodus vulgaris 11 2 0 6 0 2 1 0 0 0 0 0 0 0 0 0 5 0 3 0 3 0Scophthalmus rhombus 2 1 0 0 0 1 0 0 0 0 0 1 0 0 0 0 1 0 0 0 0 0Solea senegalensis 1 0 0 1 0 0 0 0 0 0 0 0 0 0 0 0 1 0 0 0 0 0Solea vulgaris 5 0 0 1 1 1 1 0 0 1 0 1 0 0 0 0 0 1 1 1 1 0Spondyliosoma cantharus 56 29 10 1 0 11 4 0 1 0 0 0 0 0 0 0 0 4 0 5 42 5Trigla lucerna 17 3 0 0 0 14 0 0 0 0 0 0 1 0 3 13 0 0 0 0 0 0FRESHWATER (FW)Carassius carassius 1 0 0 0 0 0 0 0 1 0 0 0 0 0 0 0 1 0 0 0 0 0Total density 14598 2958 587 1336 429 3659 866 1281 1714 1768 958 351 439 902 1113 2542 1742 2007 636 1481 1439 988Number of species 43 28 16 29 18 30 22 18 25 21 21 20 18 16 21 24 24 25 28 26 25 22
Stations MonthsTotal

25
Table III
I-II I-III I-IV II-III II-IV III-IV
D2 596475.3 82266.2 101401.7 -5351583.1 745421.3 239416.4Temperature -2.4 0.3 110.8 0.2 -48.4 82.1Salinity 116.4 -200.2 3.1 11.9 175.3 -37.1Dissolved oxygen -101.1 -42.1 -32.8 -2.3 -34.4 -62.9Transparency -33.4 19.6 50.2 47.7 340.2 148.1

26
Table IV
I-II I-III I-IV II-III II-IV III-IV
D2 -1659936.1 -230939.8 262630.5 -218197.8 -767564.3 61225.1Temperature 0.7 -4.2 -71.8 2.8 -7.3 -78.1Salinity 30.6 50.1 42.3 33.3 7.1 16.8Dissolved oxygen 3.4 29.6 -15.4 -6.5 65.8 -19.8Transparency 106.9 22.1 143.2 111.2 10.3 182.6
27
Table V
Estuary Country Latitude Source of publicationTagus Portugal 38º 40' N Costa and Elliott, 1991El Abra Spain 43º 50' N Elliott and Dewailly, 1995Loire France 47º 10' N Marchand, 1993Voordelta The Netherlands 52º 00' N Hamerlynck, 1993Humber England 53º 40' N Marshall and Elliott, 1998Elbe Germany 53º 50' N Thiel et al ., 1995Isefjord Denmark 55º 50' N Rasmussen, 1973Oslofjord Norway 59º 10' N Nash, 1988Ria de Aveiro Portugal 40º 40' N Present study

28
Table VI
Estuary Period Frequency Stations Species Families GearTagus 1976-91 monthly 6 45 23 Beam trawlEl Abra 1989-93 annually 7 23 16 Beam trawlLoire 1981-82 monthly unknown 36 24 Beam trawlVoordelta 1989 monthly 22 40 24 Beam trawlHumber 1992-93 quarterly 14 26 18 Beam trawlElbe 1989-92 unknown 11 62 28 Framed gape stow net,
Demersal otter trawlIsefjord 1940-70 monthly 110 70 38 Commercial, angling, beam trawlOslofjord 1981-82 unknown 2 40 20 Bag beach seineRia de Aveiro 1996-97 monthly 9 43 21 Purse seine-type net ("chincha")
29
Table VII Estuary ER MA CA MS MJ FWTagus 25 16 13 13 29 4El Abra 18 48 4 9 22 0Loire 14 20 14 9 31 11Voordelta 30 25 5 10 30 0Humber 31 15 15 8 31 0Elbe 19 13 13 8 16 31Isefjord 24 41 9 10 14 1Oslofjord 33 28 8 8 23 3Ria de Aveiro 25 23 12 12 26 2

30
Table VIII
Family Species 1987 1996/97Clupeidae Sardina pilchardus (Waulbaum, 1792) 826 4644Mugilidae Liza aurata (Risso, 1810) 1755 2906Moronidae Dicentrarchus labrax (Linnaeus, 1758) 871 872Atherinidae Atherina boyeri (Risso, 1810) 5976 837Atherinidae Atherina presbyter Cuvier, 1829 3185 833Labridae Symphodus bailloni (Valenciennes, 1839) 199 738Mugilidae Liza saliens (Risso, 1810) 629 667Syngnathidae Syngnathus acus Linnaeus, 1758 704 662Mugilidae Chelon labrosus (Risso, 1826) 38 455Gobiidae Pomatoschistus microps (Krøyer, 1838) 0 413Anguillidae Anguilla anguilla (Linnaeus, 1758) 753 287Mugilidae Liza ramada (Risso, 1826) 1247 247Mugilidae Mugil cephalus Linnaeus, 1758 16 228Gobiidae Gobius niger Linnaeus, 1758 802 197Mugilidae Oedalechilus labeo (Cuvier, 1829) 4 61Sparidae Diplodus sargus (Linnaeus, 1758) 22 59Mulliidae Mullus surmuletus Linnaeus, 1758 0 59Sparidae Spondyliosoma cantharus (Linnaeus, 1758) 14 56Labridae Symphodus melops (Linnaeus, 1758) 49 44Clupeidae Alosa fallax (Lacepède, 1803) 18 40Syngnathidae Syngnathus typhle Linnaeus, 1758 16 38Sparidae Sparus aurata (Linnaeus, 1758) 167 36Gobiidae Pomatoschistus minutus (Pallas, 1770) 295 28Trachinidae Echiichthys vipera (Cuvier, 1829) 85 22Triglidae Chelidonichthys lucerna (Linnaeus, 1758) 98 17Carangidae Trachurus trachurus (Linnaeus, 1758) 0 17Clupeidae Alosa alosa (Linnaeus, 1758) 0 17Syngnathidae Syngnathus abaster Risso, 1826 188 16Pleuronectidae Platichthys flesus (Linnaeus, 1875) 156 16Sparidae Diplodus annularis (Linnaeus, 1758) 2 15Soleidae Solea lascaris (Risso, 1810) 9 12Sparidae Diplodus vulgaris (E. Geoffrey Saint-Hilaire, 1817) 11 11Moronidae Dicentrarchus punctatus (Bloch, 1792) 0 11Engraulidae Engraulis encrasicholus (Linnaeus, 1758) 7 9Belonidae Belone belone (Linnaeus, 1761) 2 9Callionymidae Callionymus lyra Linnaeus, 1758 95 6Soleidae Solea solea (Linnaeus, 1758) 4 5Gobiidae Aphia minuta (Risso, 1810) 83 2Scophthalmidae Scophthalmus rhombus (Linnaeus, 1758) 36 2Soleidae Solea senegalensis Kaup, 1858 26 1Cyprinidae Carassius carassius (Linnaeus, 1758) 8 1Blennidae Parablennius gattorugine (Linnaeus, 1758) 0 1Pomatomidae Caranx crysos (Mitchill, 1815) 0 1Gobiidae Deltentosteus quadrimaculatus (Valenciennes, 1837) 198 0Gasterosteidae Gasterosteus aculeatus Linnaeus, 1758 151 0Gobiidae Gobius strictus Fage, 1907 128 0Poecilidae Gambusia affinis (Baird & Girard, 1853) 59 0Labridae Labrus viridis Linnaeus, 1758 20 0Gobiidae Gobius ater Belloti, 1888 19 0Blenniidae Parablennius gattorugine (Linnaeus, 1758) 18 0Ammodytidae Ammodytes tobianus Linnaeus, 1758 13 0Cobitidae Cobitis taenia Linnaeus, 1758 7 0Gadidae Gaidropsarus mediterraneus (Linnaeus, 1758) 6 0Tetraodontidae Lagocephalus lagocephalus (Linnaeus, 1758) 3 0Ammodytidae Hyperoplus lanceolatus (Le Sauvage, 1824) 2 0Gadidae Ciliata mustela (Linnaeus, 1758) 2 0Gobiidae Gobius paganellus Linnaeus, 1758 2 0Blenniidae Parablennius sanguinolentus (Pallas, 1814) 1 0Cottidae Taurulus bubalis (Euphrasen, 1786) 1 0Petromyzontidae Petromyzon marinus Linnaeus, 1758 1 0Sparidae Pagellus bogaraveo (Brunnich, 1768) 1 0Syngnathidae Hippocampus hippocampus (Linnaeus, 1758) 1 0
62 species

31
Table legends
Table I. - Two way anova without replication of hydrologic abiotic parameters by sampling stations and
months. The statistic test (F) and the probability value (P) and are showed: n.s. (P≥ 0.05); * (P<0.05); **
(P<0.01); *** (P<0.001).
Table II. - Species distribution of the fish fauna of the Ria de Aveiro, by sampling stations and months,
showing total densities. The species are grouped by ecological categories using the method of Elliott and
Dewailly, 1995. The arrow points to the six most abundant species over the whole sampling period.
Table III. - Discriminant analysis between pairs of sampling stations groups, for the diversity indexes, from
the medium values of temperature, salinity, dissolved oxygen and transparency. D2 is the multivariate
distance.
Table IV. - Discriminant analysis between pairs of sampling stations groups, for the ecological guilds
abundance, from the medium values of temperature, salinity, dissolved oxygen and transparency. D2 is the
multivariate distance.
Table V. – List of the European estuaries investigated until now and references (adapted from Elliot and
Dewailly, 1995).
Table VI. - Summary of the sampling effort for each estuary given in Table V, number of species and
families of fish fauna (adapted from Elliot and Dewailly, 1995).
Table VII. - Percentage of number species in the ecological guild for each estuary given in Table V. ER -
estuarine resident species; MA - marine adventitious visitors, CA - diadromous (catadromous and
anadromous migrant species), MS -marine seasonal migrant species, MJ - marine juvenile migrant species,
FW - freshwater adventitious species (adapted from Elliot and Dewailly, 1995).

32
Table VIII. - Ranking in abundance of species in 1987 (Rebelo, 1992), at ten sampling stations, and in the
present study, 1996/97, at nine sampling stations. The same sampling method was used in both studies. In
bold are the species specific to each study. The circled mark is referred to the very abundant species in
both s tudies.