spatial condition of activation of peripheral … · 1 spatial condition of activation of...
TRANSCRIPT

1
SPATIAL CONDITION OF ACTIVATION OF PERIPHERAL AREAS –
THE CASE OF NORTHERN POLAND
Jacek Sołtys
Gdansk University of Technology, Faculty of Architecture,
Department of Urban and Regional Planning
Abstract
The areas located outside metropolitan areas and also outside areas activated through
other big cities are called peripheries. There are big differences between the levels of devel-
opment of metropolitan and peripheral areas in Poland. There are also great differences in
opportunities for development including the location of new investment. Peripheral areas are
characterized by features such as: high unemployment, relatively impoverished populations,
low productivity, low territorial accessibility, and little development potential. A lack of de-
velopment factors is the cause of low development level.
Peripheral areas are differential. The author analyses this differentiation, including loca-
tion of development factors in peripheral areas of northern Poland. Touristic values are such a
factor, but tourism is mainly seasonal. The tourist season is short, 2-4 months. The develop-
ment of this tourism increases the income of people and business, but the increase of perma-
nent workplaces is small. The lack of robust businesses that are able to start constant and sta-
ble development is one of the main weaknesses of peripheral areas. Bad transport accessibility
is another weakness of peripheral areas. Spatial structure, including the settlement network is
one of the factors of socio-economic development considered by the author. In some areas the
lack of an appropriately big node could be the weakness of such a network.
Analysis of the case study area is conducted on the basis of the features of poviats (coun-
ties), which are described by the following indicators: employees in the industry sector and
market service sector per 1000 population of working age, number of entities in national
economy between 10-49 and more than 49 workers per 1000 population of working age, in-
vestment outlays in enterprises per capita in the years 2008-2010, gross value of fixed assets
in enterprises per capita, average monthly gross wages and salaries, unemployment rate, and
population of the biggest settlement node. The author researches correlation between the fea-
tures presented above. In the next part of the paper the author performs a typology of coun-
ties. In the last part of the paper regional policy for stimulating growth is proposed.

2
Keywords: peripheral areas, development factors, regional policy, typology,
daily urban system
JEL codes: E24, O16, R11, R23, R58
Introduction
A common phenomenon is the big difference in levels of development, especially
between metropolitan areas and areas beyond, called peripheries. After a slight decrease, these
differences are deepening in Poland.
Peripheral areas are characterized by features such as: high unemployment, migrations,
relatively impoverished local populations, low productivity and territorial accessibility (Kra-
jowa, 2009). The result is little development potential in peripheral areas as they are limited
by these realities. Eventually, they become barriers to development. To overcome these bar-
riers external policy interventions are needed as a part of the regional policy on the national
and regional levels.
The term: “peripheral area” refers to the theory of cores and peripheries (J. Friedmann).
In this theory, the “cores” are the territorial social subsystems generating innovations, whe-
reas the peripheries are the regions located outside the cores (Domański, 2005).
In this paper, the periphery is examined not only from the state point of view, but also the
policy pursued by the regions (voivodeships). Development is concentrated around their
capitals, "which are the important growth poles for their regional base, but need not be a pole
of development at the national level" (Wojnicka, 2009). Therefore, the peripheral areas were
not only space outside the metropolitan areas, but also outside the regions of voivodeship
capitals, which are the “national centers for performing some of the metropolitan functions”
(Koncepcja, 2011).
Regional policy should include the following paradoxical phenomenon:
There is negative natural increase of population in big cities, which are the poles of
development and growth for the demand for labor.
Peripherals are characterized by positive natural increase of population, especially in the
countryside, on the other hand, where there is a lack of jobs and economic development
factors.
The logical consequence of the above should be migration from peripheral areas,
especially rural to metropolitan areas. They face at least two barriers in Poland: housing and
mentality – the reluctance to emigrate. There are some advantages. Excessive emigration
would result in “leaching” development factors: migration of active, better educated people,

3
which reduces the opportunities for development of peripheral areas. Therefore, there is a
need for regional development policy in these areas.
This paper presents the preliminary results of the first phase of studies conducted in the
Department of Urban and Regional Planning, Faculty of Architecture, Technical University of
Gdansk. The theme of the study is “Cities in the activation of peripheral areas, based on the
example of the northern Polish regions”. The research subject was the diversification of the
area, including the distribution of developmental factors and the spatial relationships essential
to stimulate growth. The research tools were: statistical analysis, including typology.
There were included the author’s experience in work on strategic planning for many mu-
nicipalities, as well as academic experience, including particular student projects and the re-
sults of questionnaires compiled by the local County Office of Labor (Powiatowy Urząd Pra-
cy – PUP) in Kościerzyna in the Pomeranian voivodeship.
1. General characteristics of northern Poland
The case study area included three voivodeships in northern Poland: Pomeranian,
Varmian-Masurian and West Pomeranian. There are two metropolitan areas in these
voivodeships: Gdansk (also called Tricity) and Szczecin. Olsztyn was also included – the
Masurian voivodeship capital city, which did not make up the metropolitan area. Delimitation
of the peripheral area was based on the author’s earlier work (Sołtys, 2011), but there are now
only entire counties (poviats), therefore the study area includes counties: Gryfiński and
Kamieński, and doesn’t include counties: Policki and Goleniowski.
The study area contains 8,4 % of the population of Poland and 17,7 % of its area. Gross
domestic product (GDP) is known only in subregions NUTS3. There is 5,3 % Polish GDP in
the area of 6 entire subregions containing 7,2 % of the Polish population (tab. 1).
The study area is mostly located in the coastline zone of the Baltic Sea, covering the area
of two voivodeships: Pomeranian and West Pomeranian. Seaside location has an impact on
the high tourist attraction, but there are also economic problems arising from the protection of
the Baltic Sea fish stocks and fishing limits.

4
Table. 1
Gross domestic product and population in subregions NUTS3
Subregion
NUTS3
Gross domestic product Popula-
tion
Registered unem-
ployment rate Per capi-
ta Dynamics
2001 = 100
Poland=100
2009 2001 2009 2010 2010 2011
Koszaliński 28058 162 85 80 591969 20,6 20,4
Stargardzki 22232 156 70 63 374565 22,6 22,6
Słupski 27616 168 81 78 480883 19,2 18,9
Starogardzki 27050 174 78 77 493131 17,1 17,9
Elbląski 24807 172 70 70 529716 19,9 20,0
Ełcki 21553 161 66 61 284051 24,5 24,4
Total / average 25710 166 76 73 2754315
Source: Central Statistical Office – Local Data Bank and own calculations
The biggest area is the Lake District of Pomerania and Masuria. It is characterized by di-
verse land reliefs, lakes, and forests, making the location very attractive for tourism. Lands
left there by the German population and settled by the Polish population after WW II are a
considerable part of the researched area. Historically, state rural farms were located in these
areas; however the transformation to market economy has caused their decay, leading to high
unemployment in the countryside and the related problems of social dysfunction (inaction,
alcoholism), as well as personal and inherited poverty. Loss of work by entire families has
started decreasing the demand for the local service sector.
In the majority of the area there is no big settlement node and the distance to such a node
is long. Most of the area is sparsely populated rural area with a sparse settlement pattern: less
than 20 villages within 100 km2 and the average size of villages is below 250 inhabitants
(Koncepcja, 2011).
2. Factors and mechanism of the development
Analysis of the factors and conditions for development of peripheral areas should begin
by analyzing the mechanisms of economic development of regions, taken into account by
leading scientists. Causes of peripheral development are described, among others by
Miszczuk (2010) on the basis of selected theories of regional development as described by
Dawkins (2003). These theories are complementary, and explain why in some regions there

5
was greater development and why this development becomes fixed. Thus, exogenous growth
theory indicates the importance of the development of capital inflows and labor; neoclassical
exogenous growth theory suggests the role of external demand and exports; endogenous
growth theory indicates the capability and resources for the use of demand, and shows the role
of investment in the development of production factors and "learning" the most efficient use
of these factors. It follows from theory, that the cause of regional peripheries are:
The absence or scarcity of spatial assets for the location of external investments.
The lack of responsiveness to external demand and production of products that can be
exported. This lack may be due to lack of capital, management and marketing weakness or
lack of product innovations that create new or better, cheaper, better promoted products,
compared to the competitors.
In response to the variability of external conditions, including a number of risks, the
companies take a new form of organization to respond to constant change through innovation.
This new form is a network of cooperation, exchange of knowledge and information.
However, this network usually omits the outermost regions (Miszczuk, 2010).
Theories explain the reasons and causes of peripheral development, but only slightly
show how to overcome the remoteness of these areas and initiate development. As one of the
few, the product cycle theory points to the opportunities for the development of peripheral
areas by locating them in the production phase, when the product becomes standardized and
costs can be reduced by hiring lower skilled workers. There are threats: the cessation of
production when the product becomes old, or possible earlier relocation of production to a
region with even lower labor costs. Peripherality should disappear according to the theory of
interregional convergence. The factor price differences should decrease. But this is only the
free movement of factors between regions. In fact, it is not free. In the dynamic approach it is
distinguished by the relative convergence, i.e. economic growth, and absolute, concerning
macroeconomic variables. Convergence of rate of growth, however, does not lead to
convergence of macroeconomic variables. Moving the beneficial effects from the developed
region into a peripheral area is manifested by the growth pole theory and the theory of
cumulative causation. Development of peripheral regions could be caused by the development
of markets for their products and the diffusion of innovation. However, these benefits are
offset by a “leaching” of capital and labor from peripheral regions to the mature ones
(Miszczuk, 2010).

6
According to the economic base theory exogenous activities are the engine of develop-
ment. Endogenous activities could be developed, if demand for their products grows. Too low
demand is a big barrier for the development of a sector. This is a significant issue because
most local firms act in this sector and new firms also tend to function in the same way. Devel-
opment initialized in the endogenous sector by itself is theoretically possible, if production
capacity of work grows. From the point of view of slow action or little probability of the
process it is not possible to recognize it as an initiation of activation of peripheral areas
(Sołtys, 2010). However, the endogenous sector can take part in the process of activation in-
itiated by the exogenous sector. As the exogenous activity will increase the demand for
services from companies and institutions will also increase, as well as employment and
earnings, and thus the purchasing power of the population and its demand for various services
and construction will increase, which will lead to the development of endogenous activities.
An important function of most towns are central ones meaning services to the towns and
its surroundings. These functions for individual towns are partly endogenous, partly
exogenous, or the so-called standard ones, in contrast to other exogenous – specialized
(Dziewoński, 1970). At the regional scale these are endogenous activities, so their
development faces a demand barrier. This barrier does not apply to public sector services, but
their growth is limited by the modest public budget resources, not only for development, but
also for subsequent maintenance of the operations.
A majority of central functions are located in centers creating a hierarchical system,
compatible with Christaller’s theory, but with more and more services located in ways incom-
patible to that model. This causes the development of motorization, increasing easy accessi-
bility to these activities. Administrative divisions reinforce this hierarchical model. The coun-
ty (poviat) level is important in the analyzed scale. Capitals of administrative counties con-
centrate not only offices, but many others services like upper secondary schools, hospitals,
bank agencies, and big commercial stores. Coverage of services depends on free choices of
clients, but its size is approximated to the administrative county area. Some towns are acting
as support for the capitals of counties, some have an intermediate level between the county
and borough (gmina) level, few are subregional centers, intermediate between the county and
provincial (voivodeship) levels. These levels are not in the administrative division, so in
specific towns they are not always clearly recognizable. The development of the central func-
tions of the towns can activate these towns, but their endogenous role at the regional scale
should not be the initial impulse for development. Especially development of public educa-

7
tional services can’t be such an impulse because of a demographic decrease that will cause
some weaker schools to fall. Development of exogenous (so-called specialized functions), can
initiate the activation. Process of activation in the area can be provided as indicated in the
Fig. 1 (Sołtys, 2011).
3. Factors and spatial conditions of development
The study area is diverse. Differentiation relates to development factors as well as devel-
opment level. The key point to determine the possibilities and conditions of development of
the study area, and planning regional policy is to answer the following questions:
1) What exogenous development factors occur in the area and where? How are they
distributed?
2) What is the impact area of development factors?
3) Is the distribution of the factors needed to develop throughout the periphery? If not, then
what parts of the area are deprived of growth factors?
4) Does the distribution of factors ensure completeness for these types of development, and
which requires more than one factor?
5) Do the factors explain the current level of development? What is the correlation between
the factors and the level of development?
There was an attempt to answer questions 1, 3 and 5 in previous studies (for three
voivodeships), using commonly available data (Local Data Bank, maps). Answers to question
3 require more detailed study and acquisition of new data.
The impact area of development factors (question 2) is difficult to clearly define. The
intensity of commuting to work, which plays a big role in activation, decreases with
increasing distance. It is possible to accept for the purpose of this study the coverage of 30 km
as a distance to work (refer the research for PUP in Kościerzyna – Report, 2008). This
corresponds to the size of many counties. Development of the county town can activate the
development of the entire county or a substantial part thereof, as shown from these spatial
conditions. A model of such development, taking into account the spatial aspects is shown in
Figure 1. The county may therefore be a module in the analysis of opportunities for
development of peripheral areas and the planning of regional policy. Therefore, a county was
adopted as the unit of reference for the researches presented here.

8
Figure 1. Scenario model of activating the fragment of the peripheral area
Sequence of events: 1 – location of new activities or development of existing exogenous activities and
growth of employment, 2 – increase of work trips and in parallel: 2b – increase in revenues of new
employees stimulating endogenous demand, 3 – development of endogenous, local and central activi-
ties for town and its surroundings boosting employment and revenues of populations, 4 – village,
5 – town.
Source: Sołtys (2011)
There are not many development factors in the reference area. The most important
development factors are natural assets for tourism, but tourism is largely seasonal. The tourist
season at the seaside lasts only 2 months, in the lake counties it is 4–5 months. A few facili-
ties and especially the health resorts have a year-long function. The main purpose of these
resorts is health care, but their manner of functioning is similar to tourism. The development
of tourism is further reinforced by the growth in revenues of related businesses. The popula-
tion also gains by boosting demand for market services and starting up the new development
of them. This model, which takes into account the spatial aspects, is shown in Figure 2. The
coverage of development on the basis of income from tourism may include the city nearest
individual hierarchical levels, including the nearest county town and to a much lesser extent –
the nearest subregional center.
1 2a 2b 3 4 5

9
Figure 2. Scenario model of activating a peripheral zone by tourist development
Sequence of events: 1 – development of tourism services, 2 – increase in revenues caused by tourism
development stimulating endogenous demand, 3a – increase of service trips and in parallel:
3b – development of endogenous, local and central activities boosting employment, 4 – tourist area,
5 – village, 6 – town (especially county capital).
Source: Own research.
Sightseeing tourism, especially in some towns, can extend throughout the whole year, but
except for a few towns (Malbork, Frombork) the coverage and scale of tourism seems rather
small. The role of sightseeing could enhance the development of networking products, such as
the “Teutonic Castle Route”. For the development of tourism as a sector of the economy it is
necessary to create tourism products that could be sold on the market. This requires adequate
human capital (competencies, knowledge, creativity, entrepreneurship) and social capital
(trust, cooperation skills).
Therefore, the main way to activate an area to realize the biggest increases not only in
revenues, but also employment, would be development of industry and services in the ex-
ogenous specialized sector. This can be done through the involvement of new or existing local
or external businesses.
Taking into account the above exogenous development, factors that require diagnosis
may be:
Endogenous resources for the development of exogenous;
1 3a 3b 4 5 6 2

10
Natural and cultural resources for tourism development;
Human capital, social capital and institutional potential;
The economic potential of companies operating in the area for industrial development
and exogenous services;
Values for gaining external investments.
The level of human and social capital was not covered by researches which are described
here, because it is a comprehensive, complex task.
Natural and cultural resources for tourism were researched by the author. For quantitative
analyses they were expressed by points. For presenting natural resources on the map (fig. 4)
another source (Narodowy, 1973–1978, p. 6, 7, 124) was used. The level of tourism
development as use of tourist values (resources) were researched by the indicators:
– overnight stays (nights spent) in tourist collective accommodation establishments per
1000 capita.
– overnight stays (nights spent) in tourist collective accommodation establishments per
1 km2.
It is difficult to extract the economic potential of the companies restricted to the
exogenous sector. This sector could be identified as the industry. Therefore, when possible it
was isolated using these indicators. The exogenous service is service with indicators
significantly higher in some counties in comparison to others. This is only a guess and
simplification, but some indicators were also extracted in the case of services.
Counties’ town population as an indicator of its size was taken into account as affecting
the attractiveness for the external investments (the larger city: the more qualified staff, better
business support services, more investment areas).
Transport accessibility should be taken into consideration as a value for the location of
the external investments, but it is a distinct and difficult task. Only 4 counties and 11
counties’ towns are placed outside national roads. But technical parameters and quality of
these roads are diverse. Their improvement is in progress. Motorways and expressways pro-
vide the best transport accessibility, though now only 4 counties are connected by these roads
to a European motorway network. It is since 2010, so the impact of these connections on de-
velopment cannot be noticeable in analyzed figures. Planned expressways are important con-
ditions of development, but they will be constructed for more than 15 years. Probably 50% of
counties will be outside motorways and expressways in the year 2020 and about 40% of coun-
ties will always be outside these roads.

11
Coverage of the possible activating impact of roads must be taken into account. There is
a tendency to locate small and medium plants near local roads with a distance of up to 5 km
from the nearest motorway junction. For larger plants this distance is 15 km (Uwarunkowania,
2000). For the expressways, the shorter distance is assumed (10 km). In such conditions, con-
sidering the accepted travel distance of 30 km to get to work, it is possible to set up the effec-
tive impact of motorways and expressways as shown in figure 3. In this way there can be de-
veloped counties located outside, but near existing and planned motorways and expressways.
Figure 3. Impact of motorways and expressways
1 – motorway, 2 – expressway, 3 – other roads, 4 – motorway and expressway junction,
5 – small and medium plants, 6 – larger plants, 7 – towns, 8 – impact area.
Source: Own research.
4. Typology of counties
A typology of counties was prepared in order to analyze the diversity of the study area.
The first step was to standardize the variables. Then, in order to reduce the number of
variables, some of these variables were combined in the following synthetic ones:
size of enterprises (EN);
the economic potential of the industrial sector (industry and construction) (IC);
the economic potential of the service sector (S);
1 2 3 4 6 7
35-4
5 k
m
km
~30 km
~30 km
~30 k
m
~5 km 25-3
5 k
m
km
~15 k
m
km
~30 k
m
km
~10 k
m
km
30-4
0 k
m
km
~30 k
m
km
~5 km
~5 km
~15 km
8 5
20-3
0 k
m

12
the level of tourism development (TD).
Variables remaining intact:
counties’ town population (CTP);
tourism values (TVAL);
unemployment rate (UR);
average monthly gross wages and salaries (WS).
The abbreviations of variables used in the tables are in parentheses.
Three urban counties (cities with poviat status) have been combined with the surrounding
counties. Otherwise, these counties would be without capitals, and the regional cities without
the surrounding counties, so the sizes of these areas would be artificially distorted. The
correlations between these eight variables were examined (Pearson's product-moment
correlations). The correlation coefficients are shown in table 2.
Table 2
The correlation coefficients
EN IC S CTP TVAL TD UR WS
EN 1,000 0,376 0,566 0,462 0,206 0,275 -0,693 0,302
IC 0,376 1,000 0,253 0,366 -0,101 -0,196 -0,523 0,468
S 0,566 0,253 1,000 0,694 0,452 0,586 -0,631 0,491
CTP 0,462 0,366 0,694 1,000 0,267 0,029 -0,525 0,569
TVAL 0,206 -0,101 0,452 0,267 1,000 0,441 -0,242 0,174
TD 0,275 -0,196 0,586 0,029 0,441 1,000 -0,226 0,137
UR -0,693 -0,523 -0,631 -0,525 -0,242 -0,226 1,000 -0,309
WS 0,302 0,468 0,491 0,569 0,174 0,137 -0,309 1,000
Source: Own calculations
The typology was made by data analyst Jarosław Łosiński using the k-means algorithm.
The result is shown in table 3 and 4.

13
Table 3.
Quantitative characteristic of types
Type Measure GDL EN IC S UR WS CTP TVAL TD
1 Max. 1,52 1,53 0,43 3,89 -0,50 1,92 3,74 1,66 5,64
Min. 0,80 1,33 -0,18 0,91 -2,10 0,80 0,57 0,82 -0,36
SD 0,27 0,08 0,24 1,11 0,63 0,43 1,18 0,33 2,45
Average 1,25 1,46 0,20 2,32 -1,57 1,25 2,48 1,28 1,41
2 Max. 2,07 1,01 4,39 1,17 0,74 2,23 1,54 0,90 -0,38
Min. 0,23 -0,27 0,44 -0,86 -1,79 0,94 -0,36 -1,02 -0,42
SD 0,66 0,43 1,32 0,66 0,88 0,47 0,61 0,66 0,01
Average 0,81 0,17 1,64 0,25 -0,56 1,50 0,61 -0,46 -0,39
3 Max. 0,85 1,40 1,20 1,07 0,85 0,81 1,08 1,61 1,90
Min. -0,29 -0,60 -1,37 -0,47 -2,05 -1,52 -0,83 -0,99 -0,39
SD 0,31 0,58 0,70 0,43 0,73 0,71 0,47 0,73 0,75
Average 0,23 0,47 0,02 0,34 -0,33 -0,10 -0,05 0,57 0,19
4 Max. 0,42 1,07 0,34 -0,23 0,72 0,41 -0,37 -0,37 -0,05
Min. -0,60 -0,87 -0,59 -1,10 -1,02 -1,95 -0,81 -1,42 -0,46
SD 0,29 0,57 0,31 0,30 0,50 0,66 0,12 0,35 0,12
Average -0,11 0,42 -0,18 -0,68 -0,05 -0,80 -0,63 -0,93 -0,37
5 Max. -0,40 -0,36 1,01 0,04 1,68 0,58 -0,11 1,32 1,33
Min. -1,27 -2,66 -1,56 -1,39 0,04 -1,59 -0,80 -1,56 -0,46
SD 0,27 0,55 0,62 0,35 0,43 0,64 0,23 1,03 0,50
Average -0,85 -1,20 -0,66 -0,65 1,03 -0,39 -0,52 -0,10 -0,17
SD – standard deviation, GDL – general develop-ment level
Source: Own calculations
Typologies or classifications of counties prepared in the future should take into consider-
ation expressways that will be built. The most problematic counties will be those outside ex-
pressways, which now are in the type 4 and subtype 5c.

14
Table 4
Types and subtypes
Number and description of types and subtypes Counties
Type 1 – the highest level of majority of features,
big scale of settlement node and high tourist value as main
development factors
Kołobrzeski, Koszaliński with
Koszalin city, Słupsk with
Słupski, Elbląg with Elbląski
Type 2 – high level of potential of the industrial sector
and salaries
Kwidzyński, Tczewski, Szcze-
cinecki, Stargardzki,
Gryfiński, Starogardzki
Type 3 – general develop-
ment level a bit above
average; type very diverse
(possible division into 3
subtypes)
3a – high tourist value,
developed tourism
Lęborski, Kamieński, Gryficki,
Mrągowski, Chojnicki
3b – high tourist value,
less developed tourism
Kościerski, Ostródzki, Iławski,
Giżycki , Bytowski, Wałecki
3c – others Ełcki, Malborski
Type 4 – general development level a bit above average;
distinctive features are: low economic potential of the
service sector, low counties’ town population, lowest
salaries, tourism values and tourism development; type little
diverse
Działdowski, Myśliborski,
Nidzicki, Olecki, Człuchow-
ski, Gołdapski, Sztumski,
Lidzbarski, Nowomiejski
Type 5 – the highest level
of majority of features
(possible division into 3
subtypes)
5a – high tourist value,
developed tourism
Sławieński, Nowodworski
5b – high tourist value,
less developed tourism
Piski, Drawski, Braniewski,
Węgorzewski, Szczycieński
5c – others Bartoszycki Lobeski, Chosz-
czeński, Białogardzki, Świd-
wiński, Kętrzyński, Pyrzycki
Source: Own work

15
5. Direction of regional policy
The direction of regional policy supporting tourist products development seems to be ob-
vious, especially in the areas where there are tourist values, and the tourist economy is under-
developed. Nevertheless, the increase of permanent workplaces as a result of this policy will
be small. Creating new jobs can be done by development of the exogenous sector in the
towns.
In regional policy key questions are: which towns should be supported to activate their
peripheral areas? Which factors should be supported and where? There are dilemmas ex-
pressed by other, more detailed questions. What is better:
– Improving the development factors in towns that already have started to activate functions
or creation of new centers and new factors in them?
– Creating many small activating centers or not many, but at least strong?
– Creating new centers or improving access to existing ones?
Analyses of these dilemmas and proposed answers have been presented (Sołtys, 2011).
Included was the statement (which results from spatial conditions), that a daily urban-system,
as an area of daily trips to work, can be a module of regional policy. These areas are similar to
counties, where the accepted trip distance to work is a maximum of 30 km. This indicates
county towns as the base of activation for the peripheral area. In some cases it can be reason-
able to specify other centers of activation too, determined by aspects like: distance, the size of
the city and transport accessibility (Sołtys, 2010). The best conditions for development are in
big cities, but in the study area there are only 3 cities with a population nearly or more than
100 thousand. The direction of regional policy based on towns can be the following:
1) Improve the competitiveness of the local exogenous sector (especially small and medium
enterprises; a positive outcome can mean small enterprises grow into medium sized ones).
2) Improve attractiveness for external investments.
Both directions are possible for one town, but a lack of resources will probably mean that
the authorities will have to confront the problem of choosing the actions. Direction 2) can be
more effective in towns well connected, but waiting for expressways shown in figure 4 to
arise, would be too long. Development of local enterprises can give more sustained effects,
because external enterprises (especially transnational corporations) that initially invest will
then relocate production to another country where conditions are better. There is a problem
concerning the aim of the support. Some businesses achieve great success without supporting
16
in places, which seems accidental. It is impossible to predict what kinds of support (permitted
in the European Union) bring effect, what effect and where.
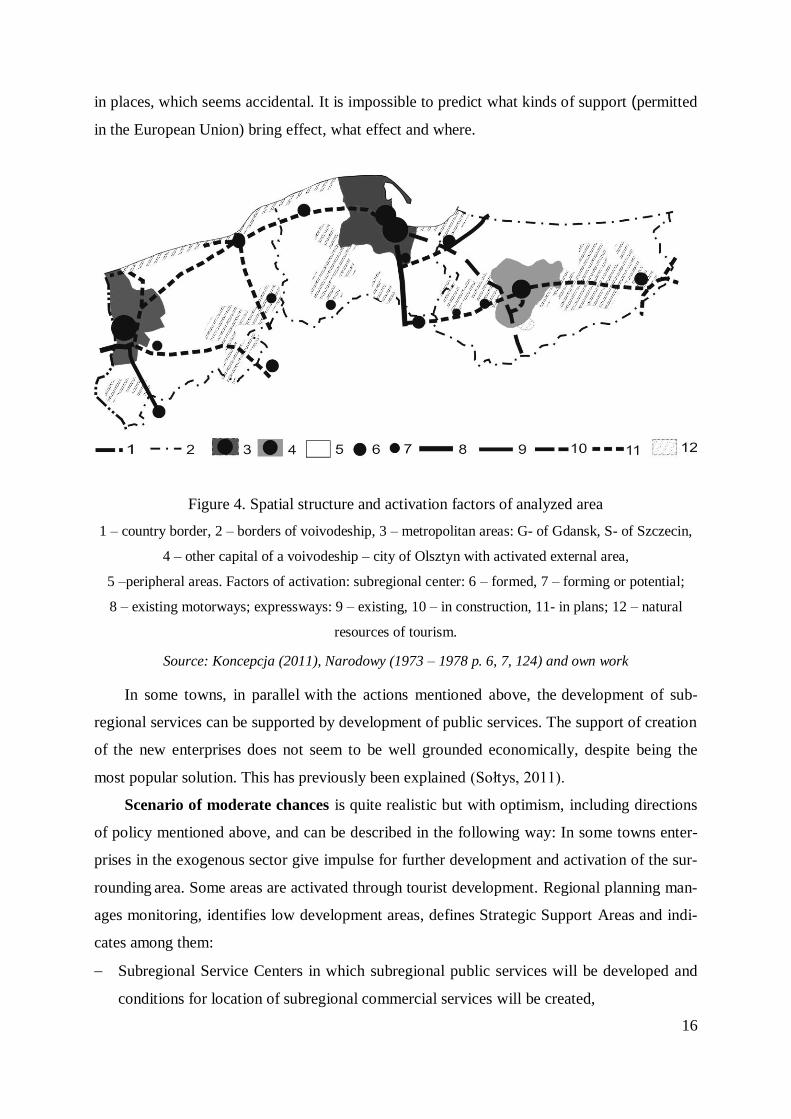
Figure 4. Spatial structure and activation factors of analyzed area
1 – country border, 2 – borders of voivodeship, 3 – metropolitan areas: G- of Gdansk, S- of Szczecin,
4 – other capital of a voivodeship – city of Olsztyn with activated external area,
5 –peripheral areas. Factors of activation: subregional center: 6 – formed, 7 – forming or potential;
8 – existing motorways; expressways: 9 – existing, 10 – in construction, 11- in plans; 12 – natural
resources of tourism.
Source: Koncepcja (2011), Narodowy (1973 – 1978 p. 6, 7, 124) and own work
In some towns, in parallel with the actions mentioned above, the development of sub-
regional services can be supported by development of public services. The support of creation
of the new enterprises does not seem to be well grounded economically, despite being the
most popular solution. This has previously been explained (Sołtys, 2011).
Scenario of moderate chances is quite realistic but with optimism, including directions
of policy mentioned above, and can be described in the following way: In some towns enter-
prises in the exogenous sector give impulse for further development and activation of the sur-
rounding area. Some areas are activated through tourist development. Regional planning man-
ages monitoring, identifies low development areas, defines Strategic Support Areas and indi-
cates among them:
Subregional Service Centers in which subregional public services will be developed and
conditions for location of subregional commercial services will be created,

17
Activation Centers for support of the creation and promotion of new investment areas,
Activation Centers for improvement in the competitiveness of the local exogenous sector.
New investment areas are prepared in steps for investors. It is a reasonably long process.
Building of the expressways shown in picture 4 lasts even longer. Only in some areas is it
possible to achieve new external investments, in others it is not (they are partially used by
local businesses). Only some of the enterprises that gained support achieve greater success.
Developing exogenous activities in steps influences the development of towns and their sur-
roundings as shown in figure1. The activating process is uneven and does not include the
whole peripheral areas. Obviously it is impossible to predict in which towns there will be suc-
cess, and in which there will not.
Scenario of maximal chances that all investment areas are used, all Activation Centers
are developing and the whole peripheral area is developing is unlikely.
Scenarios of threats are more probable as follows:
1. High rate of emigration and regression – resulting in declining development. In this
situation active and better-educated people will emigrate. This scenario is likely if barriers
to migration have been overcome.
2. Low rate of emigration and stagnation – combined with growing unemployment and other
consequences making development of the peripheral area difficult (Sołtys, 2011)..
6. Conclusions
The exogenous sector can help start the development of peripheral areas. The endogen-
ous sector can be part of a development process that results in the growth of revenues, resi-
dent and working populations and businesses that create demand.
An important spatial condition of area activation is 30 km as an accepted distance to
work. The daily urban system based on county towns and some other towns can be used as a
unit for the regional policy.
Counties are diverse; so various types can be distinguished. Types will be changing as
the expressways are being built and transport accessibility is improved. Interventions of the
regional policy should also be diverse, taking into consideration the range of impact and the
development factors that help to achieve the goal. Spatial analyses in regional planning should
facilitate the choice of towns for interventions: Subregional Service Centers and Activation
Centers for support in the creation of new investment areas and for improvements in the com-
petitiveness of local exogenous sectors.

18
There is a great need for research on the efficiency of how different actions impact re-
gional policy in different spatial configurations.
References
1. Analiza lokalnego rynku pracy w powiecie kościerskim. Badania wśród osób bezrobot-
nych. Raport z badań, Agencja Komunikacji Marketingowej „Interactive”, Kraków 2007.
2. Dawkins C.J., 2003, Regional Development Theory: Conceptual foundations, classic
works and recent developments, Journal of Planning Literature, 18, 131-172.
3. Domański R., 2005, Geografia ekonomiczna. Ujęcie dynamiczne, Wyd. Naukowe PWN
Warszawa.
4. Dziewoński K., 1970, Specialization and urban systems, Paper in Regional Science vol 24
nr 1, 34–45.
5. Koncepcja przestrzennego zagospodarowania kraju 2030, 2011, Ministerstwo Rozwoju
Regionalnego, Warszawa.
6. Krajowa Strategia Rozwoju Regionalnego 2010-2020. Regiony, miasta, obszary wiejskie.
Projekt, 2009, Ministerstwo Rozwoju Regionalnego, Warszawa.
7. Local Data Bank, Central Statistical Office, www.stat.gov.pl
8. Miszczuk A., 2010, Peryferyjnośc regionów, [in:] Europejskie wyzwania dla Polski i jej
regionów, A. Tucholska (Ed.), Ministerstwo Rozwoju Regionalnego, Warszawa, p. 238-
245.
9. Narodowy Atlas Polski, 1973 – 1978, Wrocław – Warszawa – Kraków – Gdańsk: Ossoli-
neum, p. 124.
10. Raport szczegółowy dla powiatu kościerskiego na podstawie badań przeprowadzonych w
2007 r., 2008, Human Capital Business, Sopot.
11. Sołtys J, 2010, Polityka regionalna w aktywizacji obszarów peryferyjnych – wybrane pro-
blemy, [in:] Oblicza współczesnego kryzysu a polskie regiony, Z. Strzelecki, P. Legutko-
Kobus (Ed.), Ministerstwo Rozwoju Regionalnego, Warszawa, p. 268–279.
12. Sołtys J., 2011, Towns in the regional policy of activation of peripheral areas – choosing
problems – the case of northern Poland, http://www-
sre.wu.ac.at/ersa/ersaconfs/ersa11/e110830aFinal01688.pdf

19
13. Uwarunkowania kształtowania się strefy rozwojowej, 2000, Kołodziejski J., Parteka T.,
Dutkowski M., Szwankowski S., [in:] Strefa rozwojowa VI Korytarza TINA, W. Szyda-
rowski (Ed.), Urząd Miasta Gdyni, Gdynia.
14. Wojnicka E., 2009, Metropolie jako bieguny wzrostu, [in:] Potencjalne metropolie ze
szczególnym uwzględnieniem Polski Wschodniej, Z. Makieła (Ed.), „Studia KPZK PAN”,
vol. CXXV, Warszawa, p. 30-46.