spatial disparities in socioeconomic development · spatial disparities in socioeconomic...
TRANSCRIPT
Centre for Business and Economics Research
IBA Working Paper No. 15-3July 2015
Spatial Disparities inSocioeconomic Development:
The Case of Pakistan
Haroon Jamal


The Centre for Business and Economics Research (CBER) is dedicated to stimulate research by faculty, students and staff at IBA. CBER has taken many initiatives since its inception including the establishment of a research grant, inauguration of the IBA Working Paper Series, initiation of seminar sessions (regular dissertation presentations by students and faculty), conferences, collaborations with education and Government Institutions. CBER aims to deliver opportunities for researchers to publish their work and later present it at national and international conferences. In short, CBER aims to breed and prosper research ideas at IBA.
The Centre for Business and Economics Research (CBER) publishes its working paper series for the main purpose of disseminating preliminary research results, conference proceedings and unpublished work. This stimulates discussion and generates critical feedback from experts in the field. The work could later be published in reputed journals and presented at conferences abroad.
Disclaimer: The views expressed in this paper are those of the author/s and do not necessarily reflect those of the Institute of Business Administration, Karachi and Centre for Business and Economics Research.
Kayani Shaheed Road, Karachi - 74400PakistanPhone : 92-21-38104701Fax : 92-21-38103008 Email: [email protected]
Research and Publication Committee
Dr. Qazi MasoodDirector, CBER
Dr. M. Nishat
Dr. Sayeed Ghani
Dr. Zeenat Ismail
Dr. Ahmed Ali Shah
Dr. Mahnaz Fatima
Dr. Nasir Touheed
Dr. Shahid Qureshi

Centre for Business and Economics Research
IBA Working Paper No. 15-3July 2015
Spatial Disparities inSocioeconomic Development:The Case of Pakistan
Haroon Jamal

IBA Press is a constituent unit of Institute of Business Administration Karachi. It furthers Institute’s objectives of excellence in research, scholarship, education, and dissemination of indigenous knowledge.
IBA PRESS
IBA PRESS
First Published in 2015 by
Copyright © Author, 2015.All rights reserved.
ISBN: 978-969-9759-05-5
Institute of Business AdministrationUniversity Enclave, University RoadKarachi – 75270, PakistanTel: +9221 3810 4700Fax: +9221 3810 2008Email: [email protected]

Spatial Disparities in Socioeconomic Development: The Case of Pakistan
04 CBER, IBA Working Paper 3
1. Background
Earlier research on spatial disparities in the context of Pakistan demonstrated the existence of significant differences in the quality of life of people living in different regions and parts of the country. Pasha and Hasan (1982) analyzed the data at the district level for the early 1970’s. They concluded that not only do levels of development significantly vary among the four provinces of the country, but there are large regional disparities within the province as well. Attempts have also been made to observe inter-temporal changes of development levels. Pasha, et al. (1990) identified significant changes in the development rank ordering of districts of Pakistan from the early 1970s to the early 1980s, especially among districts at the intermediate level of development1. More recently, Jamal and Khan (2003) provided changing scenarios of multi-dimensional inter-temporal spatial inequality and regional levels of development in Pakistan during early 1980s and the late 1990s2. Their study indicated that over time inequality has increased in three provinces, namely, Sindh, the NWFP (now KPK) and the Balochistan. They also noted that “So far as the province of Balochistan is concerned, there is evidence that it has continued to fall behind the rest of the country during the last 20 years”. Regarding NWFP province it was concluded that “the situation in the NWFP is not so disturbing, and it seems that the province is acquiring the characteristics of an emerging economy”.
The data used in all above studies were obtained from diverse sources of supply-side information. Moreover, various proxies are used to develop indicators due to unavailability of actual data. For instance, district’s income is estimated with two components; agricultural and manufacturing value added instead of direct income or GDP data. Thus the income component was underestimated due to non-representation of service sector which is a major source of income in some parts of the country. Likewise, district wealth is represented with number of cars registered instead of car ownership in district and number of bank branches instead of bank deposits. Similar problems may be identified in the construction of social indicators. The supply-side data on school enrollments (numerator) are obtained from provincial statistics to estimate enrollment rates at various levels, while the data on the relevant age group (denominator) are obtained from another source (Population Census). More importantly, previous studies for Pakistan did not consider intra-district inequality in constructing development indicators due to the non-availability of relevant information at sub-district level.
Consequently, this study for the first time incorporates intra-district inequality for the analysis of spatial disparities and inequalities in the context of Pakistan. Further, the study develops socioeconomic indicators from the demand-side single source of information by using large household survey. Pakistan Social and Living-standard Measurement (PSLM) survey for the year 2012-13 is used in this study to develop multidimensional development indicators. PSLM is a district representative survey, covers more than 75,000 households across four provinces of Pakistan and is statistically comparable with the Census data, with some margin of sampling error.
1. Jamal and Malik (1988) also analyzed the changing patterns of regional development in Sindh province of Pakistan during the period 1971-72 and 1980-81.
2. Wasti and Siddiqui (2008) updated the rank orders of districts of Pakistan with the published information in the late 1990s. Surprisingly, they didn’t mention and compare results with the study of Jamal and Khan (2003) which also uses the data of late 1990s. Nonetheless, their findings are not different with that of Jamal and Khan (2003).

05
Spatial Disparities in Socioeconomic Development: The Case of Pakistan
CBER, IBA Working Paper 3
3. Supply–side input indicators; such as mechanization of agriculture, roads and other infrastructure, number of medical personnel etc. have also been included in the earlier research on district ranking in terms of socioeconomic development. However, this research is purely based on demand-side household information and thus attention is restricted to output indicators in terms of quality of life.4. One of the non-monetary indicators of household welfare is the asset-based index which has been introduced and developed as an alternative tool for classifying household socio-economic status. This method employs data of household’s assets such as durable and semi-durable goods to describe household welfare instead of using household’s income or expenditure data. However, this approach is not applicable for this research as welfare indicators are aggregated here at regional level instead of classifying household economic status. For detail methodology of developing asset-based index, see Filmer and Prichett (2001).5. Household Integrated Economic Survey (HIES) which collects information on household consumption does not provide district representative information on household consumption. 6. However, it is worth to mention that the reported income might be biased downward due to the fact that the majority of the economically active population is not in a salaried remuneration but is either self-employed or work in farms or other family business. In addition, about 16 percent sample households refused to give response regarding employment activities and household income.
2. Dimensions of Socioeconomic Development
No single attribute can be expected to provide a complete representation of welfare. As Kolm (1977) suggests, the greater the number of attributes considered the better is the assumption of ‘anonymity’ and ‘impartiality’ in welfare analysis. However, empirically the selection of indicators is based entirely on the availability of consistent data.
Development indicators that have been included in this research to analyze disparities and inequality relate to human resources and standards of living3. Seventeen indicators are developed from the district representative household data of Pakistan Social and Living-Standard Measurement (PSLM) Survey for the year 2012-13. A brief description of the selected welfare attributes is given below, while the national averages of and inequality in these indicators are furnished in Table 2.1.
Both stock and flow measures are included in the study to represent the educational status of population. The stock measure is the adult literacy rate, whereas enrolment rates with respect to population of age cohort 5-24 years represent a flow in the educational attainment. Both of these measures are developed separately for gender.
Welfare and inequality, in the health sector, may best be evaluated with the help of ultimate output indicators such as life expectancy at birth, infant and maternal mortality rates etc. However, non-availability of data has restricted the choice and the dimension of health is represented by some proxies of health status of mother and children. Polio vaccination of children under the age of five according to vaccination card or through polio campaign and the child delivery at hospitals are used to represent child health status, while three indicators are developed to assess the maternal health status; prenatal and postnatal care and the proportion of mothers who had tetanus toxoid injections during the previous pregnancy.
Income or consumption is the appropriate indicator to evaluate the standard of living of person, family or region4. Due to the relatively high non-response rate for income based measures as well as under reporting typically found in standard of living household surveys in developing countries, income data is often not preferred as a proxy for living standard over consumption data. Nonetheless in the absence of district-wise consumption5 data, household income is used in this study as a relative measure of economic status. Regional income at the level of PSU or district is computed form the PSLM employment module which reports monthly or annual income of each family member of household aged 10 years and above6.

06 CBER, IBA Working Paper 3
Spatial Disparities in Socioeconomic Development: The Case of Pakistan
Housing conditions and access to basic social services are one of the key determinants of the quality of life. It is often argued that publicly provided services must have more equal distribution. Therefore it is of interest to include inequality in means and standards of living directly provided by government and those that are acquired by the household. To observe the inequality in housing facilities, five indicators are used, viz., access to safe drinking water (piped, hand-pump, motorized pump or tube well and covered well), flush toilet facility, use of adequate fuel (cooking gas or kerosene oil), access to electricity and telephone (landline or mobile) facility. The quality of housing stock is represented by the proportion of houses with cemented outer walls (burned bricks) and reinforced cement concrete (RCC) or reinforced brick concrete (RBC) roofing.
Table–2.1
Development Indictors Selected for the Analysis of Disparities
Development Indicators: National Coefficient Gini
Average of Variation Coefficient
Human Resources:Education Adult Literacy Rate – Male 68.72 31.35 0.1758 Adult Literacy Rate – Female 41.13 70.16 0.4031 Enrollments in 5-24 Years Age Cohort – Boys 60.66 33.33 0.1861 Enrollments in 5-24 Years Age Cohort – Girls 47.75 52.12 0.2982
Chile Health Immunization – Polio 51.01 74.06 0.4221 Child Delivery at Hospitals/Nursing Homes 51.13 68.48 0.4014
Maternal Health Prenatal Care 68.64 50.60 0.2841 Postnatal Cate 30.62 110.66 0.6013 Had Tetanus Injection 57.66 63.66 0.3694
Living Standard:
Income Average Income Per Capita 36300 185.32 0.3726
Housing Quality Adequate Roof Structure 27.11 130.96 0.6700 Adequate Wall Structure 69.53 51.25 0.2728
Housing Services Access to Safe Drinking Water 83.83 36.21 0.1540 Flush Toilet Facility 67.93 55.01 0.2928 Use of Adequate Fuel 40.69 108.51 0.5761 Electricity Connection 91.90 23.12 0.0766 Telephone Connection (Landline or Mobile) 82.24 27.13 0.1288
Note: Development Indicators are aggregated at the level of Primary Sampling Unit(Villages and Urban Circles)Data Source: PSLM, 2012-13

07CBER, IBA Working Paper 3
Spatial Disparities in Socioeconomic Development: The Case of Pakistan
3. Methodology for Aggregating Dimensions of Development
Inequality-adjusted Socioeconomic Development Indices (ISDIs) are developed to estimate the extent of disparities among provinces and districts of Pakistan in socioeconomic development. Multidimensional measures that capture the association between various attributes can generally be derived from a two-stage aggregation approach. The approach originally proposed by Maasoumi (1986, 1989, 1999) uses a common utility-like function (measure of well-being) to aggregate the attributes for each individual in the first stage, and a uni-variate inequality measure to aggregate the utility-like values across individuals in the second stage. As an alternate to Maasoumi’s method, individuals’ achievements on each attribute are aggregated first and then the resulting attribute-specific indicators are summarized over the given dimensions. The later approach forms the basis of the Inequality-adjusted Human Development Index (IHDI) of United Nations Development Program (UNDP)7.
IHDI is based on a distribution-sensitive class of composite indices proposed by Foster, Lopez-Calva, and Szekely (2005), which draws on the Atkinson (1970) family of inequality measures. It is computed as a geometric mean of geometric means, calculated across the population for each dimension separately. The IHDI accounts for inequalities in HDI dimensions by “discounting” each dimension’s average value according to its level of inequality. The IHDI equals the HDI (Human Developed Index) when there is no inequality across people but falls further below the HDI as inequality rises. In this sense, the IHDI is the actual level of human development (taking into account inequality), while the HDI can be viewed as an index of the “potential” human development that could be achieved if there was no inequality. The “loss” in potential human development due to inequality is the difference between the HDI and the IHDI (UNDP-HDR, Technical Notes)8.
This study follows the IHDI methodology to develop the Inequality-adjusted Socioeconomic Development Index (ISDI) for districts of Pakistan. Specific steps to estimate the ISDI are narrated below.
At step one; indicators are developed by aggregating information at the sub-district level (Primary Sampling Unit (PSU) –Villages and Urban Circles). Except income, all chosen indicators are proportions or percentages and thus have natural goalposts (minimum and maximum) in order to transform the indicators expressed in different units into indices between 0 and 1. As described in the UNDP-HDR technical notes, these goalposts act as the ‘natural zones’ and ‘aspirational goal’ respectively. However, dimension of income is adjusted with the observed minimum and maximum values of per capita income across all PSUs.
7. For computational detail see Alkire and Foster (2010).
8. The Technical Notes of UNDP may be downloaded using the URL
http://hdr.undp.org/sites/default/files/hdr14_technical_notes.pdf

08 CBER, IBA Working Paper 3
Spatial Disparities in Socioeconomic Development: The Case of Pakistan
Source: Estimated from PSLM, 2012-13 data
(4)
District-wise ISIDs are estimated using PSLM data for the year 20102-13 to rank districts according to the level of development. Development scores represented by districts’ ISDI are also used to estimate the Gini index (Equation-5) which is the well-known inequality index.
+ + +ISDI I I(district) income Education Health Housing*4 I I
9. One of the issues in the context of composite indexing is the substitutability among component indicators. However, the substitutability issue may be resolved by taking geometric mean instead of combining indicators using simple average. Although use of the geometric mean has been relatively rare in computing social statistics, starting from 2010 the UNDP Human Development Index did switch to this mode of calculation for combining component indicators of HDI and IHDI. It is argued that geometric mean better reflects the non-substitutable nature of the statistics being compiled and compared.
(1)
Inequality in the underlying distribution for each indictor is estimated using the Atkinson (1970) inequality measure A with the aversion parameter equal to one. Accordingly, A = 1– g/µ, where g is the geometric mean, µ is the arithmetic mean of the distribution in the variable of interest (X). Symbolically,
where {X1, …… Xx} denotes the underlying distribution in the indicator X and n refers to the number of geographical units (here PSUs). A is computed for each development indicator (X) aggregated at PSU (sub-district) level.
At the second stage, indicators are first developed by aggregating information at district level and then are adjusted for inequality in the distribution across the intra-district population. Thus, district-wise inequality adjusted indicators (Ix*) are obtained by multiplying district development indicators (Ix) with (1-Ax), where Ax is estimated through equation 1. Accordingly, Ix* estimtes the value of indicators after adjusting potntial loss due to the underlying distribution and is defined as;
(2)
Besides income, other dimensions of socioeconomic development possess more than one indicator. Therefore, dimensional composite indices for education, health and housing sectors are developed at the third stage by applying the following formula of geometric mean9 . Here k denotes the dimension (sector) of development, while n refers to the number of indicators in each dimension.
(3)
Thus I k is the kth dimension composite index which represents the geometric mean of the relevant inequality-adjusted development indicators (Ix*). Finally, ISDI for each district is developed by taking the geometric mean of three composite dimension (Ik) indices and income (I*income) component.
I 11
k
nn
Ixii
*
, ... ..., nXXX
1A √1x
n
Ix IxAx* *( )1

The inequalities in district per capita income as represented by Gini coefficients are furnished in Table 4.2. Relatively, inequality magnitudes are low for KPK and Balochistan as compared with the other provinces. The highest magnitude is estimated for urban Sindh, while the income inequality is comparatively low in rural Balochistan according to the estimated Gini coefficient.
Table – 4.2Income Inequalities
[Gini Coefficients for Per Capita Income]
Overall Urban Rural
Pakistan .41 .42 .38 Punjab .41 .42 .39 Sindh .43 .44 .35 KPK .38 .41 .36 Balochistan .32 .34 .31
Source: Estimated from the data of PSLM, 2012-13
Table – 4.1Per Capita Income
[Rupees – Annual Average]
Overall Urban Rural
Pakistan 44527 54590 38507 Punjab 45554 53169 41658 Sindh 46212 58393 31178 KPK 39361 49765 36860 Balochistan 34479 41695 32060
Source: Estimated from the data of PSLM, 2012-13
09CBER, IBA Working Paper 3
Spatial Disparities in Socioeconomic Development: The Case of Pakistan
4. Estimates of Spatial Disparities in Socioeconomic DevelopmentAverage annual per capita incomes of districts by provinces are displayed in Table 4.1. The observed regional and provincial differences are in accordance to a priori expectations. In terms of ranking for urban areas, highest average income is observed in Sindh (Karachi factor), while the lowest is estimated for Balochistan province. The rural picture is slightly different where rural KPK and Balochistan are better off than rural Sindh in terms of average income. On the average, the study estimates annual per capita income around rupees 45000, 55000 and 39000 for overall, urban and rural Pakistan respectively.
(5)
The Gini is obtained from a rank-dependent social evaluation function which attaches welfare-weights to individuals that depends on their position in the total distribution.
Gini ISID ISIDddi∑N1 1
11N( )

The estimated districts’ ISDIs denote the level of socioeconomic development including per capita income. These development scores of districts are used to develop rank orders and inequality levels to furnish intra and inter provincial disparities respectively in terms of development indictors considered for this analysis.
10 CBER, IBA Working Paper 3
Spatial Disparities in Socioeconomic Development: The Case of Pakistan
Figure 4.1 portrays the provincial Gini coefficients which reflect multidimensional provincial disparities in overall socioeconomic development. The magnitude of estimated Gini for overall level of development is 0.57 which is quite high and indicates severe disparities among districts of Pakistan. In terms of provinces, highest and lowest magnitudes of multidimensional Gini coefficients are estimated for Balochistan and Punjab provinces respectively. The estimated Gini for Balochistan is 0.63, while for Punjab it is 0.35, almost half of that of Balochistan. Interestingly, inequality levels in Sindh and KPK provinces as measured by Gini are almost equal. The high level of inequality in Sindh province reflects sharp urban-rural divide in the level of development.
0.571
0.350
0.442
0.439
0.629
PakistanPunjab
SindhKPK
Balochistan
Figure – 4.1Provincial Inequalities in Socioeconomic Development [Multi-Dimensional Gini Coefficients]

11CBER, IBA Working Paper 3
Table – 4.3Inequalities in the Dimensions of Development
[Multi-Dimensional Gini Coefficients]
Overall Income Education Health Housing Pakistan 0.57 0.34 0.44 0.67 0.76 Punjab 0.35 0.28 0.17 0.48 0.63 Sindh 0.44 0.31 0.39 0.57 0.80 KPK 0.44 0.35 0.33 0.59 0.62 Balochistan 0.63 0.22 0.66 0.73 0.94
Source: Estimated from the data of PSLM, 2012-13
Spatial Disparities in Socioeconomic Development: The Case of Pakistan
Besides the level of provincial disparities which are depicted in Table 4.3, the analysis of intra-provincial inequalities is also important for resource allocation and regional planning. To facilitate provincial planners and policy makers, this study provides rank order of districts according to the level of socioeconomic development as estimated by Inequality-Adjusted Socioeconomic Development Indices. The national and provincial rank orders of districts are furnished in the appendix (Tables A1 through Table A4 for districts of Punjab, Sindh, Khyber Paktunkhwa and Balochistan respectively), while Table 4.4 is developed to show distribution of provincial population according to the level of development. For this exercise, quintiles are developed for each province after ranking of districts in terms of the magnitude of ISDI.
As expected, about 57 percent of the population of Balochistan resides in districts which fall in the lowest development quintile. Incidentally, no district of the province including the capital city has succeeded to have a place in the upper two quintiles. In contrast, more than 80 percent of the population of Punjab resides in top two (fourth and fifth quintiles) and only 2 percent resided in the lowest two quintiles. The population of KPK is distributed in quintiles with 4, 14, 20, 40 and 22 percentages and thus the province reflects relatively less lopsided nature of socioeconomic development. Conversely, the Sindh province reflects the case of extreme division of population; where about 35 percent population resides in the second and fifth quintiles each.
The levels of inequality in the dimensions of ISDI are furnished in Table 4.3. The table clearly indicates that districts are significantly unequal in terms of health and housing indicators included in this analysis. The estimated Gini coefficients are 0.76 and 0.67 for housing and health dimensions respectively. Comparatively, level of inequality is low in the education sector, however the coefficient for Balochistan here also is quite high (0.66). As evident in the table, inequality magnitude with respect to districts’ per capita income is 0.34 which is relatively low as compared with other components of ISDI. Highest income inequality is observed in KPK province, while Balochistan province has relatively more equal distribution in terms of district per capita income. It is worth mentioning that estimated Gini coefficients as depicted here (Table 4.3) are not comparable with the coefficients furnished in Table 4.2. The income inequality is estimated here by aggregating household income at district level, while the Gini coefficients in Table 4.2 are estimated at household level. The low magnitude of Gini coefficients is due to the aggregation of household income.

12 CBER, IBA Working Paper 3
Spatial Disparities in Socioeconomic Development: The Case of Pakistan
As discussed above, this study is the first attempt in the context of Pakistan which uses the parameters of intra-districts inequality to adjust the development indicators of districts. It would be interesting to investigate how this inequality adjustment affects the development rank order? Tables 4.5 and 4.6 are developed to show the changes in rank order due to intra-district inequality. These tables furnish adjusted and unadjusted ranking of top and bottom 25 districts of Pakistan respectively.
Due to the intra-district inequality, the significant decline in rank order among the top districts is observed in Karachi, Jehlum, Chakwal and Quetta districts, while improvement in ranks are evident for districts Hafizabad, Sheikupura, Malalkand and Okara. According to earlier research on development ranking, Karachi always dominated with the first or second position on the top. Table 4.5 also confirms its top position after Islamabad according to the unadjusted ranking. However after adjusting inequality in the district; its rank position deteriorated by pushing it 15 ranks behind. Similarly, inequality in Quetta district affected its rank order and pushed it 25 ranks behind. The position of Islamabad however remained the same in both scenarios mainly due to large difference in the magnitude of development score between Islamabad and succeeding districts (Table A1, Appendix).
Table – 4.4Population Distribution According to Level of Development - Quintiles of ISDI
Provincial Population Residing in Development Quintiles
Lowest Highest One Two Three Four Five
Punjab 0 2 15 33 50 Sindh 3 35 22 5 35 KPK 4 14 20 40 22 Balochistan 57 29 14 0 0
Source: Estimated from the data of PSLM, 2012-13

13CBER, IBA Working Paper 3
Spatial Disparities in Socioeconomic Development: The Case of Pakistan
Table – 4.5Effect of Intra-District Inequality on Development Ranking
[Top 25 Districts according to Unadjusted Development Ranking]]
Development Rank Order
Intra-District Intra-District Inequality Inequality Change in Province Districts [Unadjusted] [Adjusted] Ranks
Punjab Hafaizabad 90 105 15 Punjab Chiniot 91 92 1 Punjab T.T Singh 92 99 7 Balochistan Quetta 93 68 -25 Punjab Okara 94 102 8 KPK Malakand 95 104 9 KPK peshawar 96 96 0 Punjab Nankana Sahib 97 100 3 Punjab Sheikhupura 98 106 8 Punjab Sahiwal 99 95 -4 KPK Abbottabad 100 97 -3 KPK Haripur 101 108 7 Sindh Hyderabad 102 94 -8 Punjab Sialkot 103 107 4 Punjab Attock 104 103 -1 Punjab Chakwal 105 83 -22 Punjab Faisalabad 106 101 -5 Punjab Mandi Bahauddin 107 109 2 Punjab Gujranwala 108 112 4 Punjab Jehlum 109 93 -16 Punjab Gujrat 110 113 3 Punjab Rawalpindi 111 110 -1 Punjab Lahore 112 111 -1 Sindh Karachi 113 98 -15 Punjab Islamabad 114 114 0
Source: Estimated from the data of PSLM, 2012-13

Table – 4.6Effect of Intra-District Inequality on Development Ranking
[Bottom 25 Districts according to Unadjusted Development Ranking]
Development Rank Order
Intra-District Intra-District Inequality Inequality Change in Province Districts [Unadjusted] [Adjusted] Ranks
Balochistan Musa Khel 1 1 0 Balochistan Washuk 2 9 7 KPK Torgarh 3 4 1 Balochistan Awaran 4 15 11 Balochistan Kohlu 5 2 -3 Balochistan Dera Bugti 6 3 -3 KPK Kohistan 7 5 -2 Balochistan Sheani 8 12 4 KPK Tank 9 26 17 Balochistan Qilla Abdullah 10 21 11 KPK D.I.Khan 11 34 23 KPK Shangla 12 32 20 Sindh Tharparkar 13 27 14 Balochistan Loralai 14 19 5 Balochistan Jhal Magsi 15 25 10 Balochistan Chaghi 16 11 -5 Balochistan Zhob 17 8 -9 Sindh Kashmore 18 45 27 Sindh Ümer Kot 19 31 12 Balochistan Qilla Saifullah 20 7 -13 Balochistan Bolan/Kachhi 21 6 -15 KPK Upper Dir 22 28 6 Balochistan Barkhan 23 14 -9 Balochistan Harnai 24 13 -11 Balochistan Jaffarabad 25 30 5
Source: Estimated from the data of PSLM, 2012-13
14 CBER, IBA Working Paper 3
Spatial Disparities in Socioeconomic Development: The Case of Pakistan

15CBER, IBA Working Paper 3
Spatial Disparities in Socioeconomic Development: The Case of Pakistan
5. Concluding Remarks
This research facilitates policy makers, regional planners and politicians by providing a single composite index from household survey data to evaluate relative position of districts of Pakistan in terms of socioeconomic development. Provincial multidimensional Gini coefficients and district development rank orders are presented to enlighten the nature and extent of inter and intra provincial disparities in Pakistan.
Various development indicators in the dimensions of income, education, health and housing are developed from the district representative household data of Pakistan Social and Living-Standard Measurement Survey for the year 2012-13. These indicators are used to develop Inequality-adjusted Socioeconomic Development Index (ISDI) for districts of Pakistan using the methodology of Inequality-adjusted Human Development Index of UNDP.
The study finds quite a high magnitude of estimated multidimensional Gini for overall level of development which reflects severe disparities among districts of Pakistan. In terms of provinces, highest and lowest magnitudes of Gini coefficients are estimated for Balochistan and Punjab provinces respectively. The high level of inequality in Sindh indicates sharp urban-rural divide in the level of development in the province.
Provincial population is distributed in development quintiles which are classified according to the level of development of districts. The exercise reveals that more than half of the population of Balochistan resides in districts which fall in the lowest development quintile. Incidentally, no district of the province including the capital city has succeeded to have a place in the upper two quintiles. In contrast, more than 80 percent of the population of Punjab resides in top two (fourth and fifth quintiles) and only 2 percent resided in the lowest two quintiles. The distribution of population of KPK reflects relatively less lopsided nature of socioeconomic development, while extreme division of population is found in case of Sindh province.
This study is the first attempt in the context of Pakistan which uses the parameters of intra-districts inequality to adjust the district development indicators. This adjustment significantly affects the development rank orders of districts. According to earlier research on development ranking in Pakistan, Karachi always dominated with the first or second position on the top. However after adjusting inequality in the district; its rank position deteriorated by pushing it 14 ranks behind. Similarly, inequality in Quetta district affected its rank order and pushed it 30 ranks behind.
The findings of this research would facilitate policy makers and development experts by identifying regions and areas which are lagging behind; making decisions on regional and sectoral priorities, facilitating targeted public interventions; and helping federal and provincial governments in determining financial awards.

CBER, IBA Working Paper 316
Spatial Disparities in Socioeconomic Development: The Case of Pakistan
References:
Alkire, S., and J. Foster, (2010), “Designing the Inequality- Adjusted Human Development Index (IHDI).” Human Development Research Paper 28 UNDP–HDRO, http://hdr.undp.org/en/reports/global/hdr2010/papers/HDRP_2010_28.pdf
Atkinson, A. (1970), “On the Measurement of Economic Inequality.” Journal of Economic Theory, 2 (3)
Filmer, D. and L. Prichett (2001), “Estimating wealth effects without income or expenditure data-or tears: an Application of education enrolment in States of India”, Demography 38(1)
Foster, J., L. López-Calva, and M. Szekely. 2005. “Measuring the Distribution of Human Development: Methodology and an Application to Mexico”, Journal of Human Development and Capabilities, 6 (1)
Jamal, H., and Khan A. J. (2003),”The Changing Profile of Regional Inequality”, Pakistan Development Review, 42(2)
Jamal, H., and Salman Malik (1988), “Shifting Patterns in Developmental Rank ordering: A Case Study of Districts of Sindh Province”, The Pakistan Development Review, 27(2)
Kolm, S. C. (1977), “Multidimensional Egalitarianism”, Quarterly Journal of Economics, 91(1)
Maasoumi, E. (1986), “The Measurement and Decomposition of Multi-dimensional Inequality”, Econometrica, 54
Maasoumi, E. (1989), “Continuously Distributed Attributes and Measures of Multivariate Inequality”, Journal of Econometrics 42(1)
Maasoumi, E. (1999), “Multidimensioned Approaches to Welfare Analysis”, In: Silber, J. (Eds.), Handbook of Income Inequality Measurement, Kluwer, Boston
Pasha, H. A., and T. Hasan (1982), “Development Ranking of the Districts of Pakistan”, Pakistan Journal of Applied Economics, 1 (2)
Pasha, H. A., S. Malik, and H. Jamal (1990), “The Changing Profile of Regional Development in Pakistan” Pakistan Journal of Applied Economics, 9(1)
Wasti, S. Ashraf and Siddiqui, Minhaj (2008), “Development Rank Ordering of Districts of Pakistan: Revisited”, Pakistan Journal of Applied Economics, 18(1 & 2)

Table – A1Intra-Provincial Disparities in Socioeconomic Development – Punjab Province
[Lowest to Highest Development Rank Order]
Rank Order Districts Development Score Development Provincial National [ISDI] Index [1-37] [1-114] Rajanpur 1.570 3.92 1 36 D.G Khan 2.811 7.03 2 48 Rahim Yar Khan 3.957 9.89 3 55 Muzaffar Garh 5.524 13.82 4 62 Bhakar 5.561 13.91 5 64 Lodhrean 6.050 15.13 6 66 Layyah 6.083 15.22 7 67 Jhang 6.622 16.57 8 69 Khushab 6.723 16.82 9 70 Bahawalpur 7.093 17.75 10 71 Bhawanagar 7.730 19.34 11 76 Narowal 8.259 20.66 12 78 Khanewal 8.361 20.92 13 80 Chakwal 9.270 23.19 14 83 Multan 9.781 24.47 15 84 Vehari 9.867 24.69 16 85 M ianwali 10.092 25.25 17 87 Kasur 11.039 27.62 18 88 Sarghodha 11.166 27.94 19 89 Pakpatan 11.291 28.25 20 90 Chiniot 11.556 28.91 21 92 Jehlum 12.365 30.94 22 93 Sahiwal 13.096 32.77 23 95 T.T Singh 14.923 37.34 24 99 Nankana Sahib 15.168 37.95 25 100 Faisalabad 15.190 38.01 26 101 Okara 15.363 38.44 27 102 Ättock 16.422 41.09 28 103 Hafaizabad 18.046 45.16 29 105 Sheikhupura 19.475 48.73 30 106 Sialkot 20.722 51.85 31 107 Mandi Bahauddin 26.627 66.63 32 109 Rawalpindi 26.815 67.10 33 110 Lahore 30.258 75.72 34 111 Gujranwala 31.229 78.15 35 112 Gujrat 33.569 84.01 36 113 Islamabad 39.959 100.00 37 114 Source: Estimated from the data of PSLM, 2012-13
17CBER, IBA Working Paper 3
Spatial Disparities in Socioeconomic Development: The Case of Pakistan

CBER, IBA Working Paper 318
Spatial Disparities in Socioeconomic Development: The Case of Pakistan
Table – A2Intra-Provincial Disparities in Socioeconomic Development – Sindh Province
[Lowest to Highest Development Rank Order]
Rank Order
Districts Development Score Development Provincial National [ISDI] Index [1-23] [1-114]
Thatta 0.437 1.09 1 22 Tharparkar 0.661 1.65 2 27 Ümer Kot 1.061 2.65 3 31 Mir pur khas 1.511 3.77 4 35 Shahdadkot 1.645 4.11 5 37 Khairpur 1.859 4.64 6 39 Ghotki 1.975 4.94 7 40 Shiokarpur 2.044 5.11 8 41 Jaccobabad 2.102 5.25 9 42 Baddin 2.206 5.51 10 43 Kashmore 2.426 6.07 11 45 Nawabsha 2.463 6.16 12 46 Dadu 2.496 6.24 13 47 Nowshero Feroze 3.057 7.64 14 50 Sanghar 3.238 8.10 15 51 Jamshoro 3.822 9.56 16 53 Tando Mohd Khan 3.966 9.92 17 56 Tando Allah Yar 4.504 11.27 18 58 Sukkur 5.542 13.86 19 63 Larkana 7.605 19.03 20 75 Mitiari 8.462 21.17 21 81 Hyderabad 13.026 32.59 22 94 Karachi 14.783 36.99 23 98
Source: Estimated from the data of PSLM, 2012-13

19CBER, IBA Working Paper 3
Spatial Disparities in Socioeconomic Development: The Case of Pakistan
Table – A3Intra-Provincial Disparities in Socioeconomic Development – Khyber Pakhtunkhwa Province
[Lowest to Highest Development Rank Order]
Rank Order
Districts Development Score Development Provincial National [ISDI] Index [1-25] [1-114]
Torgarh 0.036 0.08 1 4 Kohistan 0.039 0.09 2 5 Tank 0.621 1.55 3 26 Upper Dir 0.738 1.84 4 28 Shangla 1.305 3.26 5 32 D.I.Khan 1.322 3.30 6 34 Chitral 3.040 7.60 7 49 Lakki Marwat 3.908 9.77 8 54 Bannu 4.452 11.14 9 57 Karak 4.592 11.49 10 59 Hangu 5.050 12.63 11 60 Swabi 5.375 13.45 12 61 Bonair 5.705 14.27 13 65 Mardan 7.226 18.08 14 72 Kohat 7.239 18.11 15 73 Lower Dir 7.518 18.81 16 74 Charsada 7.815 19.55 17 77 Manshera 8.338 20.86 18 79 Batagram 8.623 21.57 19 82 Swat 9.949 24.89 20 86 Nowsehra 11.384 28.48 21 91 Peshawar 13.462 33.69 22 96 Abbottabad 13.888 34.75 23 97 Malakand 17.472 43.72 24 104 Haripur 23.629 59.13 25 108
Source: Estimated from the data of PSLM, 2012-13
Spatial Disparities in Socioeconomic Development: The Case of Pakistan
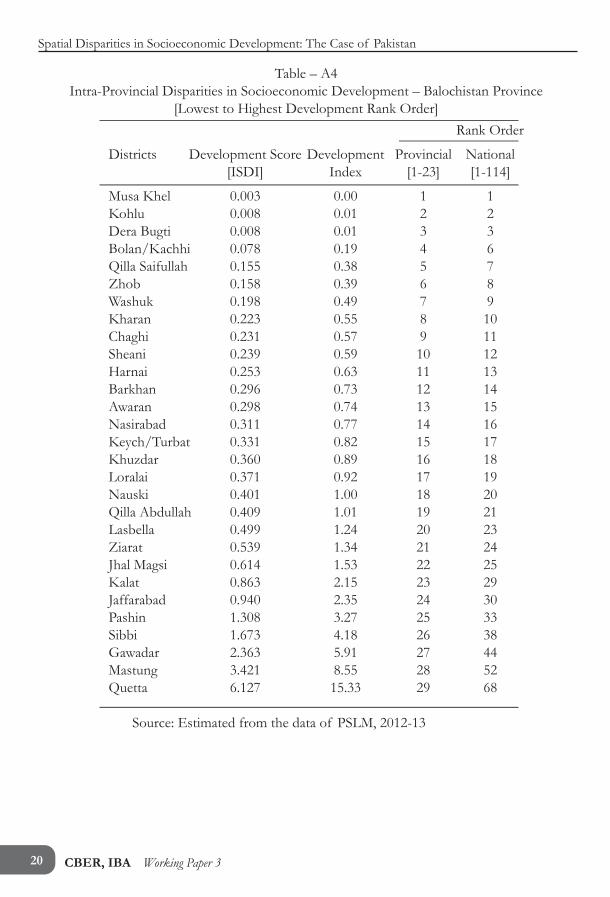
Table – A4Intra-Provincial Disparities in Socioeconomic Development – Balochistan Province
[Lowest to Highest Development Rank Order]
Rank Order
Districts Development Score Development Provincial National [ISDI] Index [1-23] [1-114]
Musa Khel 0.003 0.00 1 1 Kohlu 0.008 0.01 2 2 Dera Bugti 0.008 0.01 3 3 Bolan/Kachhi 0.078 0.19 4 6 Qilla Saifullah 0.155 0.38 5 7 Zhob 0.158 0.39 6 8 Washuk 0.198 0.49 7 9 Kharan 0.223 0.55 8 10 Chaghi 0.231 0.57 9 11 Sheani 0.239 0.59 10 12 Harnai 0.253 0.63 11 13 Barkhan 0.296 0.73 12 14 Awaran 0.298 0.74 13 15 Nasirabad 0.311 0.77 14 16 Keych/Turbat 0.331 0.82 15 17 Khuzdar 0.360 0.89 16 18 Loralai 0.371 0.92 17 19 Nauski 0.401 1.00 18 20 Qilla Abdullah 0.409 1.01 19 21 Lasbella 0.499 1.24 20 23 Ziarat 0.539 1.34 21 24 Jhal Magsi 0.614 1.53 22 25 Kalat 0.863 2.15 23 29 Jaffarabad 0.940 2.35 24 30 Pashin 1.308 3.27 25 33 Sibbi 1.673 4.18 26 38 Gawadar 2.363 5.91 27 44 Mastung 3.421 8.55 28 52 Quetta 6.127 15.33 29 68
Source: Estimated from the data of PSLM, 2012-13
CBER, IBA Working Paper 320


Spatial Disparities inSocioeconomic Development:The Case of Pakistan
JEL Classification Codes:D63, I31
Key Words:Multidimensional Inequality, Inequality Adjusted Socioeconomic Development Index,Development Ranking, Pakistan
Institute of Business AdministrationUniversity Enclave, University RoadKarachi – 75270, Pakistan
AbstractRising spatial disparities in socioeconomic development is a major concern in developing economies. Regional inequality is a dimension of overall inequality, but it has added significance when spatial and regional divisions align with political and ethnic tensions to undermine social and political stability.
This paper is an attempt to document the extent and nature of regional inequality in the level of socioeconomic development. Seventeen indicators related to human resources and standards of living are developed from the district representative household data of Pakistan Social and Living-Standard Measurement Survey (PSLM) for the year 2012-13. These indicators are used to develop Inequality-adjusted Socioeconomic Development Index (ISDI) for districts of Pakistan. The study provides provincial multidimensional Gini coefficients and district development ranking to evaluate inter and intra provincial disparities respectively in the selected dimensions of socioeconomic development. Moreover, development indicators are aggregated at sub-district level to incorporate the intra district inequalities.
IBA PRESS