spatially explicit analysis of water footprints in the uk explicit analysis of water footprints in...
TRANSCRIPT

Water 2011, 3, 47-63; doi:10.3390/w3010047
waterISSN 2073-4441
www.mdpi.com/journal/water
Article
Spatially Explicit Analysis of Water Footprints in the UK
Kuishuang Feng 1,2, Klaus Hubacek 3,4,*, Jan Minx 5,6, Yim Ling Siu 1,7, Ashok Chapagain 8,
Yang Yu 9, Dabo Guan 4 and John Barrett 2
1 Sustainability Research Institute, School of Earth and Environment, University of Leeds, LS2 9JT,
UK; E-Mail: [email protected] (K.F.); [email protected] (Y.L.S.) 2 Stockholm Environment Institute, Grimston House, University of York, York, YO10 5DD, UK;
E-Mail: [email protected] (J.B.) 3 Department of Geography, College Park, University of Maryland, College Park, MD 20742, USA 4 Department of Land Economy, University of Cambridge, Cambridge, CB3 9EP, UK;
E-Mail: [email protected] (D.G.) 5 Department for the Economics of Climate Change, Technische Universität Berlin, 10623 Berlin,
Germany; E-Mail: [email protected] 6 Department for Sustainable Engineering, Technische Universität Berlin, 10623 Berlin, Germany 7 State Key Laboratory of Earth Surface Processes and Resource Ecology, Beijing Normal
University, Beijing 100875, China 8 WWF-UK, Panda House, Weyside Park, Godalming, Surrey, GU7 1XR, UK;
E-Mail: [email protected] 9 Department of Geography, University of Sheffield, Sheffield, S10 2TN, UK;
E-Mail: [email protected]
* Author to whom correspondence should be addressed; E-Mail: [email protected];
Tel: +1 301 405 4567.
Received: 20 November 2010; in revised form: 22 November 2010 / Accepted: 25 December 2010 /
Published: 30 December 2010
Abstract: The Water Footprint, as an indicator of water consumption has become
increasingly popular for analyzing environmental issues associated with the use of water
resources in the global supply chain of consumer goods. This is particularly relevant for
countries like the UK, which increasingly rely on products produced elsewhere in the
world and thus impose pressures on foreign water resources. Existing studies calculating
water footprints are mostly based on process analysis, and results are mainly available at
the national level. The current paper assesses the domestic and foreign water requirements
OPEN ACCESS

Water 2011, 3
48
for UK final consumption by applying an environmentally extended multi-regional
input-output model in combination with geo-demographic consumer segmentation data.
This approach allows us to calculate water footprints (both direct and indirect) for different
products as well as different geographies within the UK. We distinguished between
production and consumption footprints where the former is the total water consumed from
the UK domestic water resources by the production activities in the UK and the latter is the
total water consumed from both domestic and global water resources to satisfy the UK
domestic final consumption. The results show that the production water footprint is
439 m3/cap/year, 85% of which is for the final consumption in the UK itself. The average
consumption water footprint of the UK is more than three times bigger than the UK
production water footprint in 2006. About half of the UK consumption water footprints
were associated with imports from Non-OECD countries (many of which are water-
scarce), while around 19% were from EU-OECD countries, and only 3% from
Non-EU-OECD countries. We find that the water footprint differs considerably across
sub-national geographies in the UK, and the differences are as big as 273 m3/cap/year for
the internal water footprint and 802 m3/cap/year for the external water footprint. Our
results suggest that this is mainly explained by differences in the average income level
across the UK. We argue that the information provided by our model at different spatial
scales can be very useful for informing integrated water supply and demand
side management.
Keywords: water footprint; virtual water; input-output analysis; supply chains; lifestyles;
demand-side management; integrated water management
1. Introduction
The term ‘water footprint’ has become popular as an indicator quantifying the global water
requirements of a given final demand. The water footprint is particularly interesting for analyzing
countries like the UK, which increasingly rely on products produced elsewhere in the world and
therefore impose more and more pressures on foreign water resources [1,2]. Households do not only
consume water directly, but also indirectly when buying goods and services which require water inputs
during production processes, which are substantially higher than a household’s direct water
consumption. Therefore, the water footprint can help us to identify the ‘hidden’ water consumed along
the global supply chain [1]. Reducing the total water footprints can help to preserve the domestic
water resources and to maintain regional water systems in other world regions [2].
The concept of the water footprint was initially introduced by Hoekstra and Hung [3] as an analogy
to the ‘ecological footprint’, and further developed by Chapagain [4], Hoekstra and Chapagain [5,6]
and Hoekstra et al. [7] as the total virtual water content of products consumed by an individual,
business, household, sector, city or country or any other unit of analysis. Although there is a general
understanding that the river basin is the appropriate scale especially when analyzing supply of and
demand for freshwater, trade of products and services implies regional transfers of water in virtual

Water 2011, 3
49
form [8], where virtual water is considered as the volume of water that is required to produce a
commodity [9]. Therefore, it is important to put water issues in both local and global contexts. There
are two groups of approaches for calculating water footprints: bottom-up approaches and top-down
approaches. Bottom-up approaches have individual production processes as their basic building blocks.
The water footprint can be estimated by tracing the direct water requirements across the entire process
chain associated with a particular product system. One way of doing this is to apply the
methodological framework provided by life cycle assessment (LCA) as established in the 14040
standard of the International Organization for Standardization (ISO). While the LCA methodology has
been developed as a management tool to deal generally with any environmental intervention, a water
footprint can be compiled following these definitions and principles as a result of the inventory phase.
A general drawback is that most studies in this area so far are not explicit in space and time. To deal
with the specific aspects of water the ISO is currently developing a standard for water footprinting.
One important ambition in this context is the definition of pathways for the quantification of water
related impacts (mid- and end-point) in different areas of protection. Water footprinting based on the
‘virtual water flows’ approach is a second bottom-up approach to water footprinting. The ‘virtual water
flows’ approach estimates water footprints by calculating the virtual water content of goods and
international trade data. In most of the studies, the virtual water flows are traced only to the immediate
exporting countries [10]. Recently there are a few national water footprint studies which trace the
supply chain beyond immediate exporting countries to the origin of production [2].
The bottom-up approaches to tracking water use provide detailed process-based analyses and can be
more easily used for the needs of a study on specific products. However, it is time-consuming for
carrying out detailed process analyses, particularly for calculating the national water footprint where it
requires a huge amount of data for several thousand products. Another disadvantage of the bottom-up
approaches is the inevitable truncation error, usually tracing water consumption only to a certain level,
particularly with regards to imports. Exiting LCA and water footprint databases do not include the full
suite of products consumed and thus cannot provide a complete picture of the water use associated
with human consumption from the bottom up.
Compared to LCA, environmental input-output analysis (EIOA) as a typical top-down approach
offers a variety of appealing features for water footprinting. First, the approach provides a complete
description of the national and/or international supply chain and avoids the truncation error typically
encountered for bottom-up approaches. Second, they are based on final rather than apparent
consumption and make sure that water used in production is assigned to the end-product consumed
(and its location). For example, the water required for the production of work clothes provided by a car
manufacturer is assigned to the final consumption of a car. This can, for instance, lead to considerable
bias in the allocation of virtual water to different countries. Third, multi-regional model variants also
provide a methodological framework to comprehensively deal with international trade inter-linkages
across countries and sectors. Such models provide a description of the entire global supply chain and
are able to trace water across any supply chain layer. Finally, EIOA approaches are particularly useful
when we want to look at the direct and indirect water requirements of an entire final consumption
pattern of a nation, a region, a lifestyle group or a household. This is because such a final consumption
pattern is comprised of so many different goods and services that bottom-up approaches have problems

Water 2011, 3
50
in providing all the required process-based descriptions of production and water consumption in their
supply chains.
It is important to point out two limitations of applying the EIOA approach to water footprinting:
One is the general aggregation issue at the level of economic sectors rather than individual products,
particularly for agricultural sectors which are highly interesting for the water footprinting analysis. We
overcome this problem partly by applying direct water consumption of agriculture sectors for four
world regions based on virtual water coefficients by Hoekstra and Chapagain [6] who measure the
total water requirement for evapotranspiration from planting to harvesting the crop. The second
shortcoming is the domestic technology assumption because limited data is available on interlinks
between different regions or countries. In most input-output studies, the technology outside the country
is assumed to be produced with the same technology mix as the domestic production. To overcome this
assumption, we apply a multi-regional input-output model to calculate the UK water footprint.
In this study, we apply a water accounting framework based on a multi-region input-output (MRIO)
model and link this to consumption and lifestyle data at the sub-national level in the UK (local
authorities). By doing so, we believe it can show three new features. First, by linking the
geo-demographic consumption data to the multi-regional input-output model we are able to determine
the water footprint (across 61 lifestyle types and) for the 434 local authorities in the UK. Second,
compared to previous MRIO studies for the UK, we have upgraded the multi-regional model from a
uni- to a multidirectional one and use more recent economic data for the non-UK regions in the model.
Third, results are presented for the most recent water data available (2006).
2. Methodology
Environmental input-output analysis (EIOA) has a long history in water accounting studies. An
early study undertaken by Hartman [11] examined features of input-output models in terms of their
usefulness for analyzing regional water consumption and allocation. More recent studies of water
related input-output models are also introduced in this section. Lenzen and Foran [12] carried out a
study on water consumption accounts in Australia and provided a detailed analysis on Australia’s
water requirements by private household, government, export and import. Vela´zquez [13] applied
input-output analysis approach to identify the key water consuming economic sectors in Andalusia and
distinguish direct and indirect water use. Hubacek and Sun [14] compared water supply and demand
for all major watersheds in China using hydro-ecological regions to match watersheds with
administrative boundaries. Guan and Hubacek [15] extended this work by taking the pollution
absorption capacity into account using North China as a case study. Hubacek et al. [16] carried out a
study on environmental implications of urbanization and lifestyle change in China by calculating
ecological and water footprints, which is one of the first studies on water footprints by using the
input-output model. Lenzen and Peters [17] analyzed the direct and indirect water requirements of two
Australian Cities in their domestic hinterland in a highly spatially disaggregated model. Yu et al. [1]
carried out a study on assessing regional and global water footprint for the UK by applying a
uni-directional MRIO framework.
In this paper a distinction is made between production (domestic) and consumption (global) water
footprints for the UK. The production water footprint is of higher interest to policy makers and water

Water 2011, 3
51
companies concerned with the balance of supply and demand of water resources within their respective
administrative boundaries or watersheds [18,19]. The consumption water footprint of a country or
region gives an overall picture of total water consumed along the global supply chain by taking water
inflows (imported virtual water through production of imported products and services) into account
and subtracting water outflows (exported virtual water through production of exported products and
services). It allows the linking of consumption activities to their water impacts and thus provides
important information for consumer based approaches.
2.1. Production and Consumption Water Footprints
The MRIO model used for this research was developed previously by the Stockholm Environment
Institute [20-22]. The model is based on a supply and use framework and accounts for the UK trade
with three world regions, EU OECD countries (Region e), Non-EU OECD countries (Region o) and
Non-OECD countries (Region w) in a uni-directional way [23]. For this research we update economic
data for non-UK regions to 2004, switch from a supply and use to an industry-by-industry framework
and account for trade inter-linkages between all world regions in a multi-directional model set-up.
In a MRIO framework, different world regions are connected through bi-lateral trade. The technical coefficient matrix A can be calculated by , where is the trade between economic
sectors from region k to region s, is the total sectoral output in region s. The subscripts i and j
denote the selling and purchasing sector, respectively, while the superscripts k and s identify the
delivering and receiving world regions. We can then display a compound technology matrix (a
matrix of Aks) in block format:
Note that the matrix blocks on the main diagonal represent the domestic production in the different
regions, while off-diagonal blocks represent trade flows between regions. In a similar way we can
construct a compound final demand vector showing the consumption of final goods and services in
the UK from the different world regions as well as a compound total output :
,
Therefore, we can write the basic input-output identity in our multi-regional model setting by:
(1)
Then
(2)
Equation 2 can be re-written by:

Water 2011, 3
52
(3)
where is known as the Leontief inverse matrix which shows the total production of
each sector required to satisfy the final demand in the economy.
We extend the MRIO tables by adding water inputs in physical units. The extended MRIO tables
can be used to quantify the total volume of water consumed by a given final demand. First we calculate
the direct water consumption coefficients ej by dividing the total amount of water directly consumed in
the jth sector by total output of that sector xj. Thus, a compound vector of water coefficients can be
written as:
In this paper, we also denote , , and as:
, , ,
We can then derive UK production water footprints using Equation 4:
(4)
where is the production water footprint in the UK; is the direct water intensity for the UK
domestic production sectors, indicates a diagonal which include both the UK domestic final
demand and the export.
The consumption water footprint constitutes two parts: internal water footprint and external water
footprint. The internal water footprint is the water consumed from the UK domestic water resources to
satisfy the UK domestic consumption; the external water footprint is the water consumed from the
global water resources outside of the UK for the UK domestic final demand. Based on the MRIO
framework we can easily capture the UK internal water footprint by:
(5)
where is used for measuring the UK domestic water consumed by producing goods and
services for the UK domestic final demand; is the direct water consumption by household in the
UK. The UK external water footprint can be calculation by:
(6)
where , and are the total water consumed by the UK domestic final demand
from EU OECD countries (Region e), Non-EU OECD countries (Region o) and Non-OECD countries
(Region w), respectively.
Thus, the total consumption water footprints of the UK can be calculated by adding up the internal
and external water footprints which is shown in Equation 7:
(7)
where denotes the UK consumption water footprint; is the UK internal water footprint; and
is the UK external water footprint.

Water 2011, 3
53
In this study, we also link the MRIO model to geo-demographic data, in order to calculate the water
footprints at local authority level. The internal and external water footprints of local authorities can be
calculated from Equations 5 and 6 through replacing by domestic final consumption of each
local authority.
2.2. Data
We use the 2004 UK national IO table (123 by 123 sectors) from the UK office for National
Statistics (ONS), trade data from HM Revenue and Customs and foreign input-output data (57 by
57 sectors) from database version 7 of Global Trade Analysis Project [24,25]. The UK direct water
consumption of 22 industry and service sectors for 2006 was derived from the ONS. We aggregate the
UK input-output table to match the industry and service sectors of water consumption for the UK, in
order to obtain the water intensity of different industry and sectors. We then allocate the direct water
coefficients to the detailed input-output economic sectors by assuming that similar industry and service
sectors have the same direct water coefficients. The non-agriculture sectoral water consumption for the
EU-OECD countries, Non-EU-OECD countries and Non-OECD countries are collected from various
sources below. Water data for EU-OECD countries are collated from the water accounts published by
the Office for Official Publications of the European Communities [26]. We use direct water
coefficient of Australia for Non-EU-OECD countries [27] and China for Non-OECD countries [28]
respectively, because of limited water consumption data for countries belonging to these groups. The
direct water consumption of agriculture sectors for four world regions are based on the study of
Hoekstra and Chapagain [6] which measures the total water requirement for evapotranspiration from
planting to harvesting the crop. The water consumption for the livestock sector are calculated through
the method provided by Chapagain and Hoekstra [29], which includes drinking and service water for
animals. The UK geo-demographic consumption data are collected from the MOSAIC database. The
MOSAIC profiles are mainly based on census data which is augmented with a variety of other data
sources including expenditure and income information, electoral roll, Experian lifestyle survey
information, and consumer credit activities, alongside the post office address file, shareholders
register, house prices and council tax information, and ONS local area statistics [30].
3. Results and Discussion
3.1. Production Water Footprint of the UK
The UK production water footprint includes two parts. The first part is the water consumed for
satisfying the UK domestic production for final consumption of goods and services requiring water
inputs from UK domestic water resources; the other is the UK domestic water resources used for
production of export, which are finally consumed by other countries’ final consumers. In this paper, it
is also important to clarify that domestic final demand for the UK includes household consumption,
government consumption, fixed capital formation and changes in inventories, where household
consumption accounts for more than 90% of the total UK domestic final demand for most of the water
intensive sectors such as Agriculture, Livestock, Food products, and Electricity and gas production.
From Table 2 we can see that the production water footprint for the UK is 22,977 million m3 in 2006,

Water 2011, 3
54
which is 383 m3 per person; of which the water for UK domestic final consumption accounts for 83%,
and 17% of the production water footprint is for the production of exports. Our result is lower than the
calculated 625 m3/cap/year in the WWF-UK study [2]. This is caused by differences in the input data
used in our model—mainly in the area of livestock related water consumption: the water footprint for
Livestock in WWF report is much higher because it includes all the animal feeds from crops and
grasses. This paper only takes animal feed from crops into account.
Table 2. UK direct water intensity (m3/£1000) and production water footprints (million
m3) by sectors.
Sectors DWI Production water footprints
Domestic FD Export TotalAgriculture 1,964.1 7,747 854 8,601
Livestock 44.3 547 60 607Forestry 146.5 25 9 33Fishing 1,288.1 44 506 550Mining 3.5 3 85 88
Food products 3.5 3,245 727 3,971Textiles 2.0 11 12 24
Leather products 2.0 11 22 33Wood products, except furniture 3.2 9 4 13
Paper, paperboard and publishing 3.2 56 45 101Chemicals 8.1 73 428 501
Non-metal mineral products 2.5 10 17 26Metal products 7.0 56 154 211
Manufacture Machinery 0.6 30 85 116Electric machinery 0.8 29 101 130
Transport equipment 1.6 108 183 291Other manufacturing 2.8 53 19 72
Electricity and gas production 78.1 1,637 25 1,662Water supply 78.1 227 0 227Construction 0.1 333 0 333
Retail and trade 0.8 978 131 1,109Hotels and restaurants 0.8 1,987 219 2,206
Transportation 0.4 63 49 112Business and finance 0.4 347 188 535Public administration 0.4 379 1 379
Education 1.0 297 6 303Health and Social activities 1.0 568 0 568
Recreational and cultural activities 0.4 156 22 178Total - 19,029 3,948 22,977
Production WF per person (m3) - 317 66 383
Note: FD = final demand; WF = water footprint; DWI = direct water intensity.
Table 2 also shows the water intensity and water footprints for different economic sectors. From
Table 2 we can observe that Agriculture is the most water intensive and the largest water consuming
sector with 7,747 million m3 (41%) for domestic final consumption and 854 million m3 for export.

Water 2011, 3
55
Livestock, Forestry and Fishing are water intensive sectors, but they have relatively small water
footprints because of their low sector outputs. Food product and Hotels and restaurants have large
water footprints despite a relatively low direct water intensity as a huge amount of the water is
consumed indirectly from Agriculture providing significant inputs to these two sectors. By contrast,
the high water footprint of Electricity and gas production is caused by a high water intensity of the
sector itself. Most other economic sectors have relatively low water footprints. Household direct water
consumption only accounts for 12% of the total UK production water footprint.
3.2. Consumption Water Footprints of the UK
The consumption water footprint represents the total water consumed from water resources along
the global supply chain to satisfy UK domestic final consumption. The consumption water footprint for
the UK is 86,038 million m3 or 1,438 m3 per person. This is more than three times greater than the
production water footprint provided in this study and more than two times greater than the ones
reported in the recent WWF report. The UK external water footprint makes 74% of the total water
footprint, or 63,739 million m3, of the UK consumption water footprint. This is close to the results
reported by Chapagain and Orr [2]. Evidence has been presented in the literature that withdrawal of
freshwater takes place at rates greater than nature’s ability to renew in many regions of the world
including countries in the Middle East, India, Mexico, China, the United States, Spain and the former
Soviet Union [31,32]. Many of these countries export vital virtual water to the UK. From Figure 1 we
can see that more than half of the UK consumption water footprint is allocated to Non-OECD
countries which include most developing countries and emerging economies such as China and India.
About 19% of the UK consumption water footprint is consumed from the water resources in
EU-OECD countries, and only 3% of the UK consumption water footprint stems from
Non-EU-OECD countries. Therefore, a reduction in the consumption of water intensive goods and
services in the UK can not only help to reduce the burden on the domestic water resources, but also
significantly contribute to reducing the global water shortage, particularly in water scarce regions of
both developed and developing countries.
We further distinguish the UK consumption water footprint by sectors and world regions. Figure 2
shows the top ten largest global water consuming sectors in the UK, sharing more than 80% of the total
consumption water footprint. From Figure 2 we can observe that Food products becomes the largest
water consumer in the UK accounting for 27% of the total once we take into account the water
consumption in the sector’s global supply chain. 55% of the water required for Food products, is from
Non-OECD countries (Rest of World), and water from EU-OECD countries accounts for 28% of the
sector total water footprints. This means only 14% of the water required to produce Food products is
from UK domestic water resources. The situation is fairly similar in many of the other sectors such as
Retail and trade, Health and social activities, Livestock, Public administration and Construction sectors
with the largest share of water coming from non-UK sources. Figure 2 also shows that Agriculture
becomes the second largest water consuming sector which mainly consumes the UK domestic water
resource with relatively low water requirement from the three global regions. Similarly, most water
consumption in Electricity and gas production is from domestic water sources, whereas for Leather
products almost all water is imported from other regions. From the results in Figure 2 we can conclude

Water 2011, 3
56
that reduction of Food and other products with high water footprints in the UK would be a significant
contribution for mitigating the burden on the global water resources.
Figure 1. UK total water footprints divided by regions (million m3).
Figure 2. Top ten largest global water consuming sectors in the UK (million m3).
3.3. Spatial Analysis of the UK Water Footprints at Local Level
As in many other countries of the world, in the UK there are great disparities across the country in
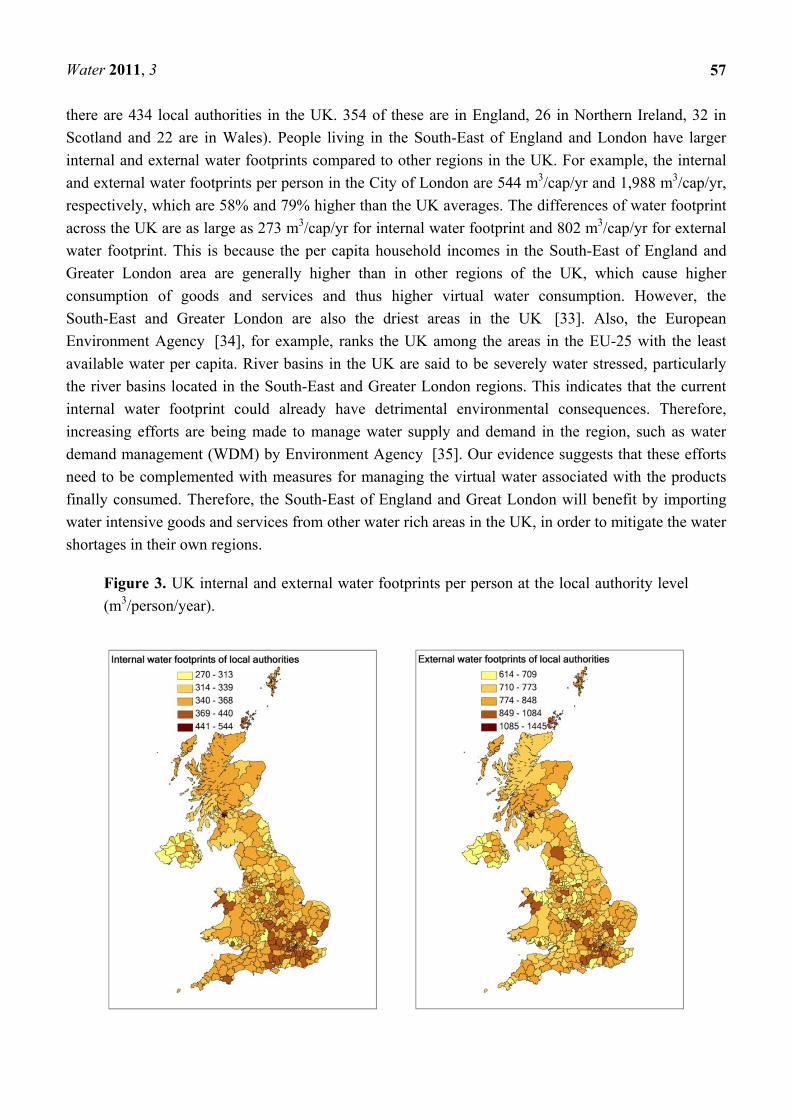
terms of household consumption. Figure 3 shows the UK internal and external water footprints per
person at the local authority level (Local authority is local government in the United Kingdom. In total,
Water 2011, 3
57
there are 434 local authorities in the UK. 354 of these are in England, 26 in Northern Ireland, 32 in
Scotland and 22 are in Wales). People living in the South-East of England and London have larger
internal and external water footprints compared to other regions in the UK. For example, the internal
and external water footprints per person in the City of London are 544 m3/cap/yr and 1,988 m3/cap/yr,
respectively, which are 58% and 79% higher than the UK averages. The differences of water footprint
across the UK are as large as 273 m3/cap/yr for internal water footprint and 802 m3/cap/yr for external
water footprint. This is because the per capita household incomes in the South-East of England and
Greater London area are generally higher than in other regions of the UK, which cause higher
consumption of goods and services and thus higher virtual water consumption. However, the
South-East and Greater London are also the driest areas in the UK [33]. Also, the European
Environment Agency [34], for example, ranks the UK among the areas in the EU-25 with the least
available water per capita. River basins in the UK are said to be severely water stressed, particularly
the river basins located in the South-East and Greater London regions. This indicates that the current
internal water footprint could already have detrimental environmental consequences. Therefore,
increasing efforts are being made to manage water supply and demand in the region, such as water
demand management (WDM) by Environment Agency [35]. Our evidence suggests that these efforts
need to be complemented with measures for managing the virtual water associated with the products
finally consumed. Therefore, the South-East of England and Great London will benefit by importing
water intensive goods and services from other water rich areas in the UK, in order to mitigate the water
shortages in their own regions.
Figure 3. UK internal and external water footprints per person at the local authority level
(m3/person/year).

Water 2011, 3
58
In the climate change literature carbon footprints are increasingly analyzed in their relationship to
urbanization [36,37]. There is little evidence available on how the consumption water footprint is
related, for example, to consumption in rural, peri-urban and urban areas. In Figure 4, we show the
water footprint per capita per year for six spatial classes distinguished by their respective degree of
urbaness/ruralness [38]. Class 1 contains all local authority areas classified as “major urban”, while
class 6 includes all extremely rural local authority areas in the UK (See Table 1 in Appendix for
detailed description on six classes). Looking across the spatial classes (1–6) we find that there is little
difference in terms of the average water footprint value as shown in Figure 4. Even though “large
urban” and “other urban” areas (classes 2 and 3) have slightly lower average water footprints than rural
areas (classes 4–6), major urban areas (class 1) have the highest average consumption water footprint
across all classes. However, most striking is the variation within the classes—particularly for “major
urban” areas (class 1). In fact, the “major urban” areas class contains both the local authority with the
highest and lowest consumption water footprint in the UK.
Figure 4. Consumption water footprint by degree of urbanization (m3/cap/yr).
Note: per capita consumption water footprint in this figure includes only household and government consumption but not fixed capital formation and changes in inventories.
So what drives the consumption water footprint? Figure 5 shows that the income of households in a
particular local authority is a major determinant of differences observed in consumption water
footprints across the UK: consumption water footprints are linearly increasing with average per capita
income levels in local authorities. Overall, differences in per capita income explain almost 80% of the
observed variation across local authorities. This relationship is stronger than for the carbon footprint as
reported elsewhere [37].

Water 2011, 3
59
This result makes intuitive sense, if we consider that structural characteristics of rural and urban
areas have influence on the carbon footprint in key consumption areas such as housing or transport.
For example, people in the countryside tend to live in bigger houses and they are more dependent on a
car. Vice versa, public transport systems can reap substantial carbon benefits in urban areas. This is not
the case for the consumption water footprint. Key consumption areas as identified in Figure 2 are
mainly food and agricultural products, which are not strongly linked to structural characteristics of
local areas. Our paper therefore provides evidence that the structural features of an area have relatively
little impact on the consumption water footprint: other socio-economic characteristics such as the level
of wealth and lifestyles seem to determine the observed differences.
Figure 5. Relationship between per capita income in different local authorities in England
and their average per capita consumption water footprint.
4. Conclusions
This study found that food and agricultural products are playing a significant role in terms of both
internal and external water footprints of the UK. However, as the international community is shifting
towards renewable energy sources, especially biofuels, it could add considerable stress to the local
water resources, particularly for the water scarce countries in which both energy and water are
important to support their economic growth. Hence, the national and local governments should
seriously take water scarcity into account when evaluating any policy to promote bio-energy.
We also found that three quarters of the freshwater extraction associated with the UK consumption
water footprint takes place in other world regions. This means that the UK has a great responsibility
for the water resource depletion on the global scale, and at the same time it is being dependent on
water resources in these countries. However, the governmental policies in most water importing

Water 2011, 3
60
countries, like the UK and other developed countries, solely focus on preserving their domestic water
resources, although the responsibility of the inhabitants of a region for water resources depletion is
determined by their consumption of both domestically produced as well as imported goods and
services. Therefore, water footprint should also be considered on the international forum and discussed
in more strategic ways similar to the discussions on greenhouse gases emissions. For example,
international agreements are required to transfer advanced technologies from developed countries to
developing countries in order to improving local irrigation systems for virtual water exporting
countries. This study also shows the importance for providing information to final consumers so that a
conscious choice can be made. It also shows the importance of appropriate water pricing structures to
reflect water scarcity in other regions which could also serve to induce customers to choose products
with sustainable water footprints. Such scarcity based market mechanisms could lead to a re-allocation
of the global supply chain to the production of products where they generate the lowest environmental
impacts, and equitable use of resources.
In addition, the UK internal water footprints at the local level indicate that the domestic final
consumption has put huge pressures on their domestic water resources. In particular, households in the
South-East of England and Greater London with higher consumption of goods and services can
substantially reduce the burden on domestic water resources by reducing their internal water footprints,
e.g. efficient taps, behavior change, less wastages of water intensive products etc. We have shown that
there is a strong relationship between water footprints and per capita income, which implies that
lifestyles are important to the consumption water footprint. Though local authorities are well placed to
reach out to people, they need to be supported through structural policies at the national level. As
people use resources more carefully in equal societies [39], we suggest that redistributional policies
could help to narrow the regional disparities of household incomes and reduce both internal and
external water footprints. Such policies could also help sharing the burden on regional water resources
more equally across the UK, particularly, for reducing the water stress in the South-East and Greater
London areas.
References
1. Yu, Y.; Hubacek, K.; Feng, K.; Guan, D. Assessing regional and global water footprints for the
UK. Ecol. Econ. 2010, 69, 1140-1147.
2. Chapagain, A.K.; Orr, S. UK Water Footprint: The Impact of the UK’s Food and Fibre
Consumption on Global Water Resources; WWF-UK: Surrey, UK, 2008.
3. Hoekstra, A.Y.; Hung, P.Q. Virtual Water Trade: A Quantification of Virtual Water Flows
between Nations in relation to International Crop Trade; Institute for Water Education: Delft, The
Netherlands, 2002.
4. Chapagain, A.K. Globalisation of Water: Opportunities and Threats of Virtual Water Trade; A.A.
Balkema Publishers, Taylor & Francis Group: Leiden, The Netherlands, 2006.
5. Hoekstra, A.Y.; Chapagain, A.K. Water footprints of nations: water use by people as a function of
their consumption pattern. Water Resour. Manage. 2007, 21, 35-48.
6. Hoekstra, A.Y.; Chapagain, A.K. Globalization of Water: Sharing the Planet's Freshwater
Resources; Blackwell Publishing: Oxford, UK, 2008.
Water 2011, 3
61
7. Hoekstra, A.Y.; Chapagain, A.K.; Aldaya, M.M.; Mekonnen, M.M. Water Footprint Manual:
State of the Art 2009; Water Footprint Network: Enschede, The Netherlands, 2009.
8. Chapagain, A.K.; Hoekstra, A.Y. The global component of freshwater demand and supply: An
assessment of virtual water flows between nations as a result of trade in agricultural and industrial
products. Water Int. 2008, 33, 19-32.
9. Allan, J.A. Virtual water: A strategic resource global solutions to regional deficits. Ground Water
1998, 36, 545-546.
10. Hoekstra, A.Y.; Chapagain, A.K. Water footprints of nations: Water use by people as a function
of their consumption pattern. Water Resour. Manage. 2007, 21, 35-48.
11. Hartman, L.M. The Input-output model and regional water management. J. Farm Econ. 1965, 47,
1583-1591.
12. Lenzen, M.; Foran, B. An input–output analysis of Australian water usage. Water Policy 2001, 3,
321-340.
13. Vela’zquez, E. An Input–output model of water consumption: Analysing intersectoral water
relationships in Andalusia. Ecol. Econ. 2006, 56, 226-240.
14. Hubacek, K.; Sun, L. Economic and societal changes in China and its effects on water use. J. Ind.
Ecol. 2005, 9, 187-200.
15. Guan, D.; Hubacek, K. A new and integrated hydro-economic accounting and analytical
framework for water resources: A case study for North China. J. Environ. Manage. 2008, 88,
1300-1313.
16. Hubacek, K.; Guan, D.; Barrett, J.; Wiedmann, T. Environmental implications of urbanization and
lifestyle change in China: Ecological and water footprints. J. Clean. Prod. 2009, 17, 1241-1218.
17. Lenzen, M.; Peters, G.M. How city dwellers affect their resource hinterland. J. Ind. Ecol. 2010,
14, 73-90.
18. WWF Living Planet Report 2008; WWF: Gland, Switzerland, 2008.
19. WWF Living Planet Report 2010; WWF: Gland, Switzerland, 2010.
20. Lenzen, M.; Wood, R.; Wiedmann, T. Uncertainty analysis for Multi-Region Input-Output
Models—A case study of the UK’s carbon footprint. Econ. Syst. Res. 2010, 22, 43-63.
21. Minx, J.C.; Wiedmann, T.; Wood, R.; Peters, G.P.; Lenzen, M.; Owen, A.; Scott, K.; Barrett, J.;
Hubacek, K.; Baiocchi, G.; Paul, A.; Dawkins, E.; Briggs, J.; Guan, D.; Suh, S.; Ackerman, F.
Input-output analysis and carbon footprinting: An overview of applications. Econ. Syst. Res. 2009,
21, 187-216.
22. Wiedmann, T.; Wood, R.; Minx, J.; Lenzen, M.; Guan, D.; Harris, R. A carbon footprint time
series of the UK—Results from a Multi-Region Input-Output Model. Econ. Syst. Res. 2010, 22,
19-42.
23. Andrew, R.; Peters, G.P.; Lennox, J. Approximation and regional aggregation in multi-regional
input-output analysis for national carbon footprint accounting. Econ. Syst. Res. 2009, 21, 311-335.
24. Lee, H.L.; Hertel, T.; Sohngen, B.; Ramankutty, N.; Towards an Integrated Data Base for
Assessing the Potential for Greenhouse Gas Mitigation; GTAP Technical Paper No. 25; The
Methane and Sequestration Branch of the US Environmental Protection Agency (USEPA): West
Lafayette, IN, USA, 2005.
Water 2011, 3
62
25. Narayanan, B.; Walmsley, T. Global Trade, Assistance, and Production: The GTAP 7 Data Base;
Center for Global Trade Analysis, Purdue University: West Lafayette, IN, USA, 2008.
26. European Commission. Water Accounts: Results of Pilot Studies; Office for Official Publications
of the European Communities: Luxemburg, 2002.
27. Australian Bureau of Statistics Water Accounts; Australian Government, National Water
Commission: Canberra, Australia, 2006.
28. China National Statistic Office. China Statistical Yearbook 2006; China Statistics Press: Beijing,
China, 2006.
29. Chapagain, A.K.; Hoekstra, A.Y. Virtual Water Flows between Nations in Relation to Trade in
Livestock and Livestock Products; Value of Water Research Report Series 13; UNESCO-IHE,
Institue for Water Education: Delft, The Netherlands, 2003.
30. Mosaic United Kingdom—The Consumer Classification for the UK; Experian: Nottingham, UK,
2008.
31. Water, a Shared Responsiblity; United Nations Educational, Scientific and Cultural Organization:
Paris, France, 2006.
32. Falkenmark, M.; Lannerstad, M. Consumptive water use to feed humanity—curing a blind spot.
Hydrol. Earth Syst. Sci. Discuss. 2004, 1, 7-40.
33. Water Resources in England and Wales—Current State and Future Pressures; GEHO1208BPAS-
E-E; Environment Agency: Bristol, UK, 2008.
34. Water Scarcity; European Environment Agency (EEA): Copenhagen, Denmark, 2010. Available
online: http://www.eea.europa.eu/themes/water/featuredarticles/water-scarcity (accessed on 13
December 2010).
35. Water Demand Management Bulletin; Enviroment Agency: Rotherham, UK, 2010. Available
online: http://www.environment-agency.gov.uk/business/news/103450.aspx (accessed on 13 December
2010).
36. Kennedy, C.; Steinberger, J.; Gasson, B.; Hansen, Y.; Hillman, T.; Havránek, M.; Pataki, D.;
Phdungsilp, A.; Ramaswami, A.; Mendez, G.V. Greenhouse gas emissions from global cities.
Environ. Sci. Technol. 2009, 43, 7297-7302.
37. Minx, J.; Creutzig, F.; Medinger, V.; Ziegler, T.; Owen, A.; Baiocchi, G. Developing a Progmatic
Approach to Assess Urban Metabolism in Europe; A Report to the European Environment
Agency; Stockholm Environment Institute, The University of York: York, UK; Technische
Universität Berlin: Berlin, Germany, 2010.
38. Defra Classification of Local Authority Districts and Unitary Authorities in England—An
Introductory Guide; Department for Environment Food and Rural Affairs: York, UK, 2009.
39. Wilkinson, R.; Pickett, R. The Spirit Level: Why More Equal Societies Almost Always Do Better;
Allen Lane: London, UK, 2009.

Water 2011, 3
63
Appendix
Table 1. Consumption water footprint by degree of urbanization (m3/cap/yr).
Min Max Average SD
1 Major Urban Districts with either 100,000 people or 50%
of their population in an urban area of more
than 750,000
906 1,988 1,149 194
2 Large Urban Districts with either 50,000 people or 50%
of their population in one of the 17 urban
areas of the UK with a population between
250,000 and 750,000
916 1,277 1,080 84
3 Other Urban Districts with fewer than 37,000 people and
more than 26% of their population in rural
settlements and large market towns
952 1,313 1,066 78
4 Significant Rural Districts with more than 37,000 people and
more than 26% of their population in rural
settlements and market towns.
988 1,304 1,143 83
5 Rural-50 District with at least 50% but less than 80%
of their population in rural settlements and
larger market towns
909 1,329 1,135 84
6 Rural-80 Districts with at least 80% of their
population in rural settlements and larger
market towns
982 1,262 1,146 59
© 2010 by the authors; licensee MDPI, Basel, Switzerland. This article is an open access article
distributed under the terms and conditions of the Creative Commons Attribution license
(http://creativecommons.org/licenses/by/3.0/).