special economic zones engines of growth sanjeet singh, director (sez) dept of commerce, govt. of...
TRANSCRIPT

Special Economic ZonesEngines of Growth
Sanjeet Singh, Director (SEZ)
Dept of Commerce, Govt. of India
1
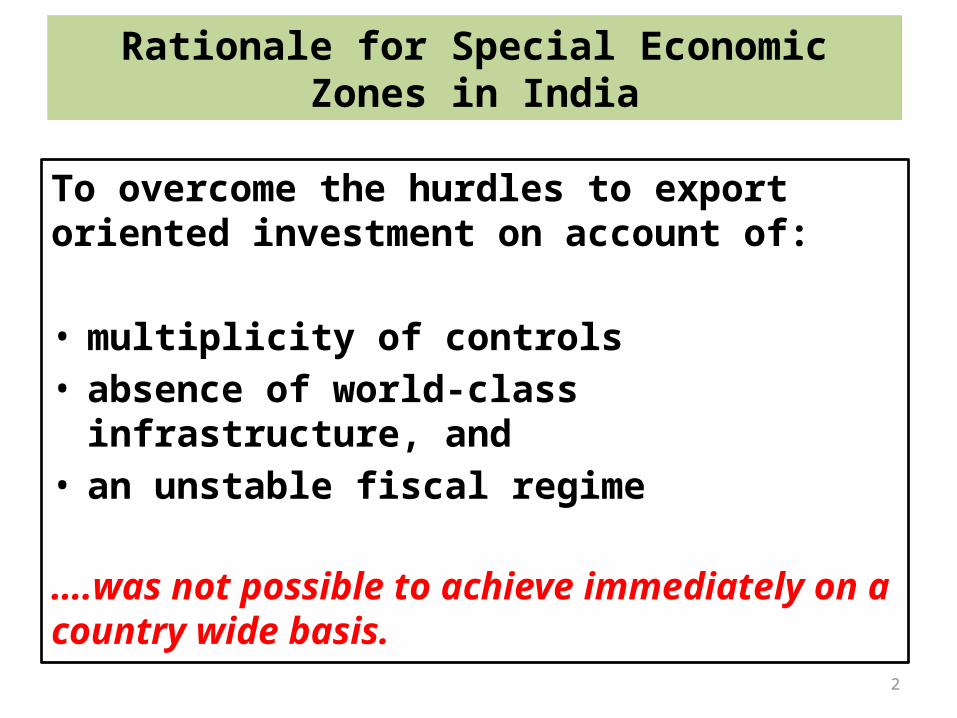
Rationale for Special Economic Zones in India
To overcome the hurdles to export oriented investment on account of:
• multiplicity of controls • absence of world-class infrastructure, and • an unstable fiscal regime
….was not possible to achieve immediately on a country wide basis.
2

Evolution of SEZs
Evolved from the Export Promotion Zones initiative of the 70’s
Special Economic Zones (SEZs) Policy was announced in April 2000.
Parliament passed the Special Economic Zones Act, 2005 which supported by SEZ Rules, came into effect on 10th February, 2006.
3

Key Objectives of SEZ Policy
Generation of additional economic activity
Promotion of exports of goods and services;
Promotion of investment from domestic and foreign sources;
Creation of employment opportunities;
Development of infrastructure facilities
4

• Simplified procedures for setting up SEZs
• Single window clearance
• A designated duty free enclave
• Simplified compliance procedures
5
The SEZ Policy
• Enhanced investment inflow
• Enhanced export infrastructure and productive capacity
• Generation of additional economic activity
• Creation of employment opportunities.

Fiscal Incentives Regime
Duty free import/domestic procurement of goods for development, operation and maintenance of SEZ units
External commercial borrowing by SEZ units upto US $ 500 million in a year without any maturity restriction, as per the guidelines of the Ministry of Finance.
Exemption from Central and State levies (Sales Tax, Service Tax, some other levies).
Single window clearance for Central and State level approvals.
Income Tax exemption on income of SEZ Developers and Units has been severely curtailed through imposition of measures like MAT and DDT etc.
Net foreign exchange earnings by Units within five years;
Domestic sales subject to full customs duty
6

SEZ Administrative Structure
• Department of Commerce, Govt of India• The Board of Approvals
Apex: Govt of India
• SEZ Development Commissioner• Unit Approval Committee
Operational Level: SEZ
• State Governments• Department of Revenue (CBEC, CBDT, DGEP)• Ministry of Environment, etc
Other KeyDepartments
7

SEZs at a Glance (As on 25.10.2012)
Number of Formal approvals 586
Number of notified SEZs 385(incl 7 Central Govt. + 12 State/Pvt. SEZs)
No. of In-Principle Approvals 49
Operational SEZs 158(17 are multi product SEZs)
Units approved in SEZs 3,482

Exports from SEZs
Years Exports( Rs. Crore)
Growth Rate
2006-2007 34,787 52%
2007-2008 66,638 93%
2008-2009 99,689 50%
2009-2010 2,20,712 121%
2010-2011 3,15,868 43.1%
2011-2012 3,64,478 15.4%2012-2013
(April – June, 2012)1,18,322 64%

Major Sector-wise Exports from SEZs(2006-07 to 2011-12)
Financial Years
Computer/ Electronic software
Gems and
Jewellery
Chemicals and
Petroleum Refinery
Other Mfg sectors
Total Exports
2006-07 507 16,069 1,106 16,933 34,615
2007-08 3,985 23,006 1,423 38,224 66,638
2008-09 16,228 33,436 6,386 43,639 99,689
2009-10 45,784 43,829 73,972 57,126 2,20,711
2010-11 84,700 47,849 1,06,558 76,761 3,15,868
2011-12 81,017 74,617 1,52,516 56,327 3,64,478
(export figures in crores)

Employment and Investment in SEZs (as on 30.6.2012)
EMPLOYMENT(no. of persons)
Incremental Employment(after Feb, 2006)
Total Employment
Total 7,85,539 9,20,243
INVESTMENT Incremental investment (after Feb, 2006)
Total Investment
Total Rs.2,09,570.03 cr. Rs.2,13,605.54 cr.

2000
-01
2001
-02
2002
-03
2003
-04
2004
-05
2005
-06
2006
-07
2007
-08
2008
-09
2009
-10
2010
-11
2011
-12
0
500,000
1,000,000
1,500,000
2,000,000
2,500,000
India's Global Trade 2000-2011Exports, Imports and Trade Balance (Rs Crores)
Source : DGCIS
Exports (X) Imports (M) M-X

The Imperative for Enhanced Exports and FDI Growth
• India’s Balance of Trade is in deficit, which is a fairly high proportion of GDP.
• While exports have growth over the past decade, imports have also risen sharply, resulting in a growing adverse balance of trade position.
• This gap is financed in part through net services income and net remittances.
• The Current Account remains in deficit, the remaining gap is covered through net inflows on the Capital Account
• There is no option other than promoting enhanced export and FDI growth.
• The SEZ program is a promising instrument for achieving both these objectives
.

2004-05
2005-06
2006-07
2007-08
2008-09
2009-10
2010-11
2011-120
50
100
150
200
250
300
350
4.885 6.05 10.16
11.86 26.127.64
25.07
Share of SEZ Exports in India's Exports
Total exports of the Country
Total SEZ Exports
% share of SEZ exports in the total exports of the country

Impact of SEZs
15
Direct and indirect employment
CChanges in consumption pattern and social life
Emergence of new economic activities
,
Human development facilities (such as for education, healthcare etc.)
Studies commissioned by the Department of Commerce have indicated that SEZs have had a positive local area impact in terms of

Some Significant Trends in SEZ Sector Growth
Geographical Concentration of SEZs: Six States, Andhra Pradesh, Kerala, Maharashtra, Gujarat, Karnataka and Tamil Nadu, account for a major proportion of SEZs and 92% of total exports from them.
Urban centric growth of SEZs – Even within these six States, SEZs are largely concentrated around existing urban agglomerates, leaving the hinterland virtually untouched.
Sectoral Dispersion of SEZs: There is a pre-dominance of IT SEZs in the sector, and multi sector SEZs are few and far between. Of the 153 operational SEZs, only 17 are multi product SEZs.
Skewed Export Pattern: IT/ITES SEZs and Petroleum sector contribute to the roughly two-thirds of SEZ exports. Non-petroleum manufacturing contributes the balance minority share.
Inadequate progress of Manufacturing activity: As reflected above, the SEZ sector has not fully addressed the concern of boosting the manufacturing sector in India.
Limited number of Operational SEZs: While 589 SEZs have been formally approved as on 31st May 2012, only 389 have been notified, of which only 153 SEZs are exporting i.e. only 39.33 % of the approved SEZs.

Distribution of SEZs in the Country

Andhra Pradesh
25%
Tamil Nadu20%
Karnataka14%
Maha-rashtra
13%
Gujarat9%
Kerala5%
Others15%
Distribution of SEZs across States in India( Percentage of operational SEZs as on May
2012)

State wise Approved, Notified and Operational SEZs(as in Aug, 2012)
19
Andhra Pradesh
Chandiga
rh
Chhattisg
arh
Delhi
Dadra &
Nag
ar Hav
eli Goa
Gujarat
Haryan
a
Jhark
hand
Karnata
kaKera
la
Mad
hya Prad
esh
Mah
arash
tra
Nagala
ndOris
sa
Puducherr
y
Punjab
Rajasth
an
Tamil N
adu
Uttar Prad
esh
Uttarakh
and
Wes
t Ben
gal
0
20
40
60
80
100
120
Approved SEZs Notified SEZs Operational SEZs

IT/IT Enabled Services
54%
Multi-Product11%Other
8%
Engineering 5%
Pharma/chemicals5%
Electronic Hardware3%
Textiles/Apparel/Wool
3%Food Processing
2%
Gems and Jewellery 2%
Bio-tech1%
Footwear/Leather1%
FTWZ1%
Non-Conventional Energy
1%
Semiconductor1%
Sector-wise Distribution of exporting SEZs (As on 30.06.2012)

2006-072007-08
2008-092009-10
2010-112011-12
0
50,000
100,000
150,000
200,000
250,000
300,000
350,000
400,000
SEZ Exports – main sectors breakup
Computer/Electronic softwareGems and JewelleryChemicals &Pharmaceuticals (Crude Petroleum Refinery) Other Mfg sectorsTotal Exports
2007-08 2008-09 2009-10 2010-11 2011-120
100000
200000
300000
400000
500000
600000
700000
800000
900000
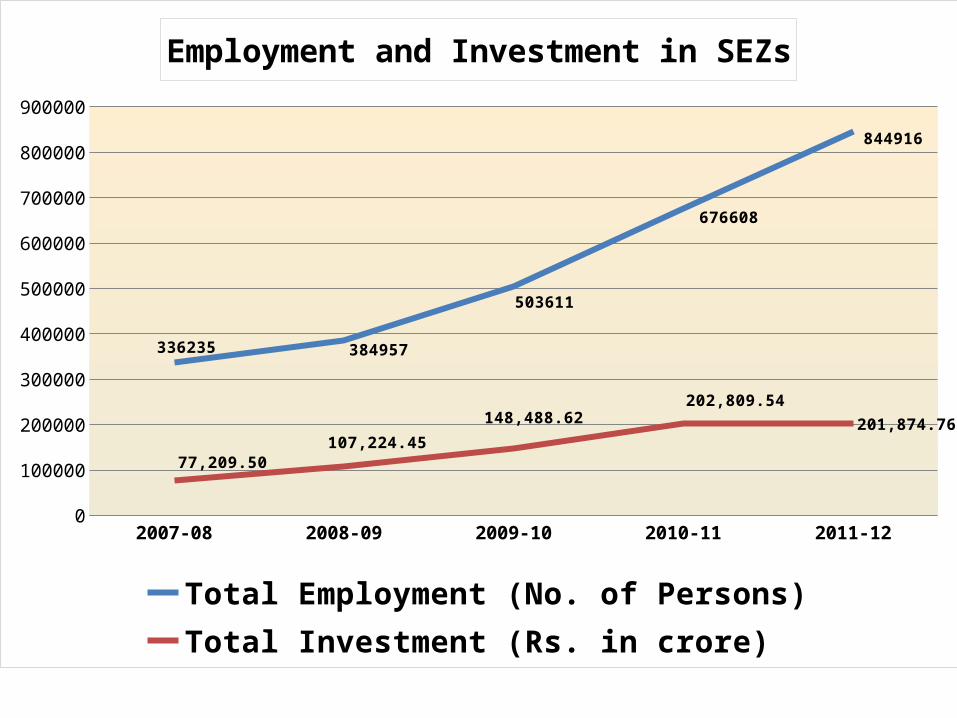
336235 384957
503611
676608
844916
77,209.50107,224.45
148,488.62202,809.54
201,874.76
Employment and Investment in SEZs
Total Employment (No. of Persons)Total Investment (Rs. in crore)

2006 2007 2008 2009 2010 20110
50,000
100,000
150,000
200,000
250,000
300,000
350,000
400,000
34,615
66,638
99,689
220,711
315,868
364,478
Total SEZ Exports (Rs. in crore)

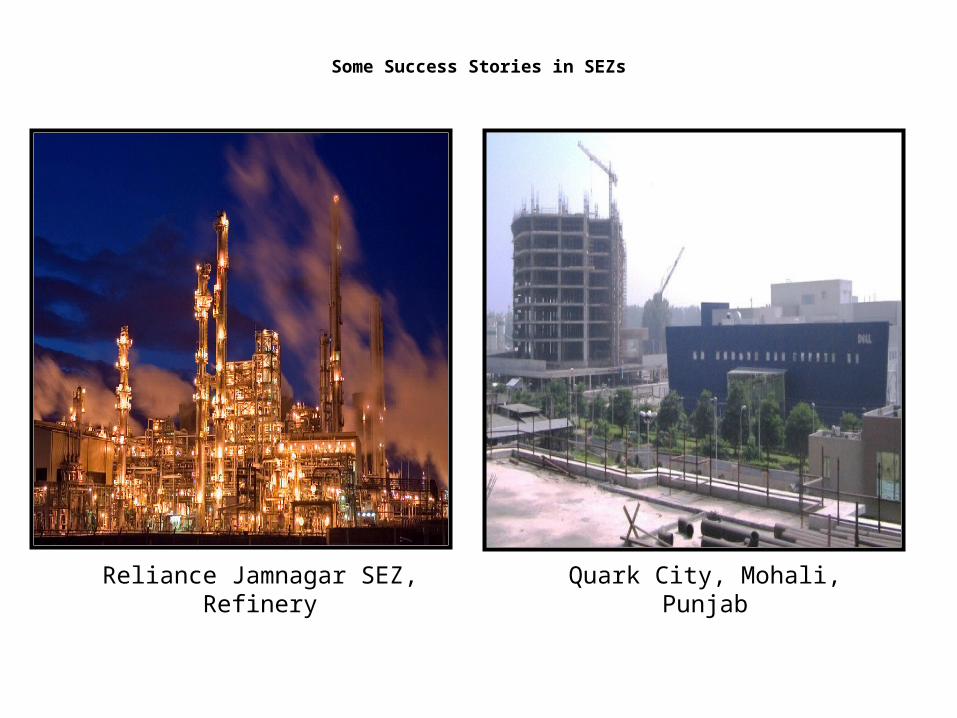
Some Success Stories in SEZs
New generation SEZs which have made significant progress in terms of Exports, Employment and Investment generation:
Nokia Special Economic Zone in Tamil Nadu (Telecom equipments SEZ)
Apache SEZ Development India Private Ltd, Andhra Pradesh (Footwear SEZ)

Some Success Stories in SEZs
Mahindra City SEZ, Tamil Nadu (Apparels and fashion accessories; IT / Hardware; auto ancillary)
Sri City, Nellore/Chitoor, Multi Product SEZ

Some Success Stories in SEZs
Brandix Apparel, SEZ, Vizag Serum Bio Pharma Park, Pune
Some Success Stories in SEZs
Reliance Jamnagar SEZ, Refinery Quark City, Mohali, Punjab

Challenges facing the SEZs
Non availability of non-double cropped, contiguous and vacant land for SEZs
Changed fiscal regime - imposition of MAT/ DDT; possible changes through DTC.
Single Window Mechanism and coordination across departments at the Central and State Government level.
Large number of States not having an SEZ Policy / Act
Slow pace of development of infrastructure within the SEZs and external support infrastructure
Non availability of incentives for SEZs under schemes such as FPS, FMS, DPEB, Duty Drawback, VKGUY etc.

SEZ Policy and Operational Framework Reform Initiative

Major Areas of Reform
1. Minimum Land Area Required For SEZ2. The Issue of Broad-banding – Revision
definition of Sector:3. Contiguity Norms:4. Vacancy Issues:5. Non-Processing Area of SEZ6. Free Trade and Warehousing Zone Issues

Major Areas of Reform
7. IT and ITES SEZs – Special Dispensation8. Exit Policy for Developers and Units:9. Advance Ruling: 10.Shifting / Relocation of Units in a SEZ :11. Operational Issues to be addressed through
amendments to the SEZ Rules:A. Towards more meaningful State Govt Recommendations (SGRs)B. Defining Consumables -allowing benefits under SEZ Policy: C. Benefits and exemptions under Rule 27 for sub-contractors of Units

sezindia.nic.in
32
Apache SEZ, Nellore Brandix SEZ, Vizag Nokia SEZ, Sriperumbudur
Mahindra World City, Chennai Quarkcity, Mohali