special education assessments tetn january 5, 2011 state and federal accountability systems update...
TRANSCRIPT

Special Education Assessments TETN
January 5, 2011
State and Federal Accountability Systems
Update
Shannon HoussonEster Regalado
TEA Performance Reporting Division

Session Topics
2
Preview of 2011 State Accountability Procedures
Preview of 2011 AEA Accountability Procedures
Update of 2011 Adequate Yearly Progress (AYP)
Update on HB 3 Implementation
Accountability Resources

Preview of 2011 Standard Accountability Procedures
and Indicators

2011 State Accountability Calendar
4
Jan - Feb Accountability System Development – 2010 Review / 2011 Development
March 3 - 4 Educator Focus Group Meeting
Late March Commissioner’s Accountability Advisory Committee
Early April Final decisions for 2011 announced by Commissioner
Late May 2011 Accountability Manual posted online
July 29 2011 Accountability Ratings release

Standard Accountability Decisions for 2011
5
2010 2011
Exemplary ≥ 90% ≥ 90%
Recognized ≥ 80% ≥ 80%
Academically Acceptable
Reading/ELA ≥ 70% ≥ 70%
Writing, Social Studies ≥ 70% ≥ 70%
Mathematics ≥ 60% ≥ 65%
Science ≥ 55% ≥ 60%
Numbers in bold indicate a change from the prior year.
TAKS Indicator

Standard Accountability Decisions for 2011 (cont.)
6
TAKS (Accommodated) 2010 2011
Science (grades 5, 8, 10, & 11, incl. gr. 5 Spanish)Social Studies (grades 8, 10, & 11)English Language Arts (grade 11)Mathematics (grade 11)
Use Use
Reading/ELA (grades 3 – 10, incl. gr. 3 – 5 Spanish)Mathematics (grades 3 – 10, incl. gr. 3 – 5 Spanish)Writing (grades 4 & 7, incl. gr. 4 Spanish)
Use Use
TAKS-Modified
All Subjects and Grades, combined w/ TAKS Report Use
TAKS-Alternate
All Subjects and Grades, combined w/ TAKS Report Use
English Language Learners (ELL) Progress
All Students Only Report Use

Standard Accountability Decisions
for 2011 (cont.)
2010 2011*
Completion Rate I
Exemplary
Recognized
Academically Acceptable
≥ 95.0%
≥ 85.0%
≥ 75.0%
≥ 95.0%
≥ 85.0%
≥ 75.0%
Gr. 7-8 Annual Dropout Rate (All categories)
≤ 1.8% ≤ 1.6%
Underreported Students (District only)150 and ≤ 4.0%
150 and ≤ 3.0%
*Numbers in bold indicate a change from the prior year.
Completion Rate I, Annual Dropout Rate, and Underreported Students
7

Standard Accountability Decisions for 2011
8
Commended Performance Indicator Requirements
In 2011, Commended Performance on TAKS reading/ELA and mathematics will be an additional indicator.
Recognized Standard. 15% commended on reading/ELA, and
15% commended on mathematics
Exemplary Standard. 25% commended on reading/ELA, and
25% commended on mathematics

Standard Accountability
Decisions for 2011
9
Commended Performance Indicator Requirements (cont.)
Student Groups. All Students (regardless of size) Economically Disadvantaged (if minimum size criteria met)
RI and Exceptions. Neither RI nor Exceptions can be used with Commended Performance to attain a higher rating.

Standard Accountability
Decisions for 2011
10
Use of Texas Projection Measure (TPM) in 2011
As stated in the July 8, 2010 letter from the commissioner to all district superintendents, proposals to be considered regarding the use of TPM in 2011 accountability include:
Suspension of the use of TPM for accountability ratings.
Continued use of TPM in state accountability, but only for districts that elect to use it.

Standard Accountability
Decisions for 2011
11
Use of Texas Projection Measure (TPM) in 2011
Modifications to the calculation of TPM and/or its use to include additional safeguards, such as:
applying performance floors, counting each student who fails but is projected to pass as a fraction of a passer, prohibiting TPM to be used for the same measure in a subsequent year, limiting the number of measures for which TPM can be used in a given year, and limiting which rating categories can use it.

English Language Learners (ELL) Progress Indicator
12
Standard Procedures for 2011
The ELL Progress indicator standard is 60%. It is evaluated only for Recognized and
Exemplary ratings. Only All Students are evaluated if meets
minimum size
of 30 students. Required Improvement (RI) and the
Exception Provision will be applied

English Language Learners (ELL) Progress Indicator
13
AEA Procedures for 2011
The ELL Progress indicator standard is 55%. Required Improvement (RI) is calculated. The All Students group is evaluated if the minimum
size requirement is met. The ELL Progress indicator cannot be the sole reason
for an AEA: Academically Unacceptable rating.

English Language Learners (ELL) Progress
Indicator
14
2011 Preview of ELL Progress Indicator shown on 2009-10 AEIS Reports.
Campus column correlates to ‘All Students’ data to be evaluated if minimum size criteria are met (30 students).
For further information, the ELL Progress Indicator FAQ and Appendix H
of the 2009-10 AEIS Glossary are available online at the Resource link on the Performance Reporting website.
http://ritter.tea.state.tx.us/perfreport/resources/index.html

Preview of 2011 AEA Procedures and Indicators

TAKS Progress Indicator
16
The TAKS Progress indicator standard increases from 50% to 55%.
TAKS-Modified and TAKS-Alternate results are combined with TAKS and TAKS (Accommodated) results to determine AEA ratings.
The TAKS Progress indicator sums performance results across grades (3-12) and subjects to determine ratings under AEA procedures.
This indicator is based on the number of tests taken, not on the number of students tested.

Completion Rate II and Annual Dropout Rate
(Grades 7-12) Standards
17
The Annual Dropout Rate indicator standard remains 20.0%.
The Completion Rate II indicator standard remains 60.0%.

Update on 2011 Adequate Yearly Progress (AYP)

19
2011 Preview 2011 AYP performance standards increase to:
80% in Reading/English language arts
75% in Mathematics
Graduate Rate annual targets may not change;Participation/Attendance Rate Indicator standards remain unchanged.
Texas Projection Measure (TPM) will continue to be used; TPM for TAKS-Modified (TAKS-M) grades 3 and 6 will be phased in.
The 2% Federal Cap on TAKS-Modified (TAKS-M) will continue to include TAKS-M TPM values projected to meet the passing standard.
19
20
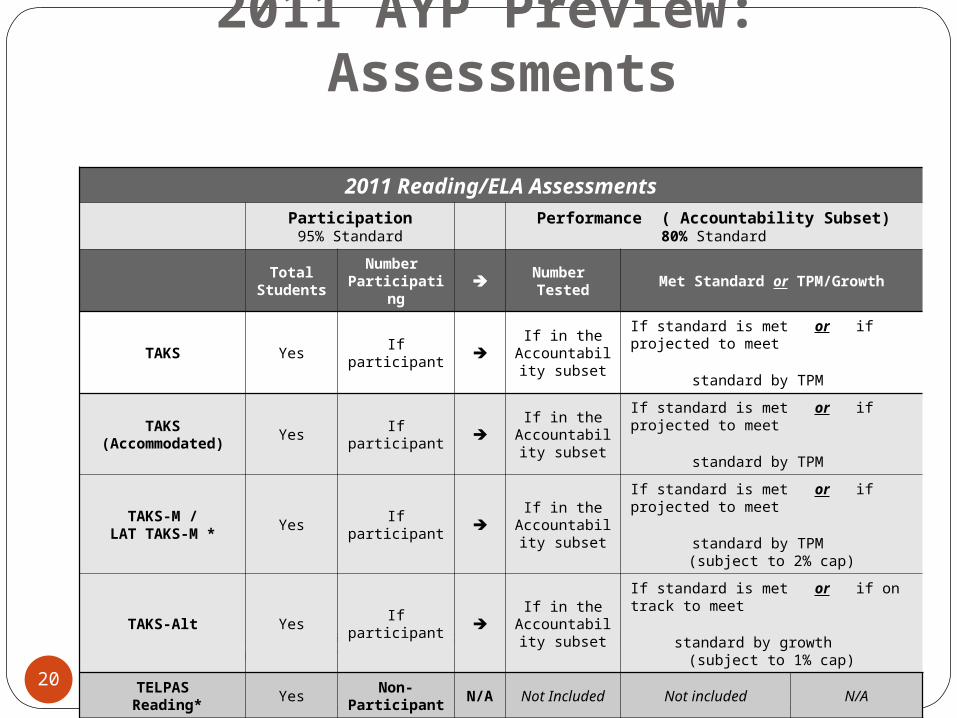
2011 AYP Preview: Assessments
* Students in their First Year in U. S. Schools are counted as participants, but excluded from the performance calculation.
2011 Reading/ELA Assessments
Participation95% Standard
Performance ( Accountability Subset)80% Standard
Total Students
Number Participating
Number Tested
Met Standard or TPM/Growth
TAKS Yes If participant If in the
Accountability subset
If standard is met or if projected to meet standard by TPM
TAKS(Accommodated)
Yes If participant If in the
Accountability subset
If standard is met or if projected to meet standard by TPM
TAKS-M /LAT TAKS-M *
Yes If participant If in the
Accountability subset
If standard is met or if projected to meet standard by TPM
(subject to 2% cap)
TAKS-Alt Yes If participant If in the
Accountability subset
If standard is met or if on track to meet standard by growth
(subject to 1% cap)
TELPAS Reading*
YesNon-
ParticipantN/A Not Included Not included N/A
LAT version of TAKS*
Yes If participant If in the
Accountability subset
If standard is met or if projected to meet standard by TPM
20

21
2011 AYP Preview: Assessments (cont.)
* Students in their First Year in U.S. Schools are counted as participants, but excluded from the performance calculation.
2011 Mathematics AssessmentsParticipation95% Standard
Performance (Accountability Subset)75% Standard
Total Students
Number Participating
Number Tested
Met Standard or TPM/Growth
TAKS Yes If participant If in the
Accountability subset
If standard is met or if projected to meet standard by TPM
TAKS(Accommodated)
Yes If participant If in the
Accountability subset
If standard is met or if projected to meet standard by TPM
TAKS-M /LAT TAKS-M *
Yes If participant If in the
Accountability subset
If standard is met or if projected to meet standard by TPM
(subject to 2% cap)
TAKS-Alt Yes If participant If in the
Accountability subset
If standard is met or if on track to meet standard by growth
(subject to 1% cap)
LAT version of TAKS*
Yes If participant If in the
Accountability subset
If standard is met or if projected to meet standard by TPM
21

Texas AYP Workbook
22
On January 15, 2010, TEA submitted a Graduation Rate information template for peer review containing proposed changes in the AYP graduation rate calculations, as required by the U.S. Department of Education.
On October 29, 2010, the U.S. Department of Education (USDE) provided final decisions in response to Texas workbook amendments http://ritter.tea.state.tx.us/ayp/usde102910.pdf.
On November 15, 2010, the Title I Committee of Practitioners (COP) reviewed the recommended changes to the 2011 AYP Workbook.
TEA submitted 2011 amendment requests on December 21, 2010.
22

23
2011 Texas AYP Workbook
Requested Amendments to 2011 AYP
Phase-in for the TAKS–M projection equations (TPM)
TPM projections are expected to be reported for TAKS–M reading and mathematics tests in school year 2010-2011 for grades 3 and 6.
The 2011 Federal Cap process will remain the same as 2010 AYP, with the addition of the TAKS-M TPM for grades 3 and 6.
Graduation Rate Annual Target
Request to hold the 2010 graduation rate targets constant for 2011 and 2012 AYP, since student group evaluations are required beginning in 2012.23

24
2012 Texas AYP Workbook
Requested Amendments for 2012 AYP and Beyond
Carry forward 2011 AYP status for all campuses and districts and maintain School Improvement Program (SIP) intervention stages.
TEA will submit a larger proposal for AYP determinations for 2013 and beyond under the new STAAR assessment program.
24

Update on HB 3 Implementation

HB 3 Implementation
26
House Bill 3 Transition Plan
Posted online on Wednesday, December 1 at the following URL:
http://www.tea.state.tx.us/student.assessment/hb3plan/

HB 3 Implementation
27
Transition Plan Timelines through 2013
December 1, 2010 Transition plan to the new assessment and accountability/accreditation system is submitted to the governor, lieutenant governor, other key legislative members and staff, and the Legislative Budget Board (LBB).
By August 1, 2011 2011 ratings are the last ratings issued under the current accountability system.
2011-2012 Assignment of performance ratings are suspended for this school year.
New academic accountability system is developed with input from advisory groups on the timelines specified in the transition plan.

HB 3 Transition Plan
28
August 8, 2013 District and campus performance ratings are issued for the first time under new system. Ratings will be based on the percent proficient indicators. The percent college-ready indicators will be “report” only.
Distinction designations will be issued to districts and campuses with acceptable performance concurrent with the release of performance ratings.
Performance ratings issued in 2010-2011 and 2012-2013 school years will be considered consecutive.

HB 3 Implementation
29
Transition Plans for 2014
August 8, 2014 District and campus performance ratings will be issued for second time. Ratings will be based on both percent proficient and percent college-ready indicators.
Distinction designations will be issued to districts and campuses with acceptable performance concurrent with the release of performance ratings.

Features of the New Accountability System
30
Based on STAAR EOC and grades 3 – 8 assessments
Evaluation of college-ready performance as well as student proficiency
2020 accountability goals: Top 10 states in terms of college readiness No significant achievement gaps among
student groups

Features of the New Accountability System
31
Graduation/completion/dropout rates with new exclusions
Two rating levels – acceptable and unacceptable performance
Distinction designations Higher ratings of Recognized and Exemplary for
postsecondary/college readiness Campus growth Campus closing performance gaps Five additional campus distinctions determined by committees

Features of the New Accountability System
32
The following additional features can be used to elevate the performance rating:
Required Improvement over the prior year;
Average performance of the last 3 years; or,
Performance on 85% of the measures meets the standard.

Campus Distinction Designations
33
Campus distinction on criteria developed by five committees for: Academic achievement in ELA, mathematics,
science, or social studies Fine arts Physical education 21st century workforce development program Second language acquisition program

Campus Distinction Designations
34
Timelines January 2011- Selection of distinction committee members finalized
2011- 2012 - Four separate meetings of each distinction committee will occur. Internal and external reviews of distinction designation committee recommendations will also occur.
May 2012 - Release of Commissioner’s Final Decisions on Distinction Designations
2012-2013 - Collection of data
June 2013 - Determination of list of campuses that earned distinction designations.
August 2013 - Release of distinction designations.

State Accountability Resources
35
ESC Accountability Staff Division of Performance Reporting
Phone: (512) 463-9704Email: [email protected]
AEA http://ritter.tea.state.tx.us/aea
Accountabilityhttp://ritter.tea.state.tx.us/perfreport/account/
Accountability Resources http://ritter.tea.state.tx.us/perfreport/resources/index.html

36
AYP Resources SIP History Website
Districts and campuses can view their Title I School Improvement Program (SIP) status history reports from 2003 through the present. See the AYP Guide for the appropriate year for descriptions of any of the AYP or SIP status labels shown. The SIP history reports are accessible at http://ritter.tea.state.tx.us/ayp/index_multi.html.
TEA Security Environment (TEASE) Accountability Website access forms are available at: http://ritter.tea.state.tx.us/webappaccess/AppRef.htm
36

37
AYP Resources (cont.)
For more information on AYP, see the 2010 AYP Guide, accessible at http://ritter.tea.state.tx.us/ayp.
2010 Texas AYP Workbook is accessible at http://ritter.tea.state.tx.us/ayp/txworkbook10.pdf.
Frequently Asked Questions about AYP are available at http://ritter.tea.state.tx.us/ayp/faq/faq.html.
U.S. Department of Education information is available at www.ed.gov/nclb/.
Contact the Division of Performance Reporting by email at [email protected], or phone at (512) 463-9704.
37